MAAP #49: New Frontiers of Gold Mining in the Peruvian Amazon

maap_amazonas_mineria_1_v3_beta_en
Imagen 49a. Peru’s gold mining frontiers.

In a series of articles, we have previously detailed the progress of gold mining deforestation in the southern Peruvian Amazon (mainly in the Madre de Dios region).

In the current report, we show the new gold mining frontiers in northern and central Peru (Image 49a): two cases in the region of Amazonas and a case in the buffer zone of El Sira Communal Reserve, in the Huanuco region.

Deforestation in these cases is still in its early stages, so there is still time to avoid larger-scale damage, as in the case of Madre de Dios.


Amazonas Region

In the Amazonas region, there are two cases of recently active gold mining deforestation: the Afrodita project in the Cóndor mountain range (Inset A) and along the Santiago River (Inset B) (Image 49b).

maap_amazonas_mineria_1_v2_en
Image 49b. Data: SERNANP

Amazonas: Condor Mountain Range

The remote Condor Mountain Range, located along the Peru-Ecuador border, is home to rich biodiversity and territories of the Awajún and Wampís indigenous peoples. The mining concession Afrodita, on the Peruvian side, has been controversial due to the potential environmental and social impacts of mining activity in a sensitive environment. Image 49c shows the beginning of deforestation within the Afrodita concession, between December 2015 (left panel) and July 2016 (right panel). Thus far, deforestation within the concession is 12 hectares (30 acres), including the access road from Ecuador.

maap_amazona_mineria_a_v1_en
Image 49c. Data: Planet. Click to enlarge.

Amazonas: Santiago River

In the previous MAAP #36, we showed the first evidence of gold mining deforestation along the Santiago River. Image 49d shows a comparison between the situation last shown by MAAP in March 2016 (left panel), and its current state in October 2016 (right panel). To date, this deforestation has reached 10 hectares (25 acres). Importantly, in September, the Peruvian Navy intervened in the area (known as the Pastazio tributary), destroying some dredges and other equipment.

maap_amazona_mineria_b_v2_en
Image 49d. Data: Planet. Click to enlarge.

El Sira Communal Reserve

In the previous MAAP #45, we showed illegal gold mining within the El Sira Communal Reserve. Here, we highlight a new active gold mining area in the buffer zone of the reserve (Image 49e). Image 49f shows the appearance of a new mining area between August 2015 (left panel) and August 2016 (right panel). To date, the mining deforestation at this site has reached 10 hectares (25 acres).

esira_mineria_1_v3_en
Image 49e. Data: SERNANP
esira_mineria_2_m_v1_en
Image 49f. Data: Digital Globe (Nextview). Click to enlarge.

Citation

Novoa S, Finer M (2016) New Frontiers of Gold Mining in the Peruvian Amazon. MAAP: 49

MAAP #46: Gold Mining Deforestation Within Tambopata National Reserve Exceeds 450 Hectares

In previous articles, we documented the illegal gold mining invasion of Tambopata National Reserve (Madre de Dios region in the southern Peruvian Amazon) in November 2015 and the subsequent deforestation of 350 hectares as of July 2016. Here, we report that the mining deforestation in the Reserve now exceeds 450 hectares (1,110 acres) as of September 2016. Image 46a illustrates the extent of the invasion, with red indicating the most recent deforestation fronts. Insets A-D indicate the location of the high-resolution zooms below.

Imagen 46a. Datos: Planet, SERNANP, MAAP
Image 46a. Data: Planet, SERNANP, MAAP

High Resolution Zooms

Images 45b-e show, in high-resolution, the recent deforestation within Tambopata National Reserve between July (left panel) and September (right panel) 2016. These areas correspond to Insets A-D. The red circles indicate the primary areas of new deforestation between these dates. Click on images to enlarge.

Imagen 45b. Datos: Planet, SERNANP
Image 45b. Data: Planet, SERNANP
Imagen 45c. Datos: Planet, SERNANP
Image 45c. Data: Planet, SERNANP
Imagen 45d. Datos: Planet, SERNANP
Image 45d. Data: Planet, SERNANP
Imagen 45e. Datos: Planet, SERNANP
Image 45e. Data: Planet, SERNANP

Citation

Finer M, Olexy T, Novoa S (2016) Gold Mining Deforestation Within Tambopata National Reserve Exceeds 450 Hectares. MAAP: #46

MAAP #44: Potential Recuperation of Illegal Gold Mining area in Amarakaeri Communal Reserve

In the previous MAAP #6, published in June 2015, we documented the deforestation of 11 hectares in the Amarakaeri Communal Reserve due to a recent illegal gold mining invasion. The Reserve, located in the Madre de Dios region of the southern Peruvian Amazon, is an important protected area that is co-managed by indigenous communities and Peru’s National Protected Areas Service (known as SERNANP). In the following weeks, the Peruvian government, led by SERNANP, cracked down on the illegal mining activities and effectively halted the deforestation within that part of the Reserve.

Here, we present high-resolution satellite images that show an initial vegetation regrowth in the invaded area. This finding may represent good news regarding the Amazon’s resilience to recover from destructive mining if it is stopped at an early stage. However, many questions and caveats remain regarding the nature of the regrowth and the long-term recovery potential of the degraded land, please see the Additional Information section below for more details.

Image 44a shows the base map of the area invaded by illegal gold mining in the southeast sector of Amarakaeri Communal Reserve. Insets A–D indicate the areas featured in the high-resolution zooms below.

Image 44a. Data: Digital Globe (Nextview), SERNANP

High-Resolution Zooms

Images 44b-e show, in high-resolution, areas where we detected vegetation regrowth between September 2015 (left panel) and August 2016 (right panel) following the gold mining invasion.

Image 44b. Data: Digital Globe (Nextview)
Image 44c. Data: Digital Globe (Nextview)
Image 44d. Data: Digital Globe (Nextview)
Image 44e. Data: Digital Globe (Nextview)

Additional Information

The natural vegetation regrowth observed in the images is not totally unexpected considering the area’s high biological diversity, the presence of nearby primary forest, and the relatively small area invaded prior to the government intervention. However, it’s important to consider that the regrowth has occurred mainly on the mounds of soil that were left behind by the mining activity. The regrowth is not yet evident in the other mining areas where the soil alteration was more severe. Further investigation is needed to better understand the characteristics of the regrowth and explore the true restoration potential of the area. Extreme degradation and mercury contamination left behind by mining activities may prevent many species from returning, allowing only the establishment of a few hardy colonizing specialist species.

Citation

Novoa S, Finer M, Román F (2016) Regeneration of Vegetation in Zone Affected by Gold Mining in the Amarakaeri Communal Reserve. MAAP: 44.

MAAP #43: Early Warning Deforestation Alerts in the Peruvian Amazon, Part 2

In the previous MAAP #40, we emphasized the power of combining early warning forest loss GLAD alerts with analysis of high-resolution satellite imagery as part of a comprehensive near real-time deforestation monitoring system for the Peruvian Amazon.

In the current MAAP, we present 3 new examples of this system across different regions of Peru. Click on the images below to enlarge.

Example 1: Illegal Gold Mining in buffer zone of Bahuaja Sonene National Park (Madre de Dios)
Example 2: Logging Road in buffer zone of Cordillera Azul National Park (Ucayali/Loreto)
Example 3: Deforestation in Permanent Production Forest (Ucayali)

Example 1: Illegal Gold Mining in buffer zone of Bahuaja Sonene National Park (Madre de Dios)

In the previous MAAP #5, we discussed illegal gold mining deforestation along the upper Malinowski River, located in the buffer zone of the Bahuaja Sonene National Park. As seen in Image 43a, the upper Malinowski is just upstream of the areas invaded by illegal gold mining in Tambopata National Reserve and its buffer zone (see MAAP #39 and #31, respectively). In MAAP #5, we documented the deforestation of more than 850 hectares between 2013 and 2015 along the upper Malinowski. Here, we show that gold mining deforestation continues in 2016, with an additional loss of 238 hectares (806 acres). Insets A-C correspond to the areas featured in the high-resolution zooms below.

Image 43a. Data: UMD/GLAD, Hansen/UMD/Google/USGS/NASA, NASA/USGS, SERNANP

The following Images 43b-d show, in high-resolution, the rapid expansion of gold mining deforestation between August/September 2015 (left panel) and July/August 2016 (right panel). The yellow circles indicate the main areas of deforestation between the images.

Imagen 43b. Datos: Planet, Digital Globe (Nextview)
Image 43b. Data: Planet, Digital Globe (Nextview)
Imagen 43c. Datos: Planet, Digital Globe (Nextview)
Image 43c. Data: Planet, Digital Globe (Nextview)
Imagen 43d. Datos: Planet, Digital Globe (Nextview)
Image 43d. Data: Planet, Digital Globe (Nextview)

Example 2: Logging Road in buffer zone of Cordillera Azul National Park (Ucayali/Loreto)

In the previous MAAP #18, we discussed the proliferation of logging roads in the central Peruvian Amazon in 2015. Here, we show the expansion of two of these logging roads in 2016. (see Image 43e). Red indicates construction during 2016 (47 km). Insets A1-A3 correspond to the areas featured in the high-resolution zooms below. Note that the northern road (Inset A3) is within the buffer zone of Cordillera Azul National Park. Evidence suggests that this road is not legal because it extends out of the permited area (see MAAP #18 for more details).

Imagen 43e. Datos: UMD/GLAD, Hansen/UMD/Google/USGS/NASA, SERNANP
Image 43e. Data: UMD/GLAD, Hansen/UMD/Google/USGS/NASA, SERNANP

The following images show, in high-resolution, the rapid construction of these logging roads. Image 43f shows the construction of part of the southern road (Inset A1), and the deforestation for a nearby agricultural parcel, between April (left panel) and July (right panel) 2016. Image 43g shows the construction of 1.8 km in just three days along this same road (Inset A2) between July 21 (left panel) and July 24 (right panel) 2016.

Imagen 43f. Datos: Planet
Image 43f. Data: Planet
Imagen 43g. Datos: Planet
Image 43g. Data: Planet

Image 43h shows the construction of 13 km on the northern road between November 2015 (left panel) and July 2016 (right panel) within the buffer zone of the Cordillera Azul National Park.

Imagen 43h. Datos: Planet
Image 43h. Data: Planet

Example 3: Deforestation in Permanent Production Forest  (Ucayali)

Image 43i shows recent deforestation of 136 hectares (336 acres) in 2016 in southern Ucayali region within areas classified as Permanent Production Forest and Foresty Concession. These types of areas are generally zoned for sustainable forestry uses, not clear-cutting, thus we question the legality of the deforestation. Tables A-B correspond to the areas featured in the high-resolution zooms, below.

Imagen 43i. Datos: UMD/GLAD, Hansen/UMD/Google/USGS/NASA, MINAGRI
Image 43i. Data: UMD/GLAD, Hansen/UMD/Google/USGS/NASA, MINAGRI

Image 43j shows deforestation within a section of Permanent Production Forest, and Image 43k shows deforestation within a section of Forestry Concession.

Imagen 43j. Datos: Planet
Image 43j. Data: Planet
Imagen 43k. Datos: Planet
Image 43k. Data: Planet

Citation

Finer M, Novoa S, Goldthwait E (2016) Early Warning Deforestation Alerts in the Peruvian Amazon, Part 2. MAAP: 43.

MAAP #39: Gold Mining Deforestation Within Tambopata National Reserve Exceeds 350 Hectares

Based on analysis of satellite imagery, we have documented that the deforestation due to illegal gold mining activities within Tambopata National Reserve (Madre de Dios region) now exceeds 350 hectares (872 acres) since the initial invasion in late 2015 (see Image 39a). Although the rate of deforestation has decreased since April, when the Peruvian government installed a permanent control post* in the area, it is clear that the deforestation continues to expand.  In the Image, we highlighted the most recent deforestation (June and July 2016) in red to emphasize the current fronts. Insets A and B indicate the areas detailed in the zooms below.

*A recent article in the New York Times highlighted the extreme difficulty faced by the Peruvian government in cracking down on the illegal mining. Yesterday, the leading Peruvian newspaper El Comercio reported that the control post has been abandoned due to lack of resources.

Image 39a. Data: Planet, SERNANP, MAAP

Zoom A

In the following images, we show high-resolution examples of the recent deforestation within the reserve. Image 39b shows the deforestation that occurred between May 30 (left panel) and June 20 (right panel), 2016 in the area indicated by Inset A. The red circles indicate primary zones of new deforestation between these dates.

Image 39b. Data: Planet, SERNANP

Zoom B

Image 39c shows the deforestation between May 3 (left panel) and July 21 (right panel), 2016 in the area indicated by Inset B. The red circles indicate primary areas of new deforestation between these dates.

Image 39c. Data: Digital Globe (Nextview), SERNANP

Citation

Novoa S, Finer M, Olexy T (2016) Gold Mining Deforestation within Tambopata National Reserve exceeds 350 Hectares. MAAP: #39

MAAP #36: New Gold Mining Frontier in the Northern Peruvian Amazon

In several previous MAAP articles, we have detailed gold mining deforestation in the southern Peruvian Amazon. Here, we provide evidence of the first known case of gold mining deforestation in northern Peru.

A recent news article published by the Peruvian organization DAR reported that gold mining activity continues to increase in the Santiago River (see Image 36a), located in the Amazonas region of the northern Peruvian Amazon. The article also mentions that this gold mining activity is no longer restricted to the river, but is now entering the forest. There are mining concessions in the area, but according to a recent article published in The Guardian, the miners are not operating legally with permission from the concessionaire.

Here, we show the first satellite images that confirm that the mining activity is indeed causing deforestation along the Santiago River (see below). Click each image to enlarge.

Imagen Xa. Crédito: DAR
Image 36a. Credit: DAR, April 2016

Satellite Images of Gold Mining Deforestation in Northern Peru

Image 36b shows a high-resolution image of the newly deforested area due to mining activity along the Santiago River (see yellow circle). The total forest loss to date is 8 hectares (20 acres).

Imagen Xa. Datos: Planet Labs
Image 36b. Data: Planet Labs

Image 36c shows that the deforestation occurred between August 2014 (left panel) and August 2015 (right panel).

Image 35c. Data: USGS/NASA
Image 36c. Data: USGS/NASA

Citation

Finer M, Novoa S (2016) Gold Mining Deforestation in the Northern Peruvian Amazon. MAAP: 36.

MAAP #33: Illegal Gold Mining Alters Course of Malinowski River (border of Tambopata National Reserve)

In MAAP #30, we described the illegal gold mining invasion of Tambopata National Reserve, an important protected area in the southern Peruvian Amazon (department of Madre de Dios). Here in MAAP #33, we show that illegal gold mining is also altering the course of the Malinowski River, which forms the natural boundary of the Reserve. Image 33a shows the two areas where we have documented a total artificial deviation (cutting) of 4.4 km (2.7 miles) of the river (see details below).

Image 33a. Data: Planet Labs, SERNANP

Zoom A: A Recent Deviation of the Malinowski River

Image 33b shows the final stage of the deviation of the Malinowski River between March 31 (left panel) and May 3 (right panel) of this year in the area indicated by Inset A in Image 33a. The new flow of the river is clearly seen in the right panel, cutting a 1.7 km stretch of the previous course.

Image 33b. Data: Planet Labs, Digital Globe (Nextview)

Image 33c shows with greater precision how the Malinowski river was diverted in this area between April and May 2016. The red arrow indicates the exact same place across time in the three images.

Image 33c. Data: Digital Globe (Nextview)

Zoom B: An Earlier Deviation of the Malinowski River

In February 2016, Peruvian specialists presented how mining activity had recently changed the natural course of the Malinowski river in the area indicated in Inset B*. Image 33d shows the progressive change: from the increase in mining activity along the normal course of the river in June 2013 (left panel), to the new stretch of riverbed in June 2015 (center panel), and finally to the expansion of mining activity along the previous course (right panel). The red dot indicates the same place over time in the three images. A total of 2.7 km was cut from the previous river course.

Image 33d. Data: Digital Globe (Nextview), Planet Labs

Ecological Impacts

According to Dr. Carlos Cañas**, coordinator of the Amazon Waters Initiative for Wildlife Conservation Society in Peru, the deviation of the natural course of the Malinowski River will have significant ecological impacts, including:

  • Although the Malinowski River’s course has natural movement, the changes documented in MAAP #33 definitely represent an artificial alteration caused by mining activity.
  • These artificial changes are altering the course of the Malinowski from one that is “narrow and defined” to one that is “wide and scattered.” This change impacts the river’s flood patterns by changing the intensity, timing, and frequency of flooding along the river’s banks. This implies an effect on the migratory behavior of many species of fish downstream, which receive and interpret signals from the river to guide vital functions like feeding and reproduction.
  • The river’s new wider course also causes the velocity of water downstream to decrease, which will lead to increased levels of sediment in the discharge zone of the largest tributary, the Tambopata. Given the nature of the Tambopata, this could provide the almost-permanent damming of the Malinowski, as greater volume of the Tambopata means more sedimentation at the mouth of the river. Among other things, this could hinder the entry of fish to their feeding zones.
  • As seen in Image 33d, fish access to certain areas will be interrupted by the blockade and closure of channels. Also, the connection between the floodable forest and the river channel is completely altered, if not interrupted, in this section of the river. Many fish species that eat fruit or vegetation from the adjacent forest depend on this seasonal connection for food.
  • The Malinowski River, since it is a tributary of the Tambopata River, has natural áreas that are crucial to the reproduction of many local species. Its tributary streams represent habitats that differ from the main river and harbor an incredible variety of fish and invertebrates that contribute to the biodiversity of the river basin. These streams have little sediment, and are thus highly transparent. Mining will destroy or drastically alter these environments, severely impacting this biodiversity.

Referencias

*Villa L., Campos L. G., Pino I. M. (01 de febrero de 2016). Primer Sistema de Alerta Temprana de Geoinformación (SAT-GI) para Áreas Naturales Protegidas del Perú: Reserva Nacional Tambopata y el Ámbito de Madre de Dios del Parque Nacional Bahuaja Sonene. Reporte Nº 001-2016.

** Cañas CM, Waylen PR (2011) Modelling production of migratory catfish larvae (Pimelodidae) on the basis of regional hydroclimatology features of the Madre de Dios Basin in southeastern Peru. Hydrol. Process. DOI: 10.1002/hyp.8192.

**Cañas CM, Pine WE (2011) DOCUMENTATION OF THE TEMPORAL AND SPATIAL PATTERNS OF PIMELODIDAE CATFISH SPAWNING AND LARVAE DISPERSION IN THE MADRE DE DIOS RIVER
(PERU): INSIGHTS FOR CONSERVATION IN THE ANDEAN-AMAZON HEADWATERS. River Res. Applic. 27: 602–611.

Citation

Finer M, Novoa S (2016)  Illegal Gold Mining Alters the Course of the Malinowski River (border of Tambopata National Reserve). MAAP: 33.

MAAP #31: Deforestation Continues Expansion in La Pampa (buffer zone of Tambopata National Reserve)

Illegal gold mining deforestation continues to expand in La Pampa, an area located in the buffer zone of Tambopata National Reserve in the Madre de Dios region. Here, we present a series of high-resolution (0.5 m) images that clearly illustrate this expansion. Image 31a shows the large, expanding mass of deforestation in La Pampa (as of November 2015) in relation to the Tambopata National Reserve and its buffer zone. Insets A and B indicate the high-resolution zoom areas, where further below we show the rapid deforestation of 76 hectares (188 acres) between November 2015 and April 2016.

Capture_main
Image 31a. Data: WorldView-2 of Digital Globe (NextView).

Zoom A: Rapid Advance of Deforestation

Image 31b shows the expansion of deforestation (28 hectares) between November 2015 (left panel) and April 2016 (right panel) in the eastern section of La Pampa. The red dot indicates the exact same point in both images across time.

DGapril_ZoomA_english_v2
Image 31b. Data: WorldView-2 of Digital Globe (NextView).

Zoom B: Formation of a Large Camp

Image 31c shows the formation of a large mining camp between November 2015 (left panel) and April 2016 (right panel) in the eastern section La Pampa. The red dot indicates the exact same point in both images across time. The image also shows the deforestation of 48 hectares around the camp.

DGapril_ZoomB_english_v2
Image 31c. Data: WorldView-2 of Digital Globe (NextView).

Citation

Finer M, Olexy T (2016) Deforestation Continues Expansion in La Pampa (buffer zone of Tambopata National Reserve). MAAP: 31.


MAAP #30: Gold Mining Invasion of Tambopata National Reserve Intensifies

As described previously in MAAP #21, the illegal gold mining invasion of the Tambopata National Reserve began in late 2015. Here in  MAAP #30, we confirm that this invasion continues to intensify in 2016.

Image 30a shows the invasion zone, where we document that the illegal mining is advancing on seven fronts within the northwest section of the reserve and has thus far directly caused the deforestation of 130 hectares (320 acres) since September 2015. Below, we show high-resolution zooms of fronts 1-5 (Inset A) and a major mining camp recently established just outside of the Reserve (Inset B).

Imagen 30a. Datos: Planet Labs, SERNANP
Image 30a. Data: Planet Labs, SERNANP

Invasion of Tambopata: Fronts 1-5

Image 30b shows the rapid expansion of deforestation in 5 of the fronts inside the Reserve between the end of January (left panel) and March (right panel) of 2016. This image corresponds to Inset A in Image 30a. Further below, Images 30c and 30d show high-resolution zooms of these 5 fronts.

Image 30b. Data: Planet Labs, SERNANP

Zoom of Fronts 1 & 2

Image 30c shows a zoom of deforestation fronts 1 and 2 between January (left panel) and March (right panel) of 2016.

Image 30c. Data: Planet Labs, SERNANP

Zoom of Fronts 3, 4, & 5

Image 30d shows a zoom of fronts 3, 4, and 5 between January (left panel) and March (right panel) of 2016.

Image 30d. Data: Planet Labs, SERNANP

Major Mining Camp Adjacent to Tambopata Reserve

Image 30e shows, in high-resolution, the establishment of a major mining camp in front of the invaded section of the Reserve (and within the Reserve’s official buffer zone). This Image corresponds to Inset B in Image 30a.

Image 30e. Data: WorldView-2 de Digital Globe (NextView).

Using Radar to Confirm Invasion Continues

In early 2016, the Peruvian government led two major interventions (on January 21 and February 23, respectively) against the illegal miners operating in the interior of the Reserve. However, Image 30f shows in red the continued advance of deforestation (44 hectares) between March 1 (left panel) and March 25 (right panel). In other words, using radar technology (which can pierce through cloud-cover) we can confirm that deforestation continued to advance after the government interventions.

Imagen Xd. Datos: Sentinel-1, SERNANP
Image 30f. Data: Sentinel-1, SERNANP

Finer M, Novoa S, Olexy T (2016) Invasion of Tambopata National Reserve Intensifies. MAAP: 30.

MAAP #25: Deforestation Hotspots in the Peruvian Amazon, 2012-2014

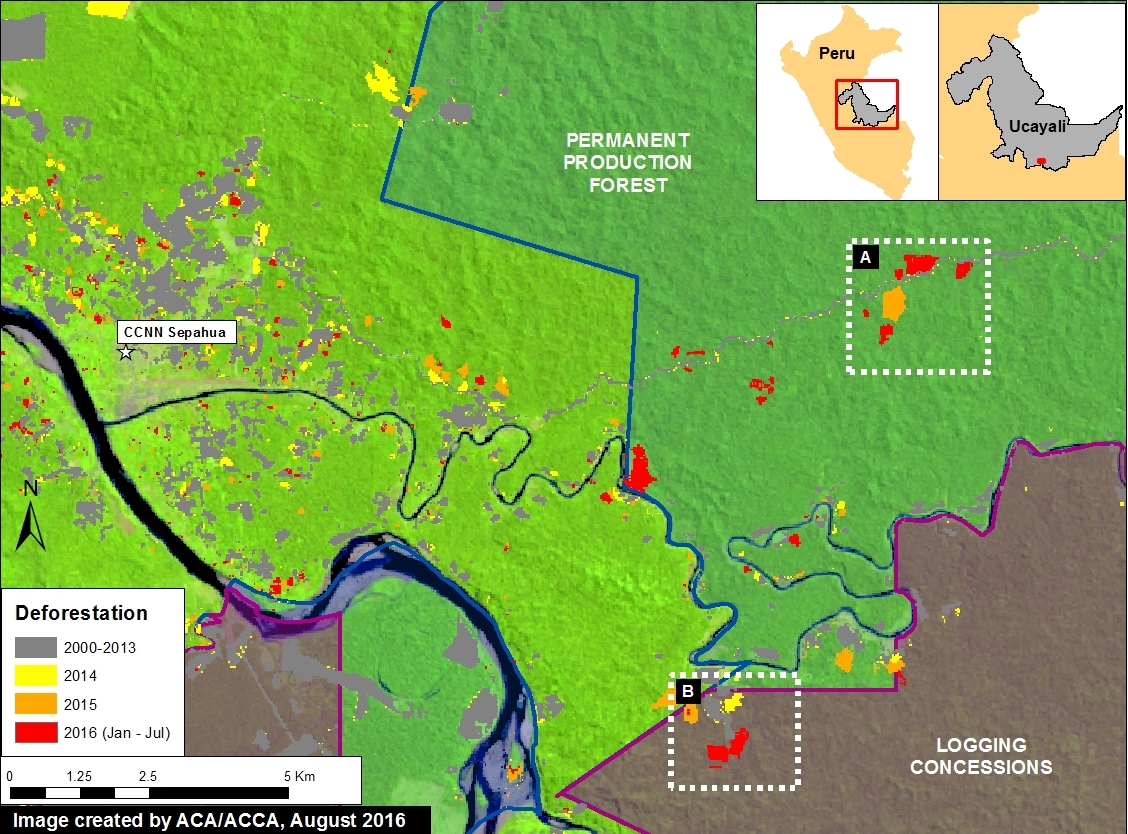
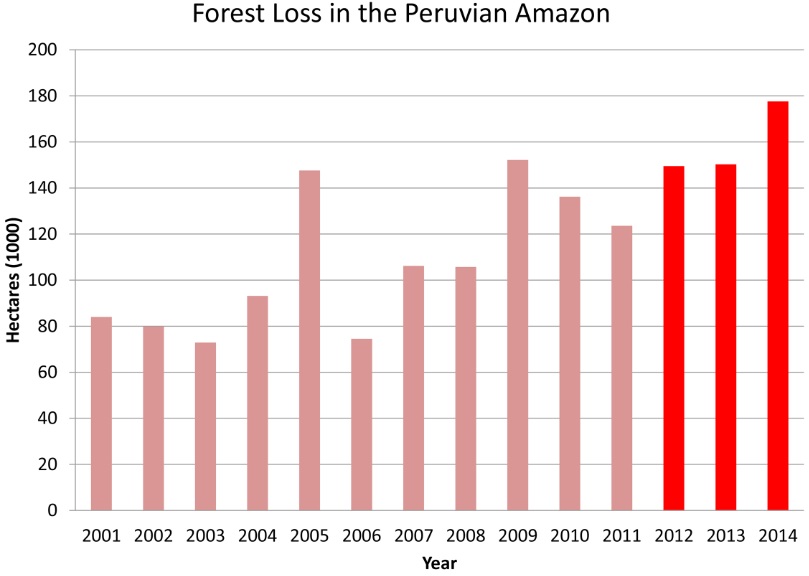
Deforestation continues to increase in the Peruvian Amazon. According to the latest information from the Peruvian Environment Ministry1, 2014 had the highest annual forest loss on record since 2000 (177,500 hectares, or 438,600 acres per year). 2013 and 2012 had the third and fourth-highest annual forest loss totals, respectively (behind only 2009).

Source: PNCB/MINAM
Source: PNCB/MINAM

To better understand where this deforestation is concentrated, we conducted kernel density estimation. This type of analysis calculates the magnitude per unit area of a particular phenomenon (in this case, forest loss).

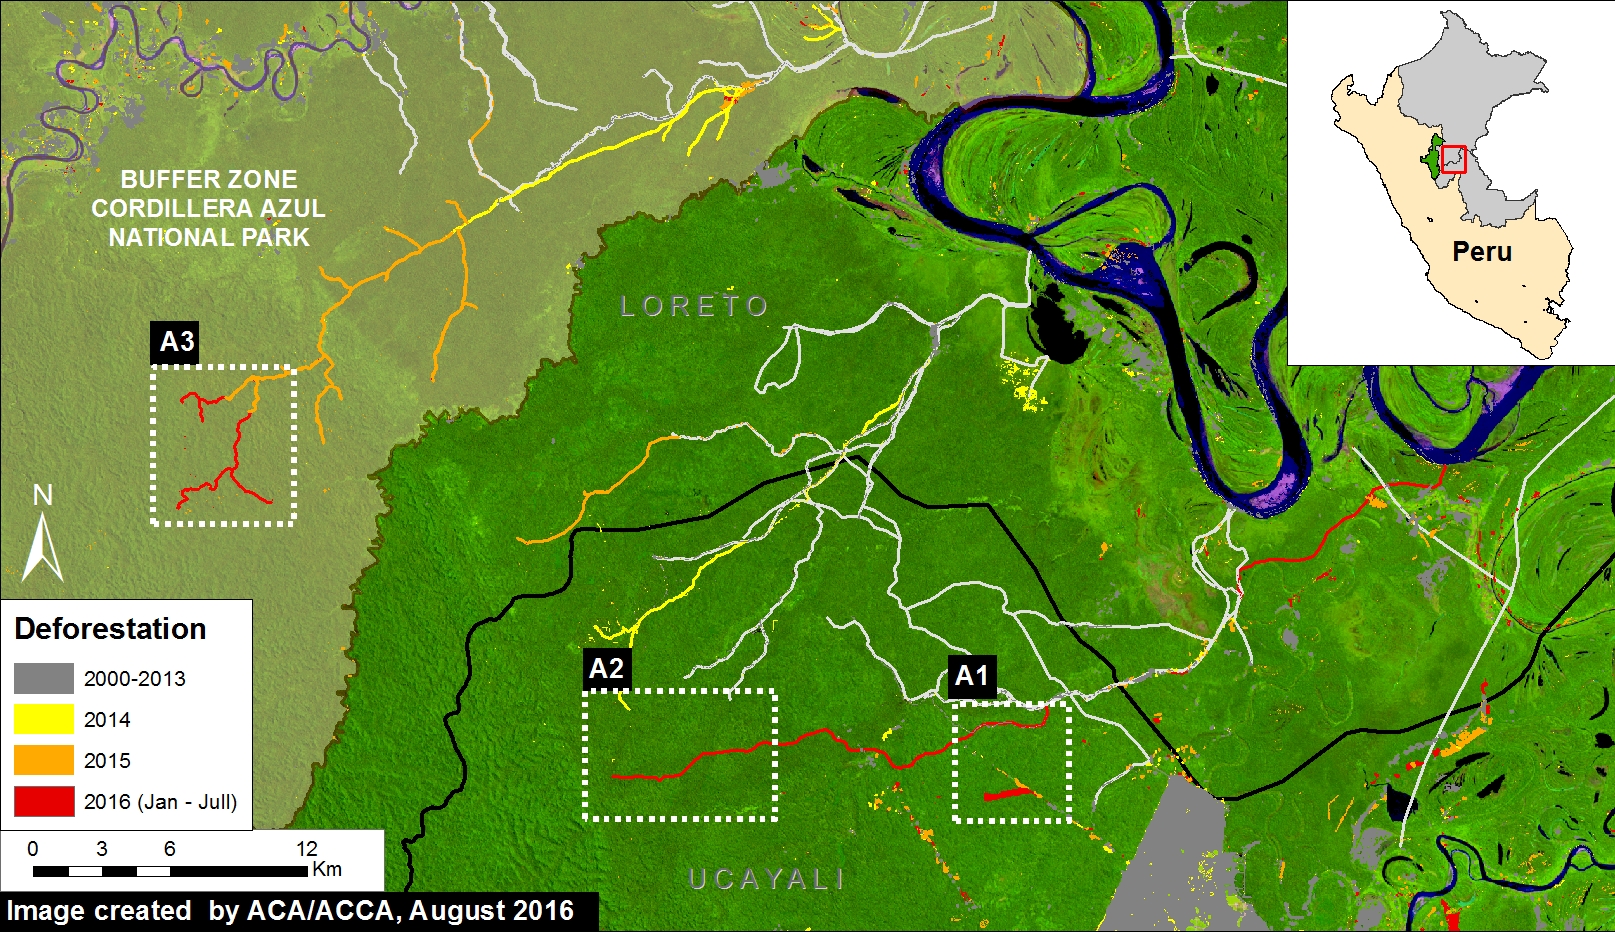
Image 25a shows the kernel density map for forest loss in the Peruvian Amazon between 2012 and 2014 and reveals that recent deforestation is concentrated in a number of “hotspots” in the departments of Loreto, San Martin, Ucyali, Huanuco, and Madre de Dios.

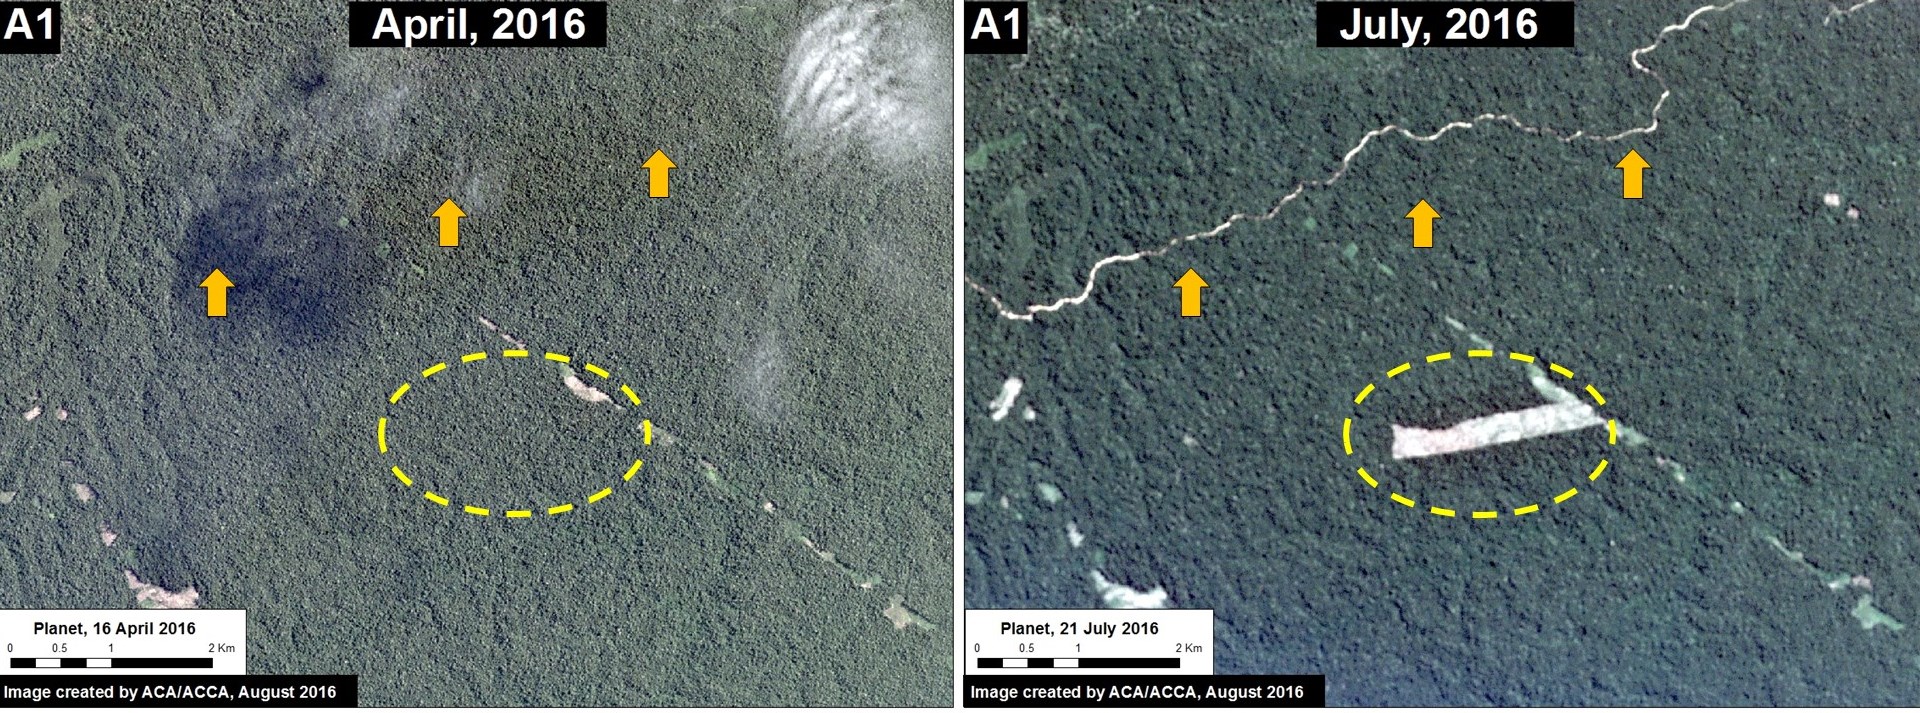
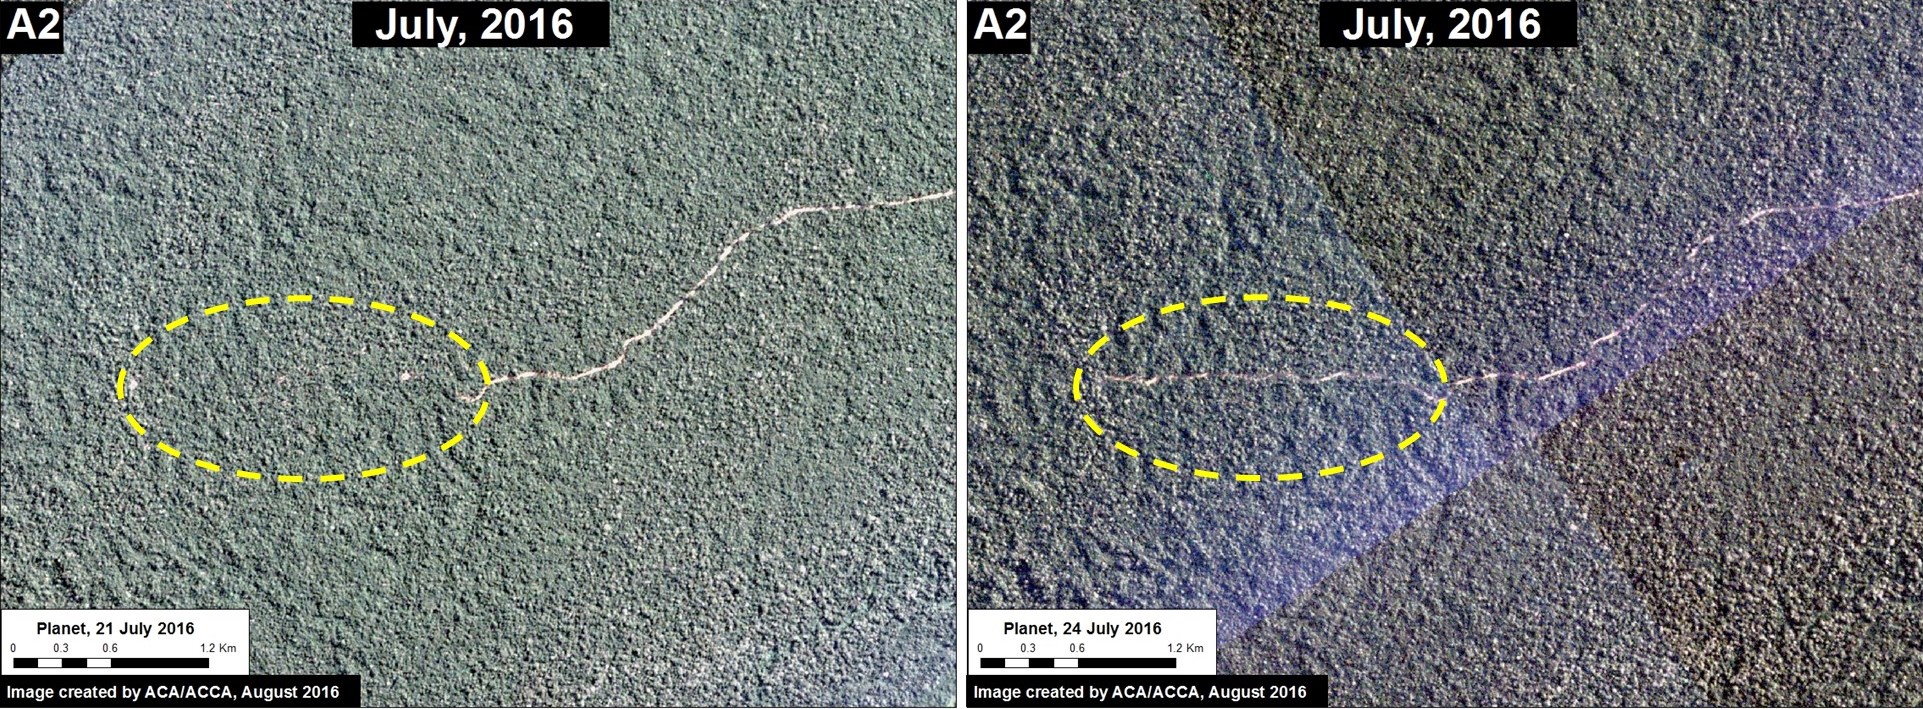
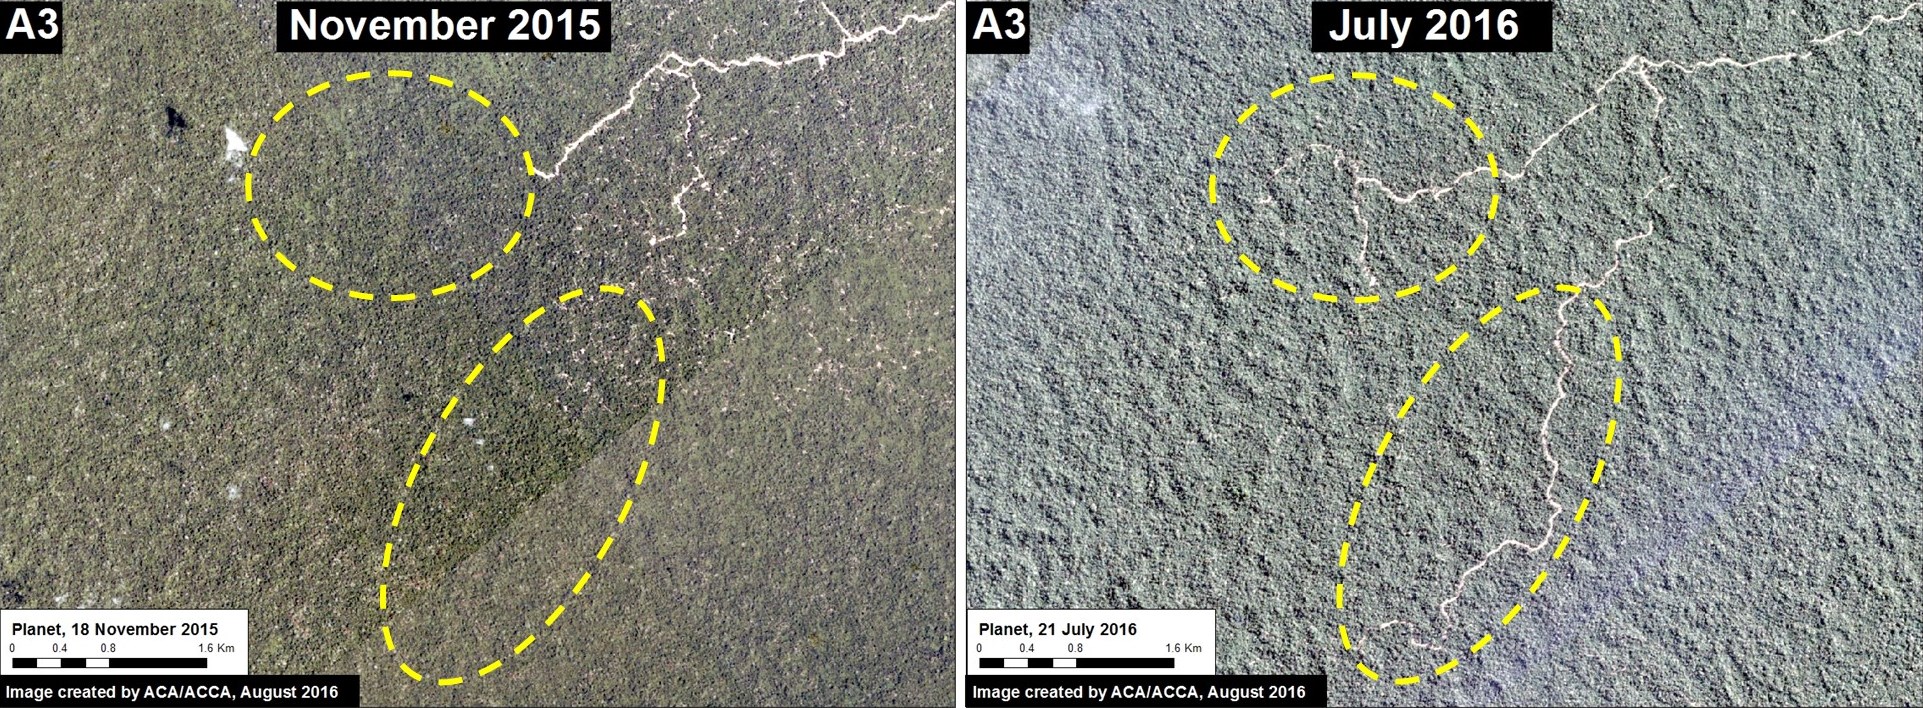
Insets A-D highlight four areas with high densities of forest loss described in previous MAAP articles. We are currently studying the other high density deforestation areas not included in the insets.


Inset A: Cacao in Loreto

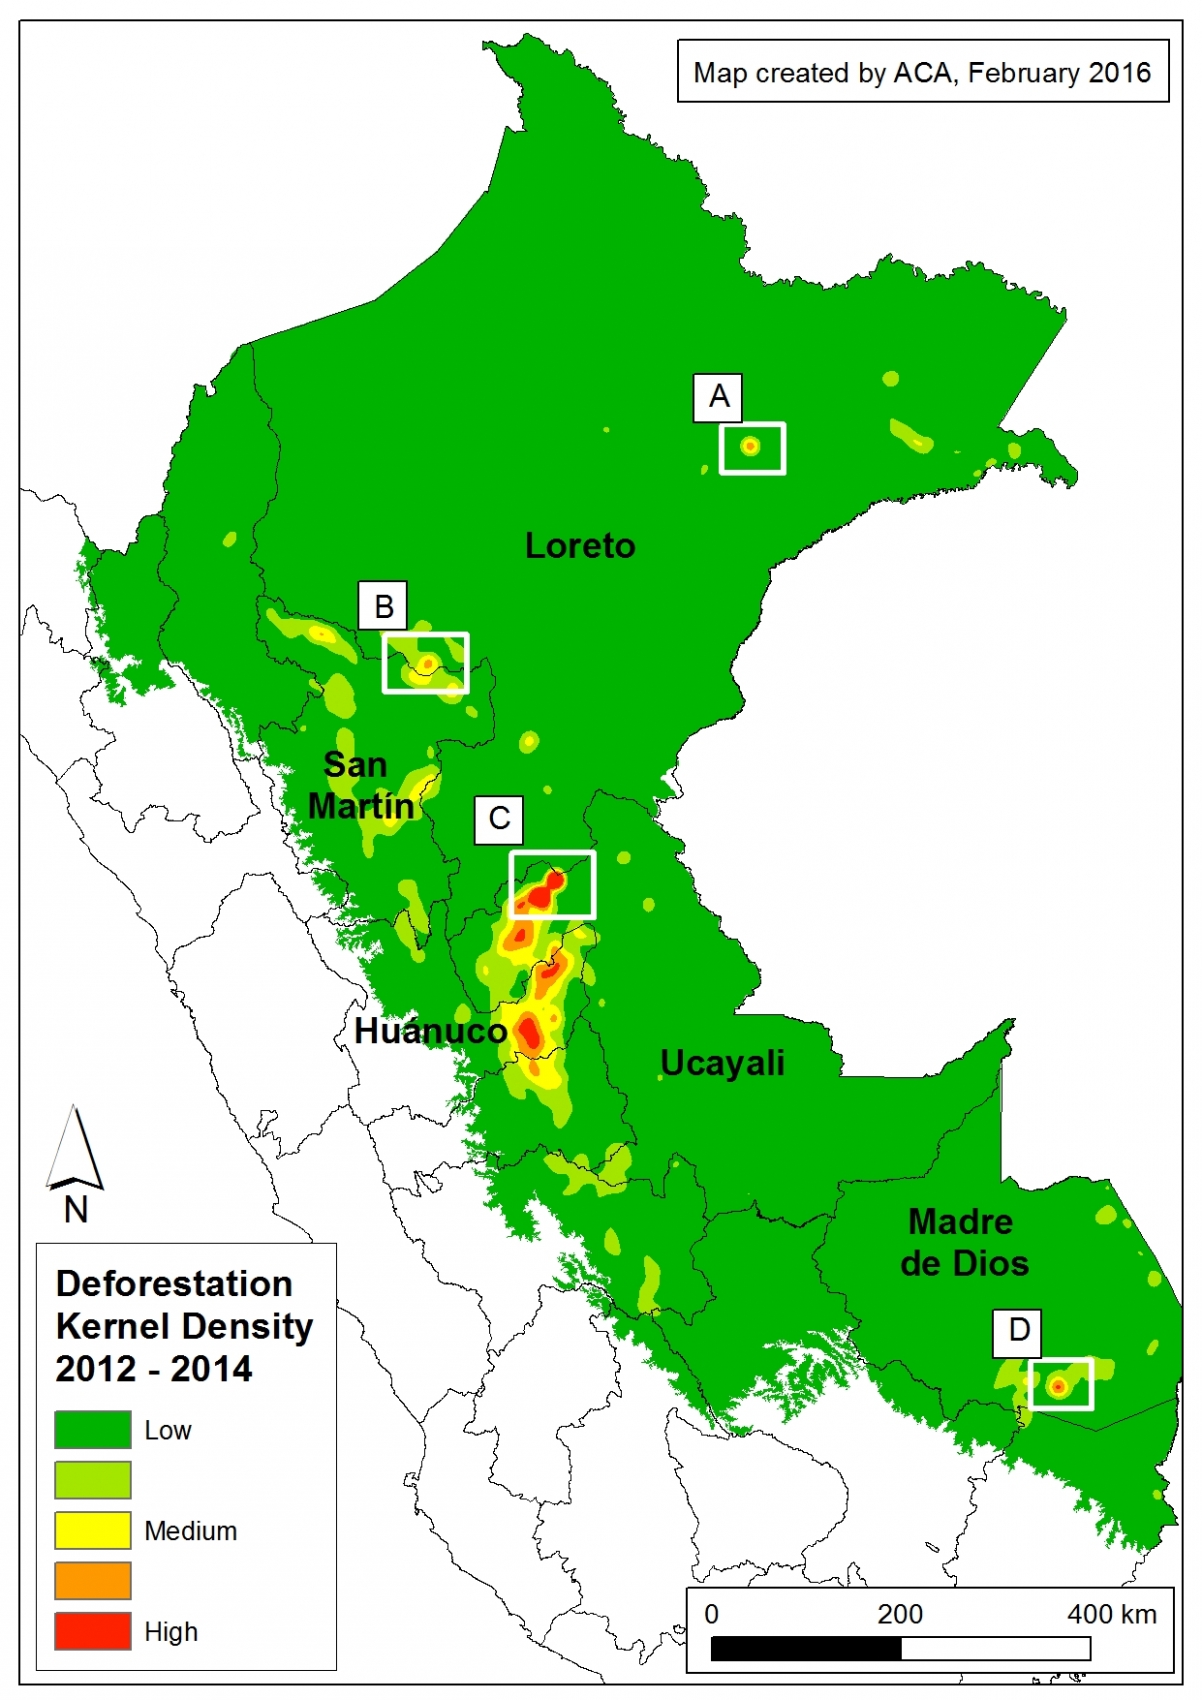
Image 25a. Kernel density map for forest loss in the Peruvian Amazon between 2012 and 2014. Data: PNCB/MINAM, Hansen/UMD/Google/USGS/NASA.
Image Xb.
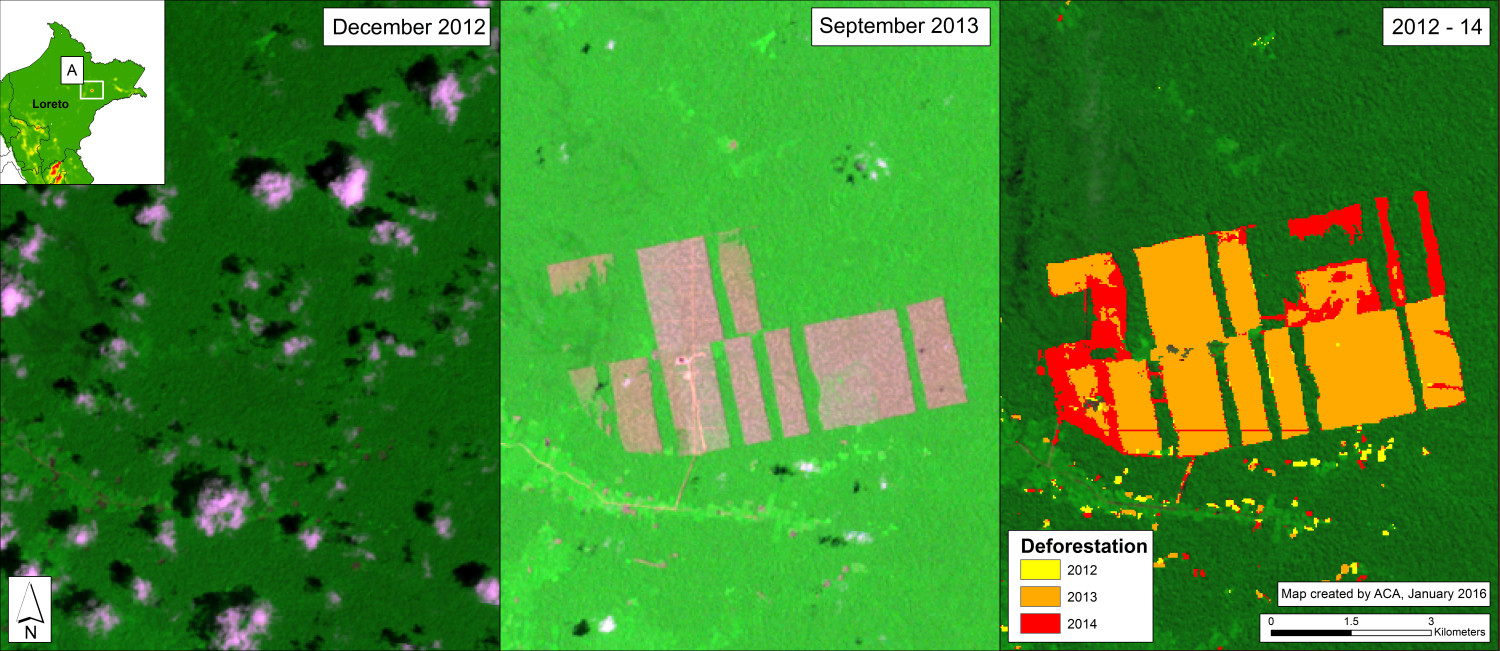
Image 25b. Deforestation for cacao in northern Peru between December 2012 (left panel) and September 2013 (center panel) and cumulative 2012-14 (right panel). Data: USGS, PNCB/MINAM, Hansen/UMD/Google/USGS/NASA

Inset A (from Image 25a) indicates the deforestation of over 2,000 hectares (4,940 acres) on property owned by the company United Cacao (through its wholly owned Peruvian subsidiary, Cacao del Peru Norte) near the town of Tamshiyacu in the department of Loreto. MAAP #9 demonstrated that much of this deforestation took place at the expense of primary forest. Image 25b highlights this area, showing the forest loss between December 2012 (left panel) and September 2013 (center panel; the pinkish areas indicate recently cleared forests). The right panel shows the cumulative deforestation between 2012 and 2014. See MAAP #9 and MAAP #2 for more details.


Inset B: Oil Palm in Loreto/San Martin

Peru_KD_B_3panel_v1
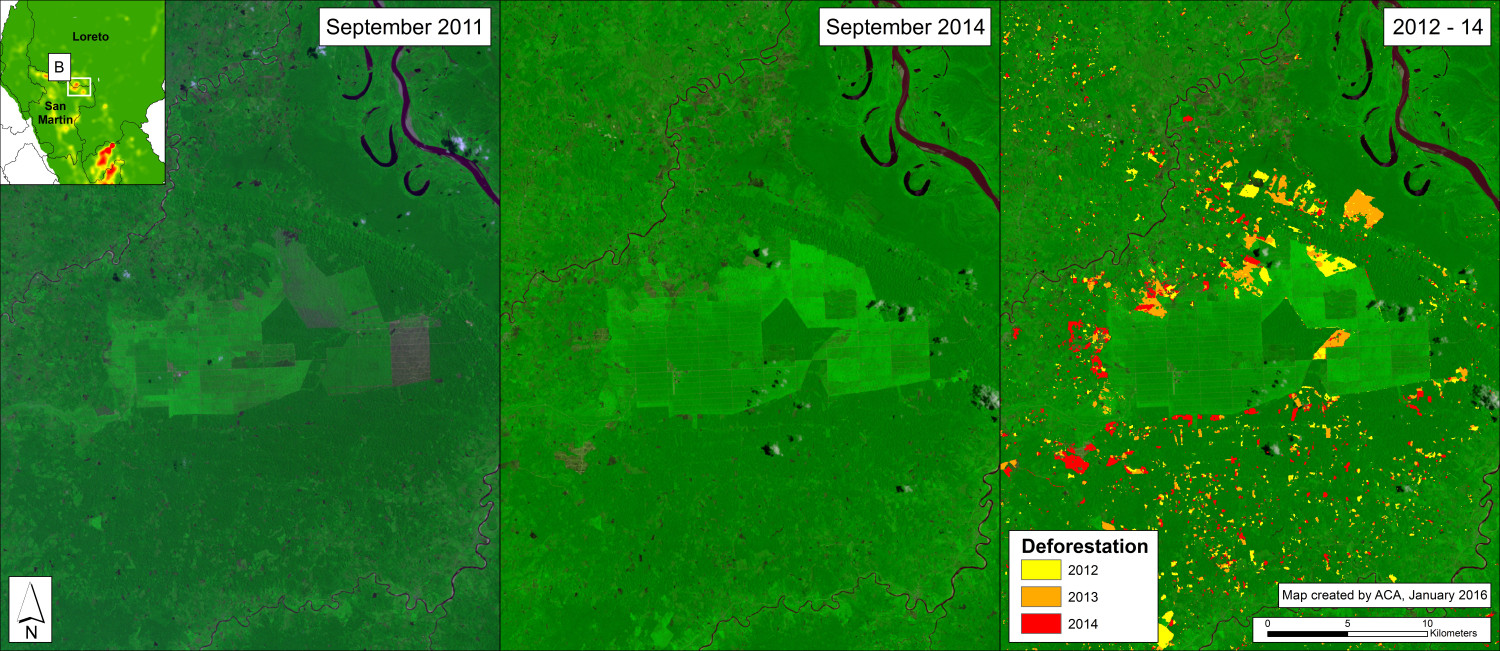
Image 25c. Deforestation for oil palm in northern Peru between September 2011 (left panel) and September 2014 (center panel) and cumulative 2012-14 (right panel). Data: USGS, PNCB/MINAM, Hansen/UMD/Google/USGS/NASA

Inset B (from Image 25a) indicates expanding deforestation within and around two large-scale oil palm plantations along the Loreto-San Martin border. Image 25c highlights this area, showing the forest loss between Setpember 2011 (left panel) and September 2014 (center panel). The right panel shows the cumulative deforestation between 2012 and 2014 (6,363 hectares, or 15,700 acres). See MAAP #16 for more details.

Inset C: Oil Palm in Ucayali

Image Xd.
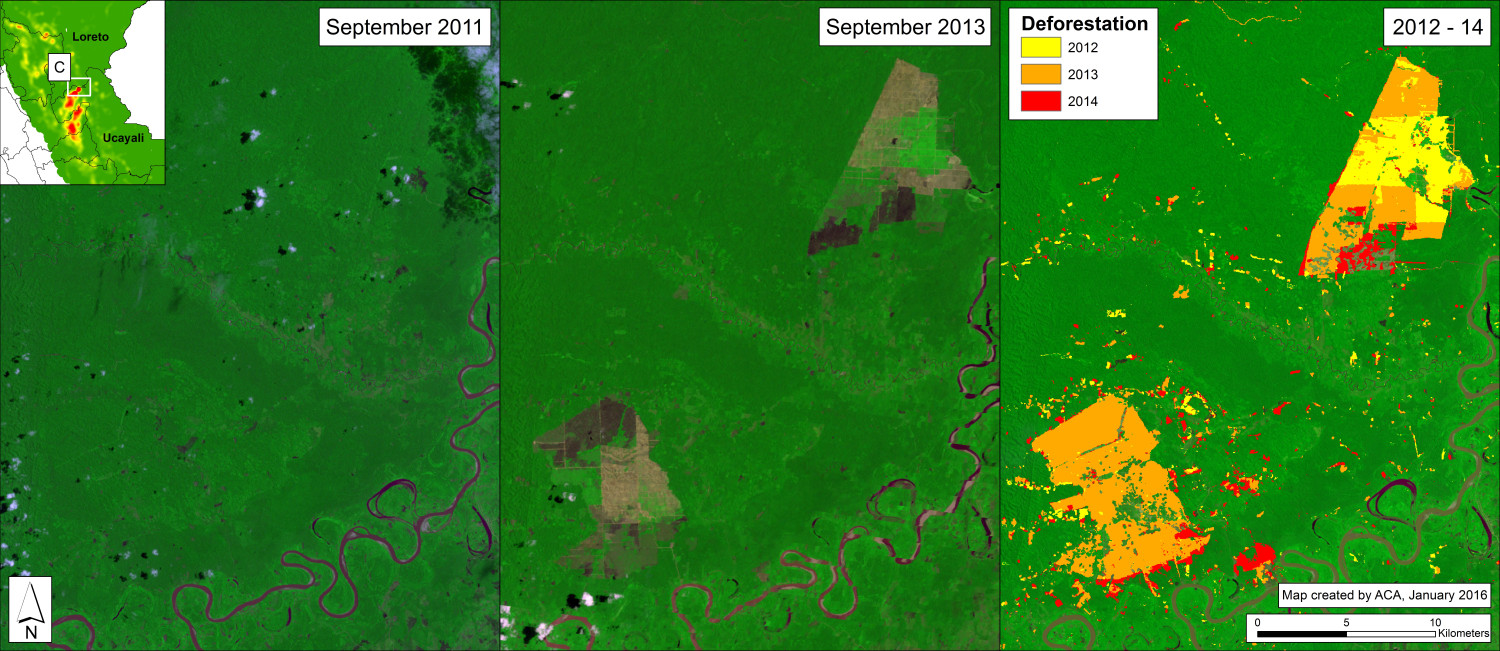
Image 25d. Deforestation for oil palm in central Peru between September 2011 (left panel) and September 2013 (center panel) and cumulative 2012-14 (right panel). Data: USGS, PNCB/MINAM, Hansen/UMD/Google/USGS/NASA

Inset C (from Image 25a) indicates the deforestation of 9,400 hectares (23,200 acres) of primary forest for two large-scale oil palm plantations in the department of Ucayali. Image 25d highlights this area, showing the forest loss between September 2011 (left panel) and September 2013 (center panel; the pinkish-black areas indicate recently cleared forests). The right panel shows the cumulative deforestation between 2012 and 2014. See MAAP #4 for more details.

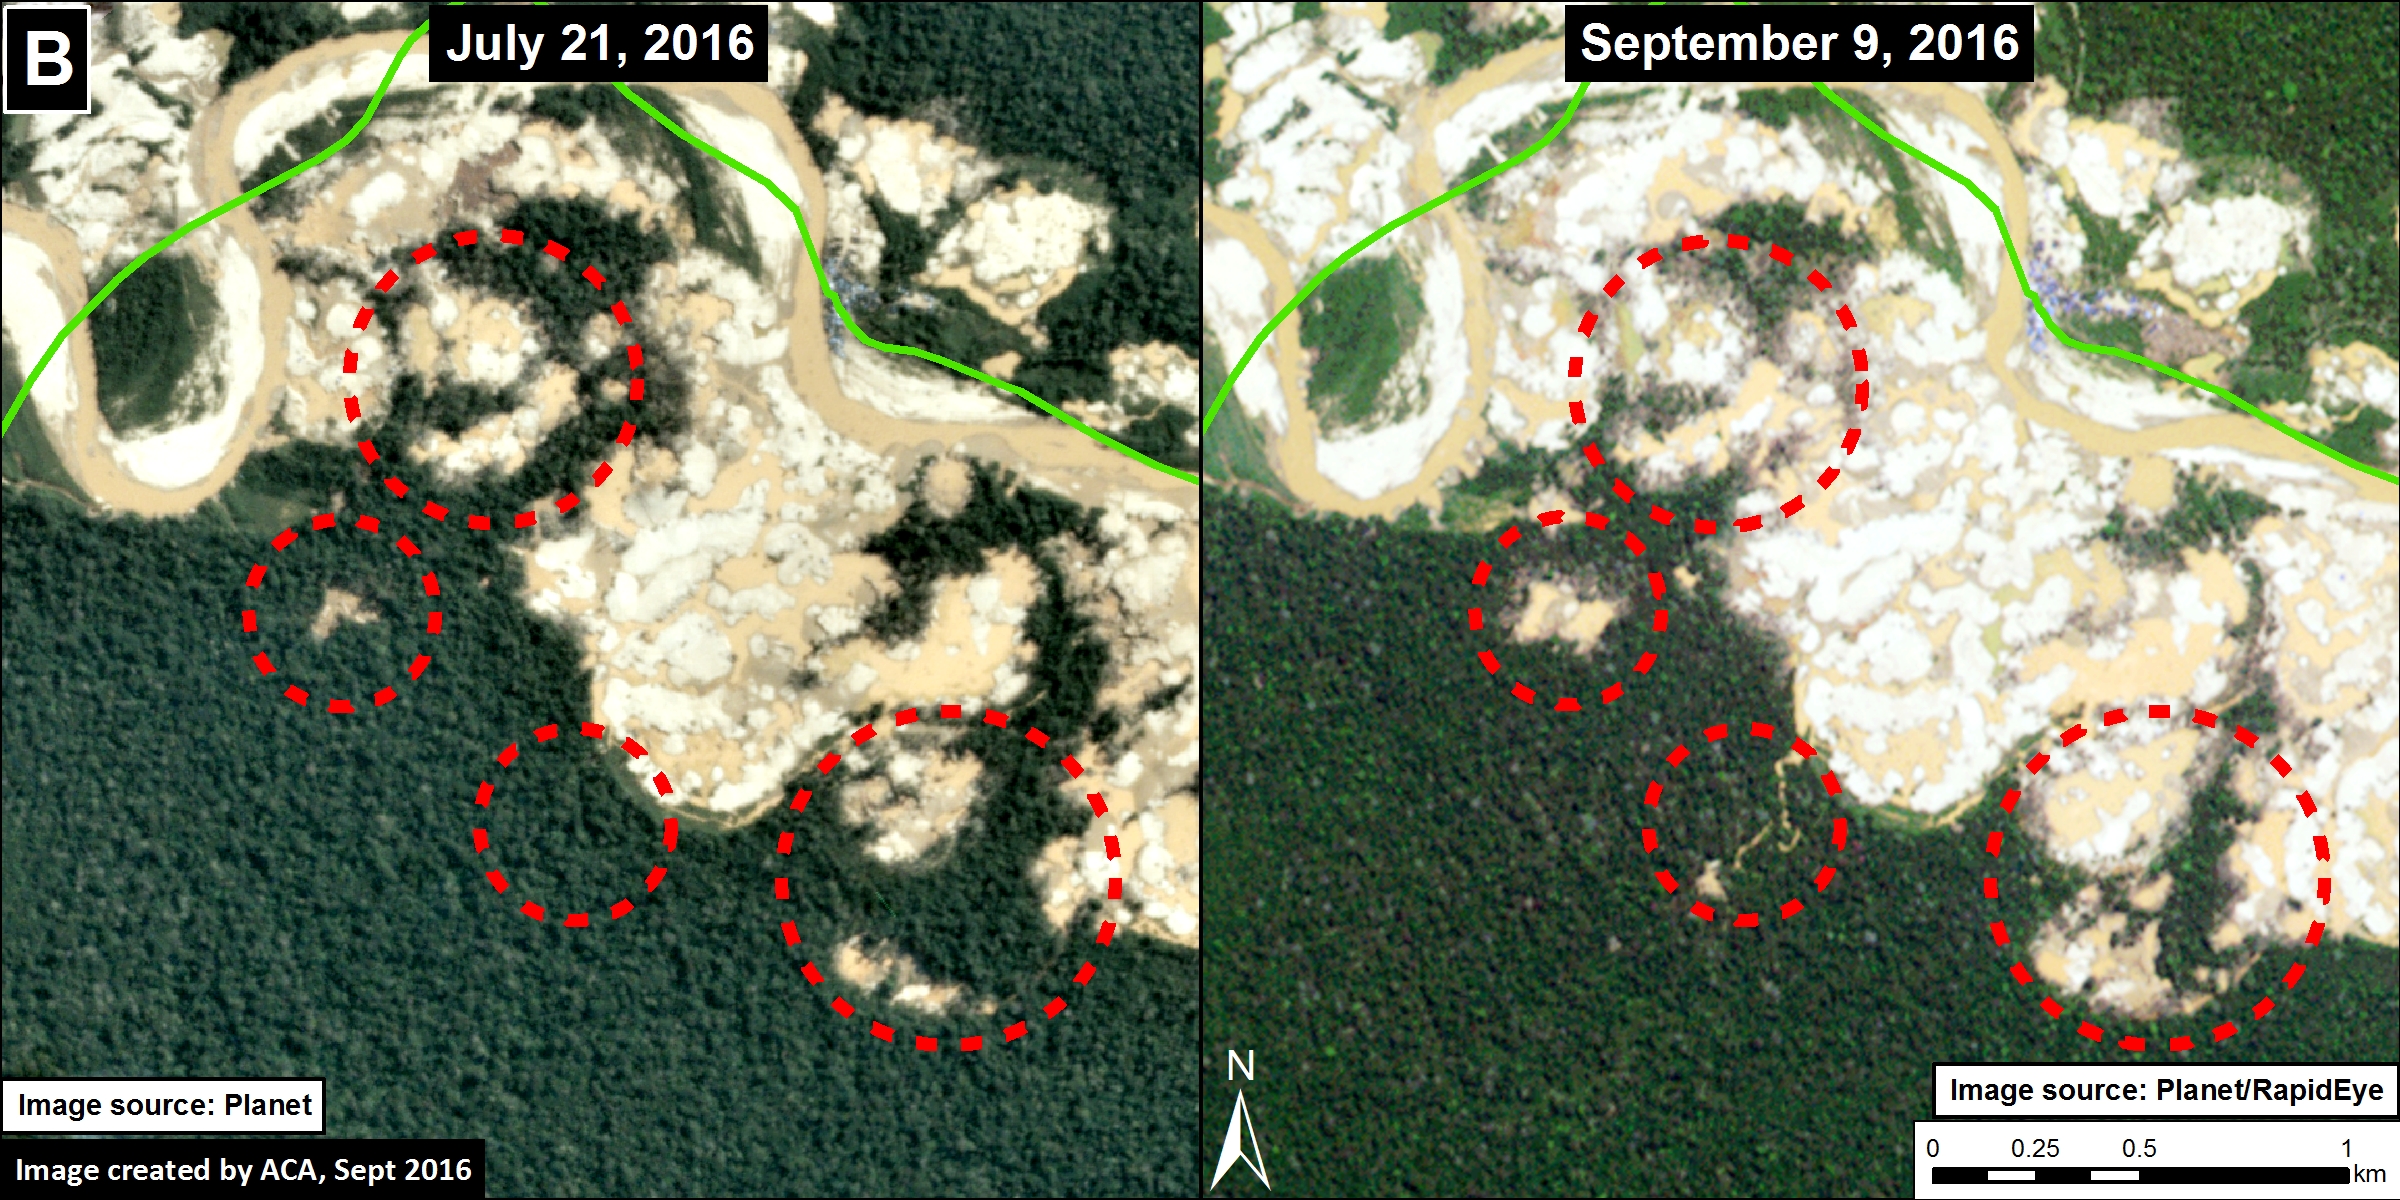
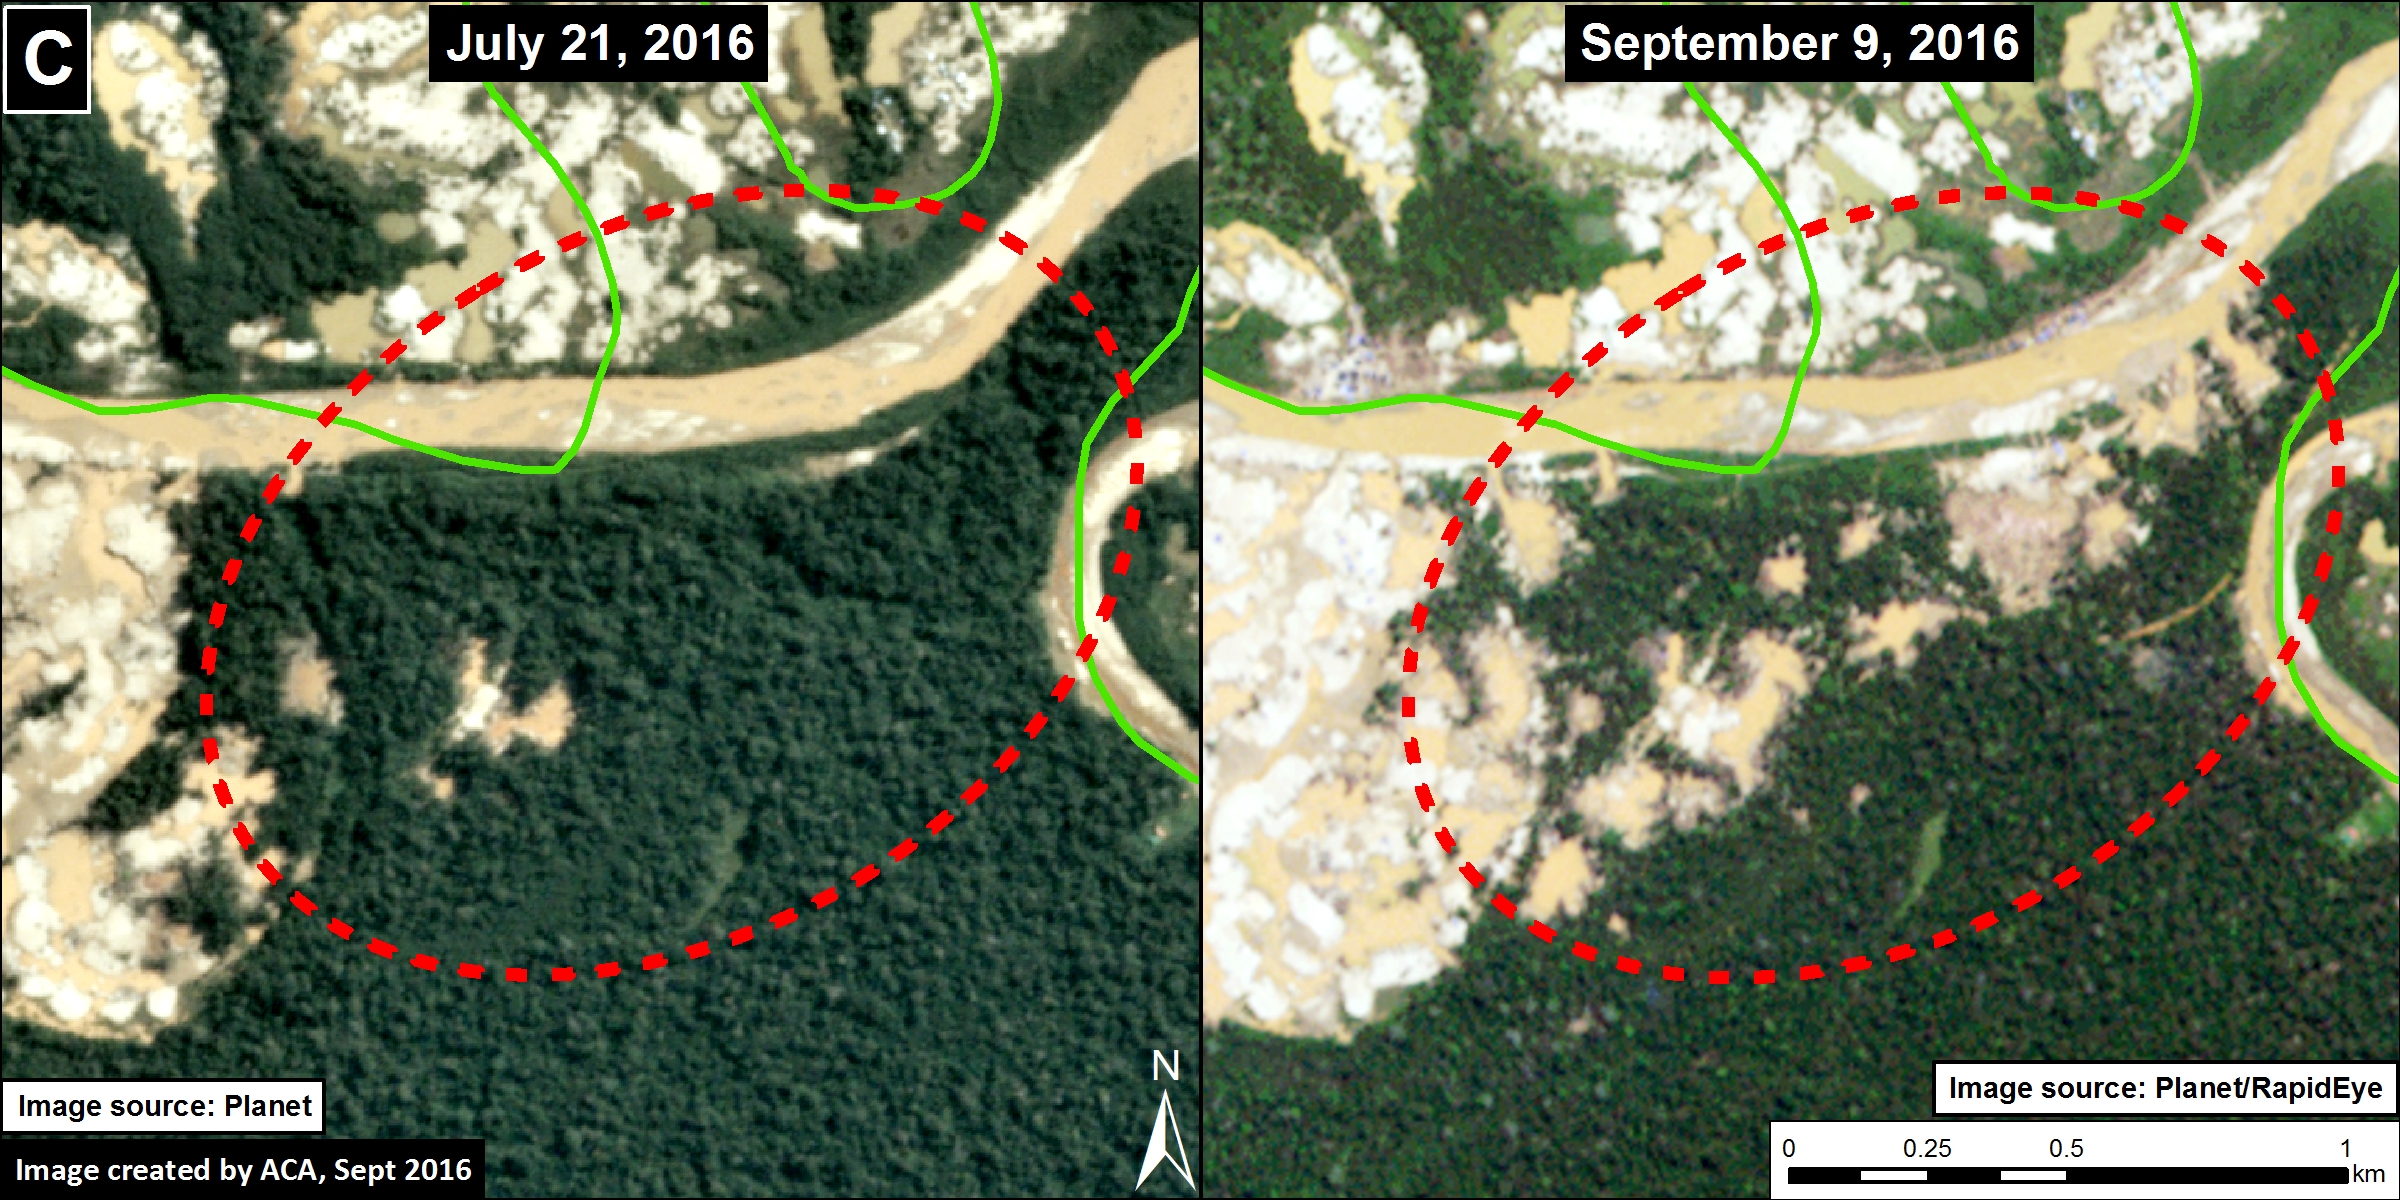
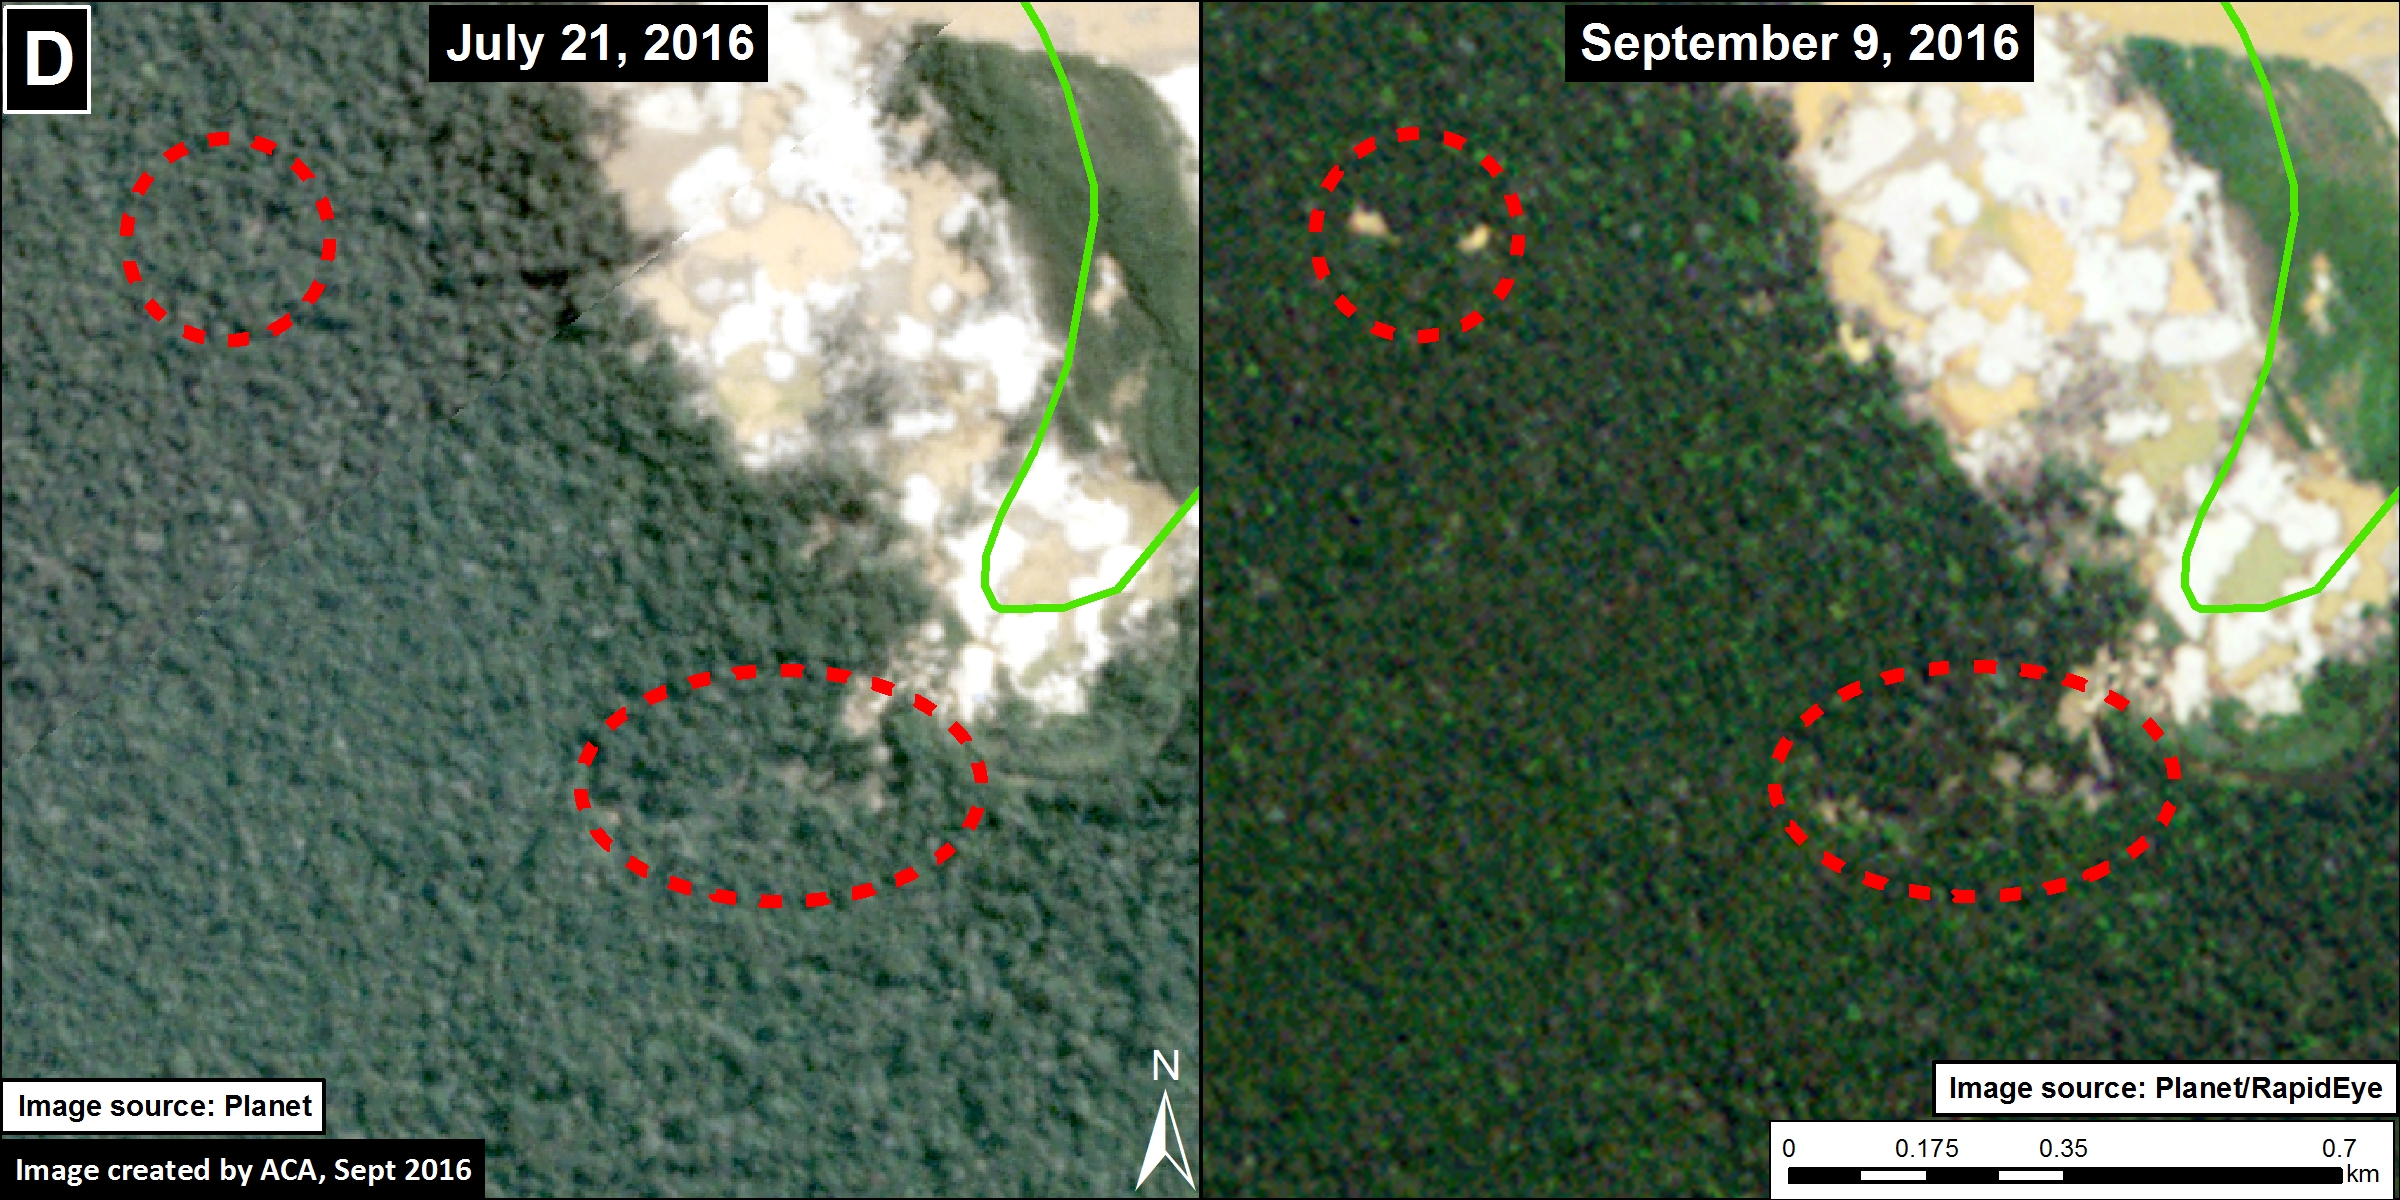
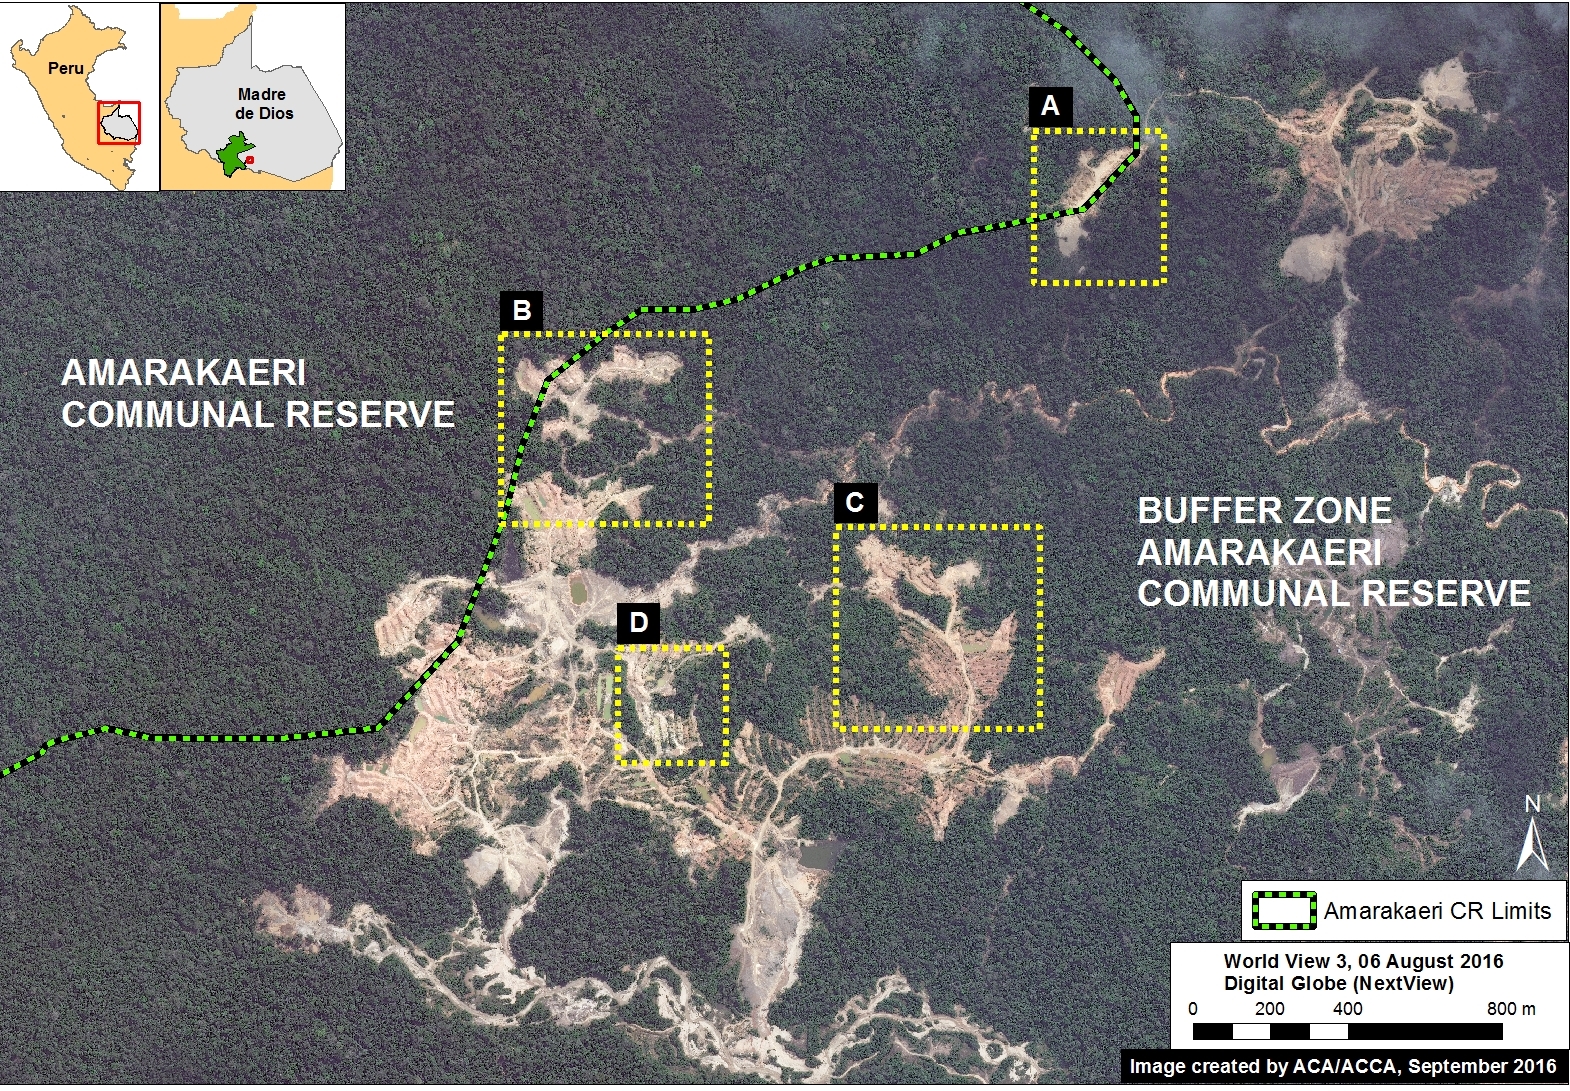
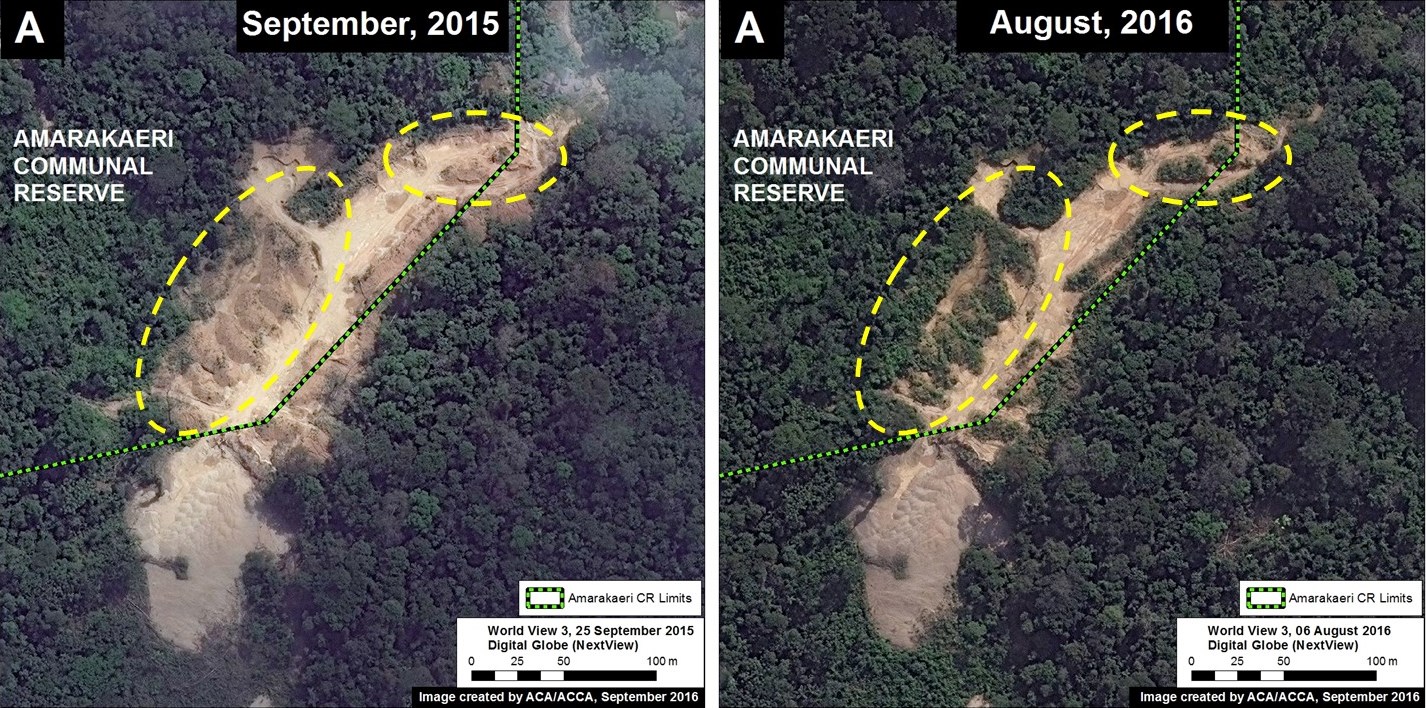
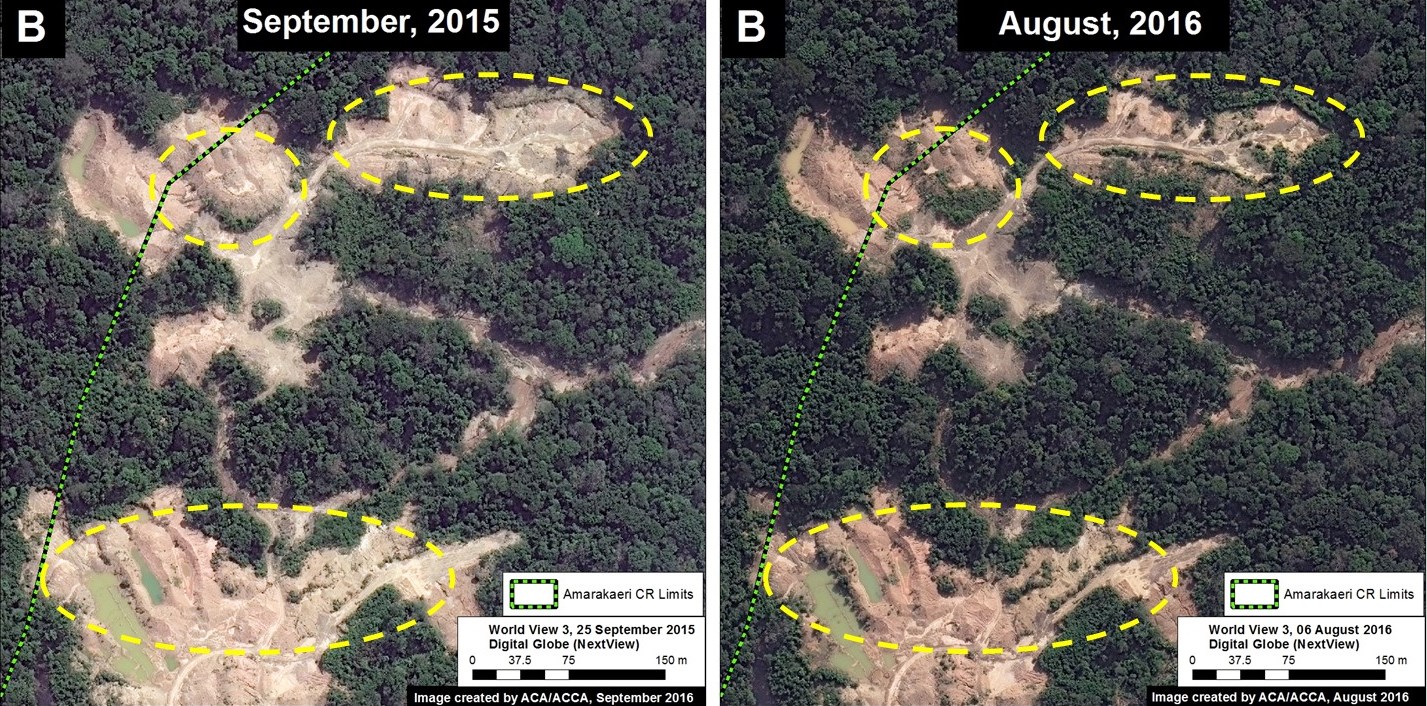
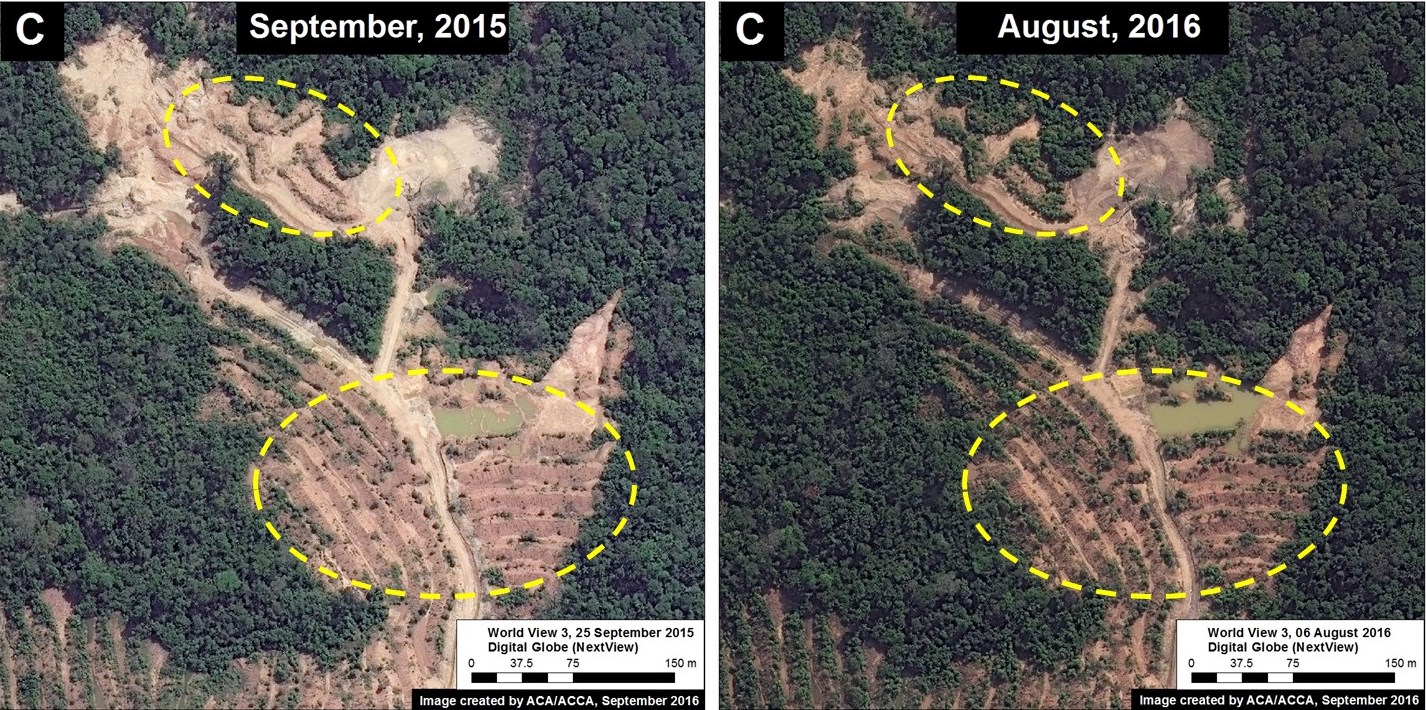
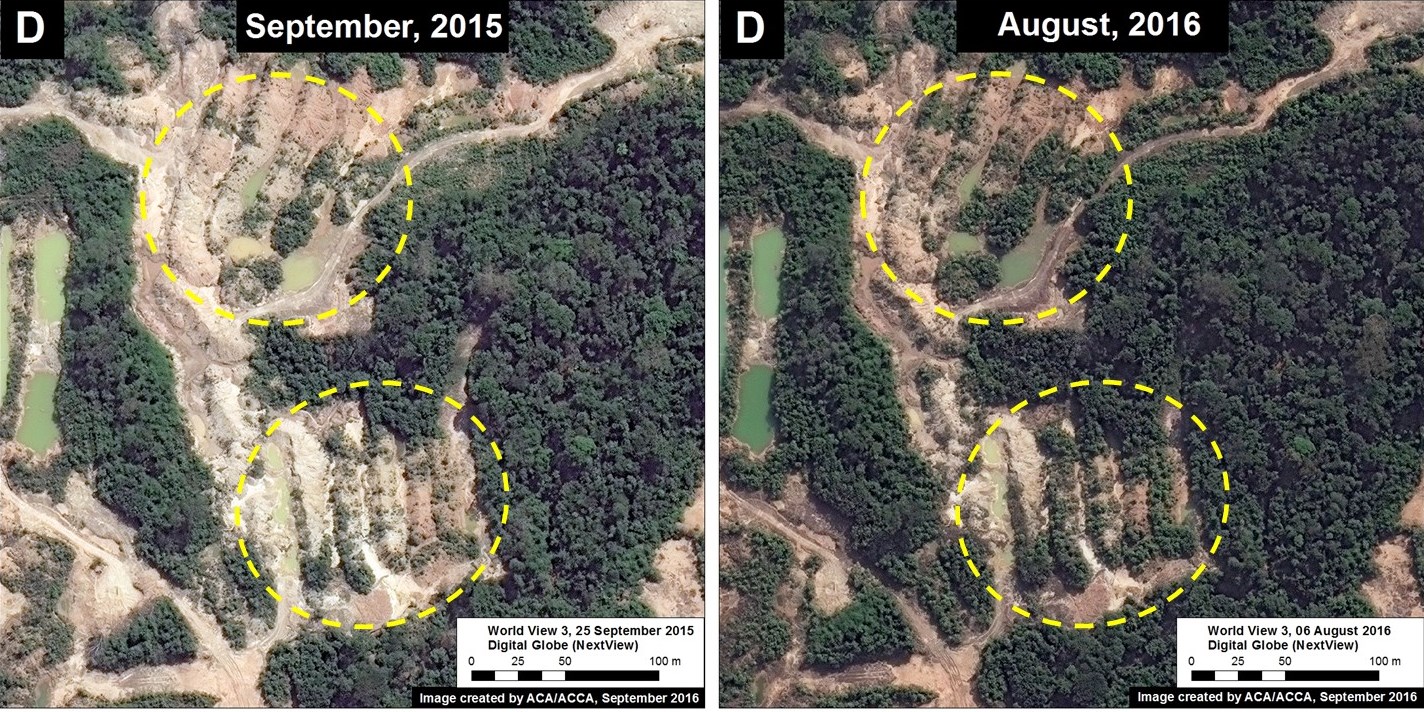
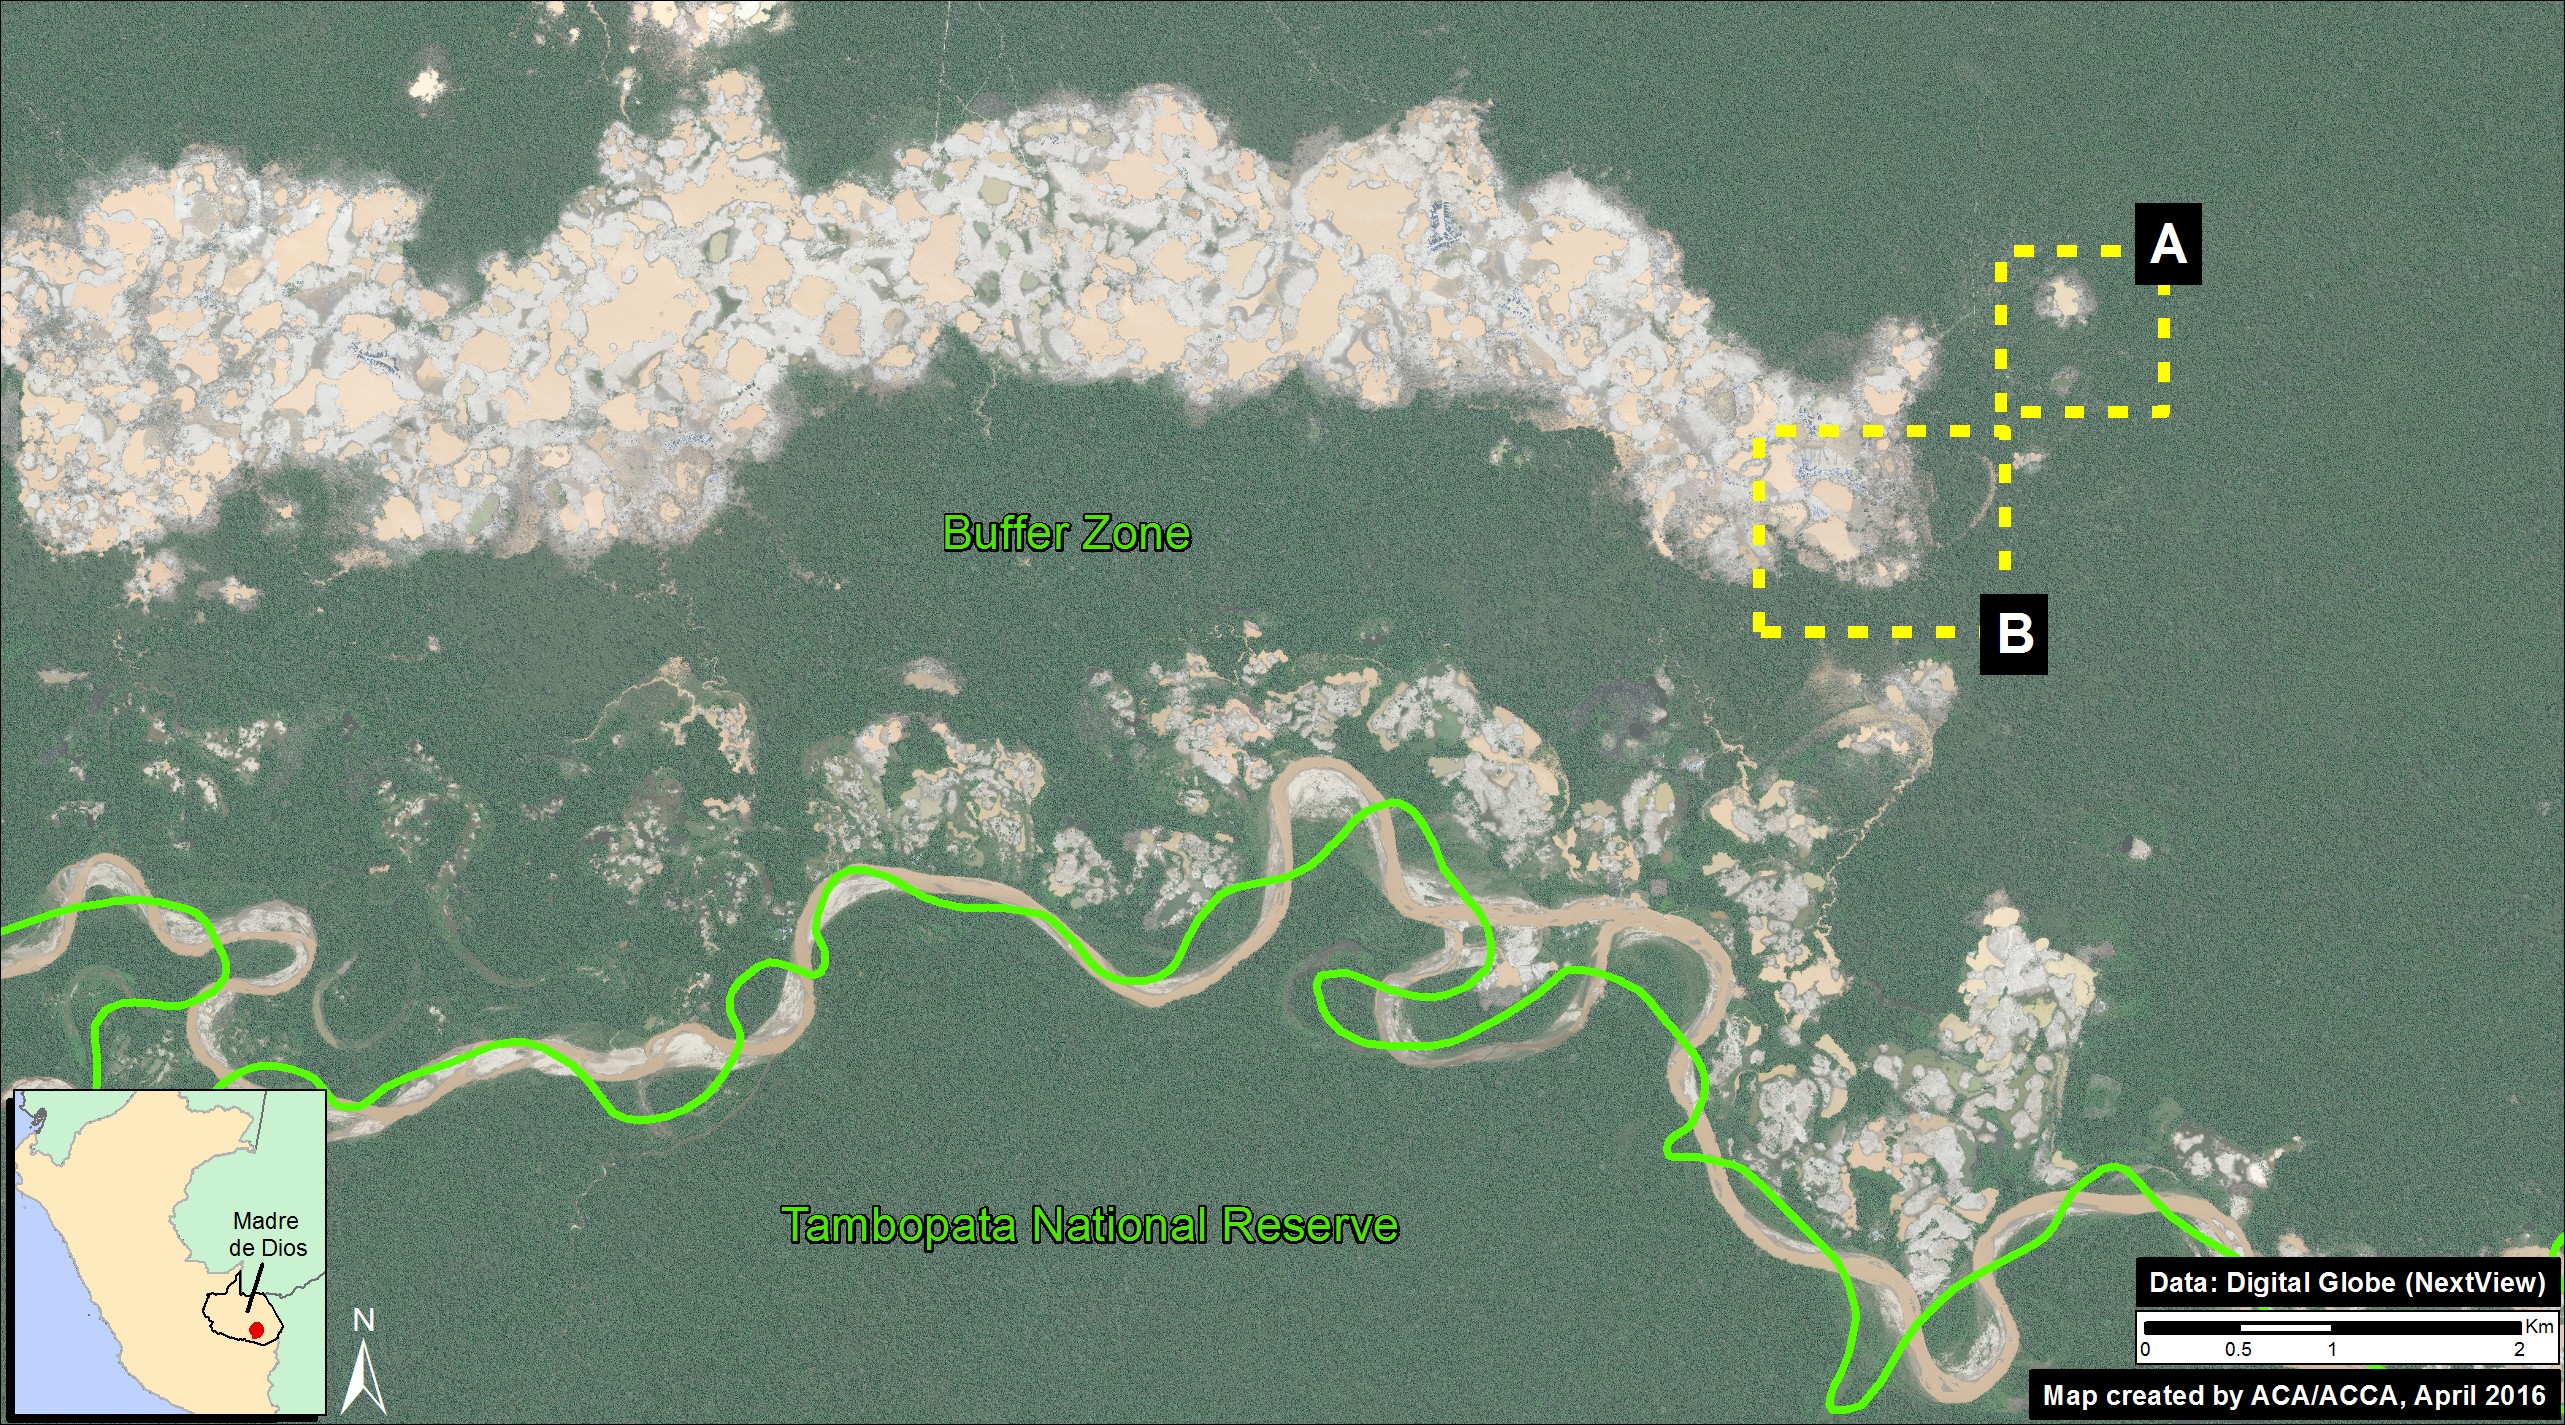
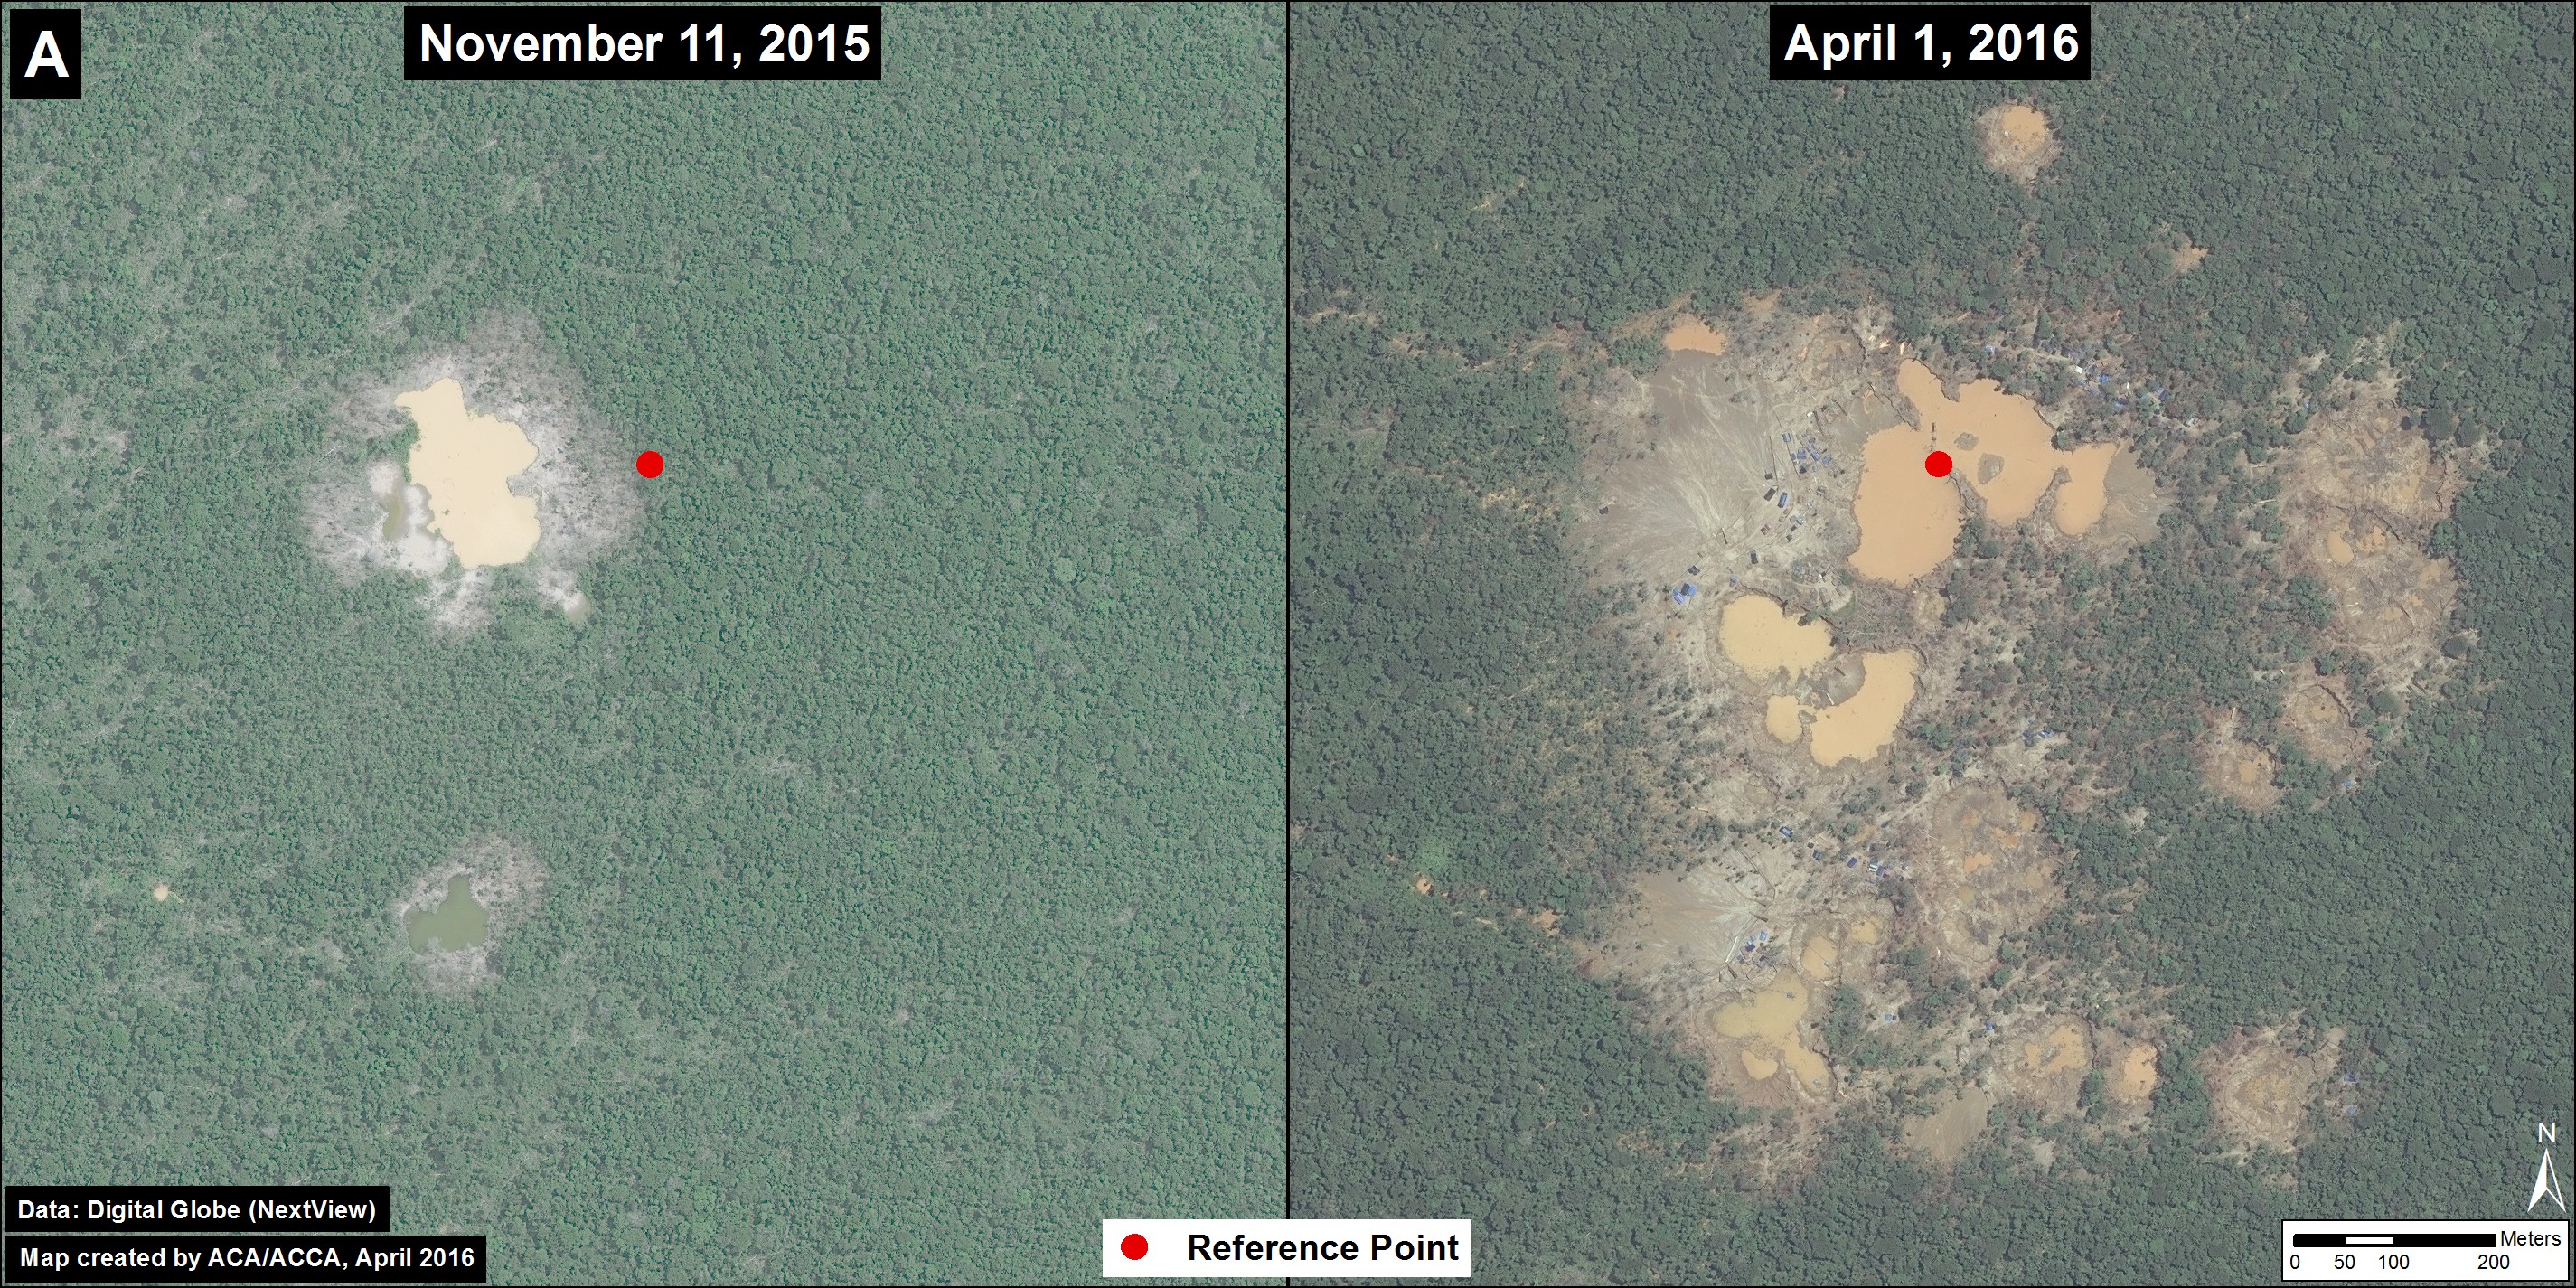
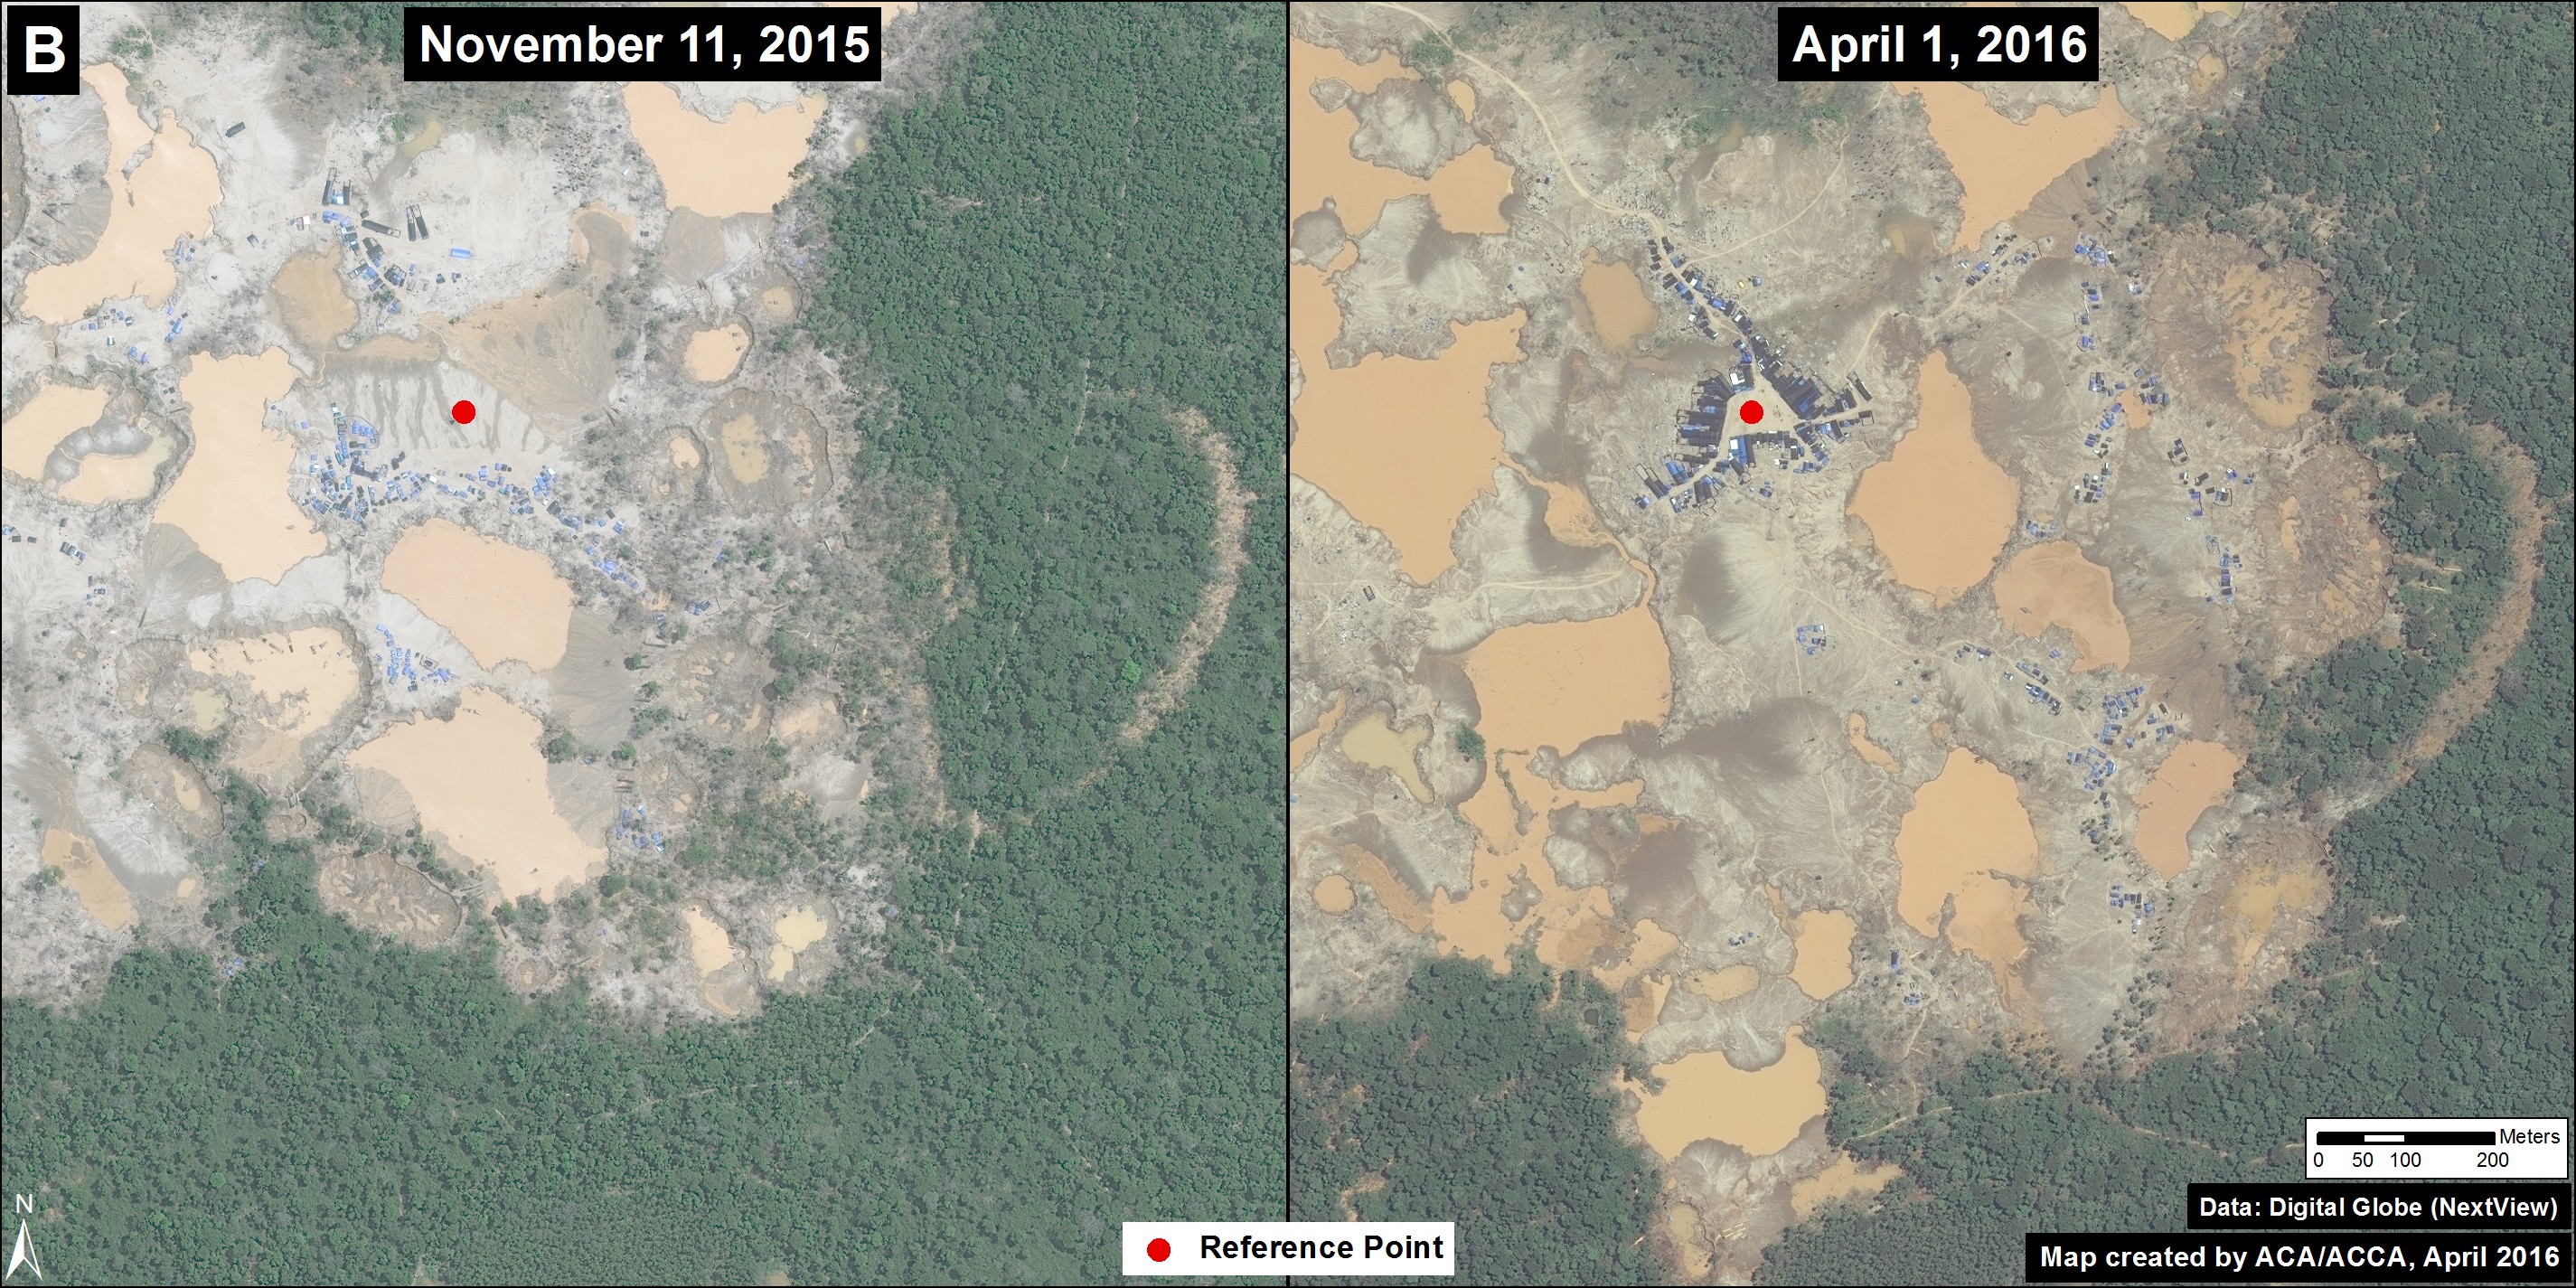
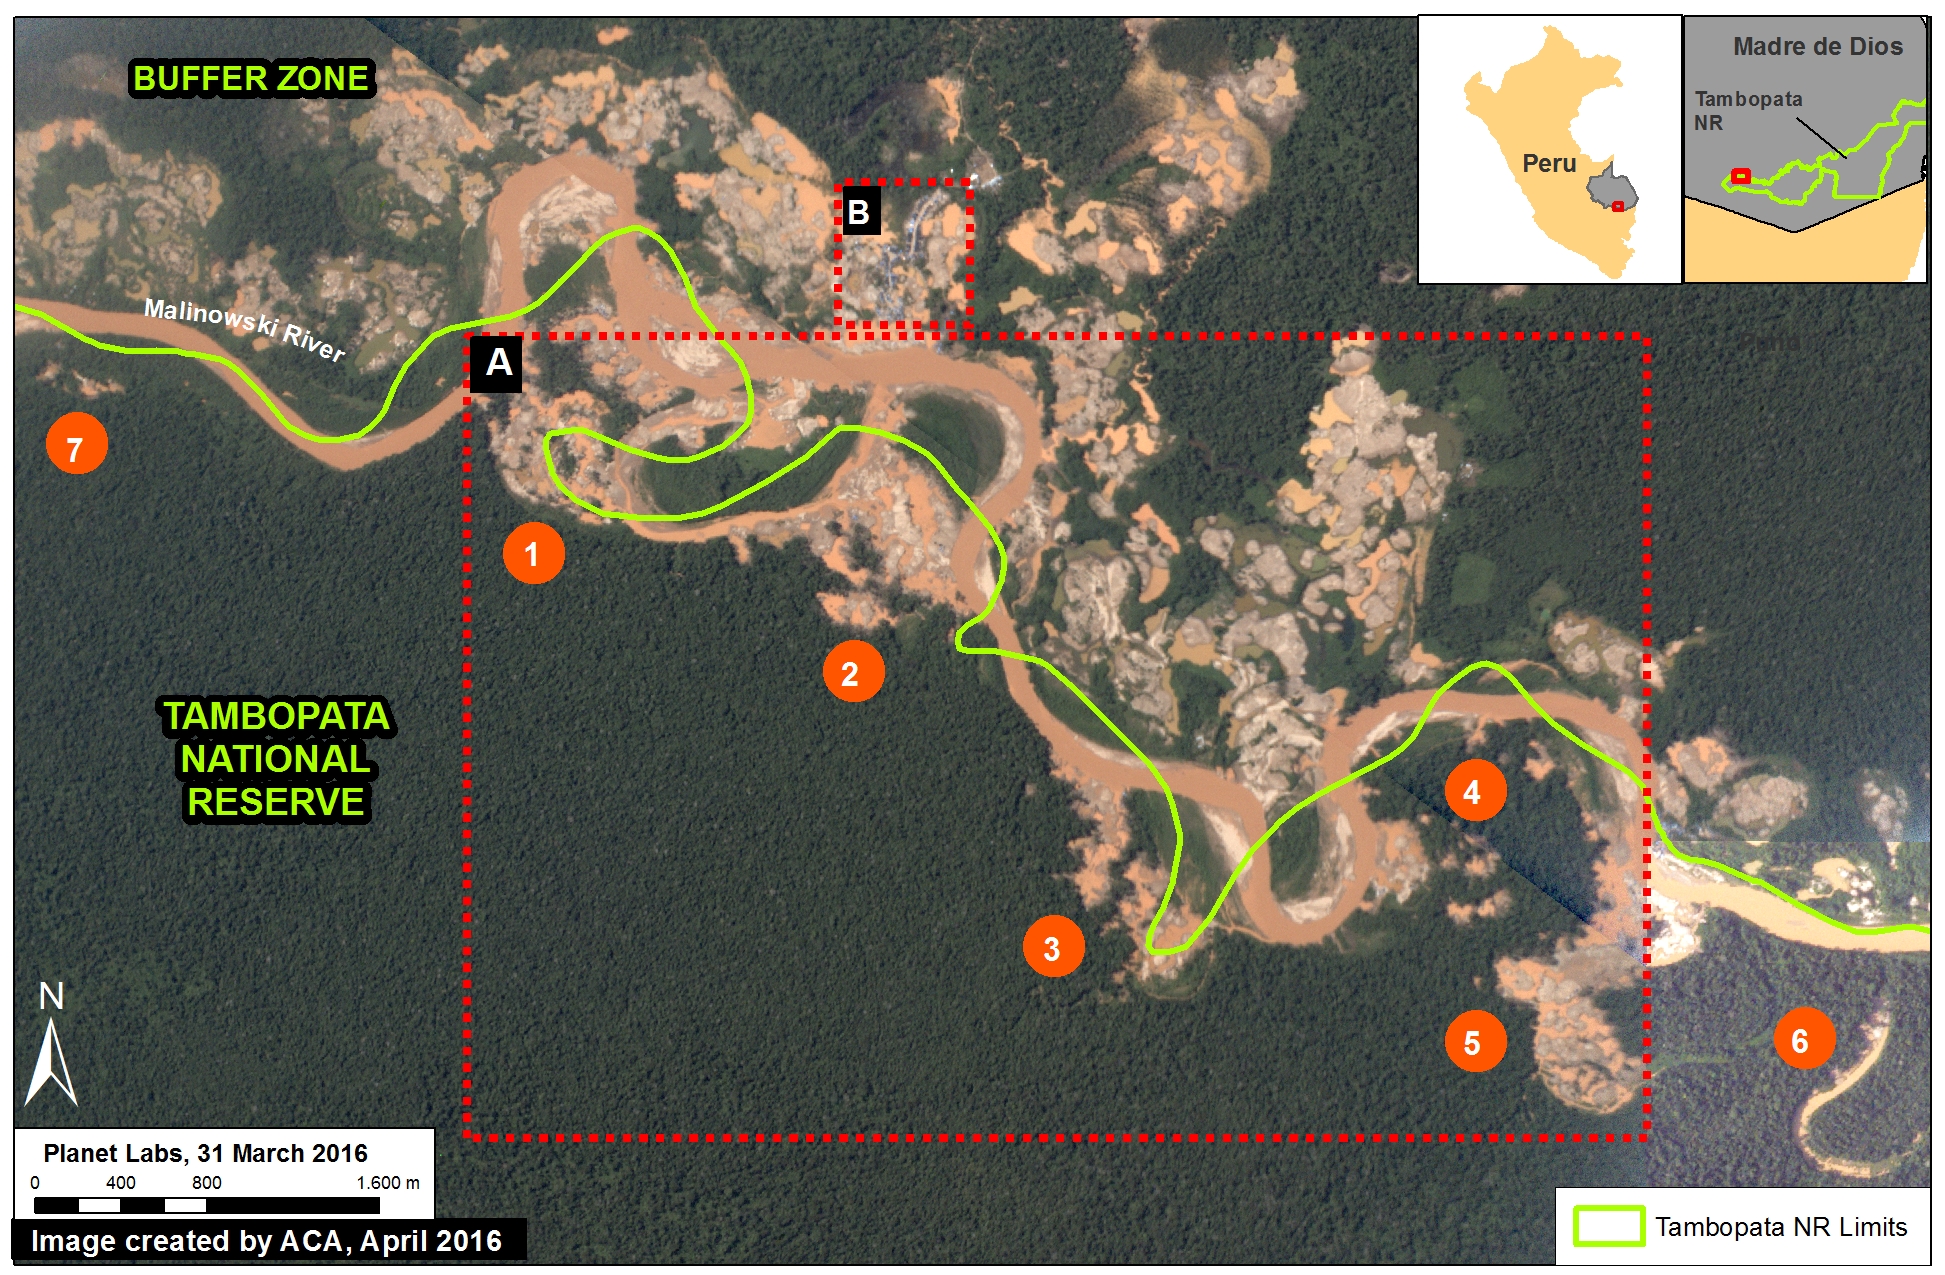
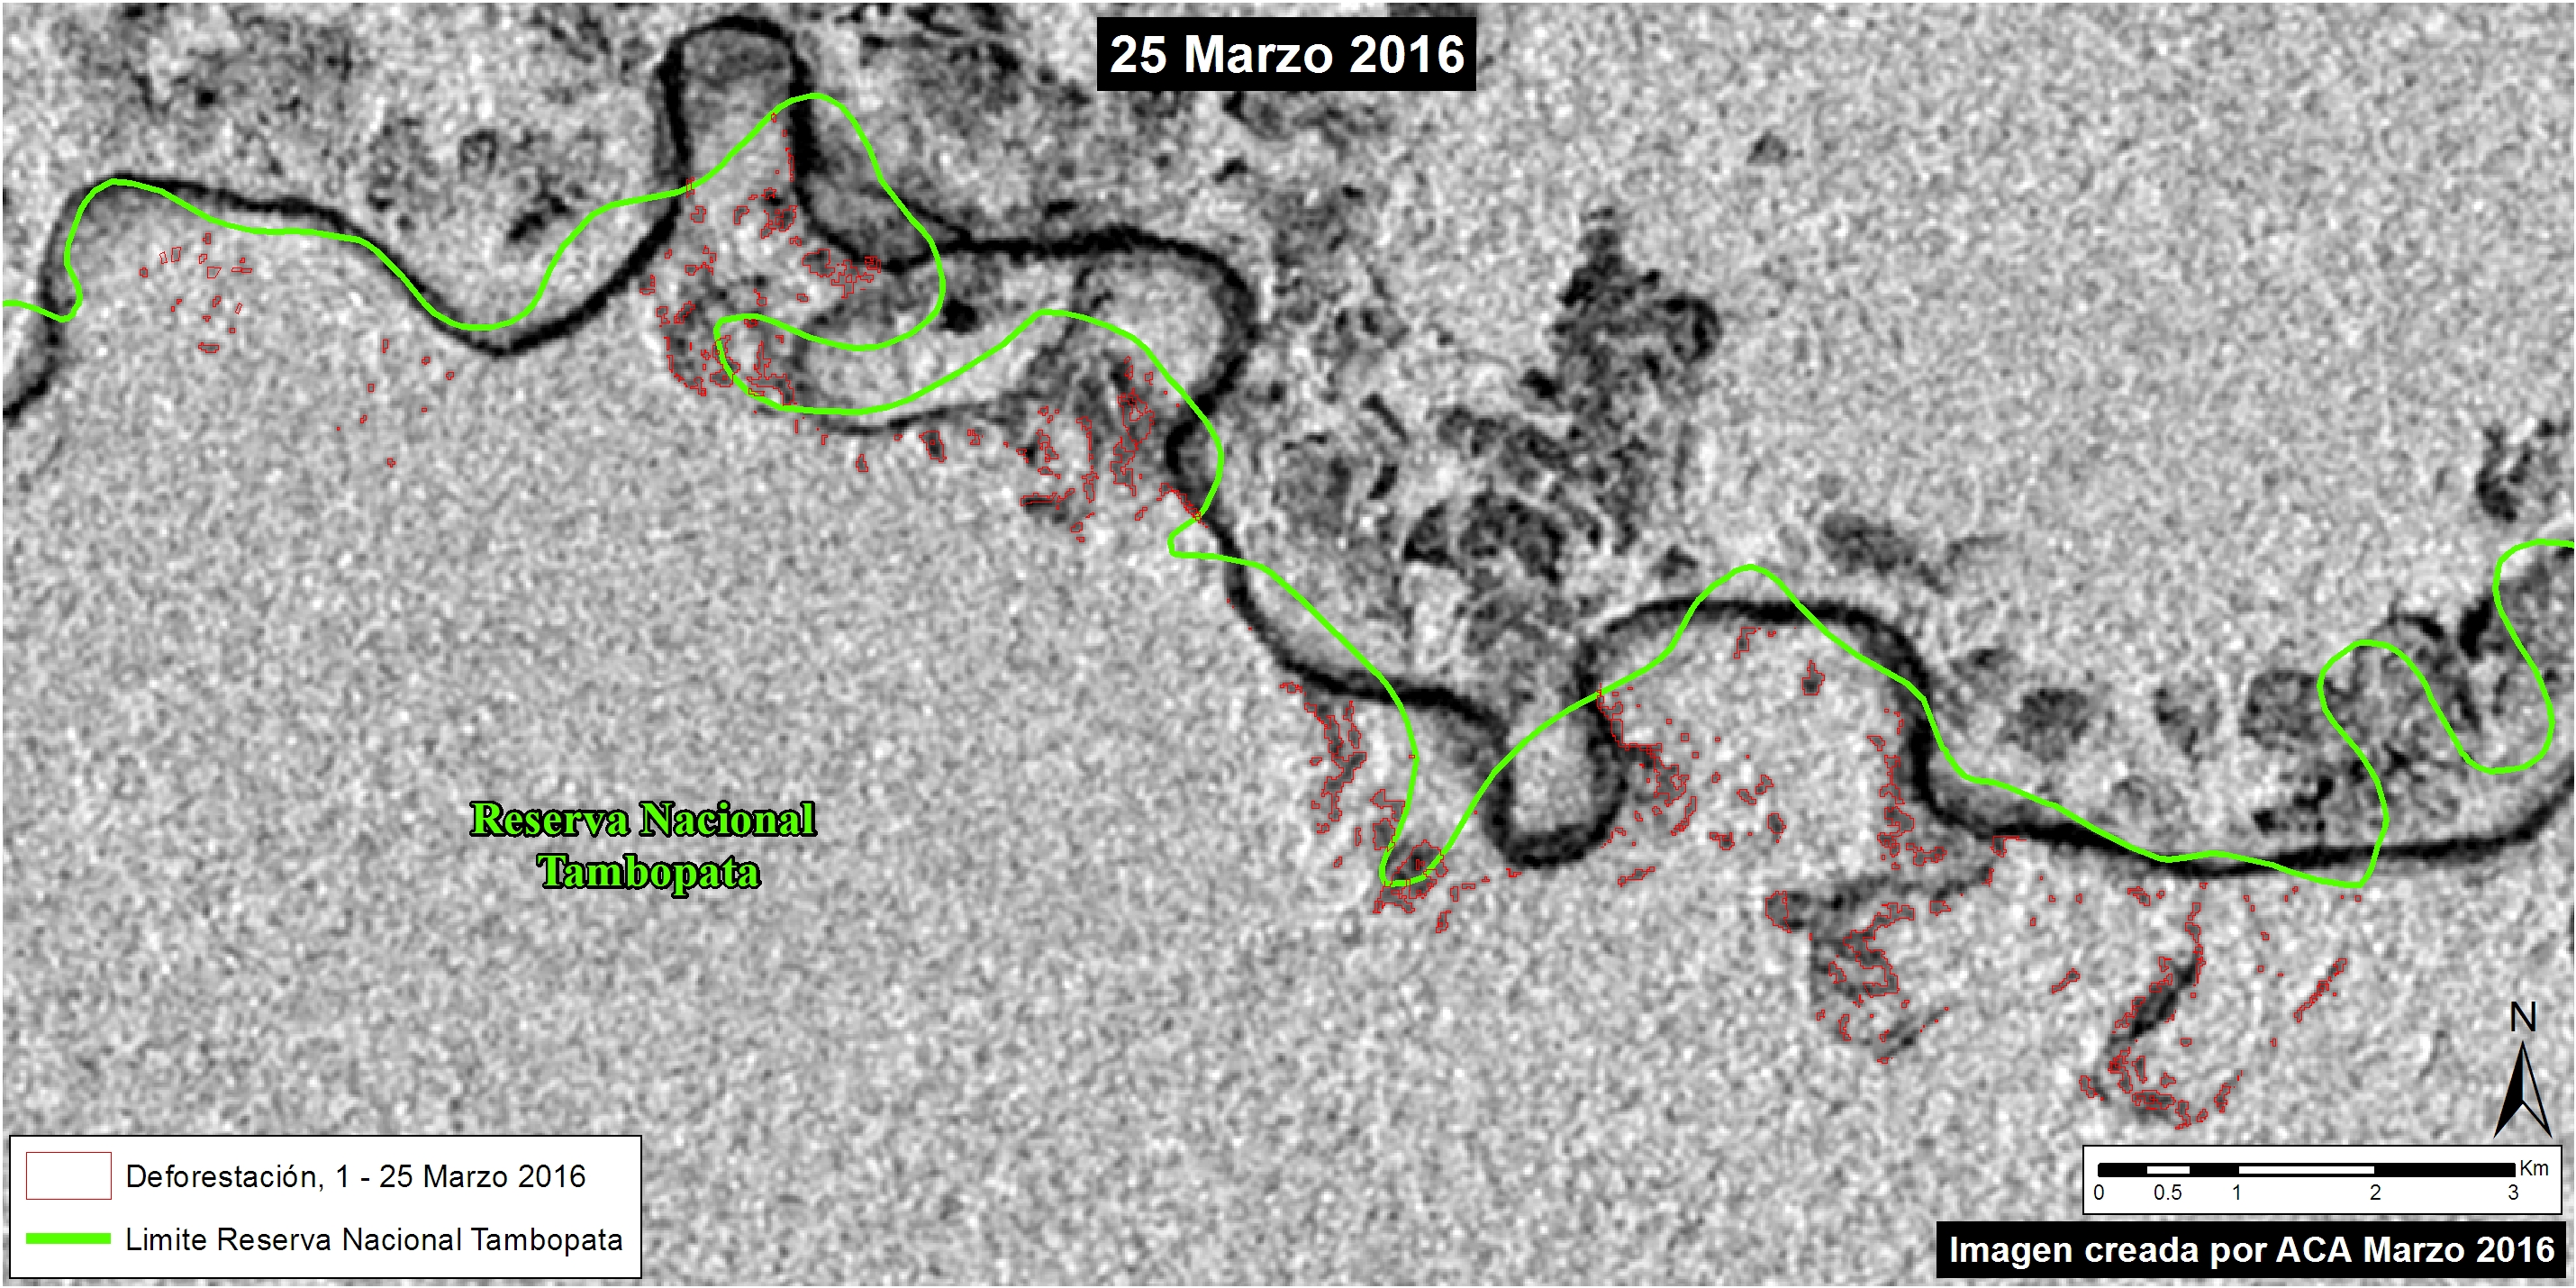
Inset D: Gold Mining in Madre de Dios

Peru_KD_D_3panel_v1
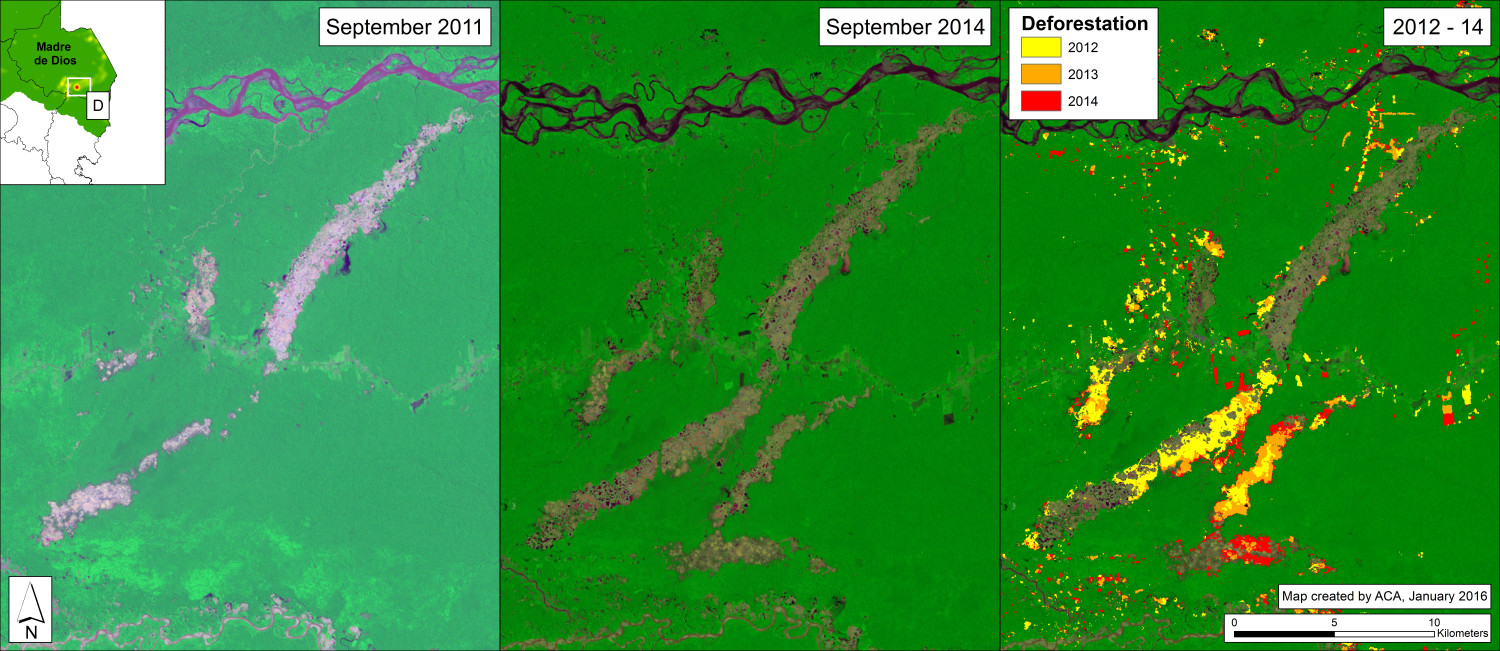
Image 25e. Deforestation for gold mining in southern Peru between September 2011 (left panel) and September 2014 (center panel) and cumulative 2012-14 (right panel). Data: USGS, PNCB/MINAM, Hansen/UMD/Google/USGS/NASA

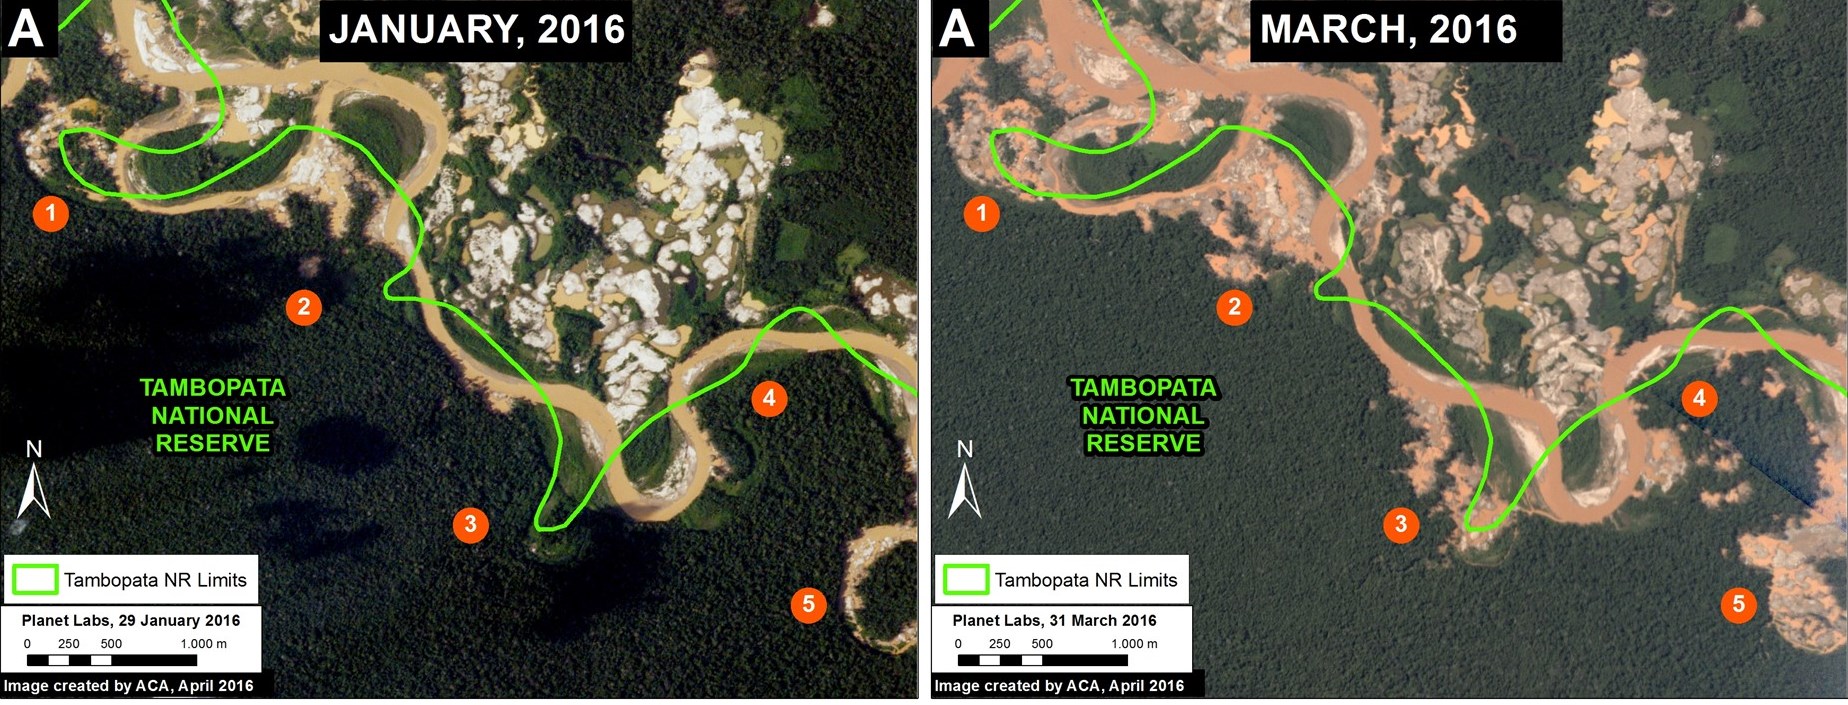
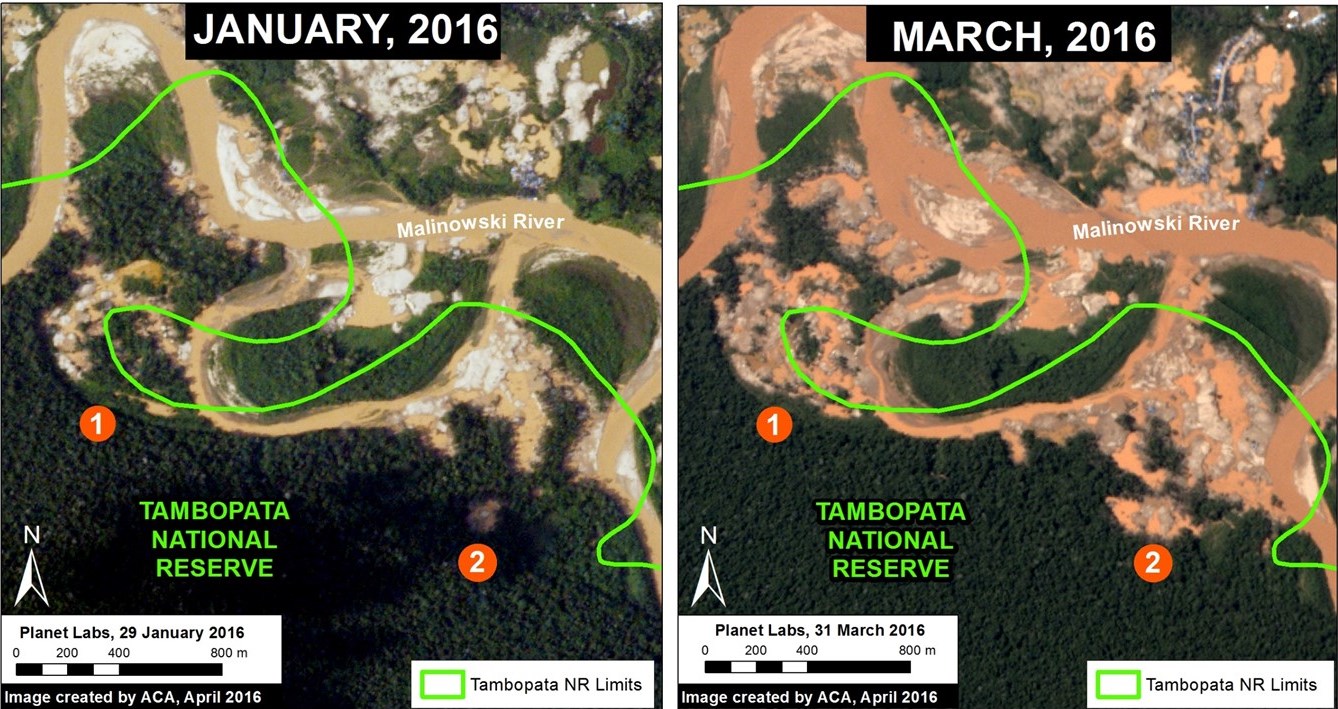
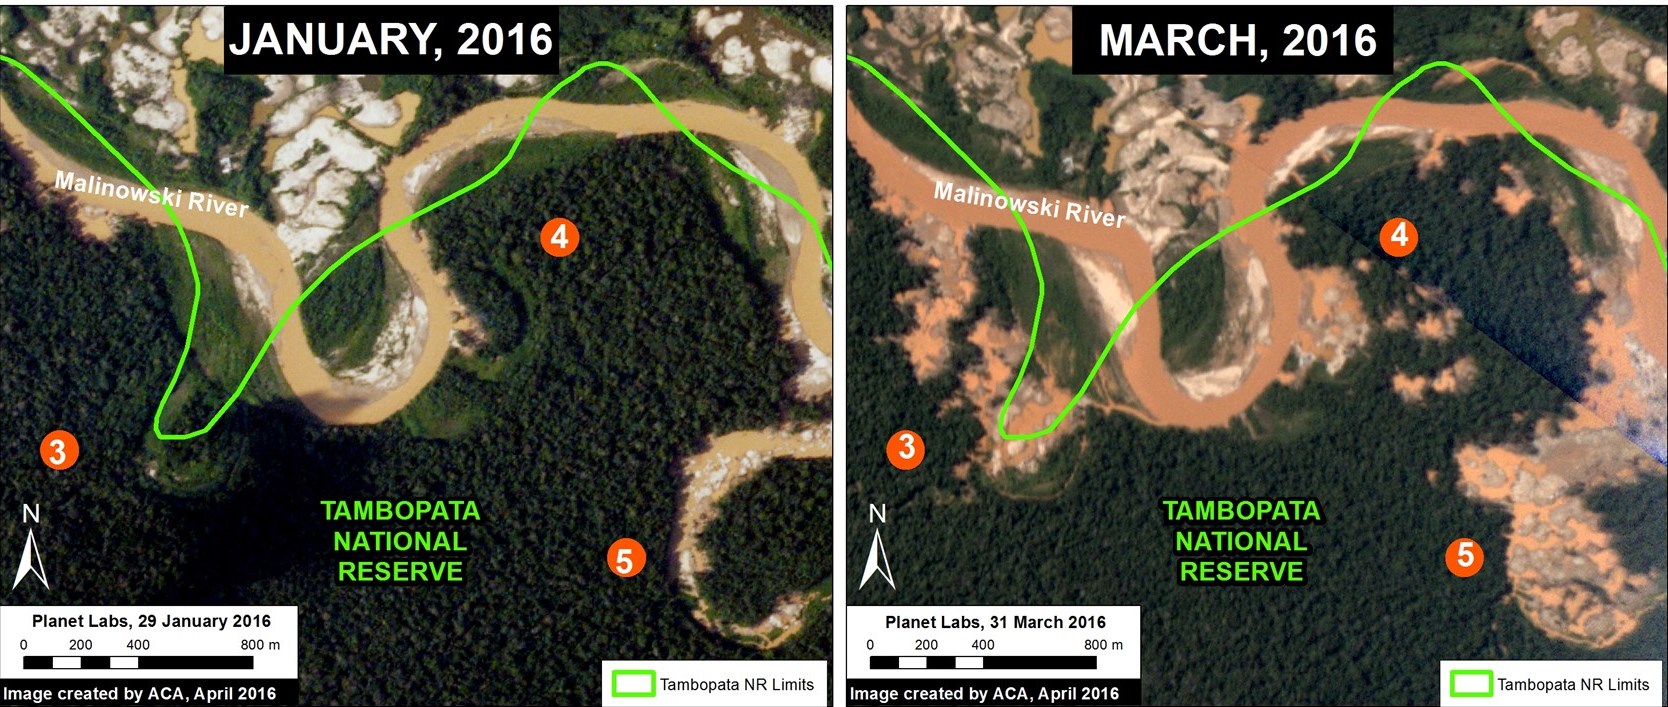
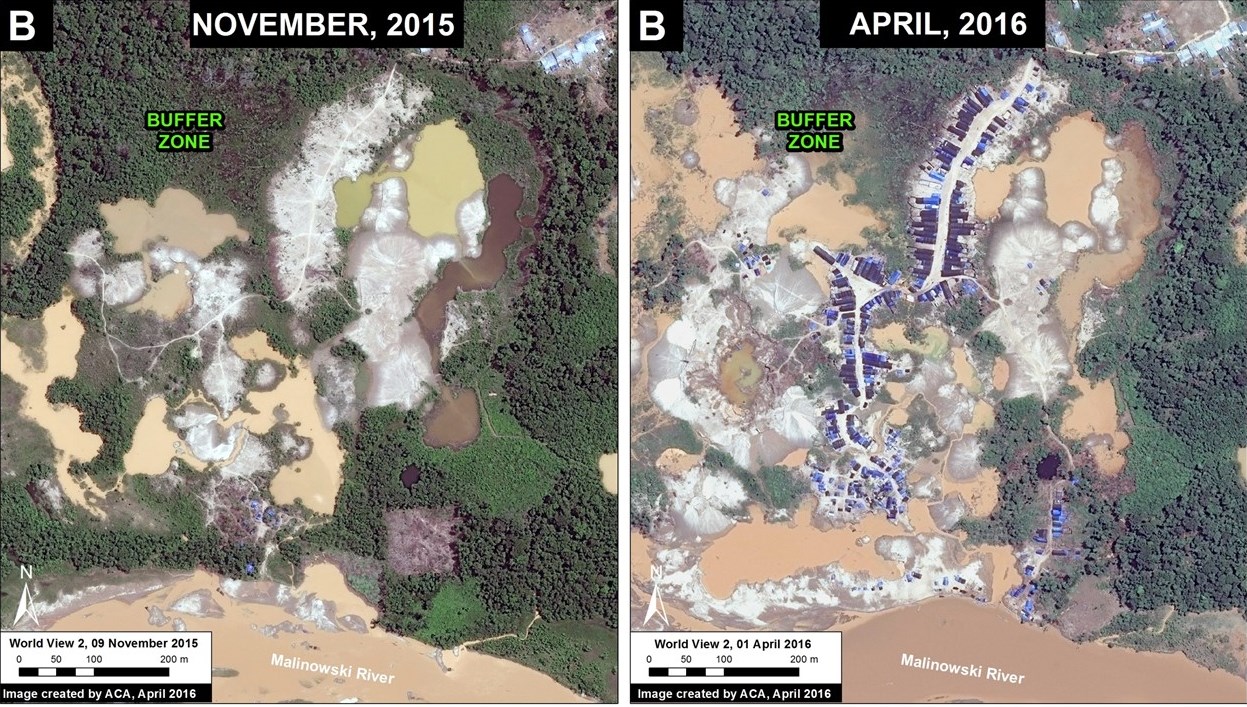
Inset D (from Image 25a) indicates the extensive illegal gold mining deforestation in the buffer zone of Tambopata National Reserve in the department of Madre de Dios. Image 25e highlights this area, showing the forest loss between September 2011 (left panel) and September 2014 (center panel; the lighter areas indicate recently cleared forests). The right panel shows the cumulative deforestation between 2012 and 2014 (4,738 hectares, or 11,700 acres). See MAAP #1 for more details.

It is important to emphasize that in this case, extensive deforestation continued in 2015. See MAAP #12 and MAAP #24 for more details.

Methodology

We conducted this analysis using the Kernel Density  tool from Spatial Analyst Tool Box of ArcGis 10.1 software. Our goal was to emphasize local concentrations of deforestation in the raw data while still representing overarching patterns of deforestation between 2012 and 2014. We accomplished this using the following parameters:

Search Radius: 15000 layer units (meters)

Kernel Density Function: Quadratic

Cell Size in the map: 200 x 200 meters (4 hectares)

Everything else was left to the default setting.

References

1MINAGRI-SERFOR/MINAM-PNCB (2015) Compartiendo una visión para la prevención, control y sanción de la deforestación y tala ilegal.

Citation

Finer M, Snelgrove C, Novoa S (2015) Deforestation Hotspots in the Peruvian Amazon, 2012-2014. MAAP: 25.