Mining News Watch #16

Mining News Watch #16 covers the time period March 17- June 10, 2015

Top Stories

  • The Peruvian government announced in May that new complementary regulations for the formalization process will be released in August.

  • To date, only 16 permits have been issued for formalized mining, affecting just 631 of the 58,835 miners that started the process in Puno.

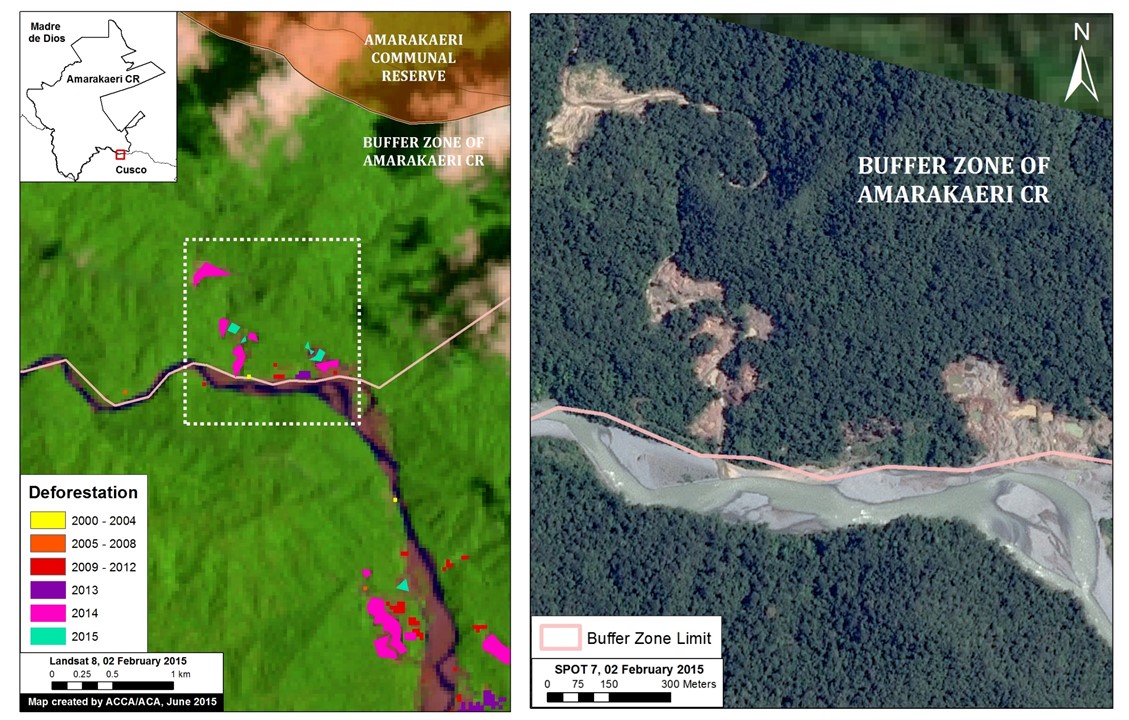
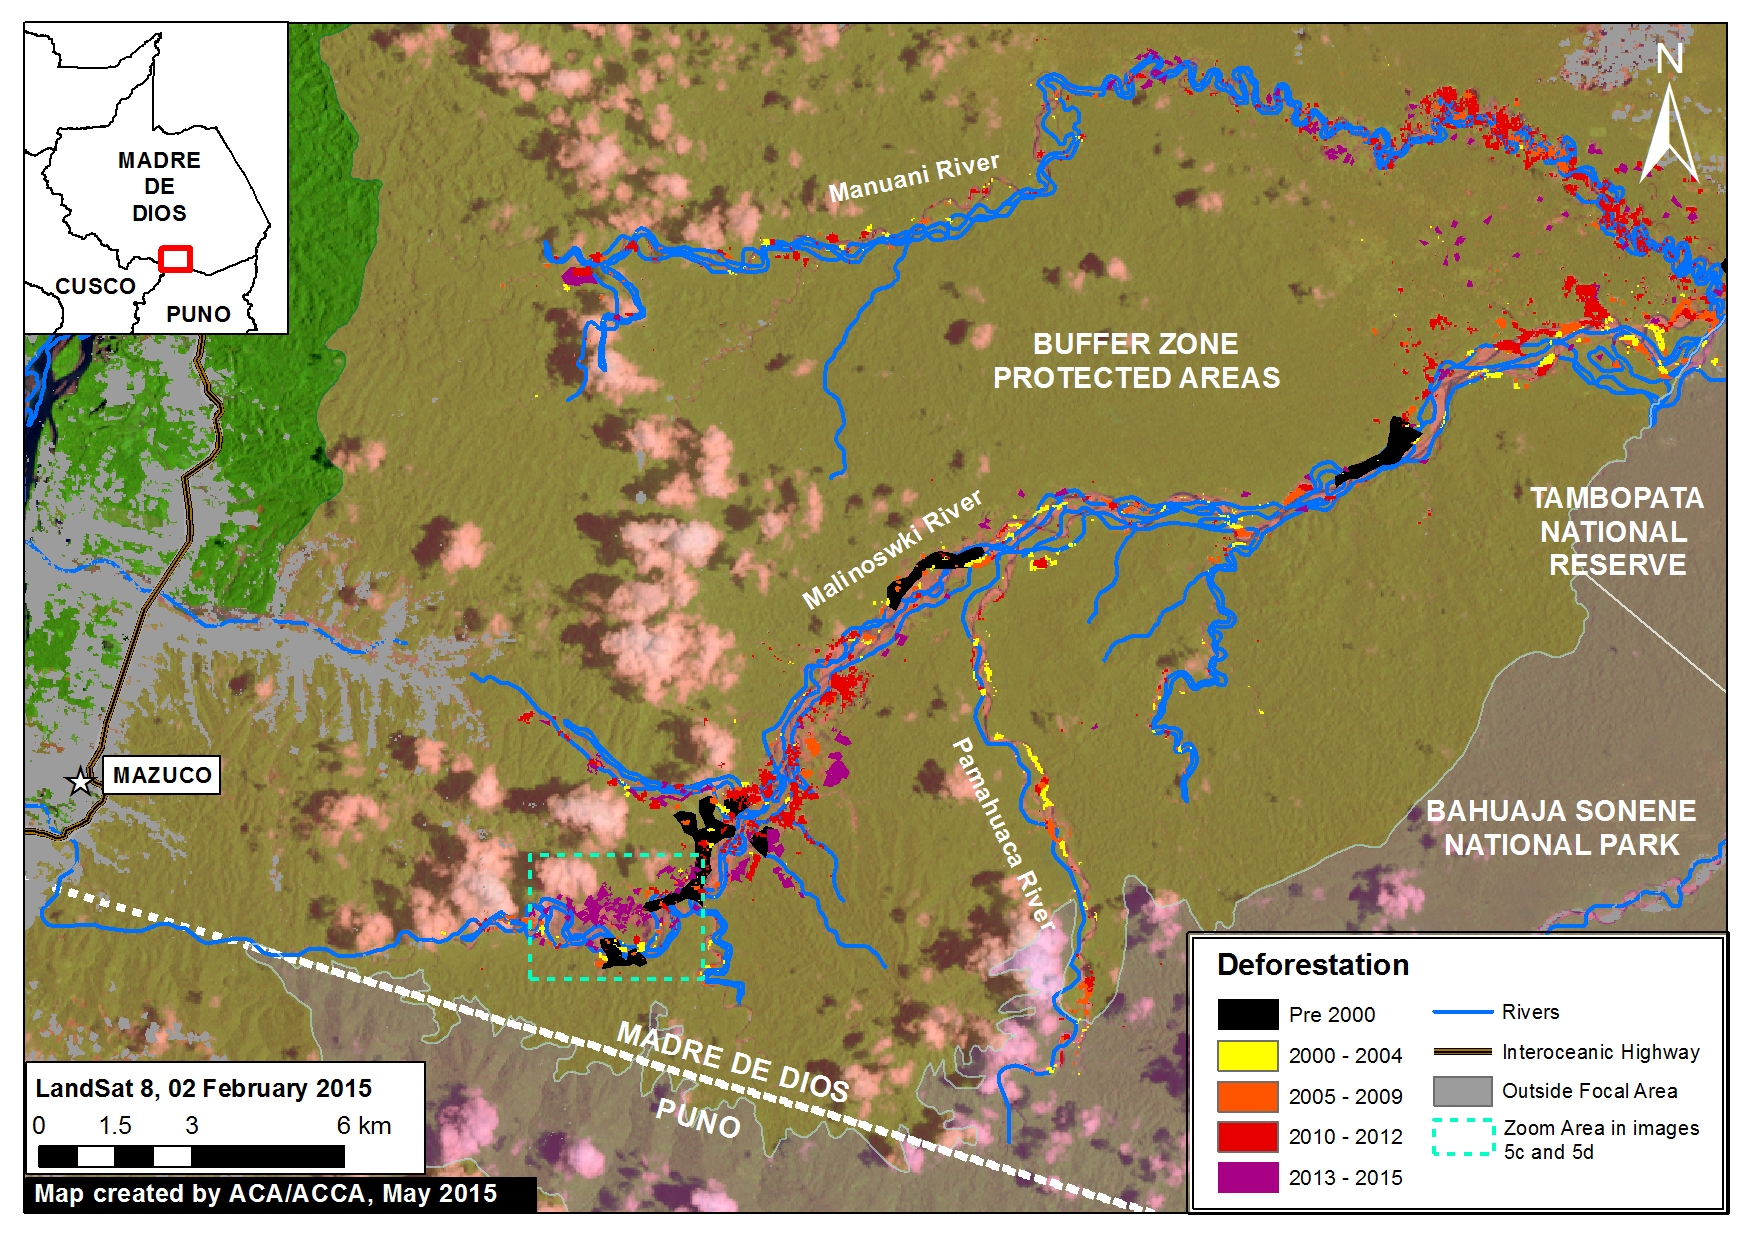
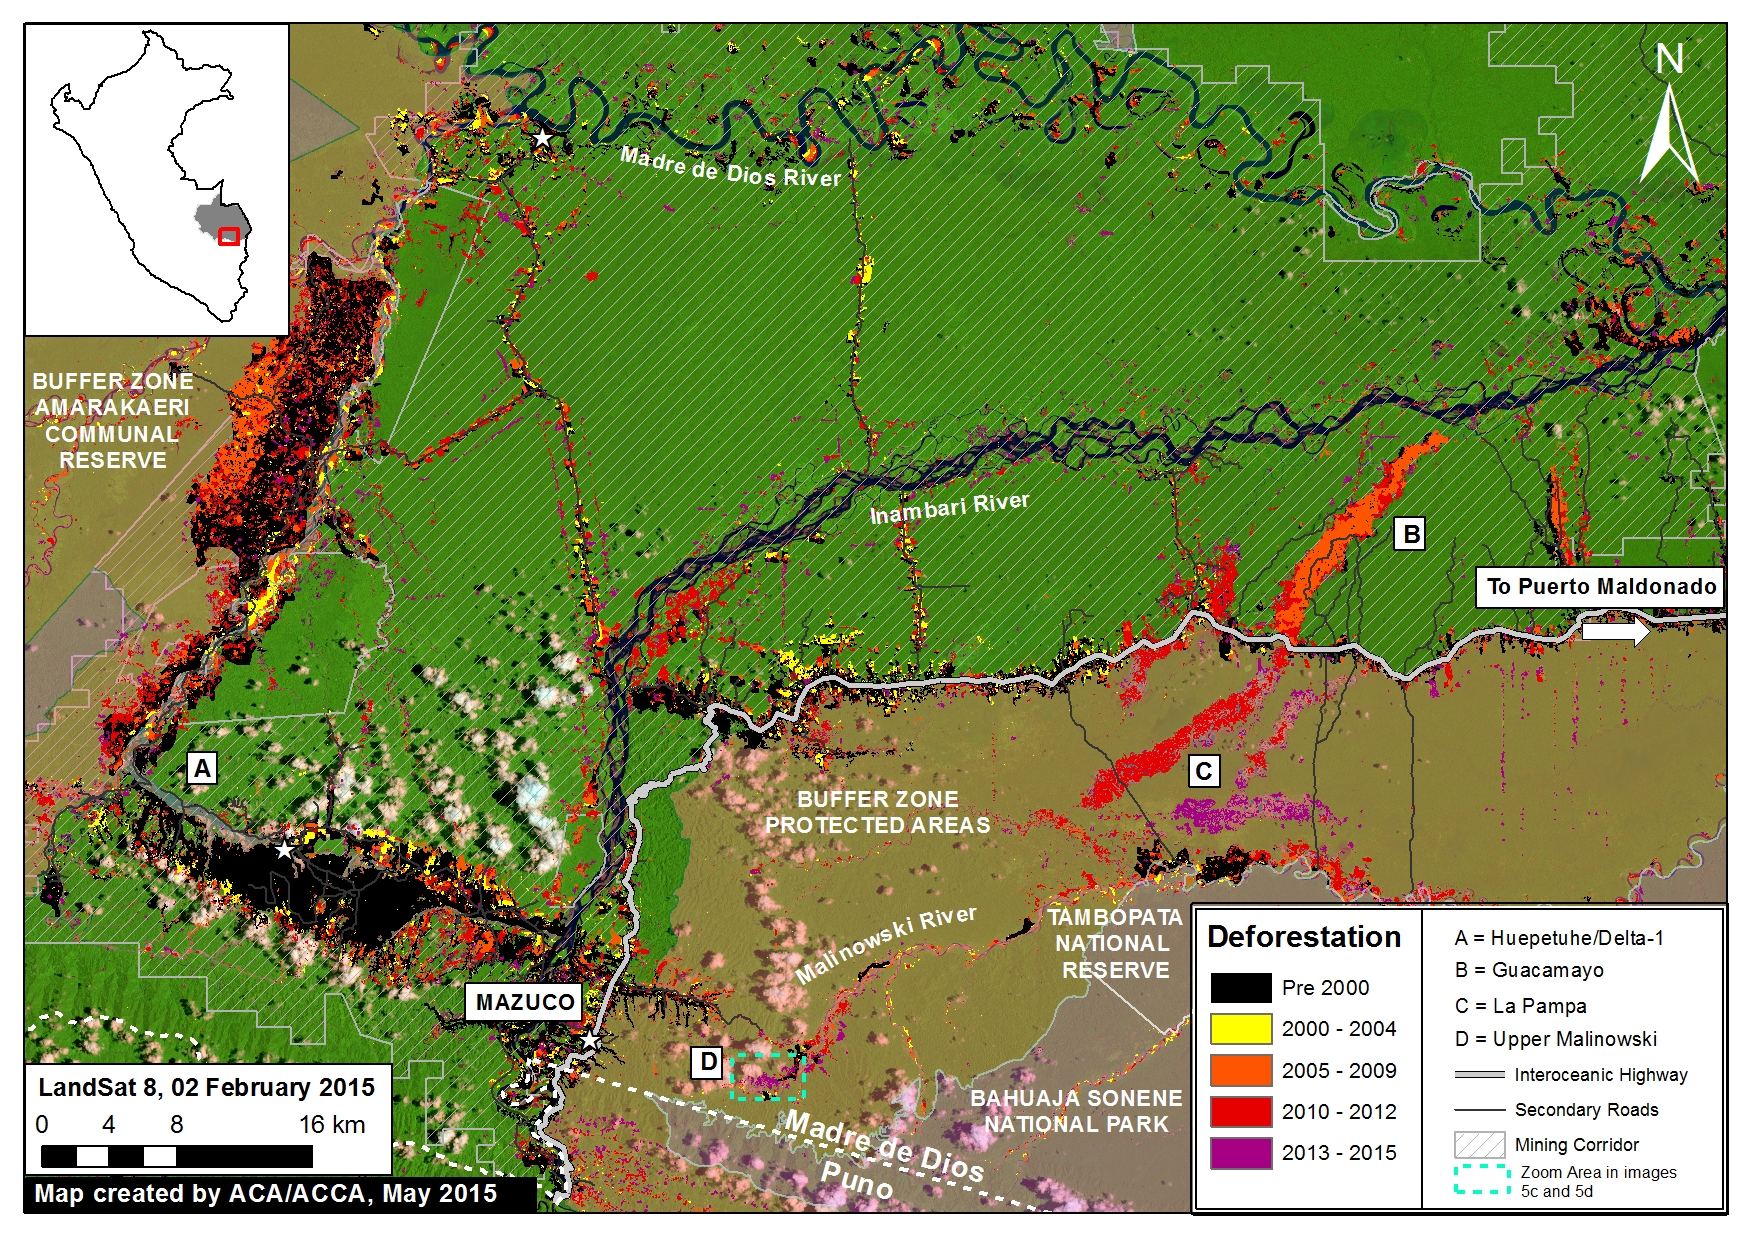
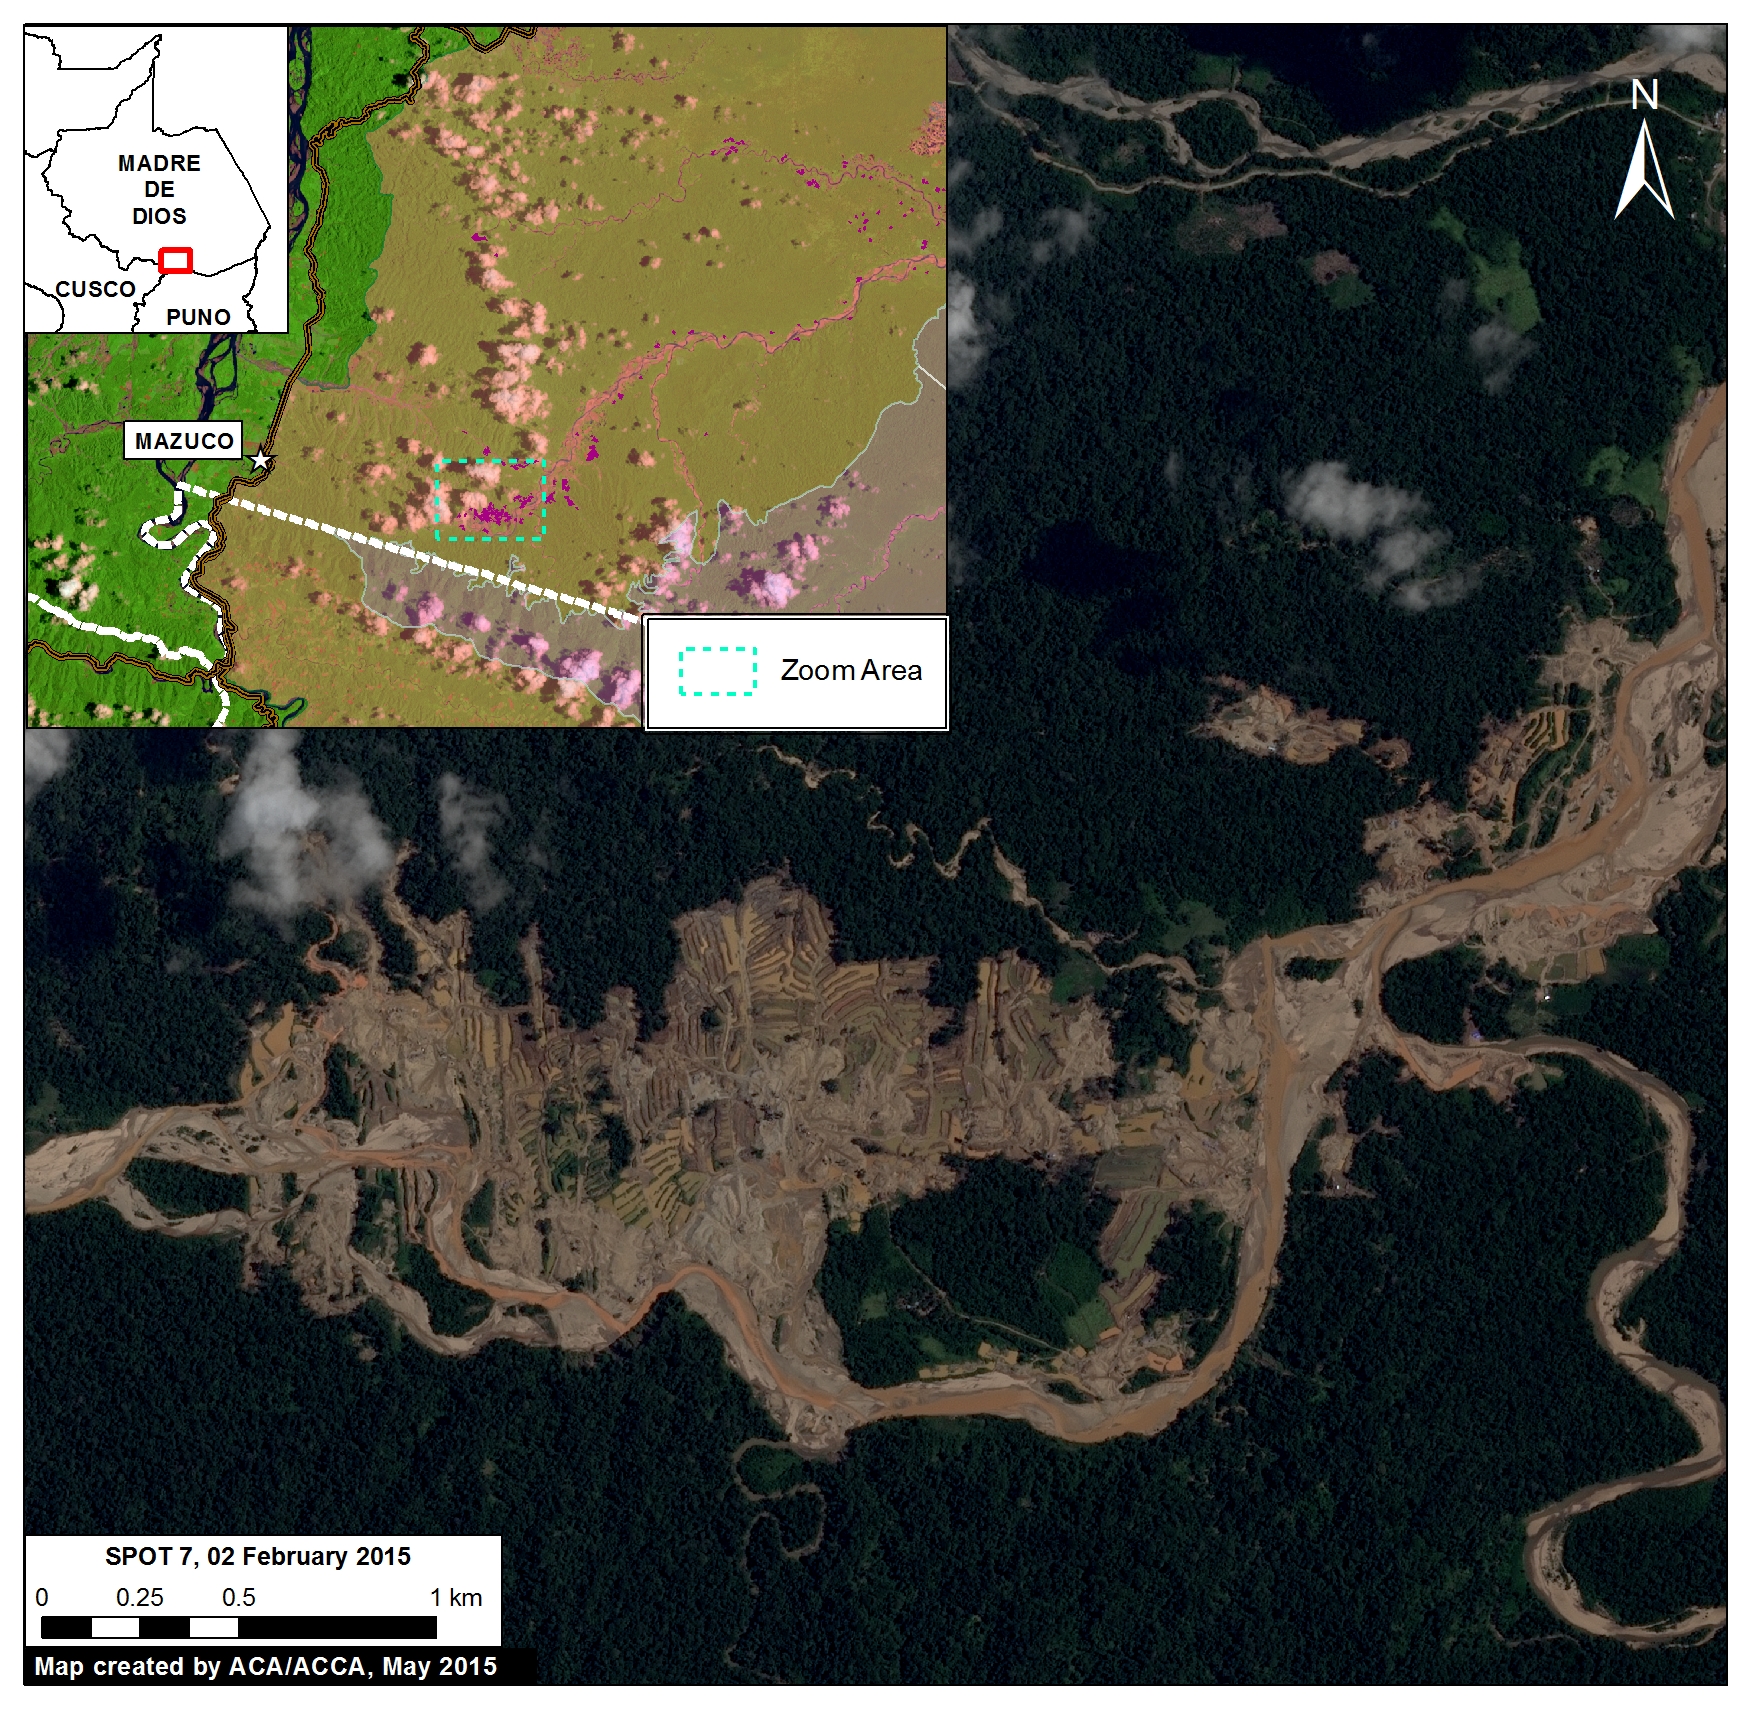
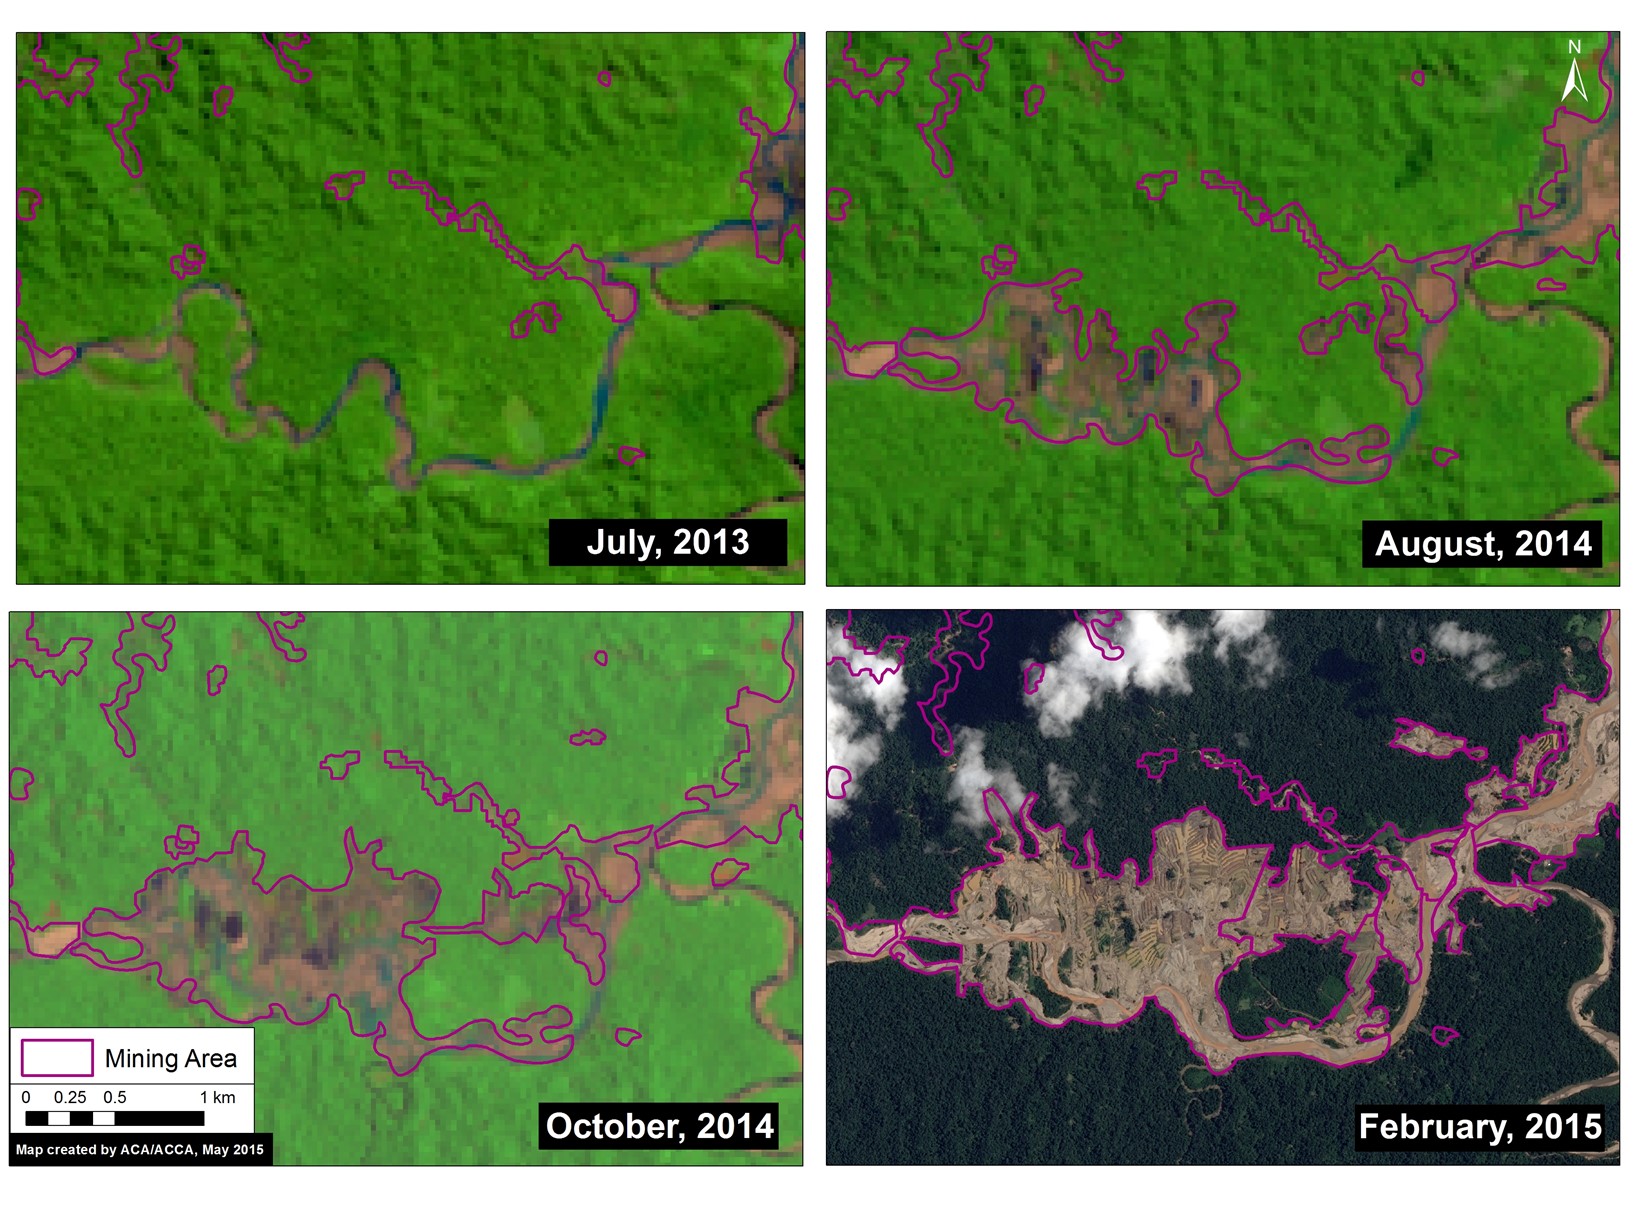
  • According to a pair of technical reports by the Amazon Conservation Association (ACA) and Conservaciόn Amazόnica (ACCA), 2,500 hectares has been deforested in the Tambopata National Reserve buffer zone due to illegal mining in the past two years.

  • The Ministry of the Environment (MINAM) reported that 40.5 tons of mercury enter the rivers of Madre de Dios annually.

  • The Foreign Relations Committee of the Peruvian Congress approved the Minamata Convention, and sent it to the full Peruvian Congress for final approval.

Recent Government Action

  • During a press conference in May, the Minister of Energy and Mines (MEM), Rosa María Ortiz, said that current regulations are not solving the illegal mining problem, and that in two months new complementary rules will be published to strengthen the formalization process. She stated that one focus of the new regulations will be to “achieve formalization for those that have not been able to do so.”[1]
  • The Regional President of Madre de Dios, Luis Otsuka, met with the Minister of the Interior, José Luis Pérez Guadalupe, in April to discuss possible actions to combat crime in Madre de Dios. The government is attempting to reduce illegal activity in Madre de Dios by increasing police patrols in critical zones and increasing containment of fuel used for illegal mining.[2] Guadalupe stated that the eradication of illegal mining is a priority for the national government. Along with the General Director of Police, Guadalupe visited the region to analyze the checkpoints and infrastructure designed to combat illegal mining in the area.[3]
  • The Peruvian government has invested over $63.5 million to be used for remediation projects in various areas damaged by illegal mining. Some of this money will focus on Madre de Dios, including the buffer zone of the Tambopata National Reserve.[4]

Formalization Process

  • The Office of the Ombudsman (La Defensoría del Pueblo) revealed that the Peruvian government has thus far only issued 16 permits for formalized mining, affecting about 631 miners, contrasting with the 58,835 informal miners that started the formalization process in Puno. The difficult and expensive “saneamiento” (restructuring) process, which involves the legal ordering of informal mines, coupled with the lack of human and financial resources, are some of the cited reasons for the slow formalization process.[5]
  • A new response to the low completion rates is the use of mediators to create a space of dialogue for the miners.[6]
  • During a recent visit by Madre de Dios Regional President Luis Otsuka with Peruvian President Ollanta Humala in March, Otsuka criticized the President for the illegal mining situation in the country. Otsuka stated that he “will continue to sell [his] gold on the black market” and that “in the past three years not one miner was formalized [in Madre de Dios], only six deaths. Things will not change if the laws are not modified.” Otsuka also expressed his frustration that current regulations seem to target small miners who only want to progress in the formalization process.[7]
  • Environmental specialist Juan Víctor Ortega Vargas found that in Puno, the only department in Peru with any formalized mining companies, the high cost of performing the Corrective Environmental Management Instrument (IGAC) is the main limitation for illegal miners attempting to complete the process. The IGAC is the fifth (out of six) step of the formalization process and is basically a streamlined Environmental Impact Assessment designed to prevent and control environmental impacts. However, performing the IGAC costs each company approximately $10,000.[8,9]
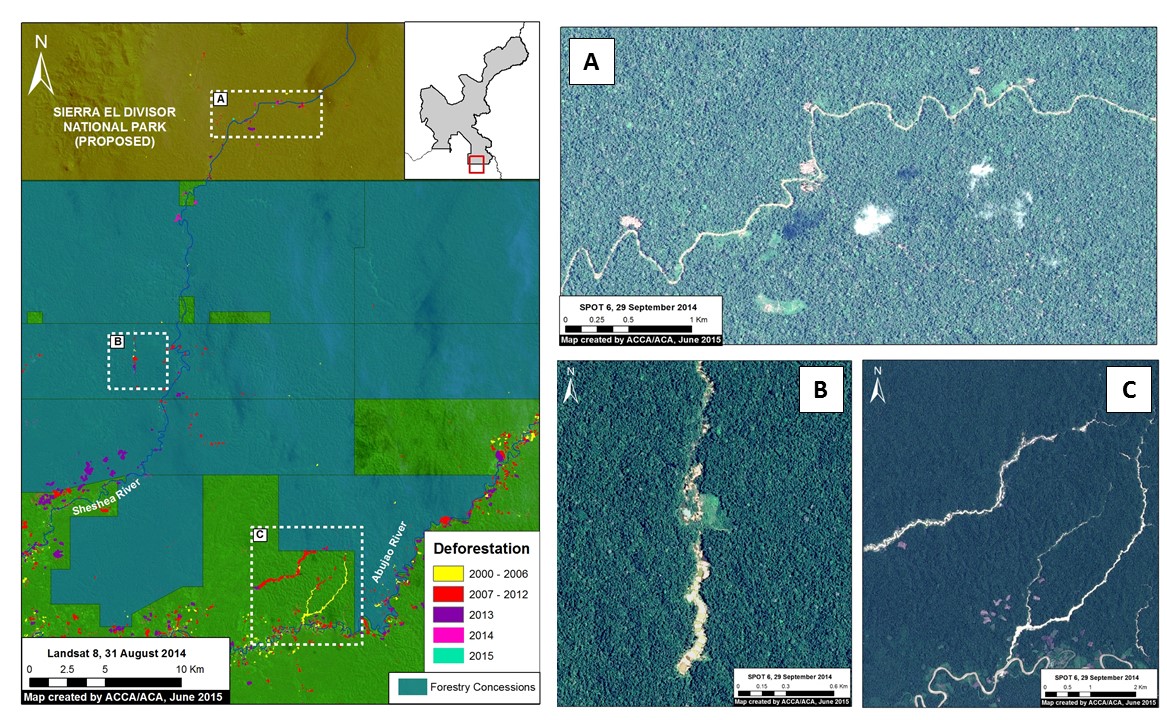
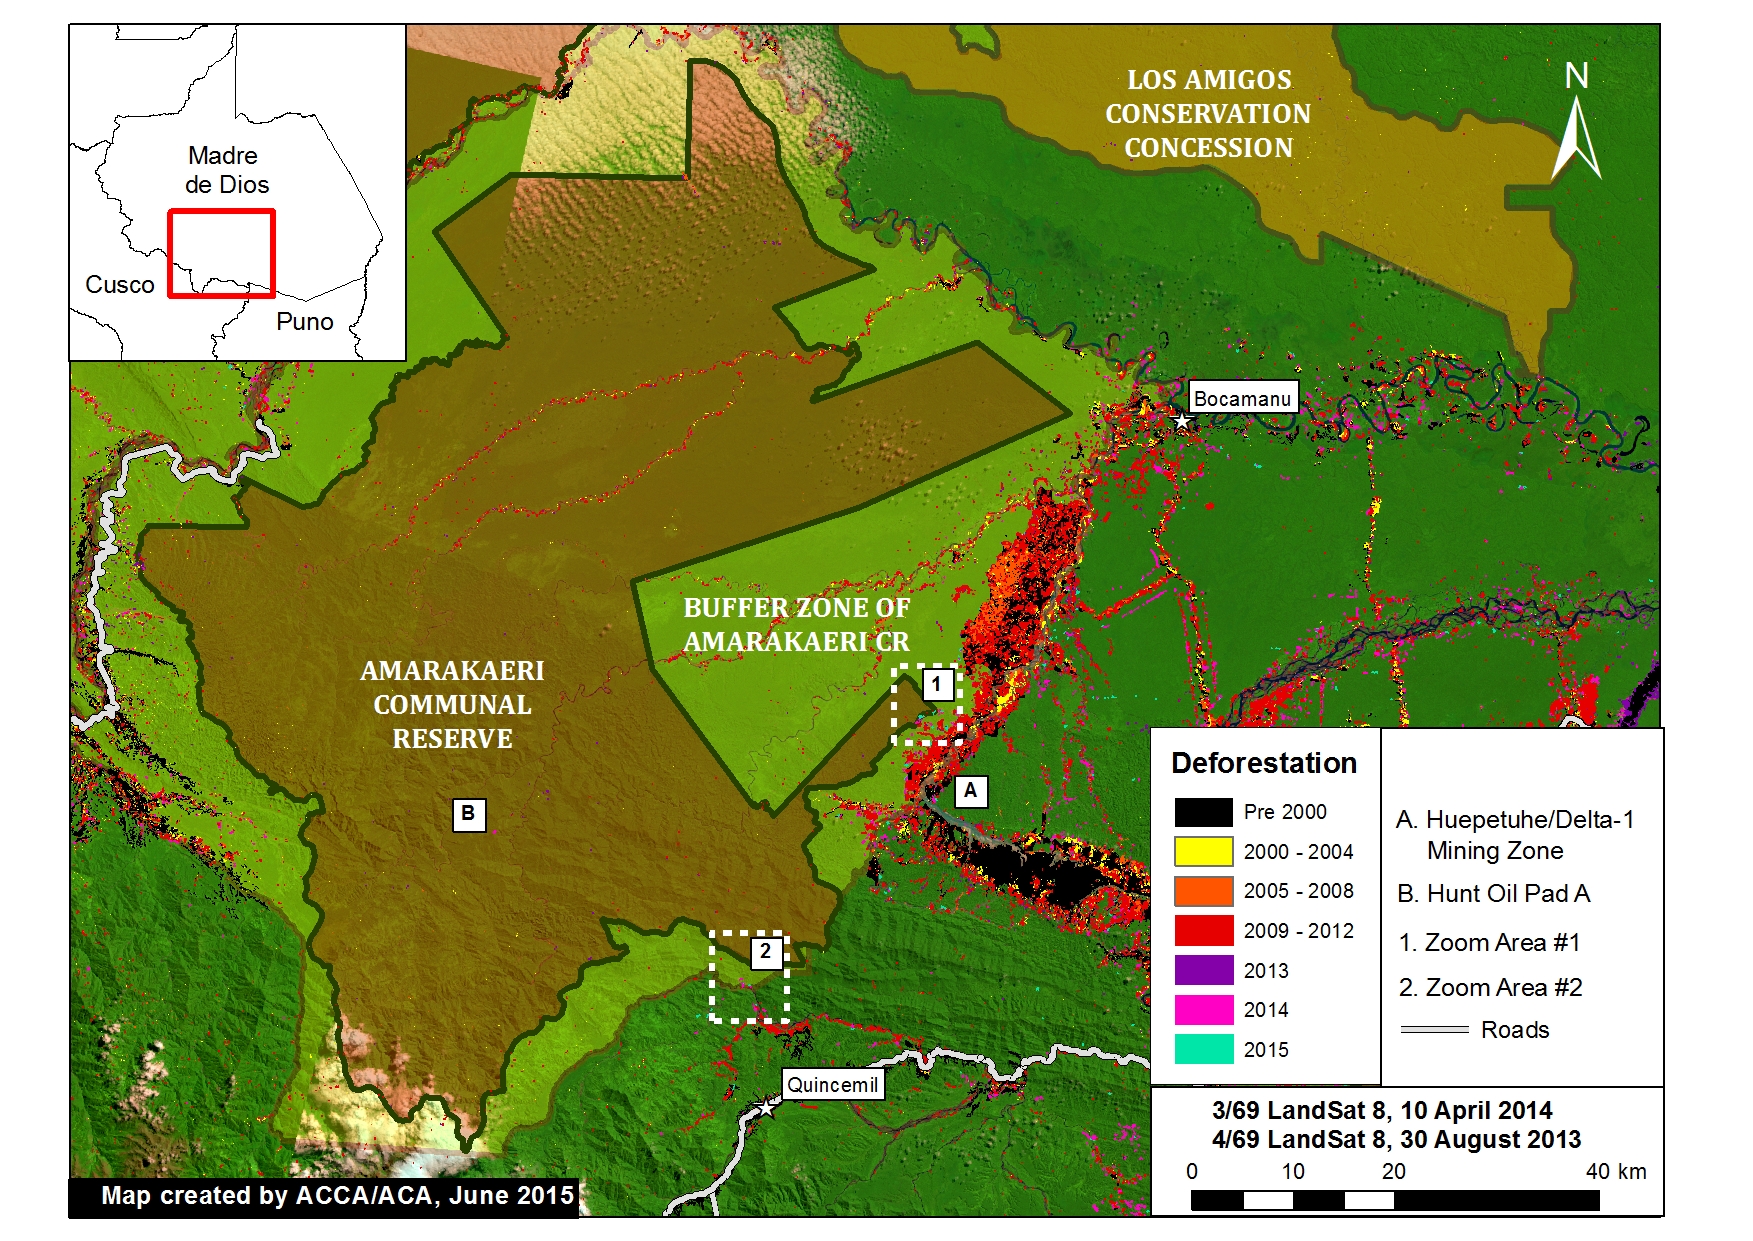
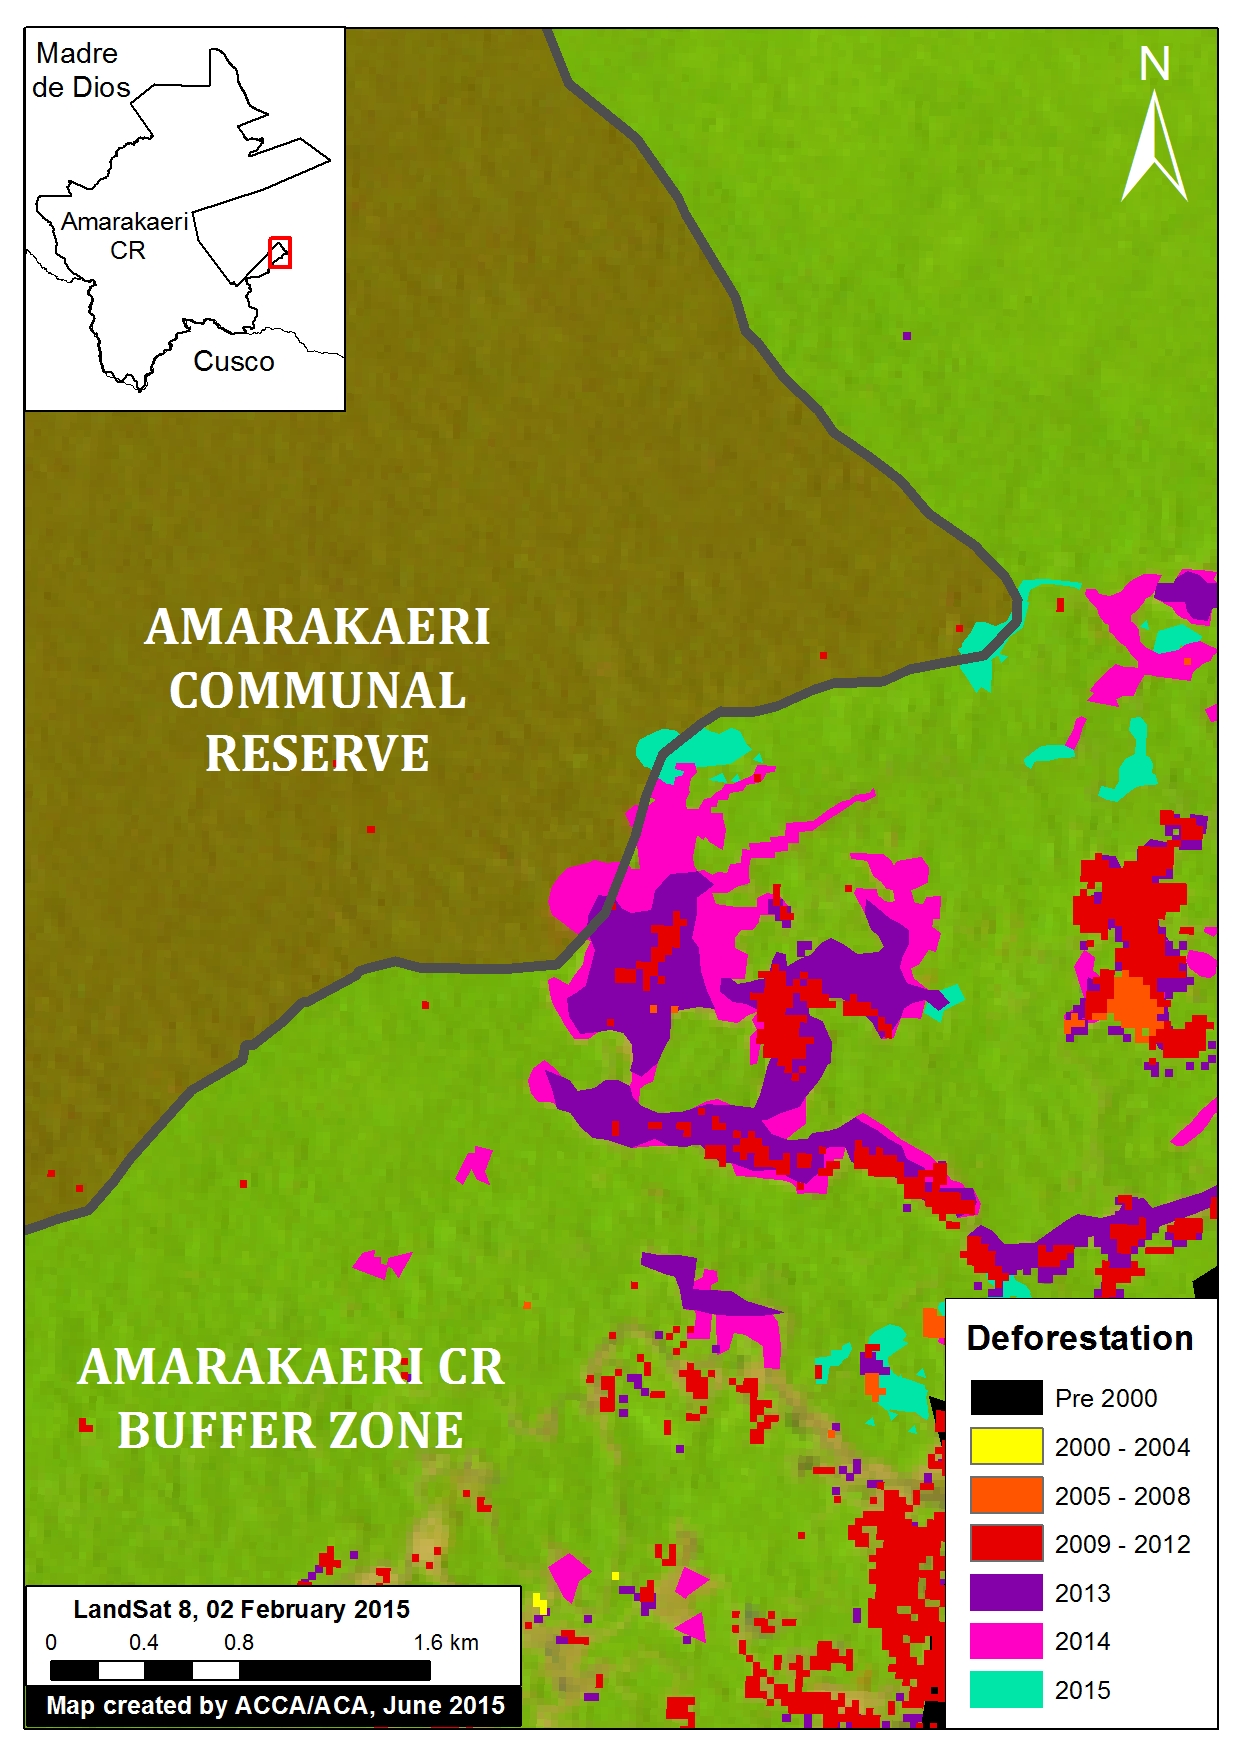
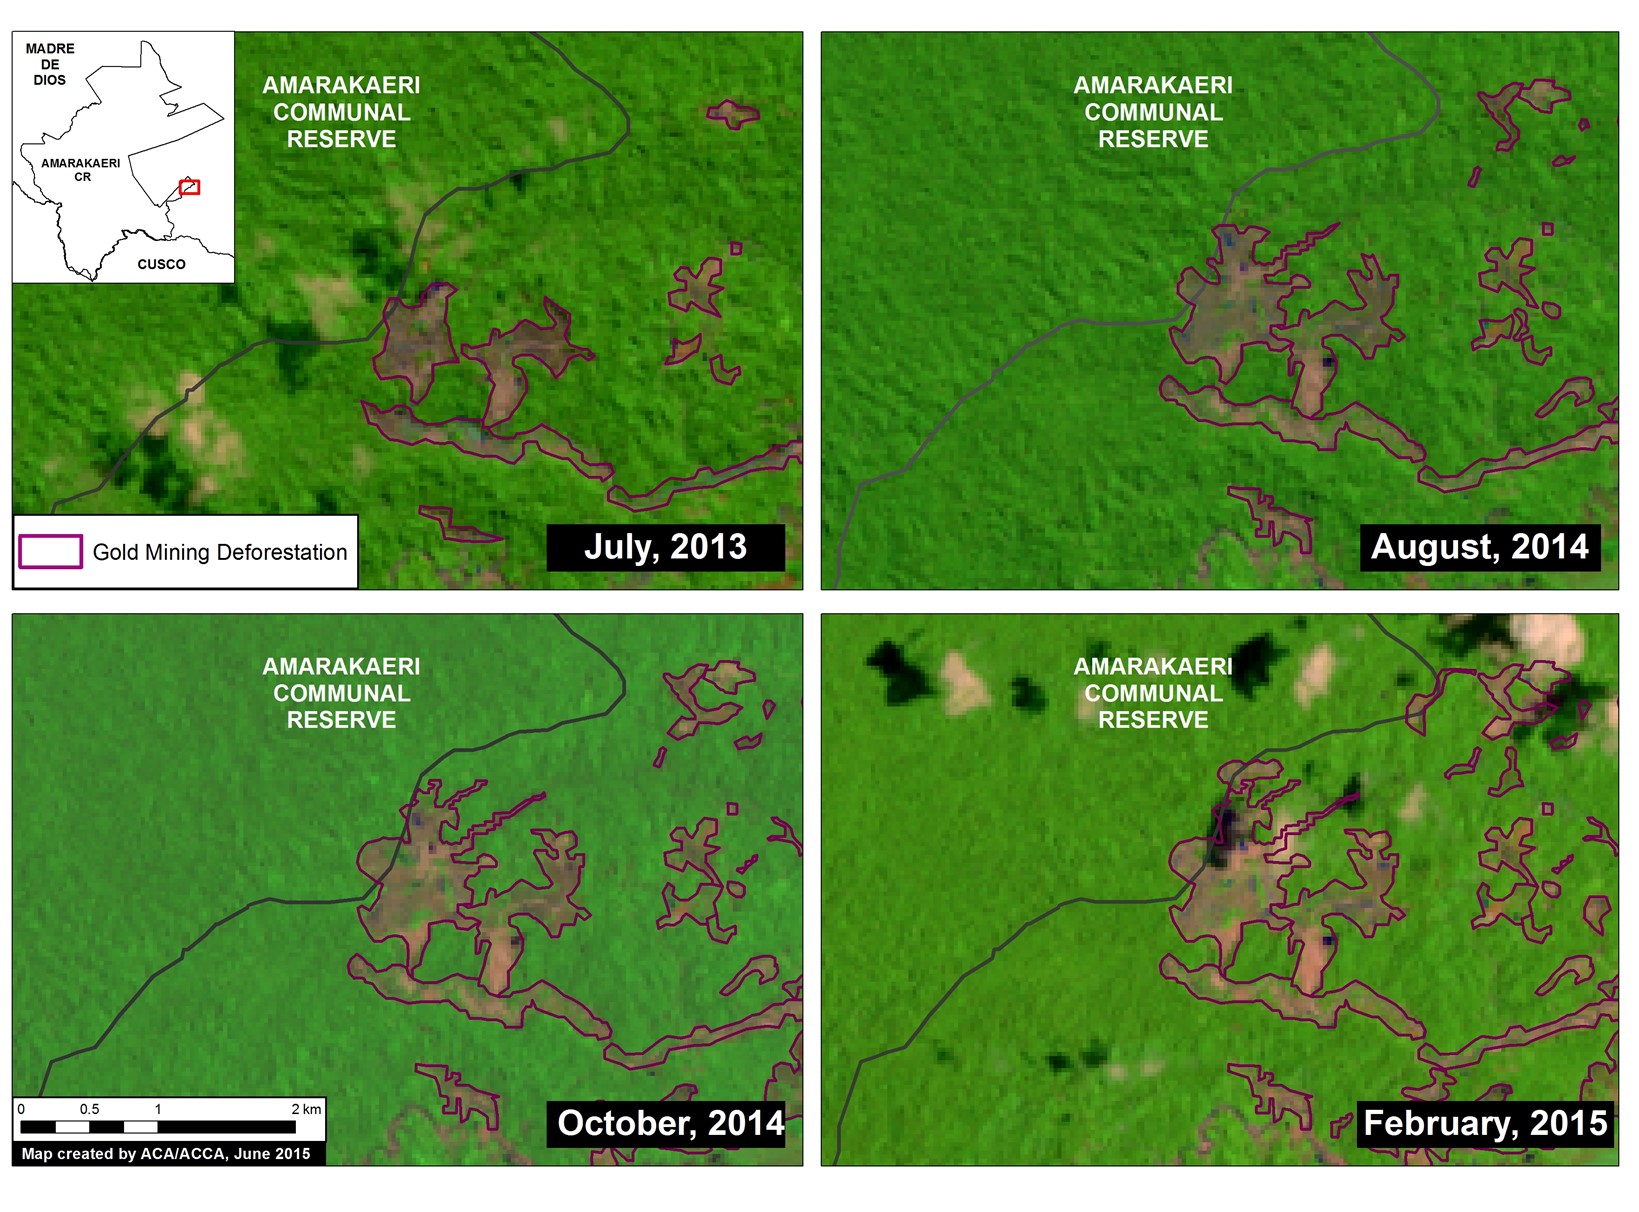
Deforestation

  • A pair of technical reports published by the ACA and ACCA revealed that a total of 2,500 hectares have been deforested due to gold mining in the Tambopata National Reserve buffer zone over the past two years.[10, 11, 12]

Mercury Regulation

  • The Vice Minister of MINAM, Mariano Castro, released a statement in March saying that as a result of illegal mining, a total of 40.5 tons of mercury enters the rivers of Madre de Dios each year. This quantity comprises 5.6% of global mercury emissions, which reached 721 tons in 2010. Castro also announced that MINAM will be working with the U.S. embassy and the Blacksmith Institute to reach an agreement on financing further studies about reductions in mercury emission.[13] The U.S. State Department gave the Blacksmith Institute one million dollars to conduct mercury emission reduction research in Madre de Dios.[14]
  • In May, the Foreign Relations Committee of the Peruvian Congress approved the Minamata Convention, a global treaty that seeks to avoid further damage to human health and the environment from mercury. This is a strong sign that Congress will ratify the convention.[15] The Office of the Ombudsman submitted a formal request to Congress on June 4th asking them to formally approve Minamata.[16]

  • A regional workshop on reducing mercury use took place in Lima at the end of March. The workshop was intended to encourage more countries to ratify the Minamata Convention. Government officials specializing in the fight against illegal mining from Peru, Colombia, Brazil, and Ecuador participated in the workshop, sharing experiences and successful practices.[17]
  • In March, Luis Fernández, a tropical ecologist from Stanford, interviewed with El Comercio in order to raise support for the Minamata Convention. He discussed the results from his 2013 research on mercury pollution in the Amazon, and warned that 250,000 Peruvians are currently exposed to mercury contamination.[18]
  • Police agents seized more than 15 kg of mercury that was being transported illegally near a mining zone in the Inambari district of Madre de Dios.[19]

Other

  • The Third Civil Chamber of the Superior Court of Lima sided with the Agency for Environmental Assessment and Enforcement (OEFA), saying that OEFA regulations are constitutional and do not infringe on any rights to miners and mining companies. This ruling gives OEFA power to combat illegal mining and to determine responsibility for environmental damage.[20]
  • Currently, around 100 kg of illegal gold travel across the border from Peru to Bolivia every week, where the gold can then be sold to U.S. and European markets.[21] Peru and Bolivia met in May to discuss tactics for protecting their shared border from criminal activity related to illegal mining, particularly the smuggling of fuel across the border. Peru promised to share its experience with Bolivia, which initiated its mining laws only a year ago.[22]
  • The Peruvian Society for Environmental Law (SPDA) and the International Union for Conservation of Nature (IUCN) launched a blog called “Las rutas del oro” (Routes of Gold) that will provide information on various aspects of illegal mining in different Amazonian countries.[23]
  • According to the Peruvian Financial Intelligence Unit (UIF), between January and December 2014, illegal mining generated $2,765 million, surpassing illegal drug trafficking, which generated $78 million.[24] The Office for National Electoral Processes reports that money from both mining and drug trafficking is making its way into the electoral campaigns of political organizations.[25]
  • The indigenous community of Tres Islas, located in Madre de Dios, demanded that the government fulfill a sentence forbidding outsiders to be within their designated indigenous land. The goal is to protect indigenous land from illegal gold mining. The claim is directed to the Constitutional Court, which unanimously declared in 2012 that the tribes have the right to control their lands.[26]

Notes: The ACA Mining News Watch focuses mostly on issues pertaining to the Peruvian Amazon and may not cover issues related to non-Amazonian parts of the country. We would like to credit ProNaturaleza’s “Observatorio Amazonia” as our primary resource for articles related to illegal mining in Peru.


ACA contact for Comments/Questions:  Matt Finer (mfiner@amazonconservation.org)

Citation:

DeRycke E, Finer M (2015). Peru Mining News Watch Report #16. Amazon Conservation Association. https://www.maapprogram.org/2015/06/mining-news-watch-16/

Image #7: Sierra del Divisor – Growing Threats Highlight Importance of Creating National Park

As the Peruvian Government decides whether the Sierra del Divisor Reserved Zone should become a National Park, here in Image of the Week #7 we offer this new analysis of the current deforestation patterns of the area. A Reserved Zone classification, which was applied to Sierra del Divisor in 2006, is a temporary measure to protect an area of biological importance until the government is able to determine a final designation. National Park status represents the strongest possible final designation and would lead to strengthened legal protections to confront the growing array of threats we document below (namely, illegal coca, logging, mining activities).

Sierra_divisor_MAAP_7a_v7_zoomareas
Image of the Week 7a. Deforestation patterns within and around the proposed Sierra del Divisor National Park. Key data sources: MINAM, SERNANP, USGS, IBC, MINAGRI, Hansen/UMD/Google/USGS/NASA.

Key Findings:

We have detected several deforestation fronts within and around the current Sierra del Divisor Reserved Zone. These findings demonstrate the need for the stronger legal protections that would come with National Park status.

Most notably, we detected within and around the current  Reserved Zone (and proposed National Park):

– Deforestation for illegal coca cultivation within the southwestern section (Zoom #1).

– New logging roads near both the southern and northwestern sections (Zooms #1 and #2).

– Deforestation associated with illegal logging camps within the southeastern section (Zoom #3). This illegal logging is within the Isconahua Territorial Reserve, an official land classification designed to protect the territory of indigenous peoples in isolation.

– Gold mining near the southern section (Zoom #3).

Background: From Reserved Zone to National Park

Sierra_divisor_MAAP_7o_v4p
Image 7b. The current (left panel) and potential (right panel) scenario for the Sierra del Divisor region

Image 7b illustrates the current (left panel) and potential (right panel) scenario for the Sierra del Divisor region.

The vast majority of the Reserved Zone would become a National Park under the current proposal pending before the Peruvian government. The proposed Sierra del Divisor National Park covers a vast area (1,354,485 hectares) in the far eastern Peruvian Amazon (departments of Loreto and Ucayali), adjacent to the Brazilian border.

Note that several sections on the western side of the Reserved Zone would not be included, however. Part of the excluded area, in the northwest, will remain as a Reserved Zone and may be part of a future proposal for a Regional Conservation Area known.


Coca and Logging Roads in Southwestern Section (Zoom #1)

Sierra_divisor_MAAP_7b_Zoom1_v5_p
Image 7c. Zoom #1: Enhanced view of the southwestern section of the proposed national park. Panels A and B are high resolution satellite images of the areas indicated on the main map on the left. Key data sources: MINAM, SERNANP, ACCA, Hansen/UMD/Google/USGS/NASA, USGS, SPOT 6.

Image 7c provides an enhanced view of the southwestern section of the proposed National Park. It highlights an expanding deforestation cluster — 130 hectares between 2013 and 2014 — on the upper Calleria River (see “A” on the map). Our analysis indicates that illegal coca cultivation is the cause of this deforestation. Panel A shows a high resolution satellite image of this deforestation.

Also note that a new road is being constructed near the southwestern park boundary (see “B” on the map). We presume it to be a logging road because it passes through a forestry concession. Most notably, there was significant new construction in both 2013 and 2014, indicating that the road is in active use. In addition, high resolution imagery (see panel B) shows road width of about 30 meters, indicating that it may be designed for larger vehicles and heavy machinery.

Logging Road Approaching Northwestern Section (Zoom #2)

Sierra_divisor_MAAP_7c_Zoom2_v4
Image 7d. Zoom #2: Enhanced view of the northwestern section of the proposed national park. Key data sources: USGS, SERNANP, GOREL.

Image 7d provides an enhanced view of the northwestern section of the proposed National Park, showing the construction of another new logging road. We presume that it is a logging road because it is passing through forestry concessions with no other obvious destination. Most notably, there was new construction in 2013, 2014, and 2015 indicating that is an active logging road.

Also note the expanding deforestation, especially in 2014, outside of the town of Contamana, indicating the importance of creating a Regional Conservation Area in this area adjacent to the proposed National Park.


Illegal Logging and Gold Mining in Southeastern Section (Zoom #3)

Sierra_divisor_MAAP_7d_Zoom3_v7_p
Image 7e. Zoom #3: Enhanced view of the southeastern section of the proposed national park. Panels A, B, and C are high resolution satellite images of the areas indicated on the main map on the left. Key data sources: MINAM, SERNANP, ACCA, Hansen/UMD/Google/USGS/NASA, USGS, and SPOT 6.

Image 7e provides an enhanced view of the southeastern section of the Proposed National park. It highlights that both illegal logging (see “A” on the map) and gold mining (see “B” and “C” on the map) are present.

It is important to emphasize that this southeast section is part of the Isconahua Territorial Reserve administered by the Ministry of Culture. This is an official land designation in favor of indigenous peoples in isolation, to protect their rights, habitat, and the conditions that ensure their existence and integrity as a people.

Regarding the illegal logging, our analysis indicates the deforestation within the proposed National Park along the upper Shesha River is caused by a series of logging camps. Panel A shows a high resolution satellite image of this deforestation. This illegal logging is within the Isconahua Territorial Reserve.

Regarding the gold mining, there are two principal zones causing deforestation, one along the Shesha River and the other along the Abujao River. Panels B and C show high resolution images of these two mining areas. The headwaters of both river systems are born in the proposed park.

SERNANP Response

In response to this article, SERNANP (the Peruvian protected areas agency) issued this statement:

La Zona Reservada Sierra del Divisor es un espacio de carácter transitorio a cargo del Servicio Nacional de Áreas Naturales Protegidas por el Estado (SERNANP).  La zona aledaña a esta área acoge a 14 Comunidades Nativas, las cuales aprovechan los servicios ecosistémicos en beneficio de más de 500 familias.

En los últimos años la ZRSD ha logrado mejores resultados en su lucha contra la tala ilegal enfrentando esta amenaza sobre todo en espacios de ámbito de las reservas territoriales, y continúa alerta por la deforestación asociada al cultivo ilícito de coca que se reporta en esta parte del país.

En ese marco, se ha reportado desde el 2011 a los sectores correspondientes para su incorporación dentro del Plan Anual de Reducción del Espacio Cocalero de tal forma que se haga frente a esta amenaza de manera estratégica.

Data Description:

Background map is a mosaic of four Landsat 8 images (30 m resolution) from August and September 2014. Any variation of green indicates forest cover. Note there is some scattered cloud cover. Data is from USGS.

Protected areas are darker green. Data for the proposed Sierra del Divisor National Park comes from its technical document (expediente técnico).

Black indicates areas that were deforested as of 2000 according to data from the Peruvian Environment Ministry (MINAM 2009). Yellow (2000-2006), red (2007-2012), and purple (2013) indicate areas that were deforested from 2000 to 2013 according to data published by Hansen et al. 2013 (Science 342: 850–53; Data download).

Pink and teal indicate areas that were deforested between 2014 and early 2015 based on our analysis of Landsat imagery using CLASlite forest monitoring software.

Citation

Finer M, Novoa S (2015) Sierra del Divisor: Growing Threats Highlight Importance of Creating National Park. MAAP Image #7. Link: https://www.maapprogram.org/2015/06/image-7-sierra-del-divisor/

Image #6: Expanding Gold Mining Deforestation Enters Amarakaeri Communal Reserve (Madre de Dios, Peru)

Recall that in Image of the Week #1 and Image of the Week #5 we documented how gold mining deforestation continues to expand within the Department of Madre de Dios, Peru (in the areas known as La Pampa and Upper Malinowski, respectively). Here, Image of the Week #6 documents how expanding deforestation from the mining zone known as Huepetuhe/Delta-1 is now entering the Amarakaeri Communal Reserve, an important Peruvian protected area that is co-managed by indigenous communities and Peru’s National Protected Areas Service (known as SERNANP).

Our analysis shows that gold mining deforestation, expanding from Huepetuhe/Delta-1, entered the southeast corner of the reserve in 2013 and expanded in 2014 and 2015. We also show that gold mining deforestation is spreading within the reserve’s south-eastern buffer zone.

2015_MDD_Amarakaeri_MAAP_6a_v8
Image of the Week 6a. Deforestation detected within and around the Amarakaeri Communal Reserve and its buffer zone. Zoom Area #1 indicates focal area in Images 6b and 6c, while Zoom Area #2 indicates focal area in Image 6d. Key data sources: MINAM, SERNANP, ACCA, USGS, IBC, Hansen/UMD/Google/USGS/NASA.

Key Findings:

According to our CLASlite analysis, deforestation entered the southeast corner of the Amarakaeri Communal Reserve in 2013 and expanded in 2014 and 2015 (see Zoom #1 below). Additional analysis revealed that the driver of this deforestation was gold mining due to the pattern and appearance of the forest loss.

We also detected increasing gold mining deforestation within the reserve’s south-eastern buffer zone between 2014 and 2015 (see Zoom #2 below). See below for more details.

We also detected a small amount of deforestation in 2014 from Hunt Oil’s drilling of Pad A within the reserve (see “B” in Image 6a). Note that overall deforestation from this gas exploration project has been very low because the company did not build an access road.

Gold Mining Deforestation Enters the Reserve (Zoom Area #1)

2015_MDD_Amarakaeri_MAAP_6b_v7 (1)
Image 6b. Zoom Area #1 provides an enhanced view of the deforestation within the southeast section of Amarakaeri Communal Reserve and its surrounding buffer zone. Key data sources: MINAM, SERNANP, ACCA, Hansen/UMD/Google/USGS/NASA, USGS.


Image 6b is a zoom view of the deforestation within the southeast section of Amarakaeri Communal Reserve and its surrounding buffer zone (see Zoom Area #1 in Image 6a for context).

Here, one can more clearly see how the gold mining deforestation entered the southeast corner of the reserve in 2013 and expanded in 2014 and 2015.

Total gold mining deforestation within this section of the Reserve is currently 11 hectares. Although this is currently only 1% of the Reserve’s total area, it represents a growing trend that may worsen.

Note that all of the rest of the deforestation in the image is within the reserve’s surrounding buffer zone.


Satellite Image Time-series of Deforestation Entering the Reserve (Zoom Area #1)

2015_MDD_Amarakaeri_MAAP_6c_v4
Image 6c. Satellite (Landsat 8) image time-series (2013 – 2015) of deforestation within the southeast section of the Amarakaeri Communal Reserve. Note that all four panels show the same location over time. Key data sources: USGS, SERNANP.

To better understand the deforestation dynamics over time within the southeast corner of the Amarakaeri Communal Reserve, we created a satellite (Landsat 8) image time-series. As seen in Image 6c, gold mining deforestation within the reserve is first seen in July 2013, and then slowly expands on several fronts until February 2015, the last good Landsat image for the area. Note that all four panels show the same location. Also note that all area in each panel outside the reserve is within its official buffer zone.

Gold Mining Deforestation Encroaching Upon Another Part of the Reserve (Zoom Area #2)

2015_MDD_Amarakaeri_MAAP_6e_v8
Image 6d. Zoom view of the deforestation within the south-eastern buffer zone of the Amarakaeri Communal Reserve. Left panel shows deforestation results data and right panel shows high resolution SPOT 7 imagery for the area in white dashed lines. Key data sources: MINAM, SERNANP, ACCA, Hansen/UMD/Google/USGS/NASA, USGS, and SPOT 7 from Airbus.

Image 6d shows how gold mining deforestation is encroaching on another part of the south-eastern section of the reserve (see Zoom Area #2 in Image 6a for context). As seen in the left panel, the deforestation within the buffer zone began expanding most notably in 2014 and 2015.

To confirm the driver of the deforestation, we acquired high resolution satellite imagery (SPOT 7 with 1.5 m resolution). As seen in the right panel of Image 6d, the pattern of the recent deforestation is characteristic of gold mining, and not other possible drivers such as agriculture.

Data Description:

Background map is a mosaic of two Landsat 8 images (30 m resolution) from April 10, 2014 and August 30, 2013. Any variation of green indicates forest cover. Note there is some scattered cloud cover. Data is from USGS.

Protected areas data is from SERNANP. Dark green indicates an established Peruvian national protected area or conservation concession and yellow-green indicates an official protected area buffer zone.

Black indicates areas that were deforested as of 2000 according to data from the Peruvian Environment Ministry (MINAM 2009). Yellow, orange, and red indicate areas that were deforested from 2000 to 2012 (each color covers a four year period) (Hansen MC et al. 2013 Science 342: 850–53; Data download).

Purple, pink, and teal indicate areas that were deforested between January 2013 and February 2015 based on our analysis of Landsat imagery using CLASlite forest monitoring software.

Citation

Finer M, Novoa S (2015) Gold Mining Deforestation Enters Amarakaeri Communal Reserve (Madre de Dios, Peru). MAAP: Image #6. Link: https://www.maapprogram.org/2015/08/image-of-the-week-6-gold-mining-deforestation-enters-amarakaeri-communal-reserve/


Image #5: Gold Mining Deforestation Intensifies along Upper Malinowski (Madre de Dios, Peru)

Recall that in Image of the Week #1 we documented how gold mining deforestation continues to expand within the Department of Madre de Dios (Peru) in an area known as La Pampa  (1,700 hectares of new deforestation between 2013 and 2015). Here, Image of the Week #5 examines the area immediately to the west of La Pampa along the Upper Malinowski River, where we document over 850 hectares of additional gold mining deforestation between 2013 and 2015. Like La Pampa, most mining along the Upper Malinowski is illegal because it is outside the permissible mining zone and within the official buffer zone of a protected area.

2015_MDD_Malinowski_MAAP_5a_v7
Image of the Week 5a. Expanding deforestation from illegal gold mining along the Upper Malinowski River. Key data sources: MINAM, SERNANP, ACCA, USGS, IBC, Hansen/UMD/Google/USGS/NASA.

Key Results

According to our CLASlite analysis, 864 hectares were deforested between 2013 and 2015 along the Upper Malinowski and nearby tributaries within the buffer zones of the Bahuaja Sonene and Tambopata protected areas.

Image of the Week Description

Background map is a Landsat 8 image (30 m resolution) from February 2, 2015. Any variation of green indicates forest cover. Note there is some scattered cloud cover. Data is from USGS.

Protected areas data is from SERNANP. Dark green indicates established national protected areas and yellow-green indicates their buffer zones.

Black indicates areas that were deforested as of 2000 according to data from the Peruvian Environment Ministry (MINAM 2009). Yellow, orange, and red indicate areas that were deforested from 2000 to 2012 (each color covers a four year period) (Hansen MC et al. 2013 Science 342: 850–53Data download).

Purple indicates areas that were deforested between January 2013 and February 2015 based on our analysis of Landsat imagery using CLASlite forest monitoring software.

Madre de Dios Mining Zone

2015_MDD_Malinowski_MAAP_5b_v4
Image 5b. Madre de Dios mining zone, highlighting location of La Pampa and Upper Malinowski. Note that we did not include other land uses such as forestry concessions. Key data sources: MINAM, SERNANP, ACCA, Hansen/UMD/Google/USGS/NASA, USGS.

Image 5b provides greater context of the Madre de Dios mining zone, highlighting La Pampa at “C” (Image of the Week #1) and the Upper Malinowski at “D”.

The Permissible Mining Zone was established in 2010 and indicates the zone that the Peruvian Government has delimited as potentially legal for small-scale and artisanal mining activities, but only if miners succesfully complete a multi-step formalization process for each project. One of the key steps of this process is to resolve any land use conflicts due to overlapping land claims (for example if a section of the mining corridor overlaps with a forestry concession). Data is from ACCA.

Importantly, note that most gold mining in both La Pampa and the Upper Malinowski is illegal since it is located outside the permissible mining zone and within the buffer zone of two protected areas (Bahuaja Sonene National Park and Tambopata National Reserve).

Also note that on the lower Malinowski, deforestation is concentrated on the buffer zone side and largely absent on the protected area side. This striking pattern indicates that official protection status is much more of an effective deforestation deterrent than the looser buffer zone status.

High-resolution Zoom

2015_MDD_Malinowski_MAAP_5c_v4
Image 5c. High resolution satellite image of deforestation along the Upper Malinowski River. Key data sources: SPOT 7, CLASlite.

To better understand the driver of the deforestation along the Upper Malinowski, we acquired high resolution satellite imagery (SPOT 7 with 1.5 m resolution). As seen in Image 5c, the pattern of the recent deforestation is characteristic of gold mining, and not other possible drivers such as agriculture. Note that the purple outlines indicate areas that were deforested between January 2013 and February 2015 based on our CLASlite analysis (this image shows 492 of the total 864 hectares of recent deforestation).

Satellite Image Time-series

2015_MDD_Malinowski_MAAP_5d_v3
Image 5d. Satellite image time-series (2013 – 2015) of deforestation along the Upper Malinowski. Note that all four panels in Image 5d show the same location. Key data sources: USGS, SPOT 7.

To better understand the deforestation dynamics over time along the Upper Malinowski, we created a satellite image (Landsat and SPOT 7) time-series. As seen in Image 5d, there was a rapid increase in mining deforestation in the less than two years between July 2013 and February 2015. Note that all four panels in Image 5d show the same location, but appear different because of the deforestation.

Citation

Finer M, Novoa S (2015) Gold Mining Deforestation Intensifies along Upper Malinowski (Madre de Dios, Peru). MAAP: Image #5. Link: https://www.maapprogram.org/2015/05/image-5-gold-mining-deforestation-intensifies-along-upper-malinowski-madre-de-dios-peru/