MAAP #155: Deforestation Hotspots in the Venezuelan Amazon

Amazon Base Map. Forest Carbon Flux across the Amazon, 2001-2020. Data: Harris et al 2021. Analysis: Amazon Conservation/MAAP.

We present here the first report of a series focused on the Venezuelan Amazon, which covers over 47 million hectares of the northern section of the Amazon biome (above western Brazil).

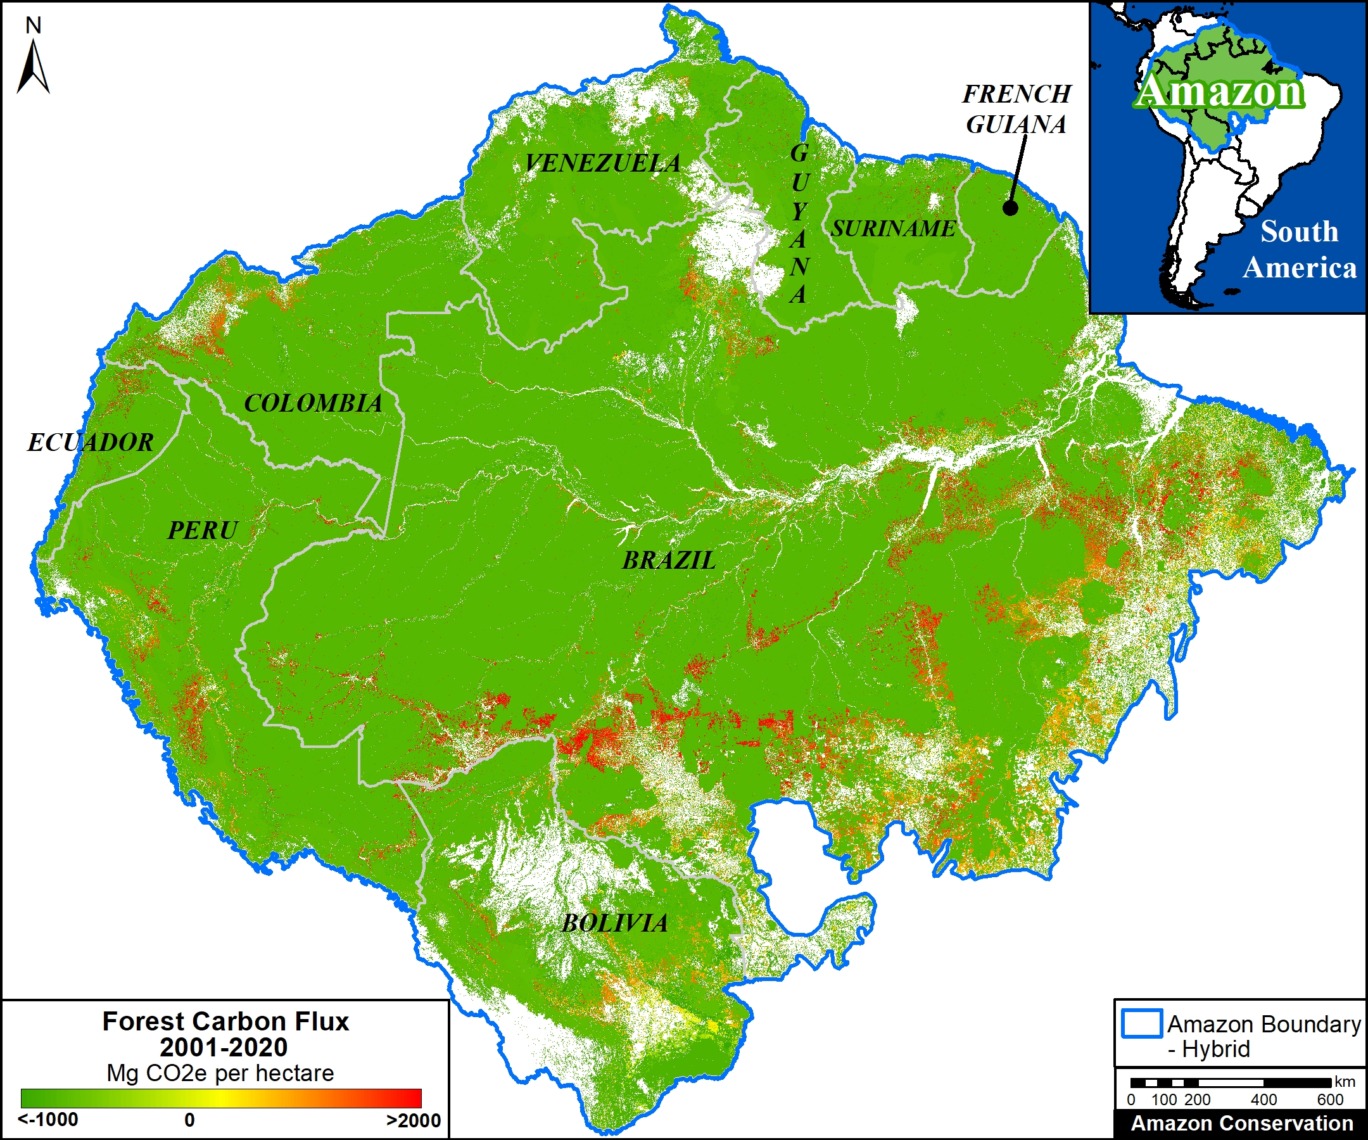
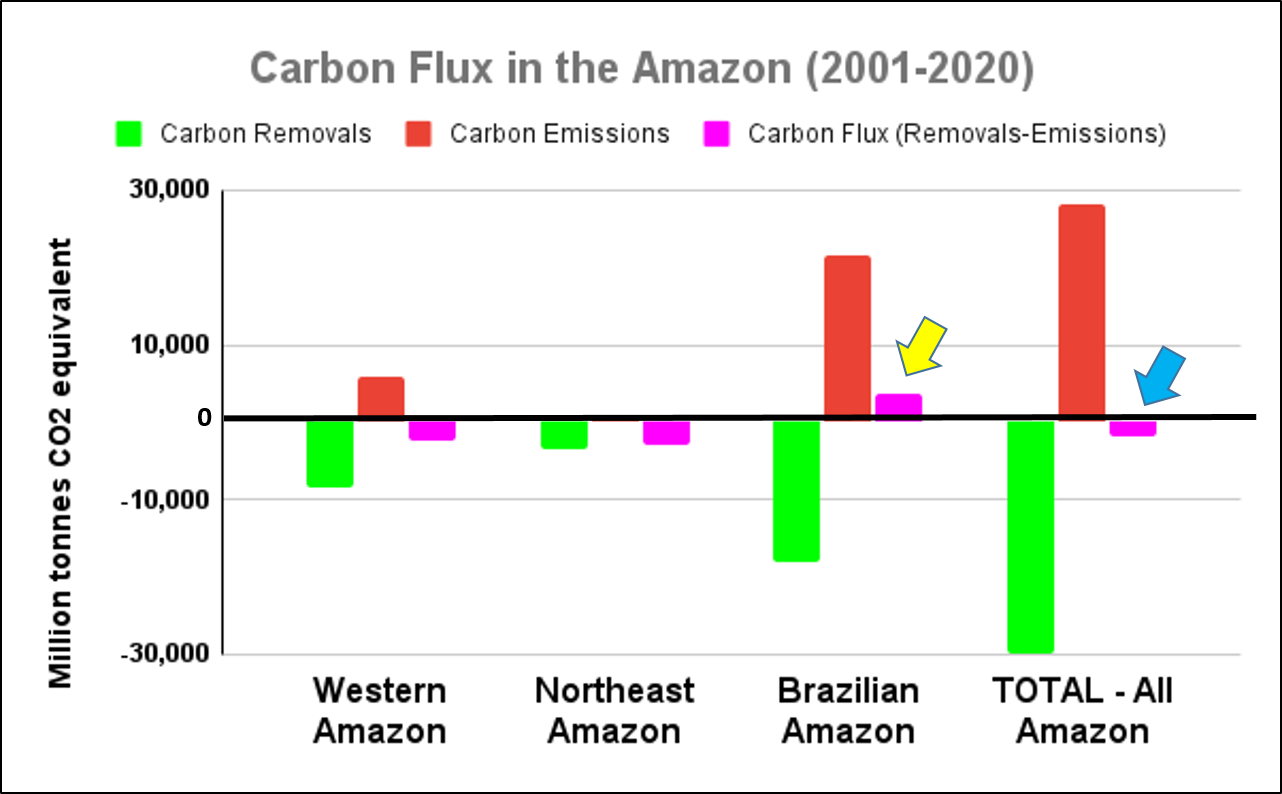
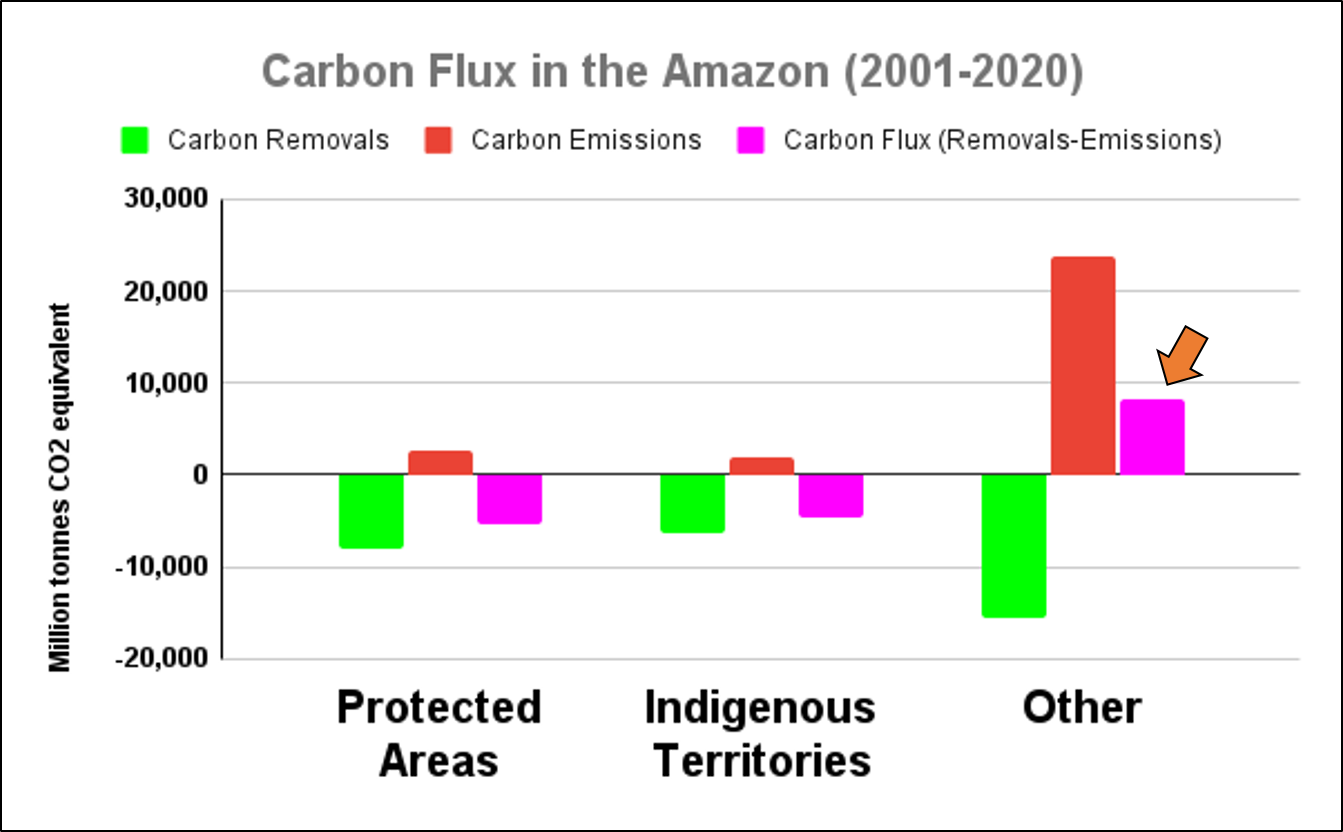
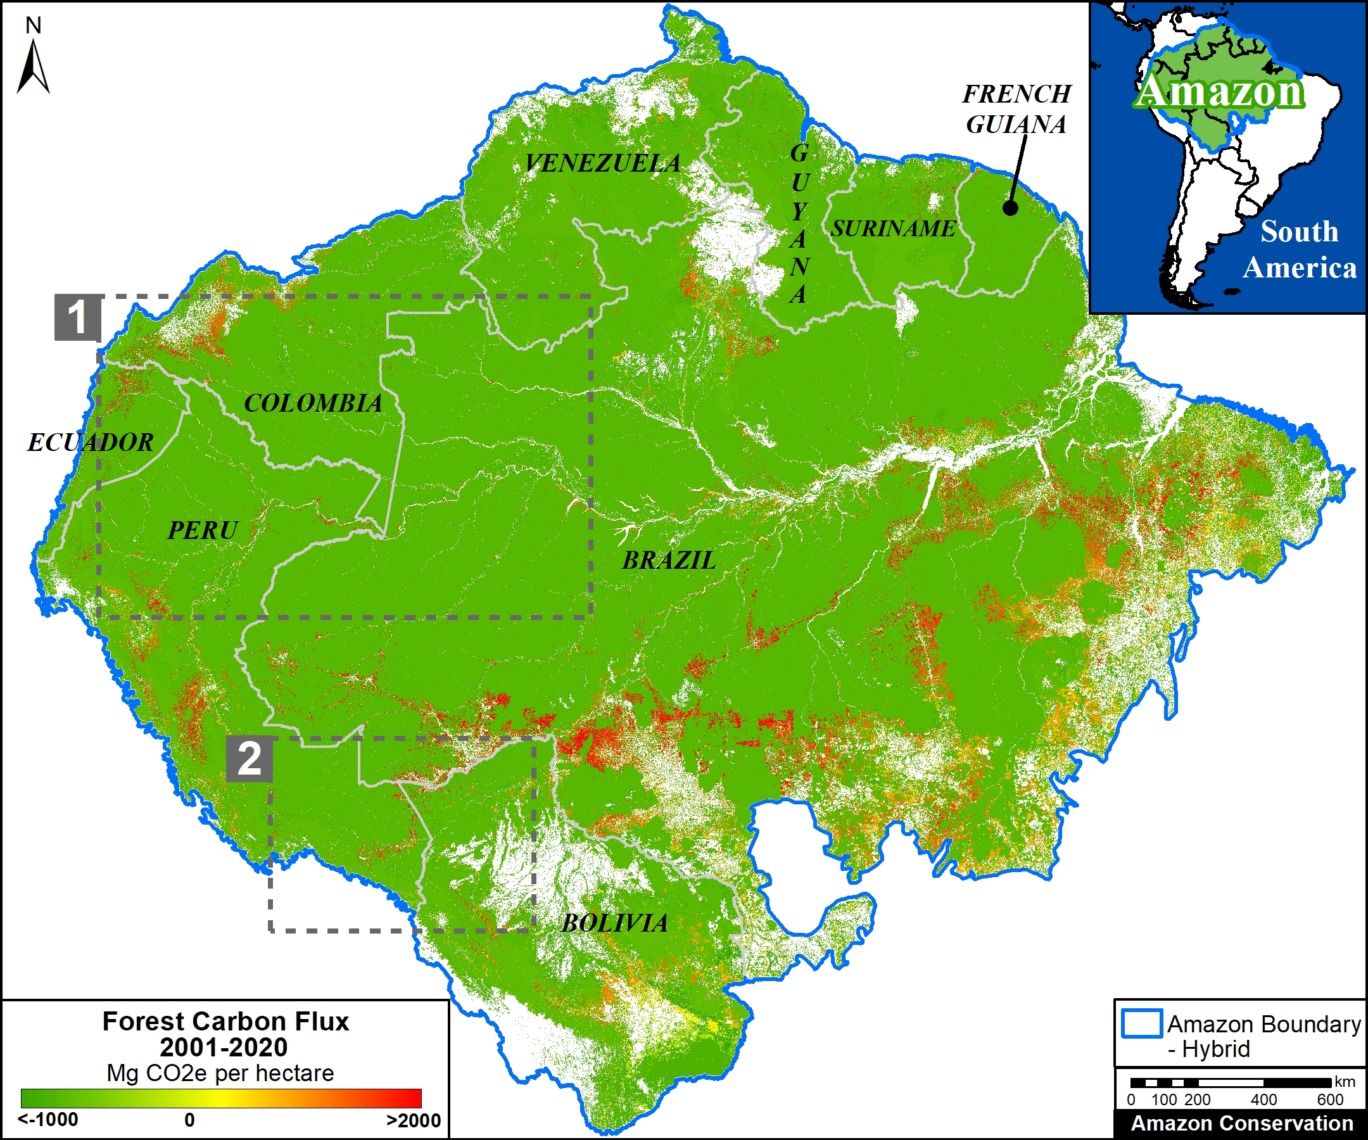
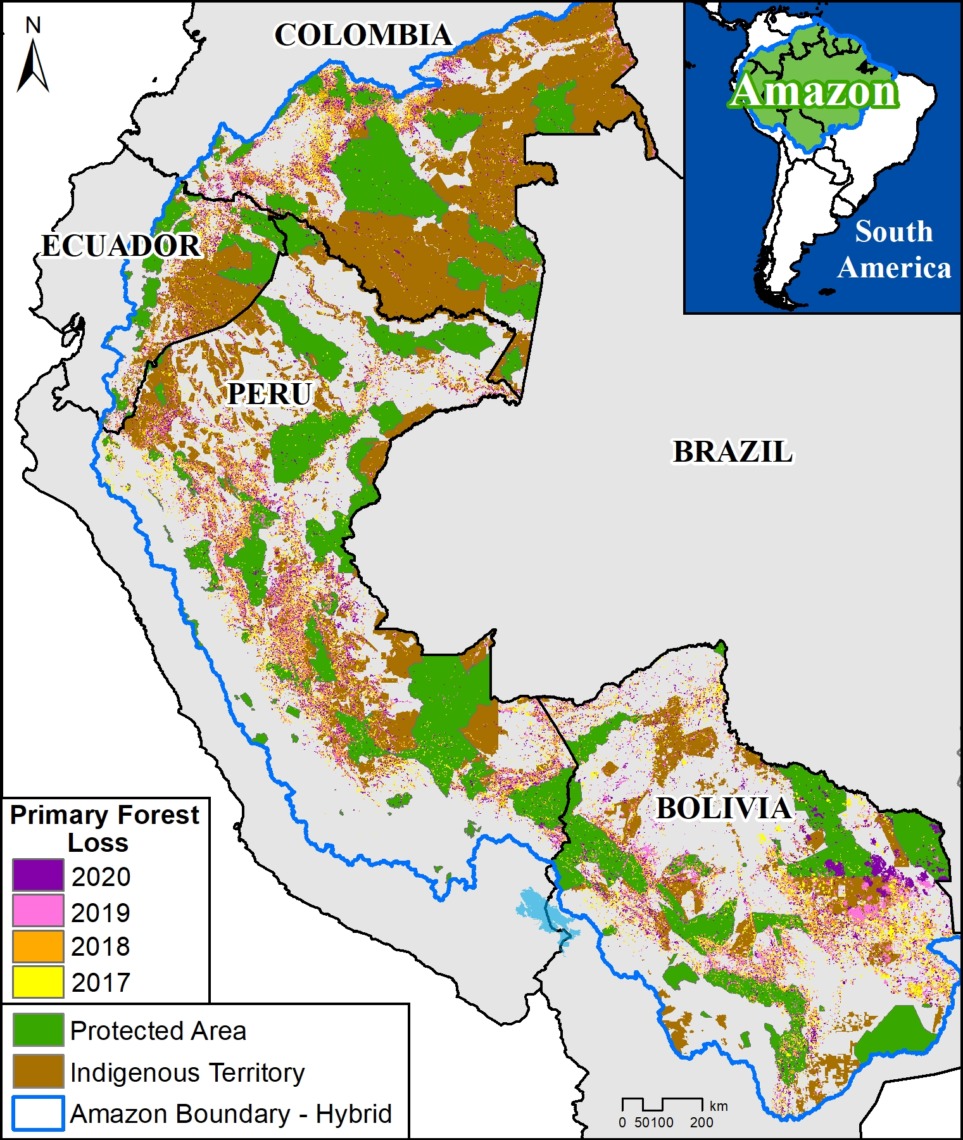
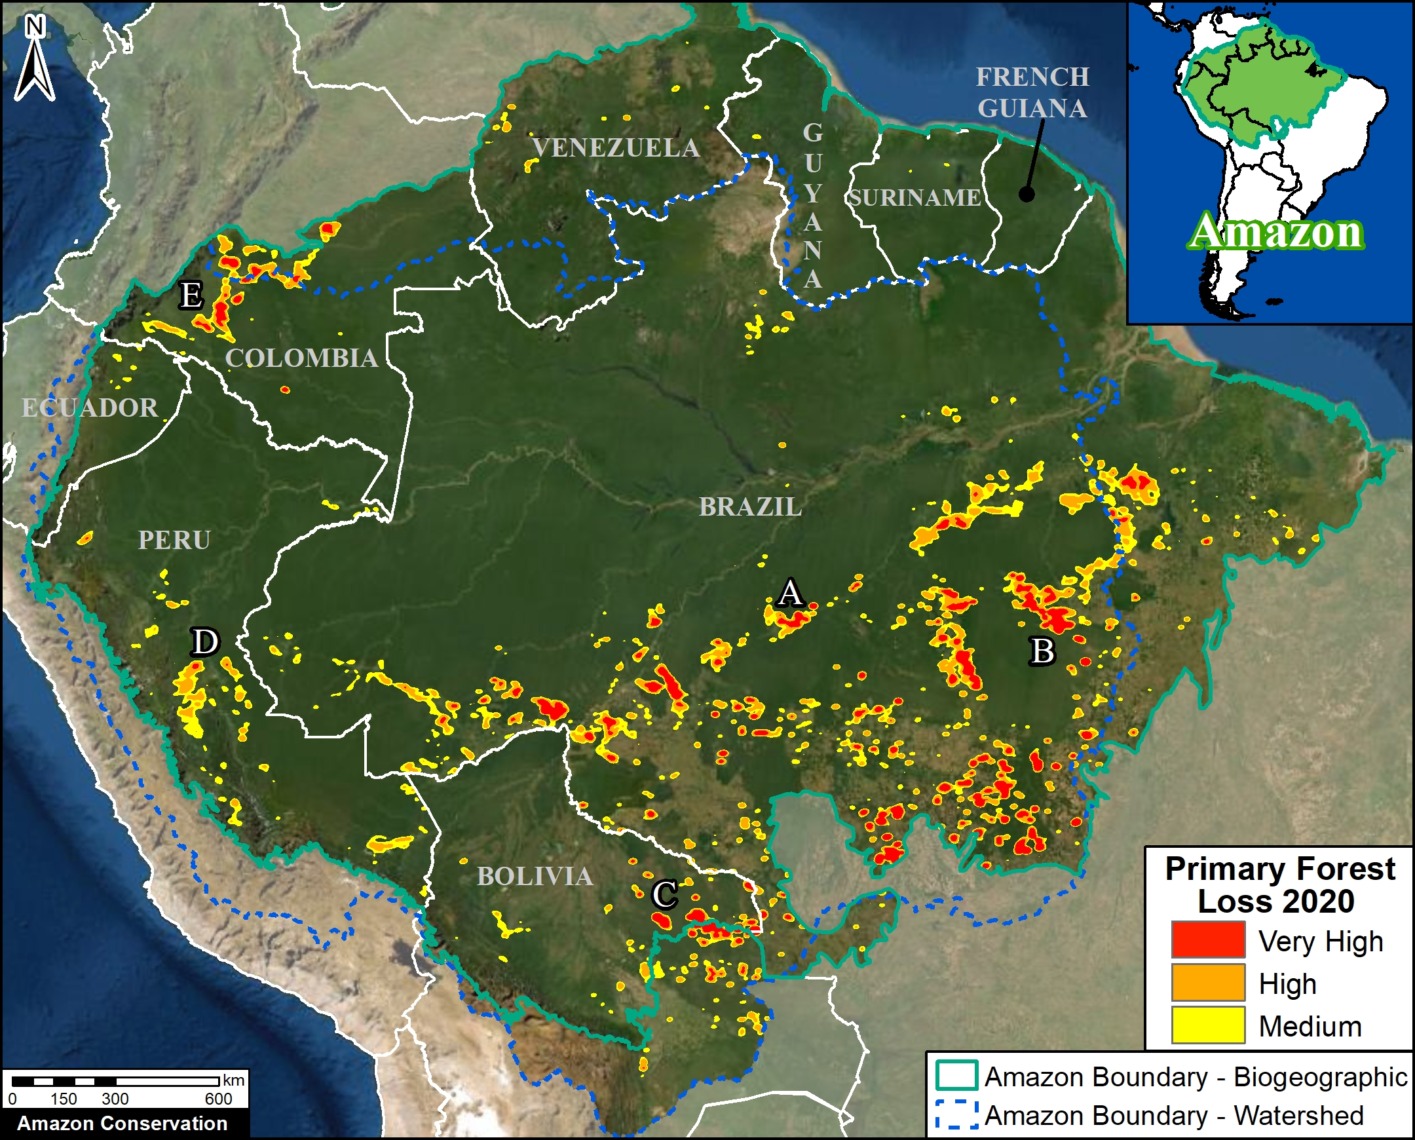
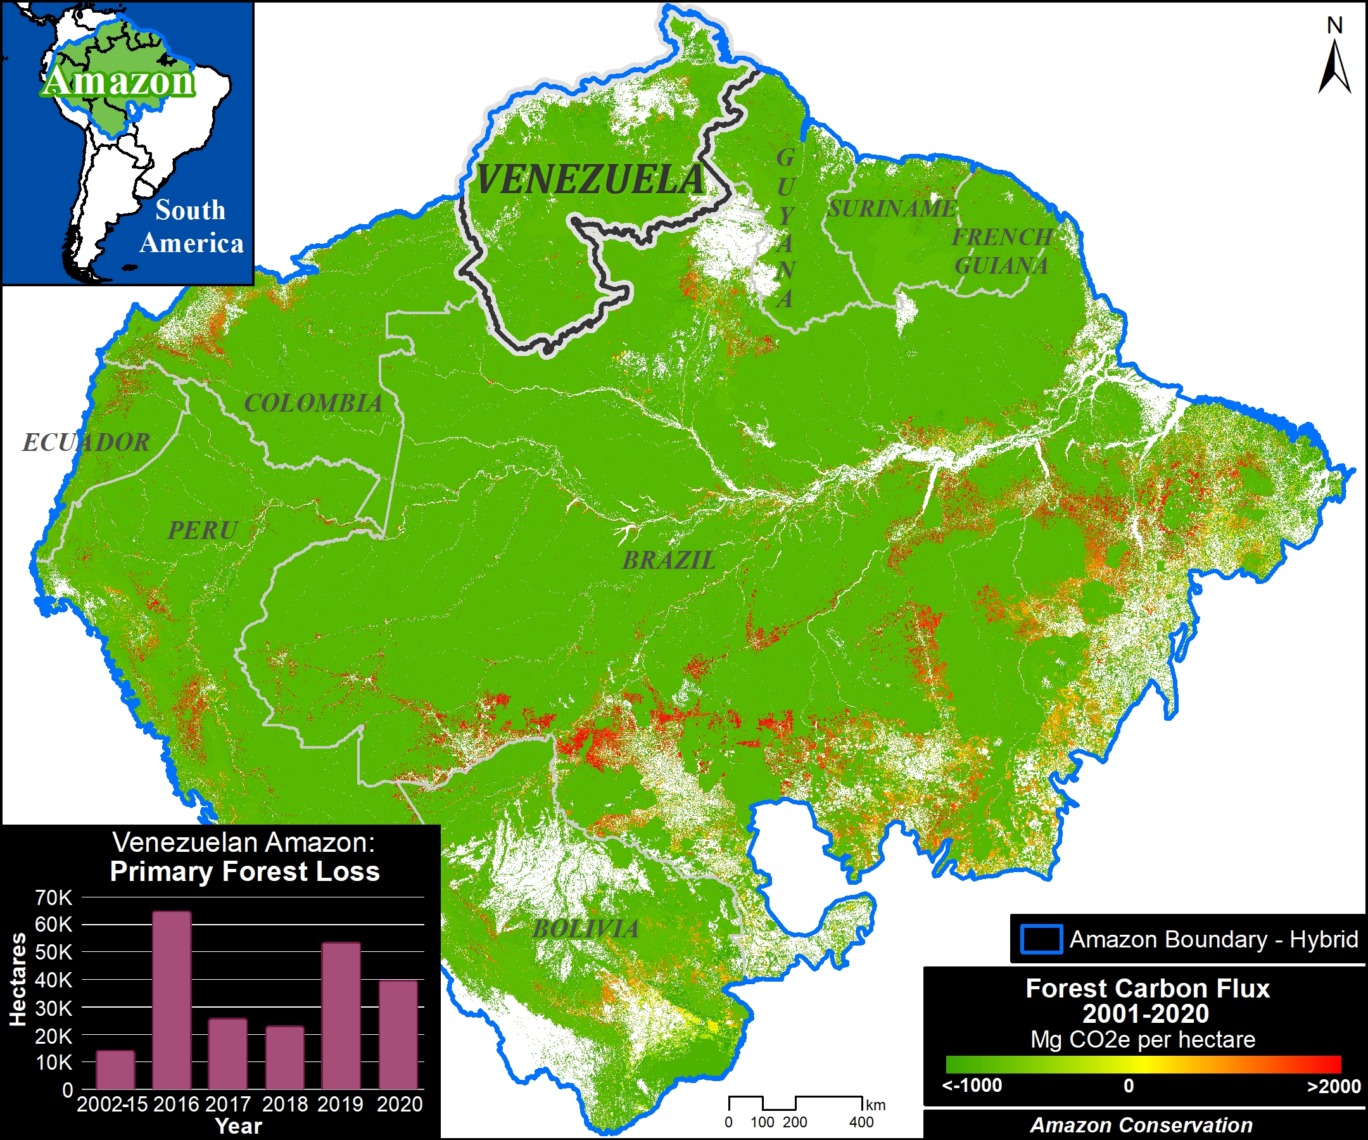
As the Amazon Base Map indicates, Venezuela is a key part to the remaining core Amazon that is still functioning as a critical carbon sink, making it an important piece to long-term conservation strategies.

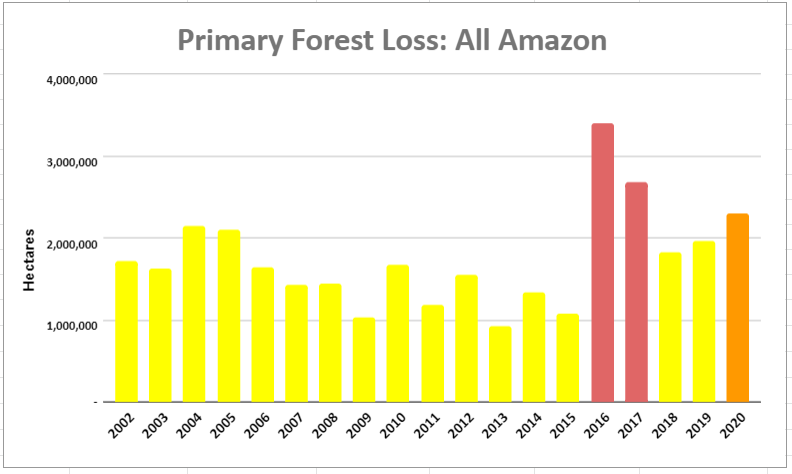
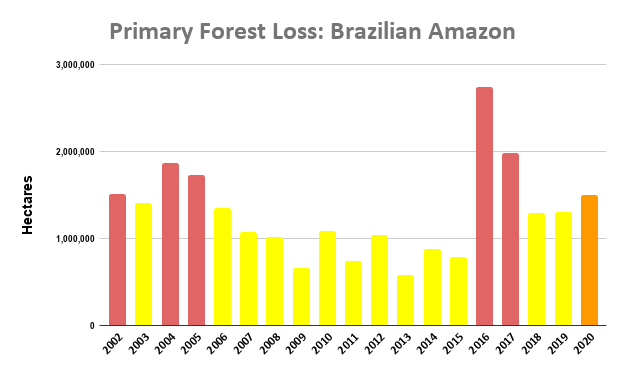
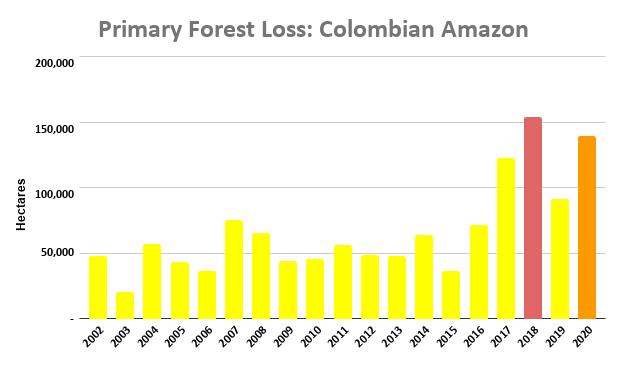
However, deforestation has been increasing in recent years (see graph in Base Map), indicating escalating threats.

Specifically, there is a clear trend of increasing primary forest loss since 2015, including a recent spike in 2019.

We estimate the loss of over 140,000 hectares (345,000 acres) over the past four years, accounting for 1.6% of the total loss across the Amazon during that time period.

Below, we investigate the major hotspots and drivers of deforestation currently in the Venezuelan Amazon.


Venezuela Base Map. Hotspots of primary forest loss across the Venezuelan Amazon (2017-2020). UMD/GLAD, MAAP.

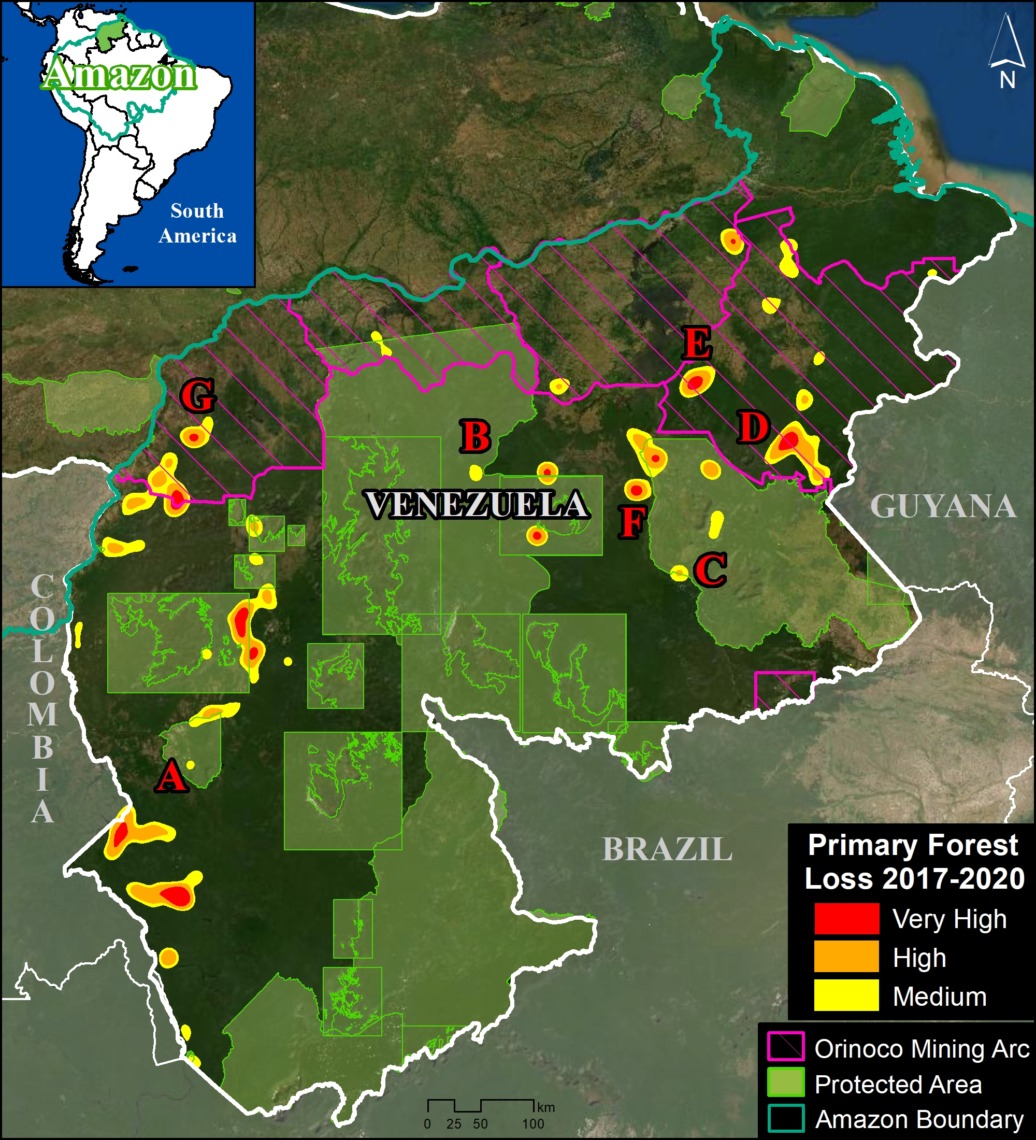
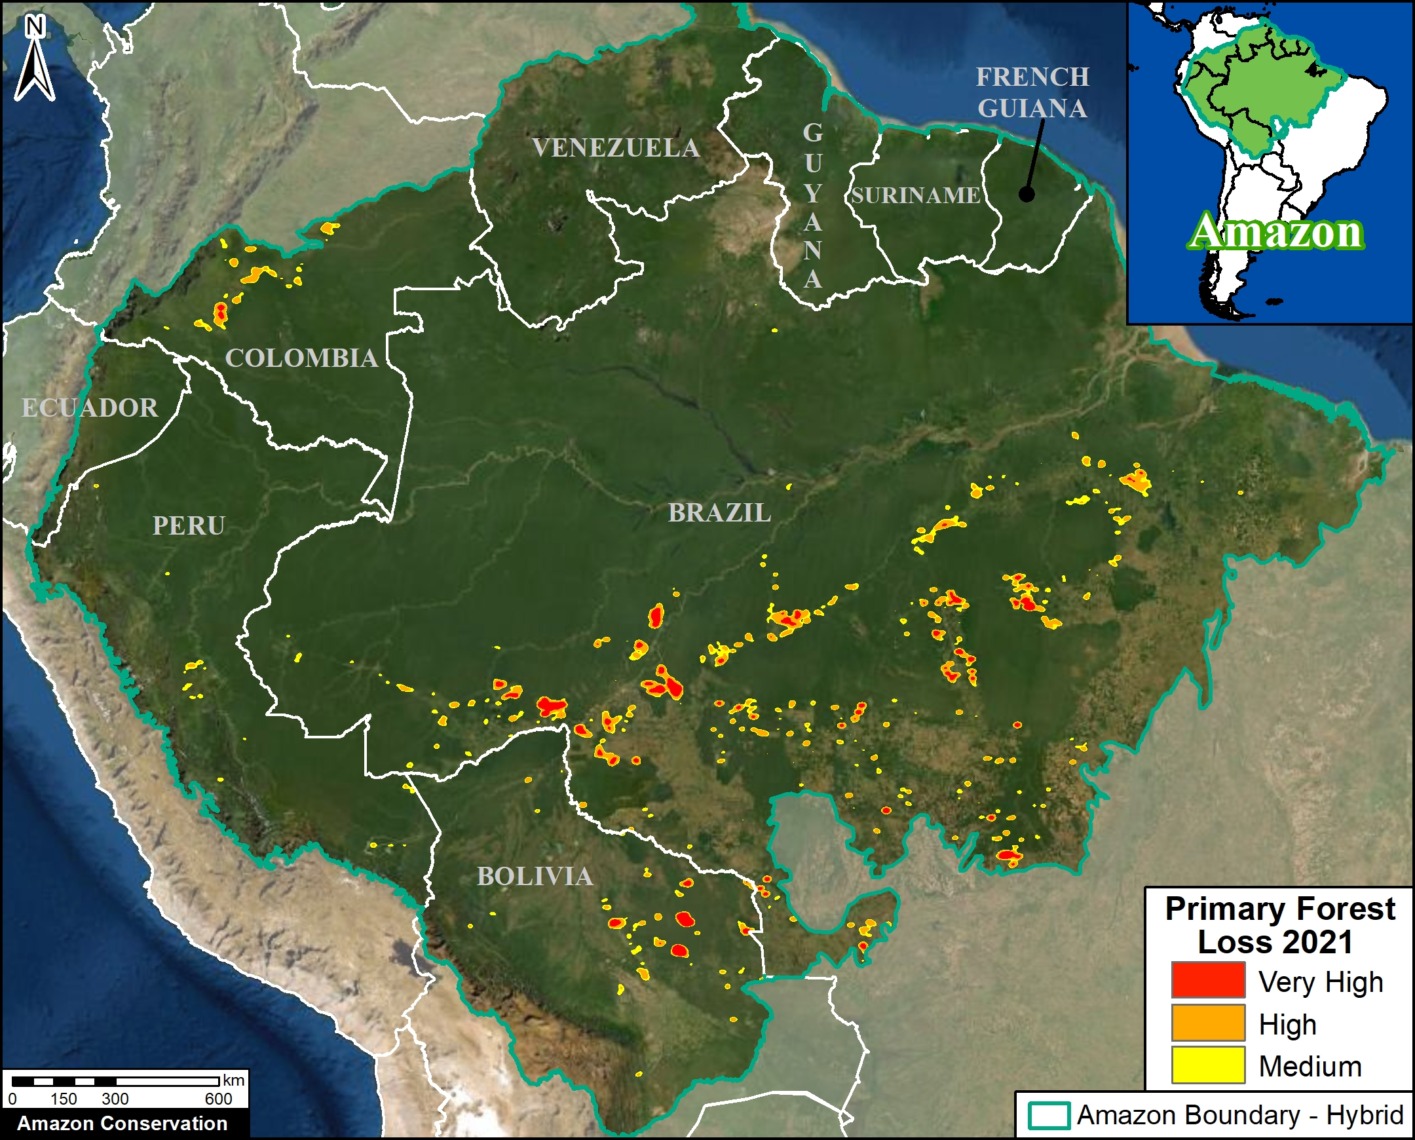
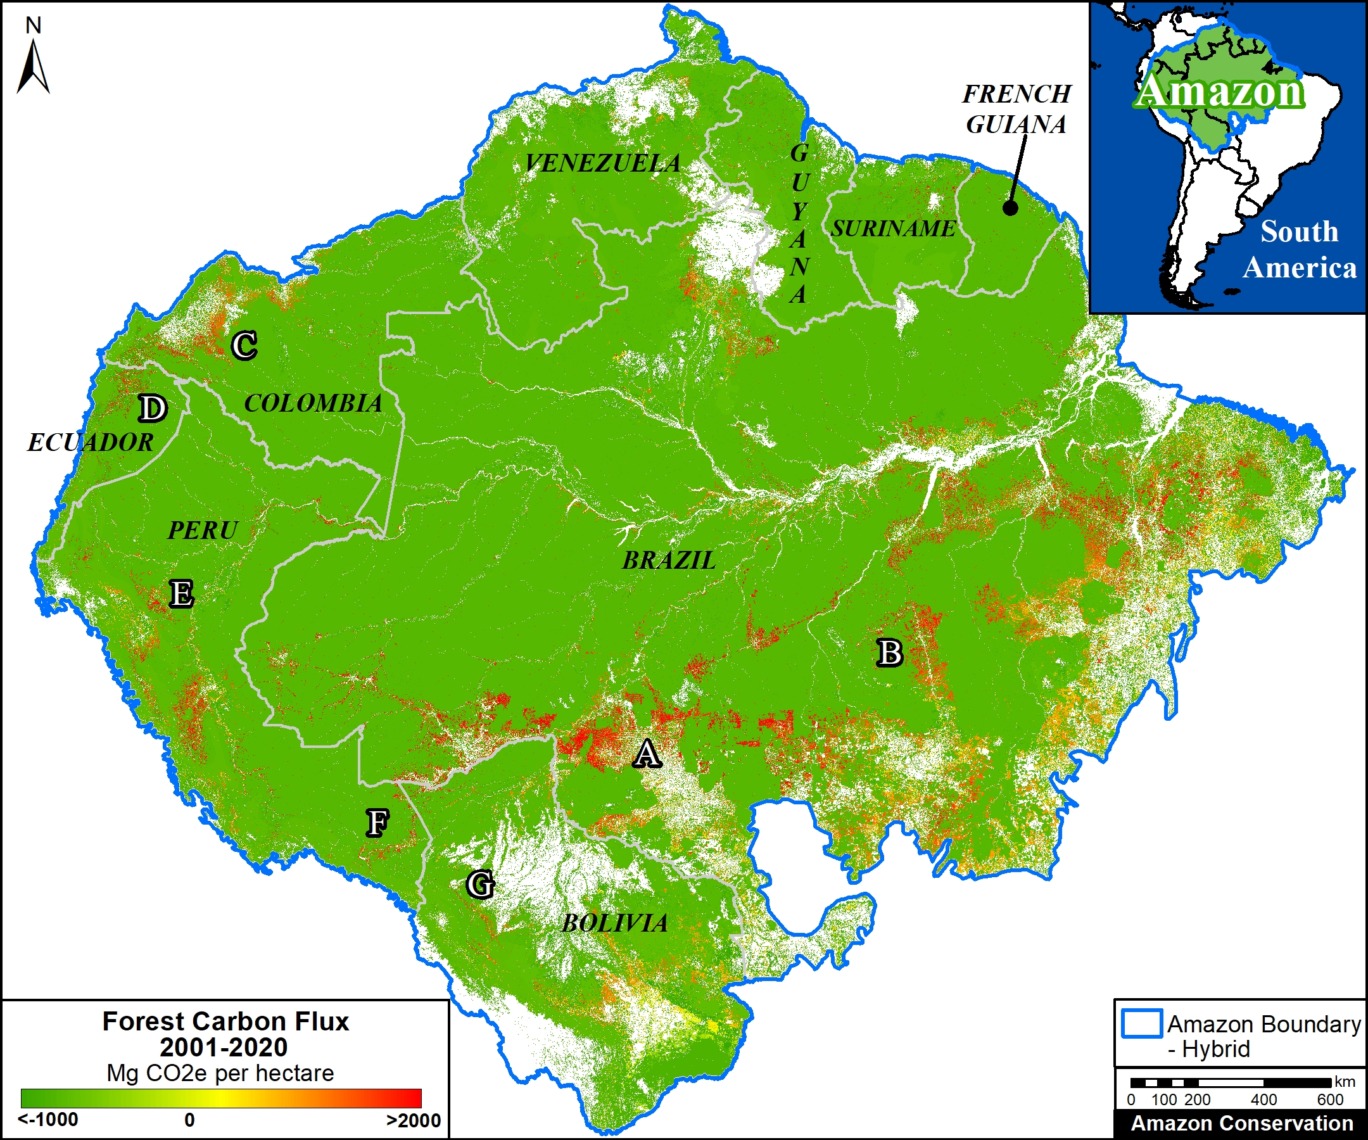
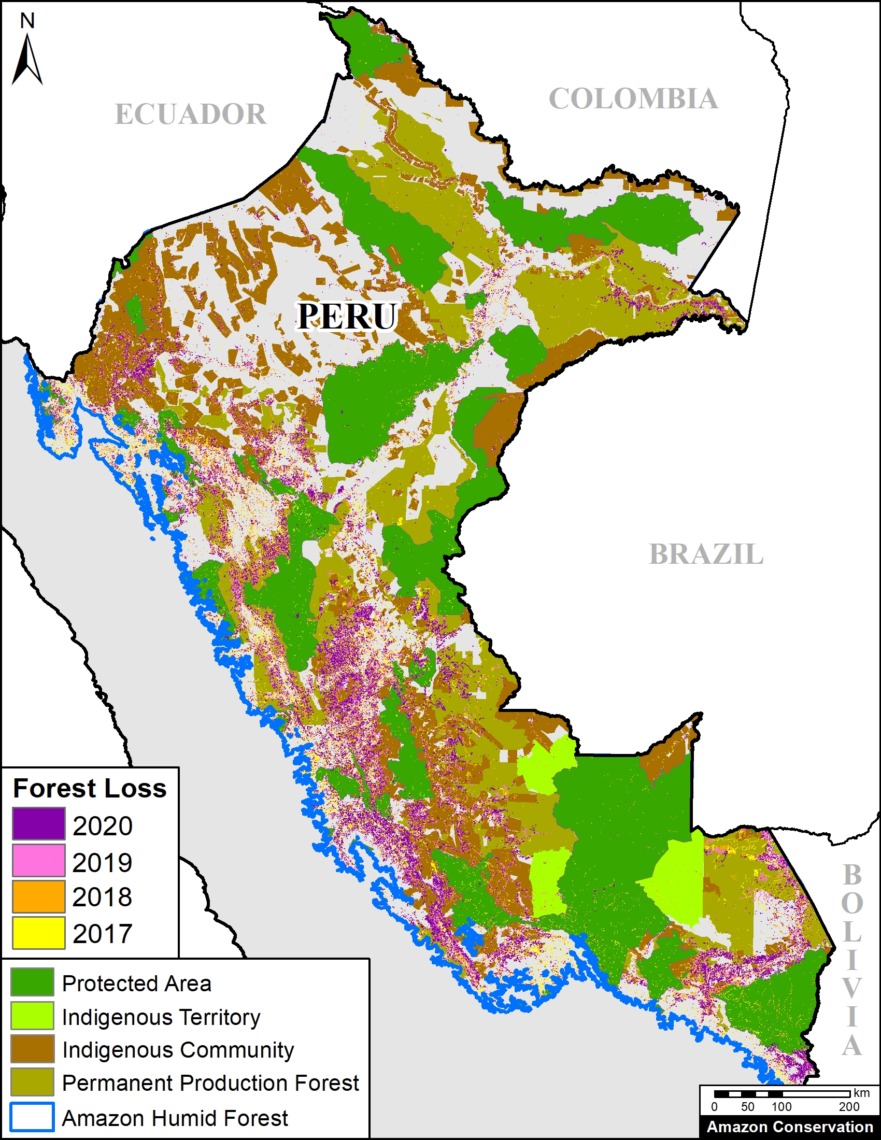
The Venezuela base map shows the major hotspots of primary forest loss across the Venezuelan Amazon over the past four years (2017-2020).

Note that most hotspots are within the Orinoco Mining Arc, a large area over 11 million hectares created by a controversial presidential decree in 2016 designed to promote mining (SOSOrinoco 2021), as well as within and around the extensive network of protected areas.

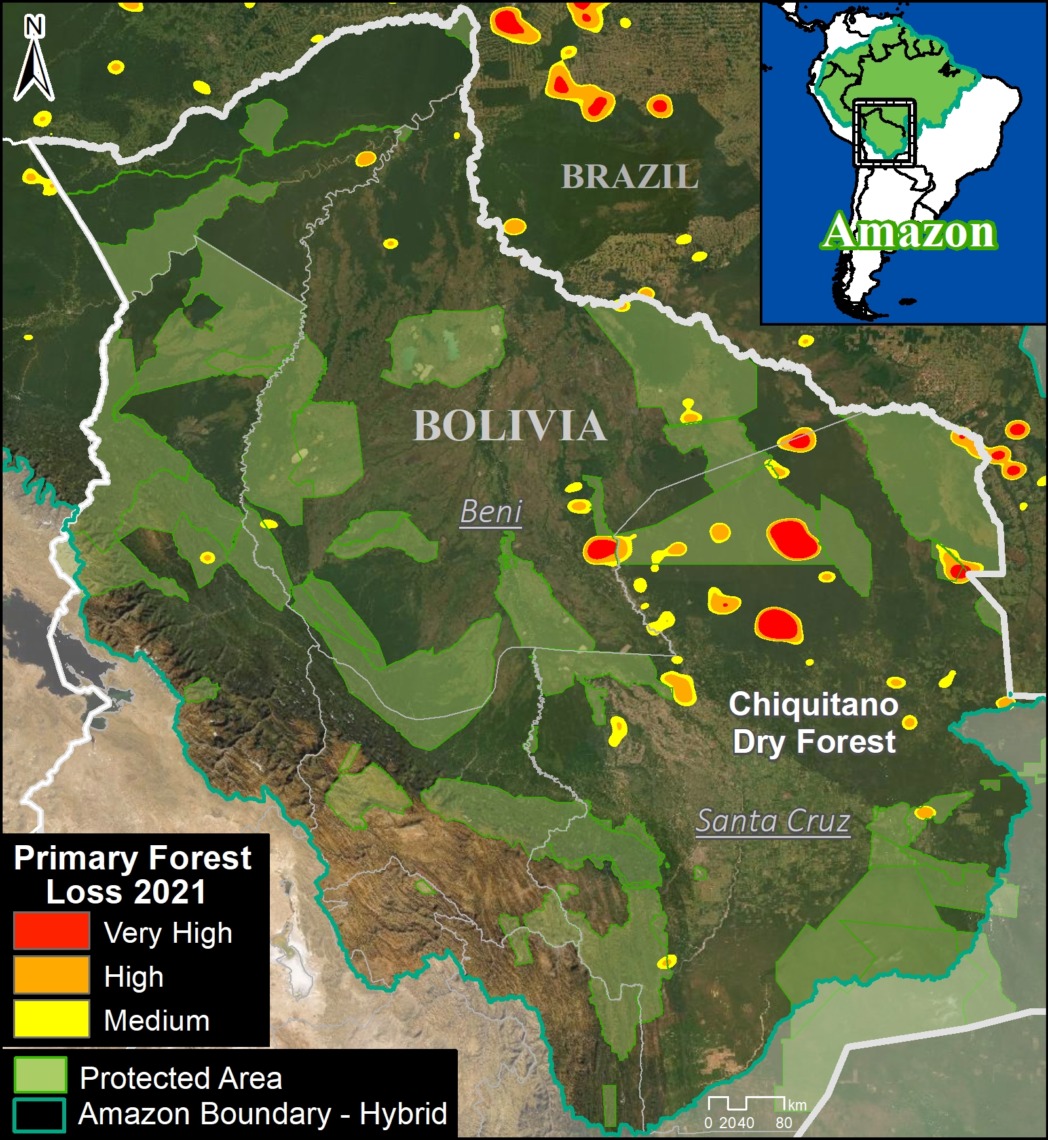
These protected areas cover 43% (20 million hectares) of the Venezuelan Amazon and accounted for around 30% of total forest loss. The most impacted areas in recent years are Caura, Canaima, and Yapacana National Parks (over 22,000 hectares combined).

We zoomed in on these hotspots and found that mining, fires, and agriculture (including cattle pasture) are the three primary deforestation drivers across the Venezuelan Amazon. There may be complex interactions between these drivers, such as mining centers leading to fires and agricultural expansion to support the new mining population.

It is worth noting that Venezuela joins Peru, Brazil, and Suriname as countries where mining is now documented to be actively driving major deforestation of primary forest.

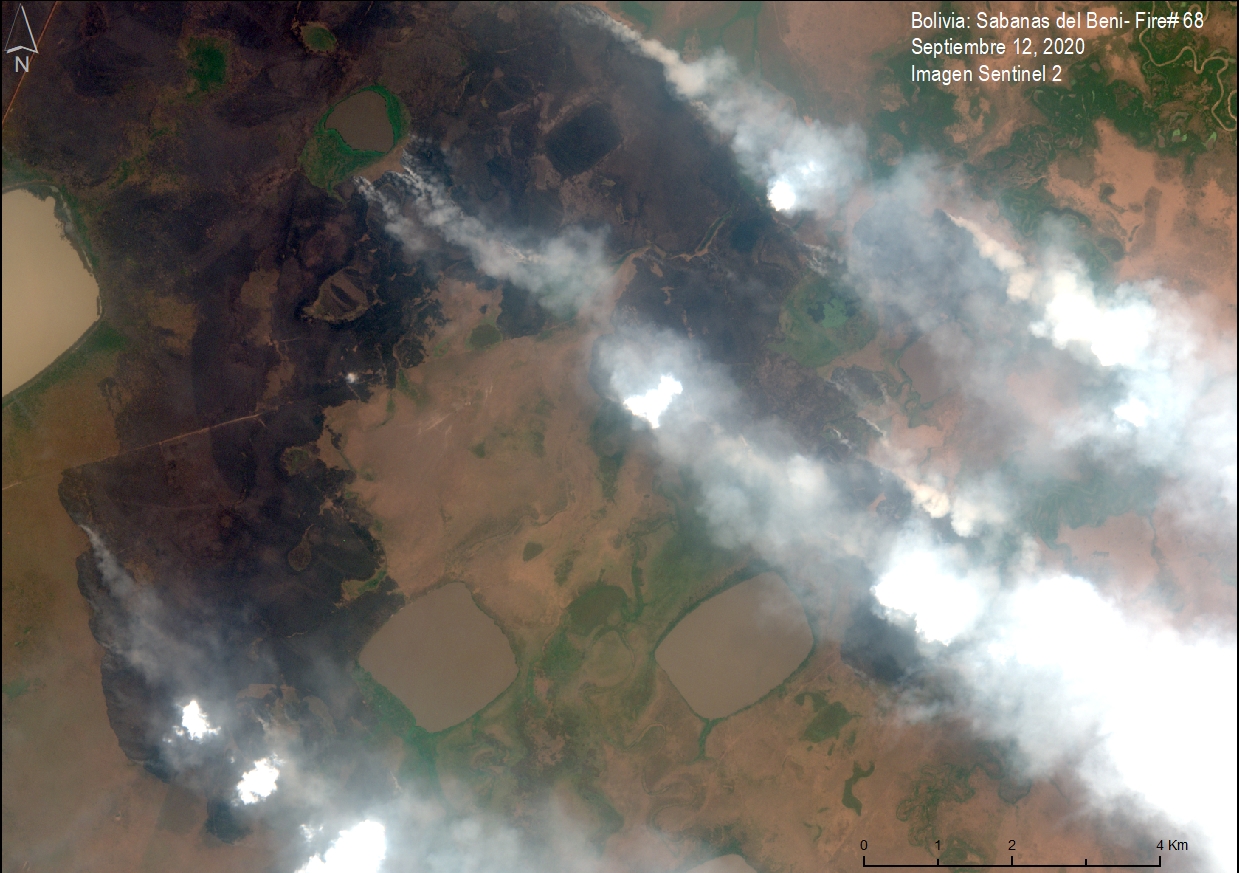
We also note that, as in the rest of the Amazon, virtually all fires are caused by humans (that is, not natural events) and most are likely linked to preparing land for agricultural activities. During drier periods, these fires may escape, causing larger forest fires.

Below, we illustrate these drivers in a series of high-resolution (3 meters) and very high-resolution (0.5 meters) images.

High-resolution Zooms

Mining

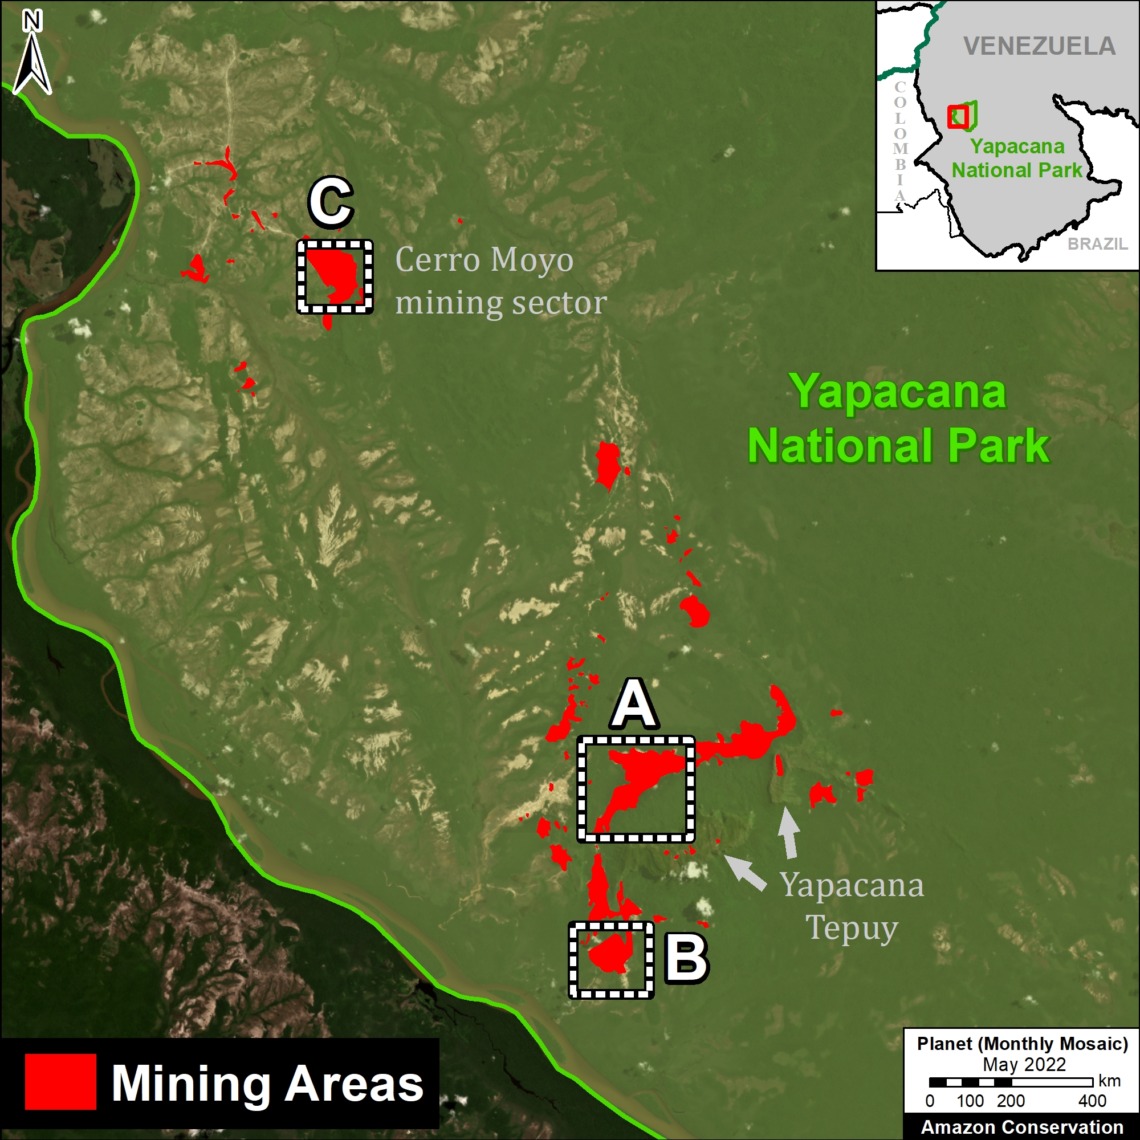
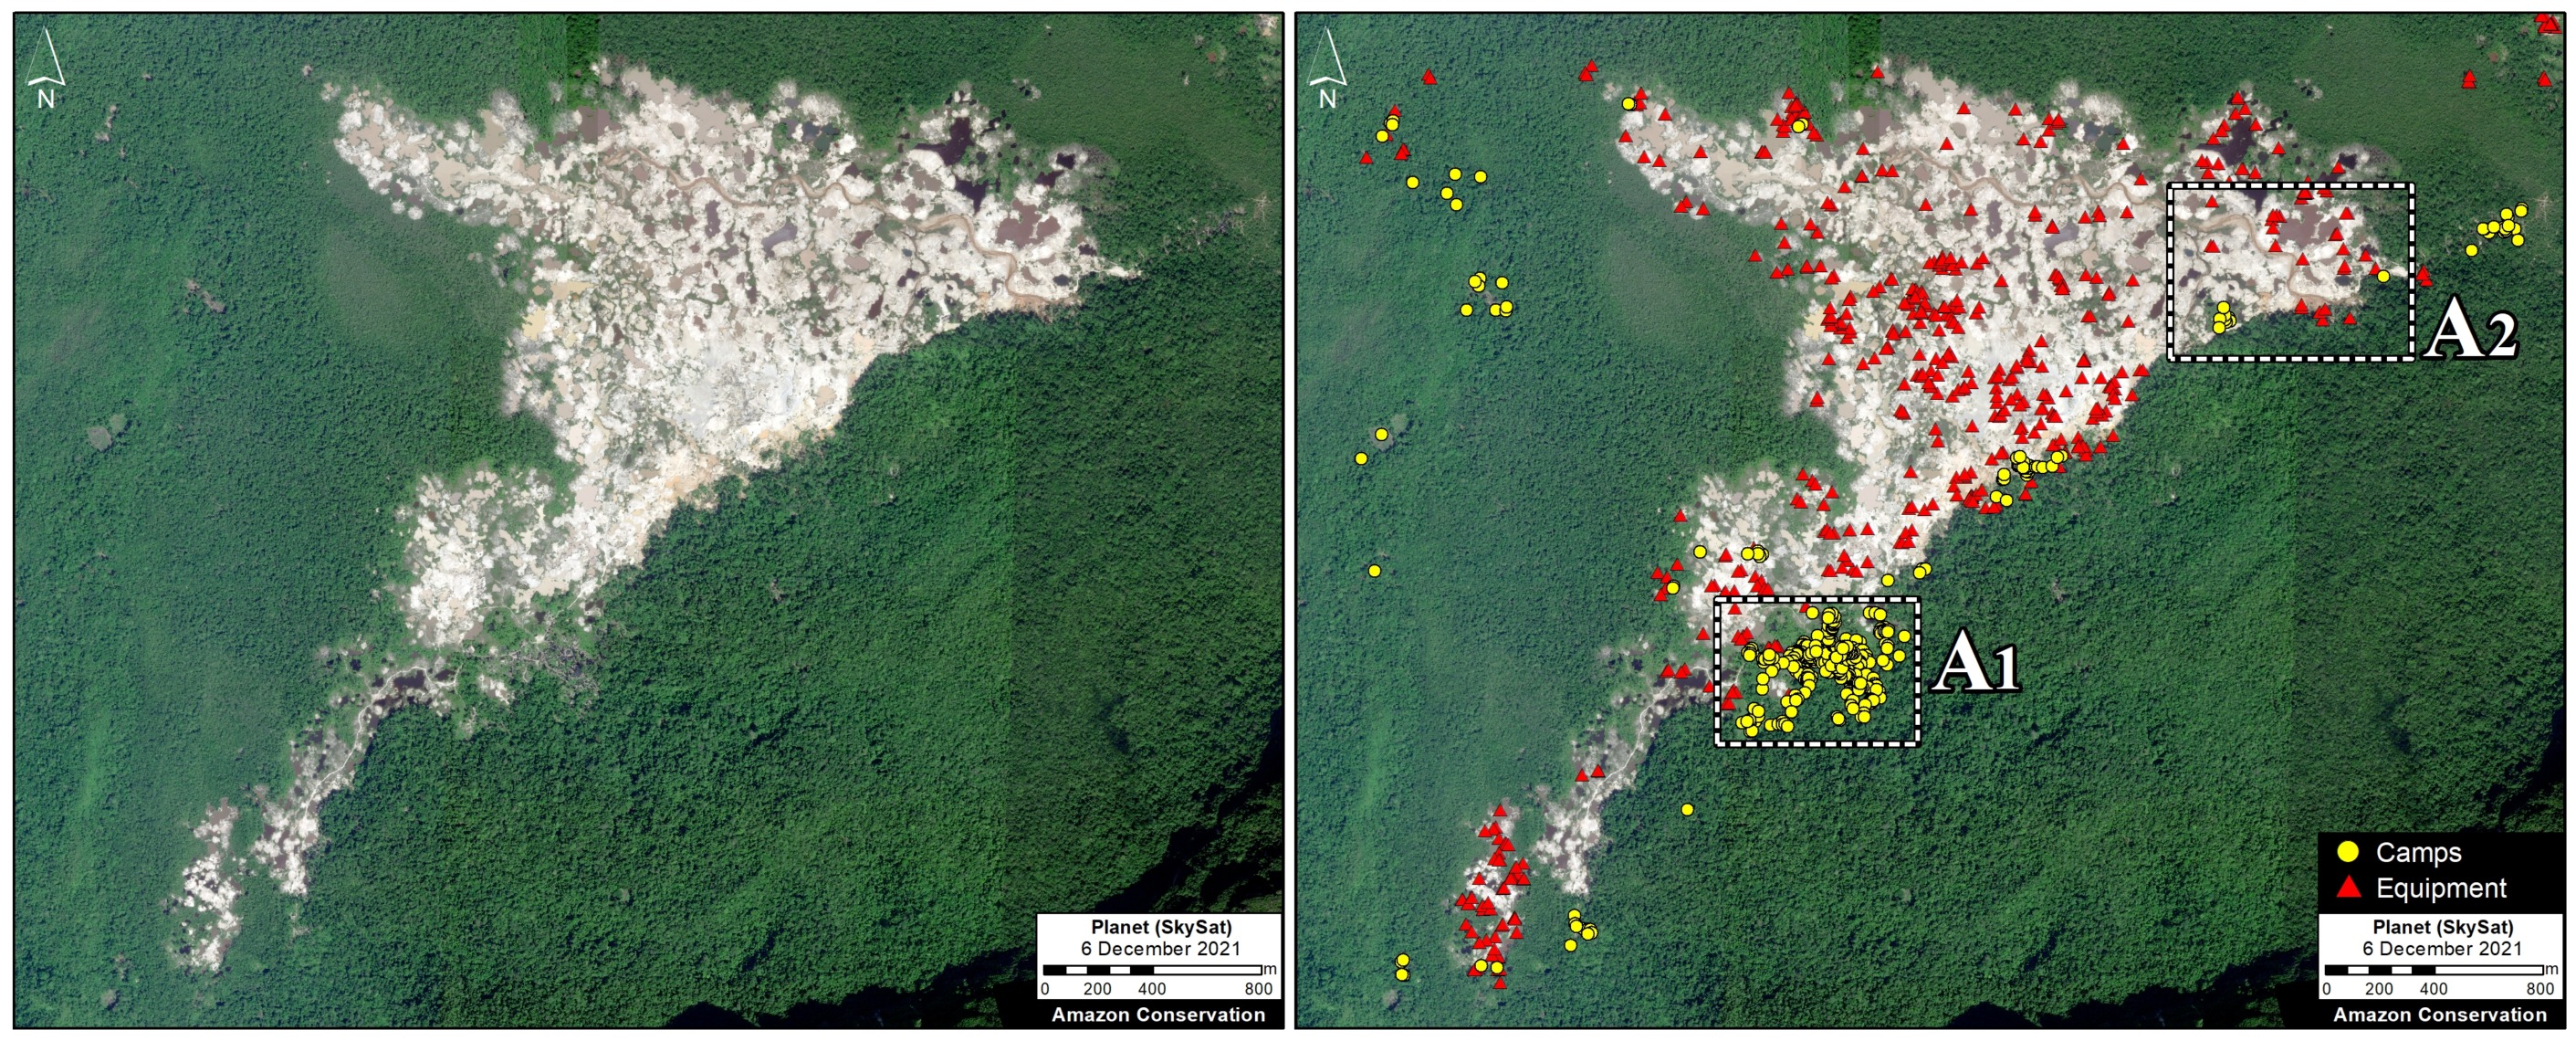
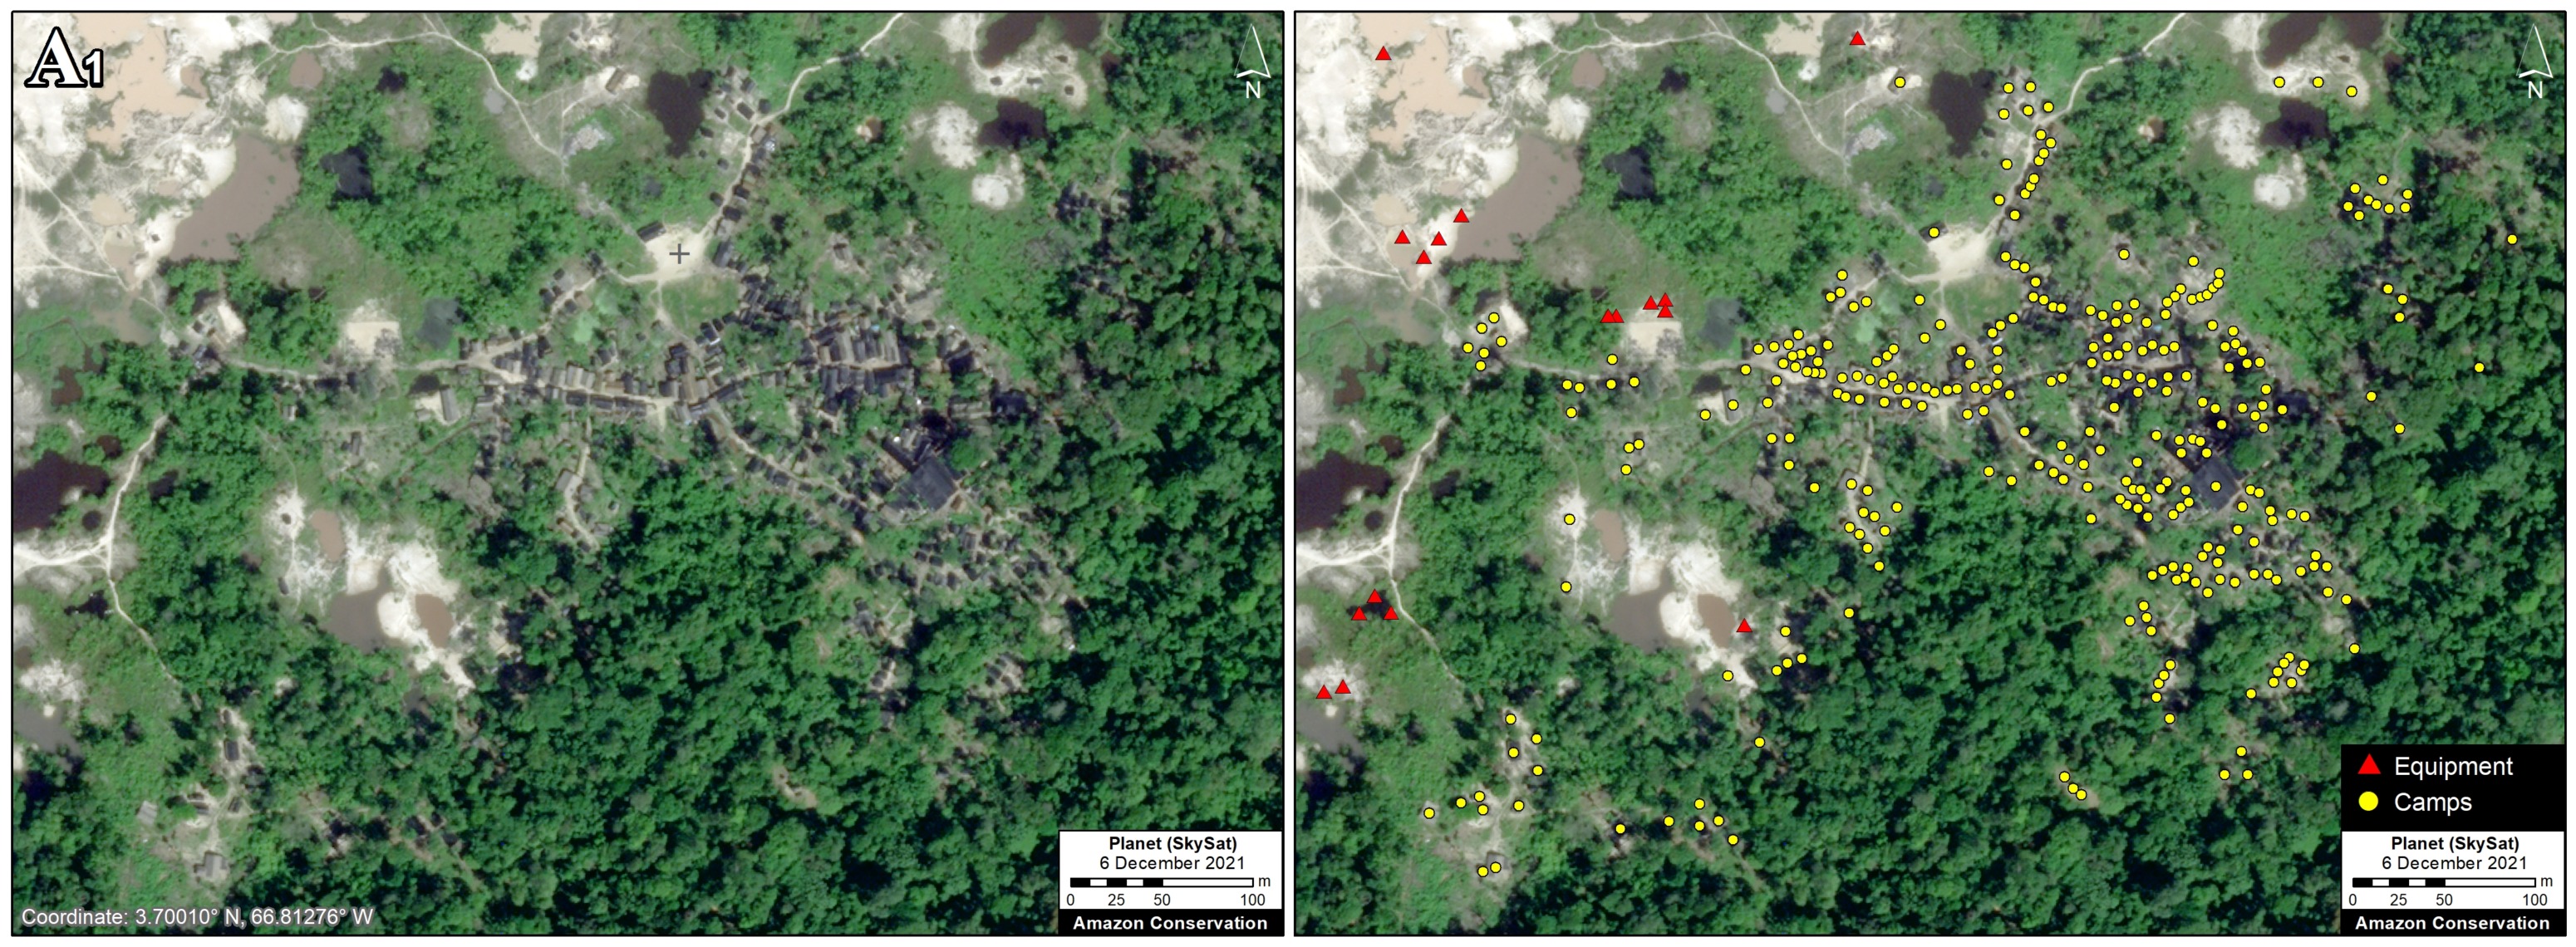
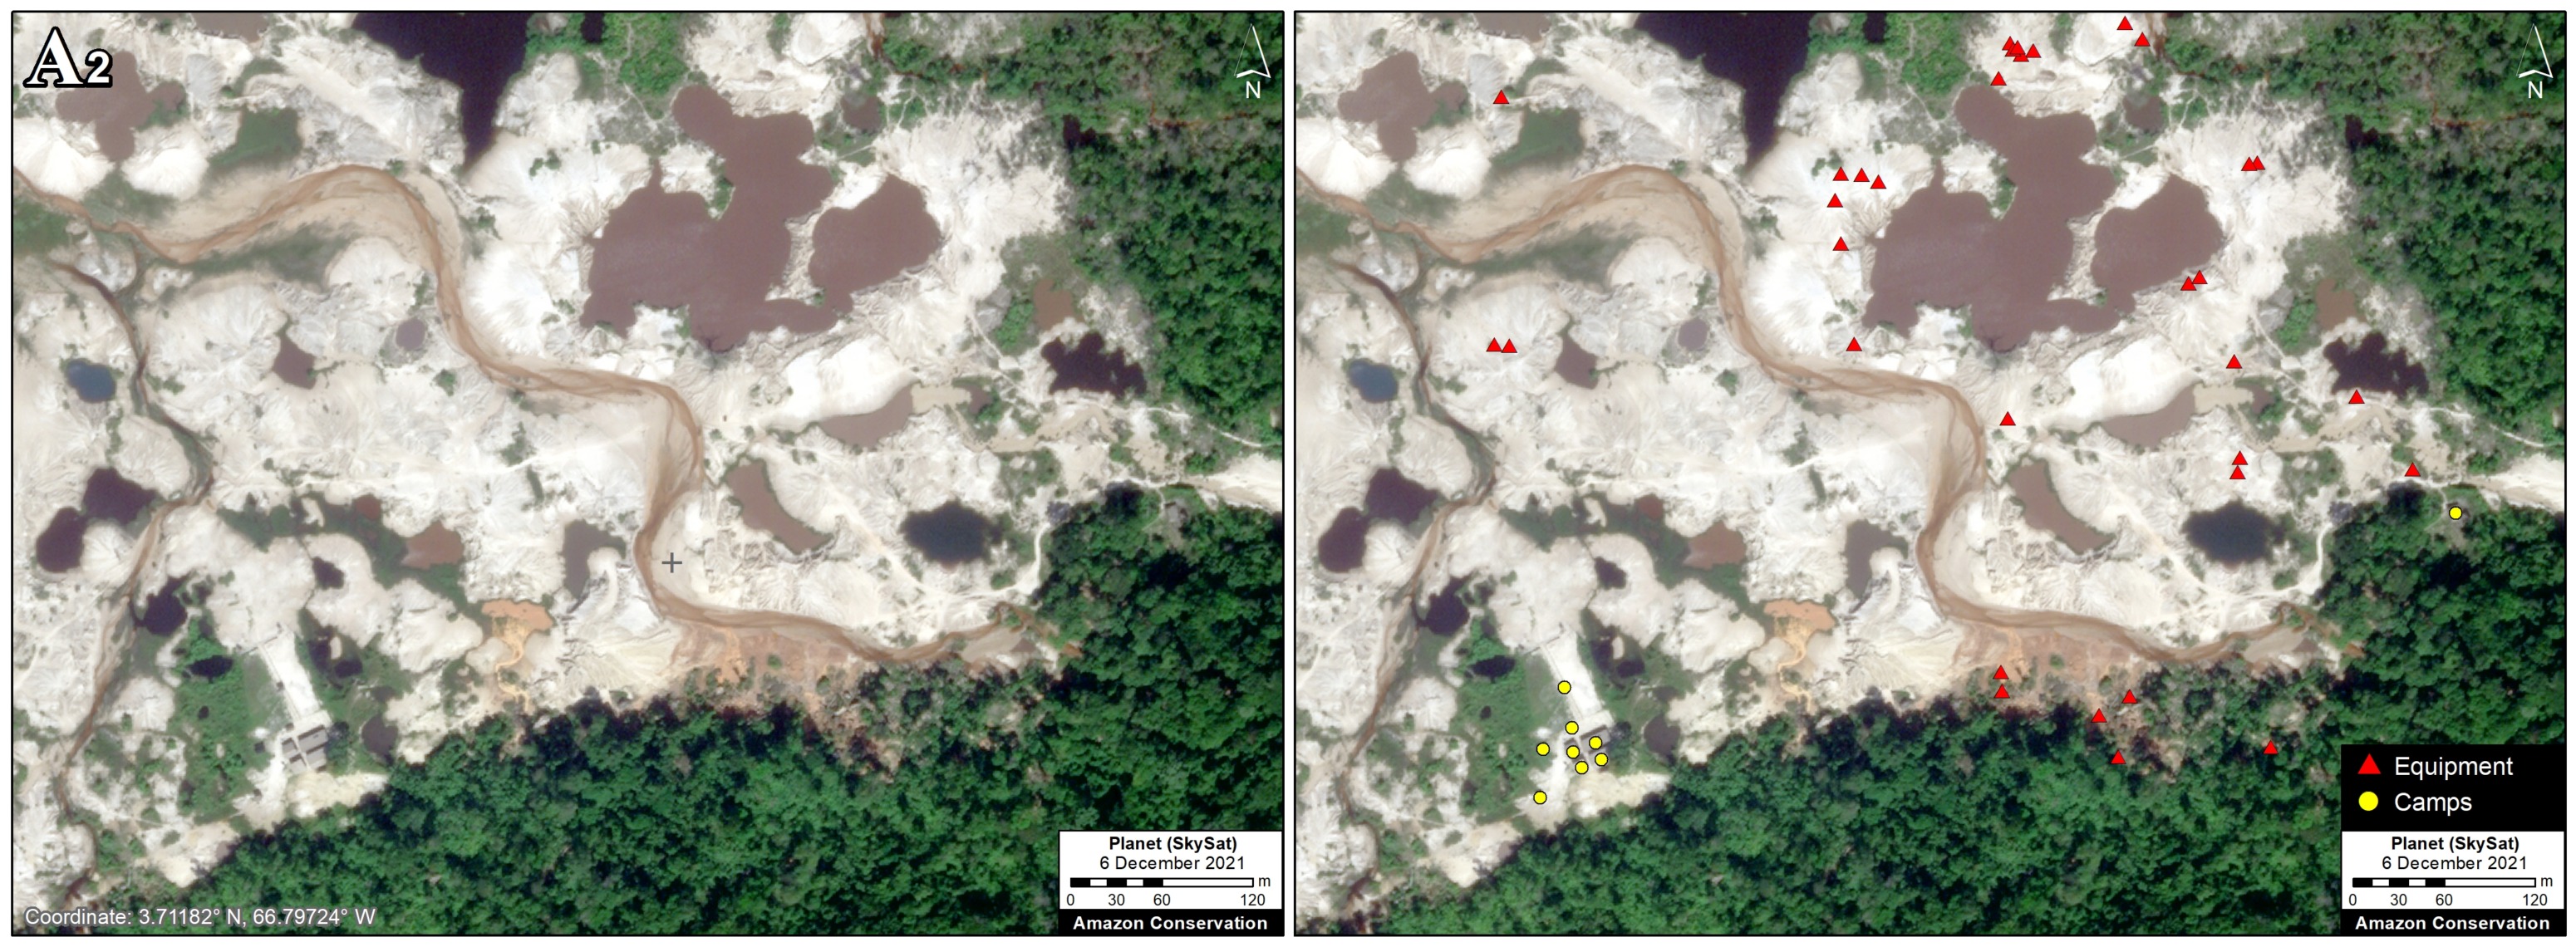
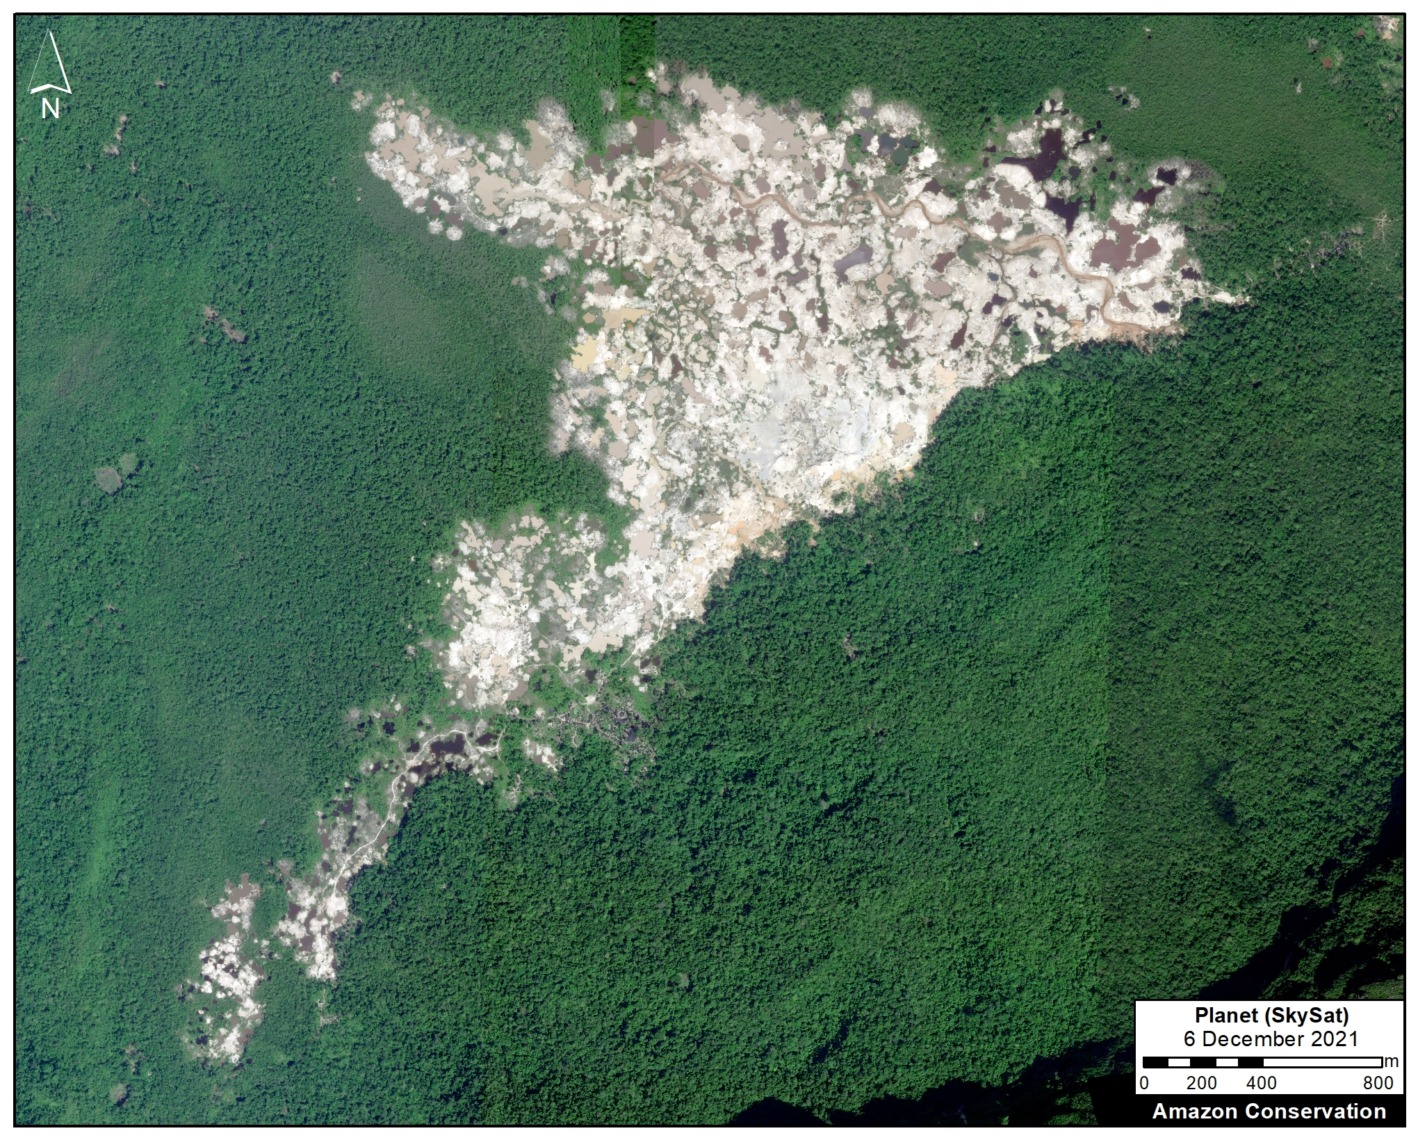
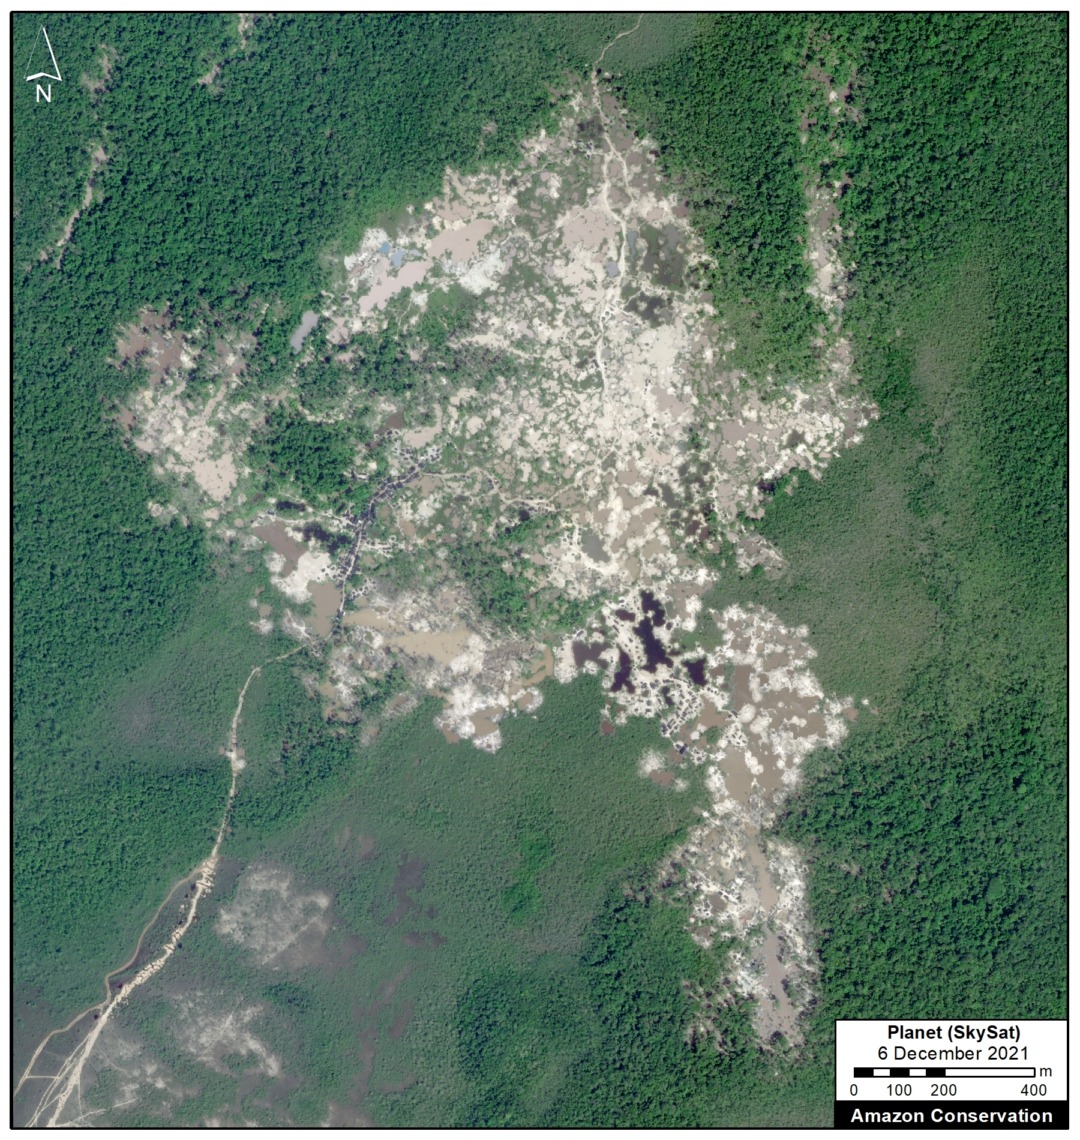
Zoom A. Yapacana National Park

Yapacana National Park, which is a unique mosaic of natural savannas and forest, is currently experiencing deforestation impacts from active mining operations. We show two examples of recent mining in the Cerro Yapacana mining sector, featuring very-high resolution imagery from late 2021 (see Zooms A1 and A2). These two areas have lost over 550 hectares since the early 2000s.

Zoom A1. Mining deforestation in Yapacana National Park. Data: Planet/Skysat.
Zoom A2. Mining deforestation in Yapacana National Park. Data: Planet/Skysat.


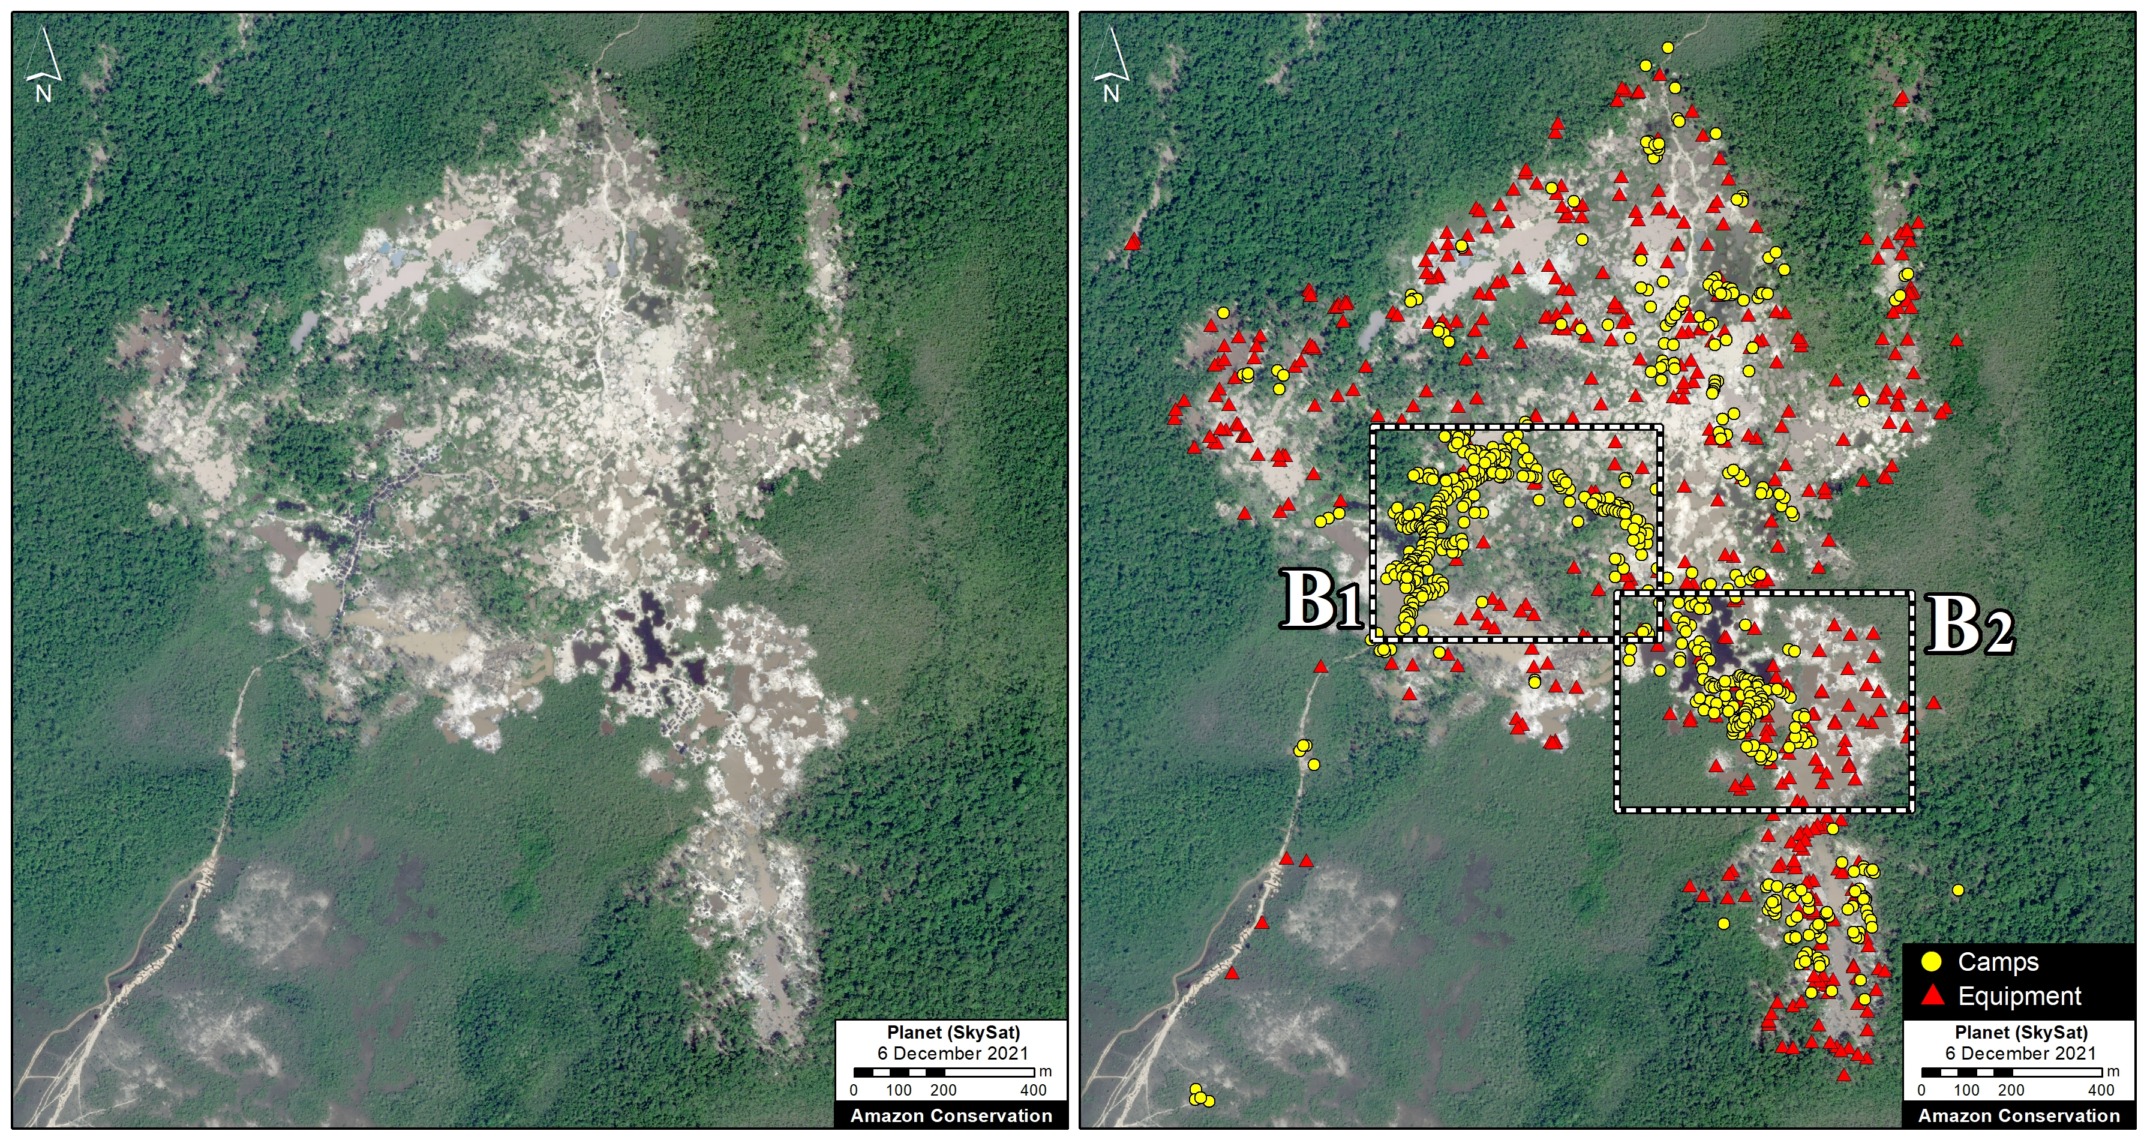
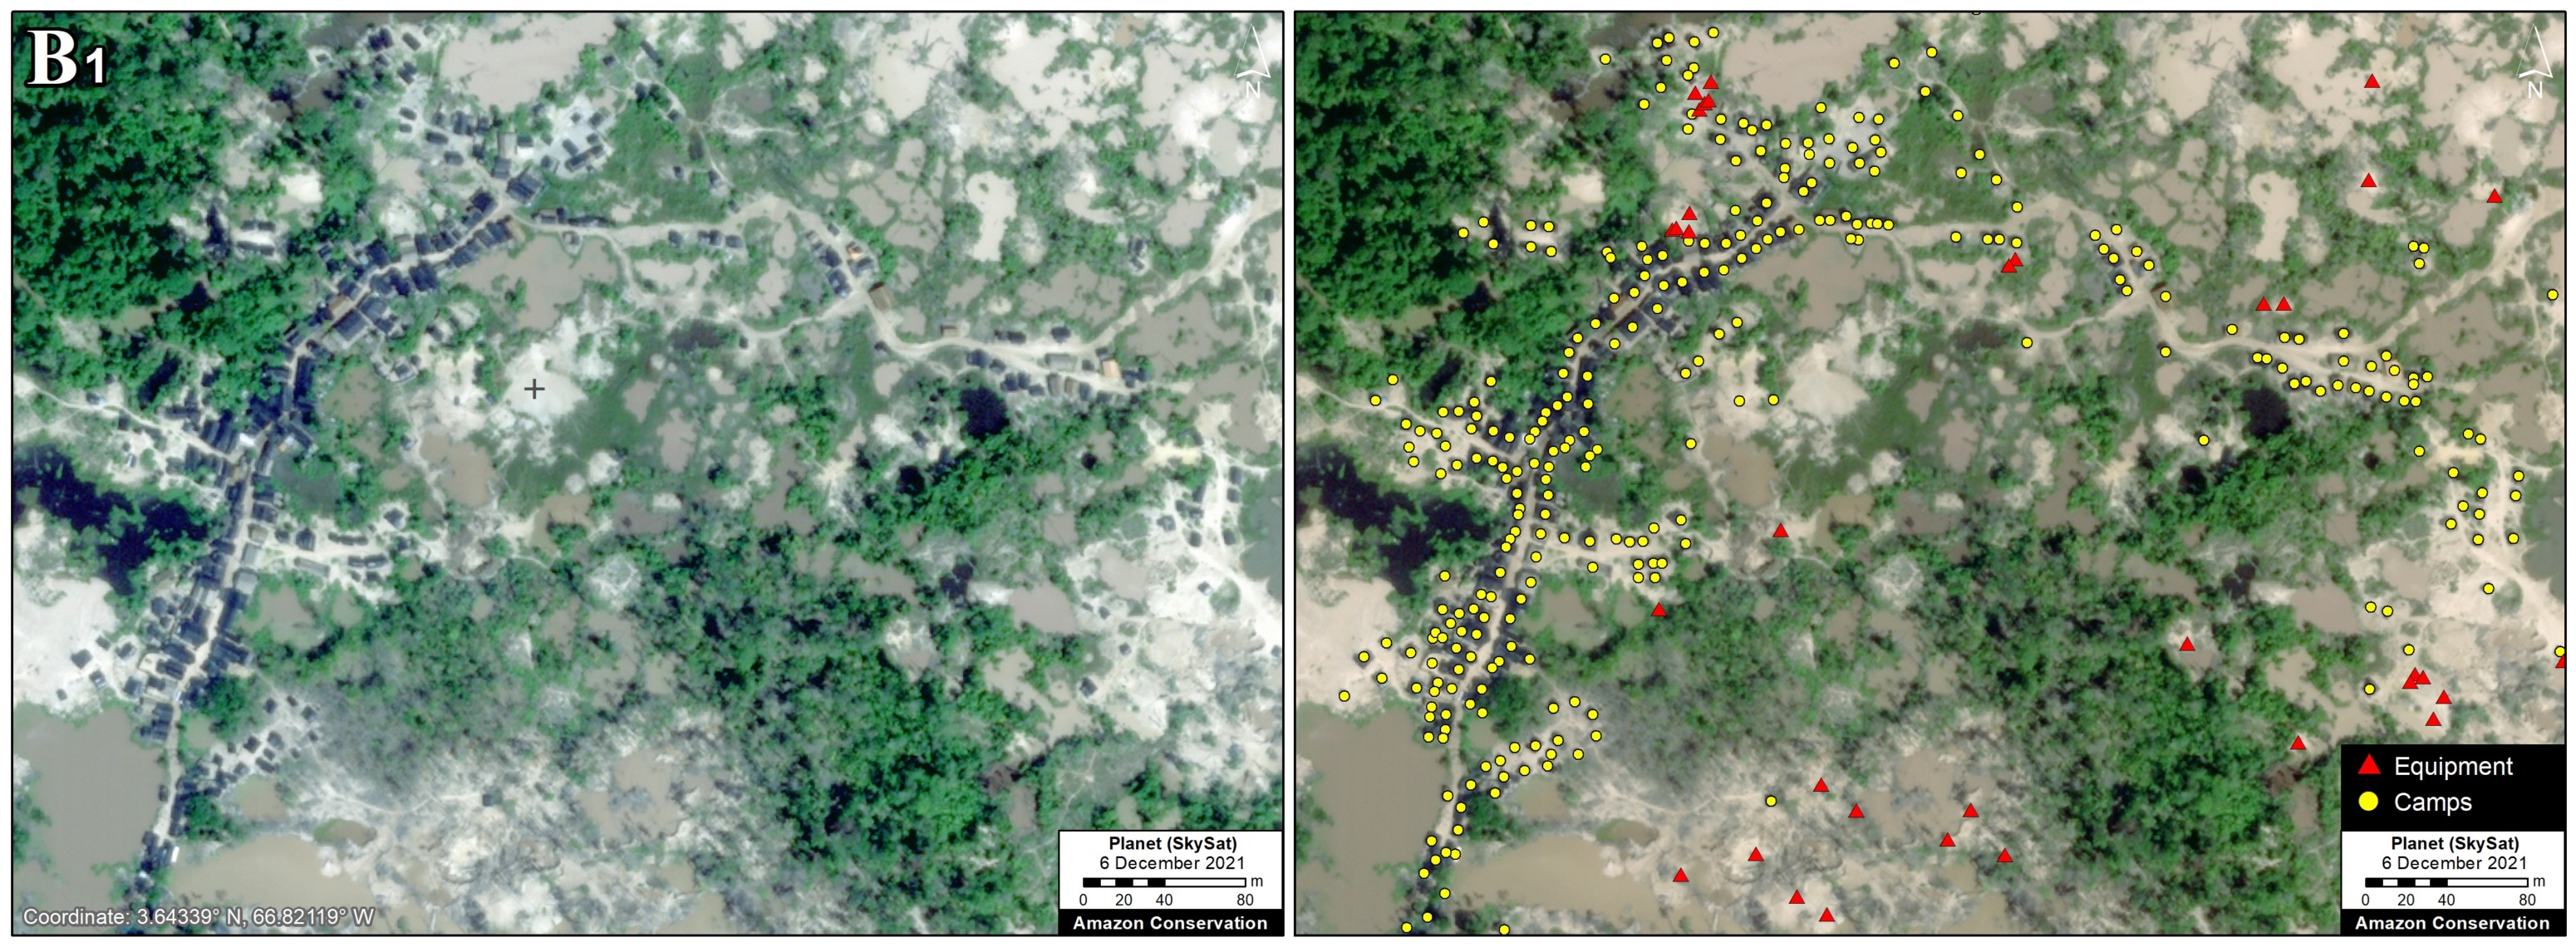
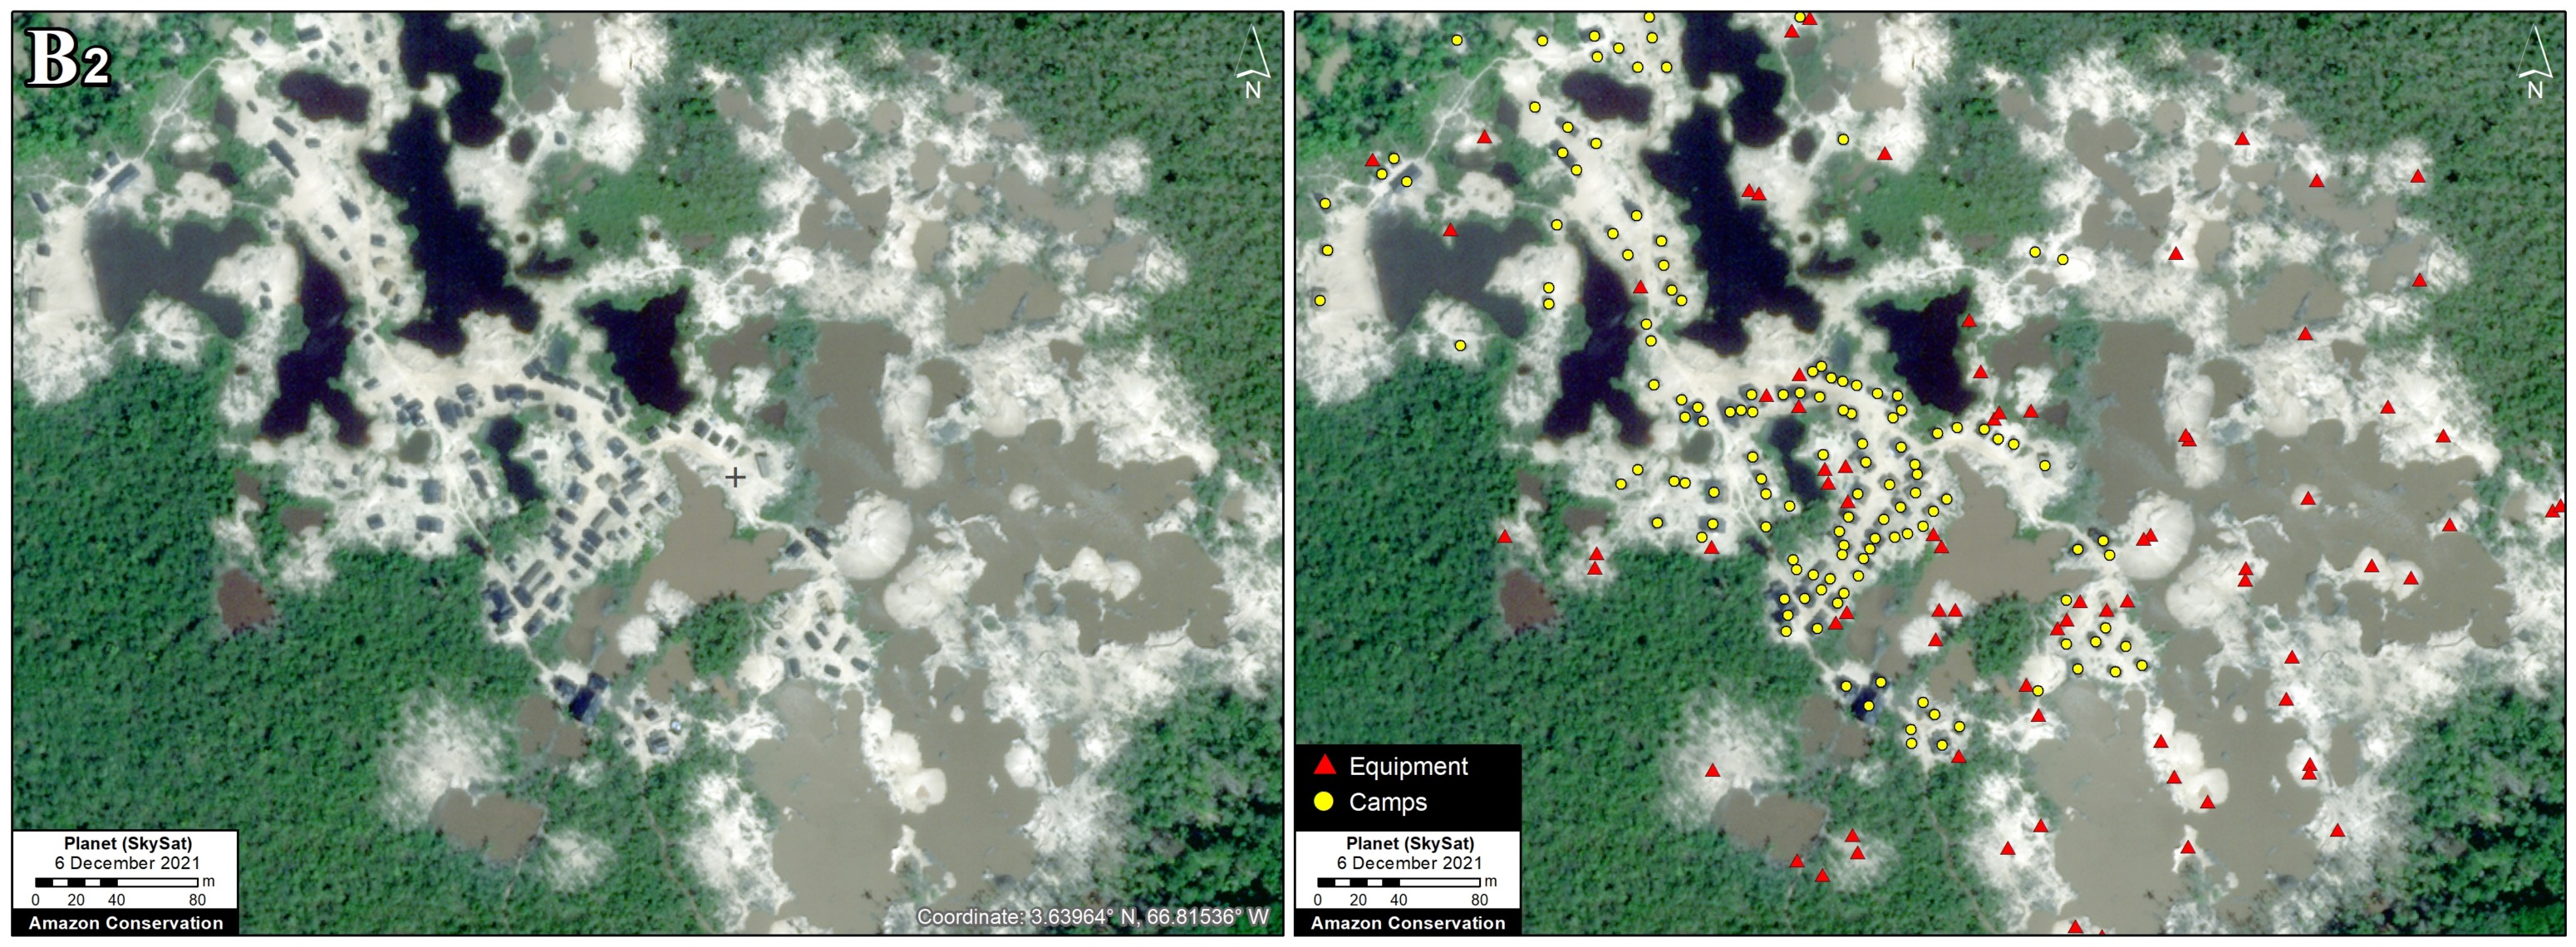
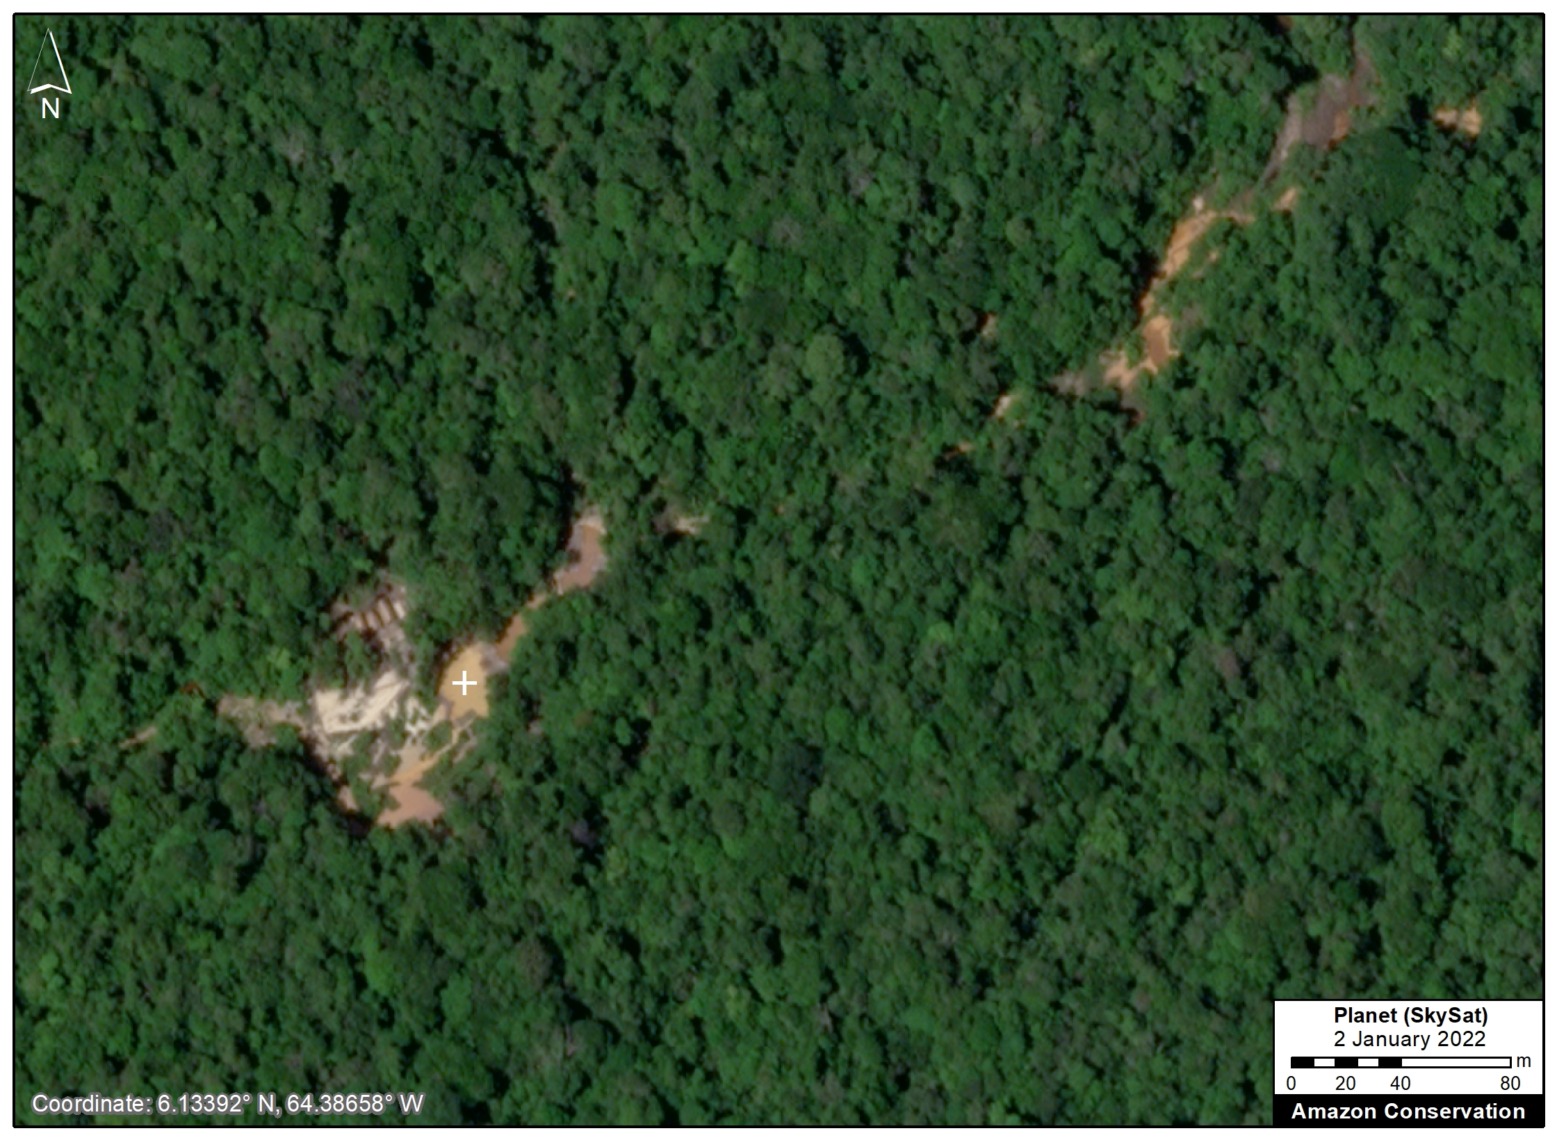
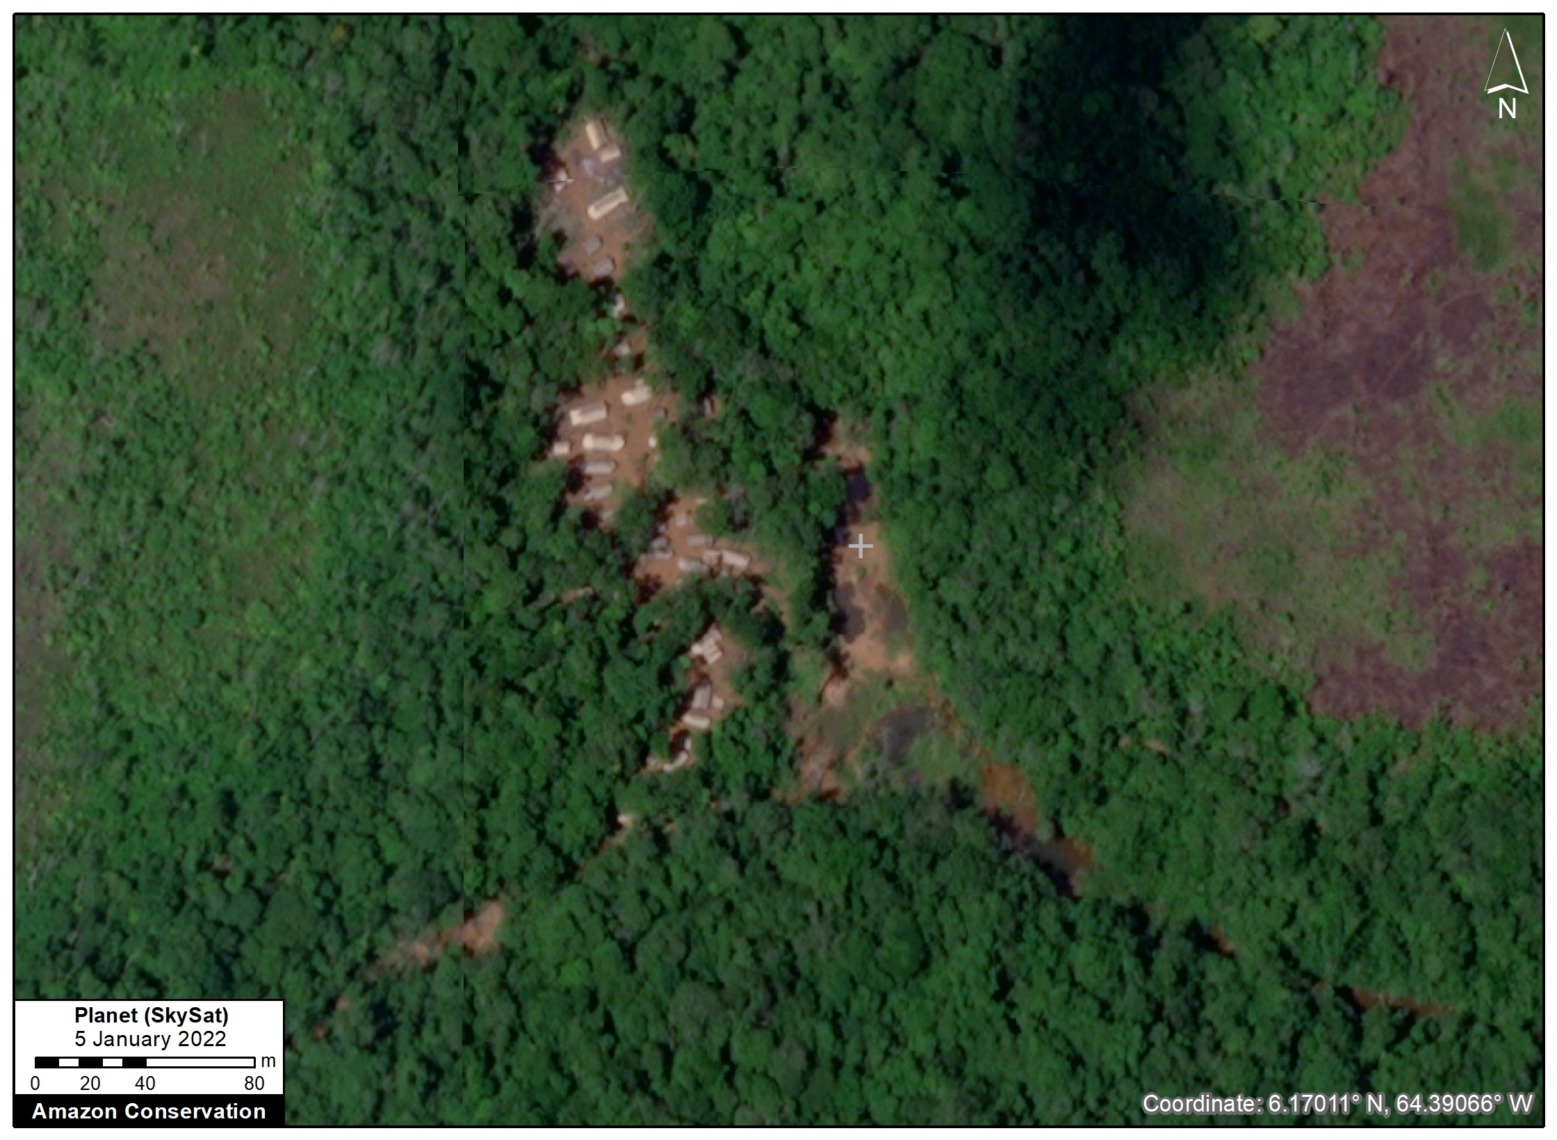
Zoom B. Caura National Park

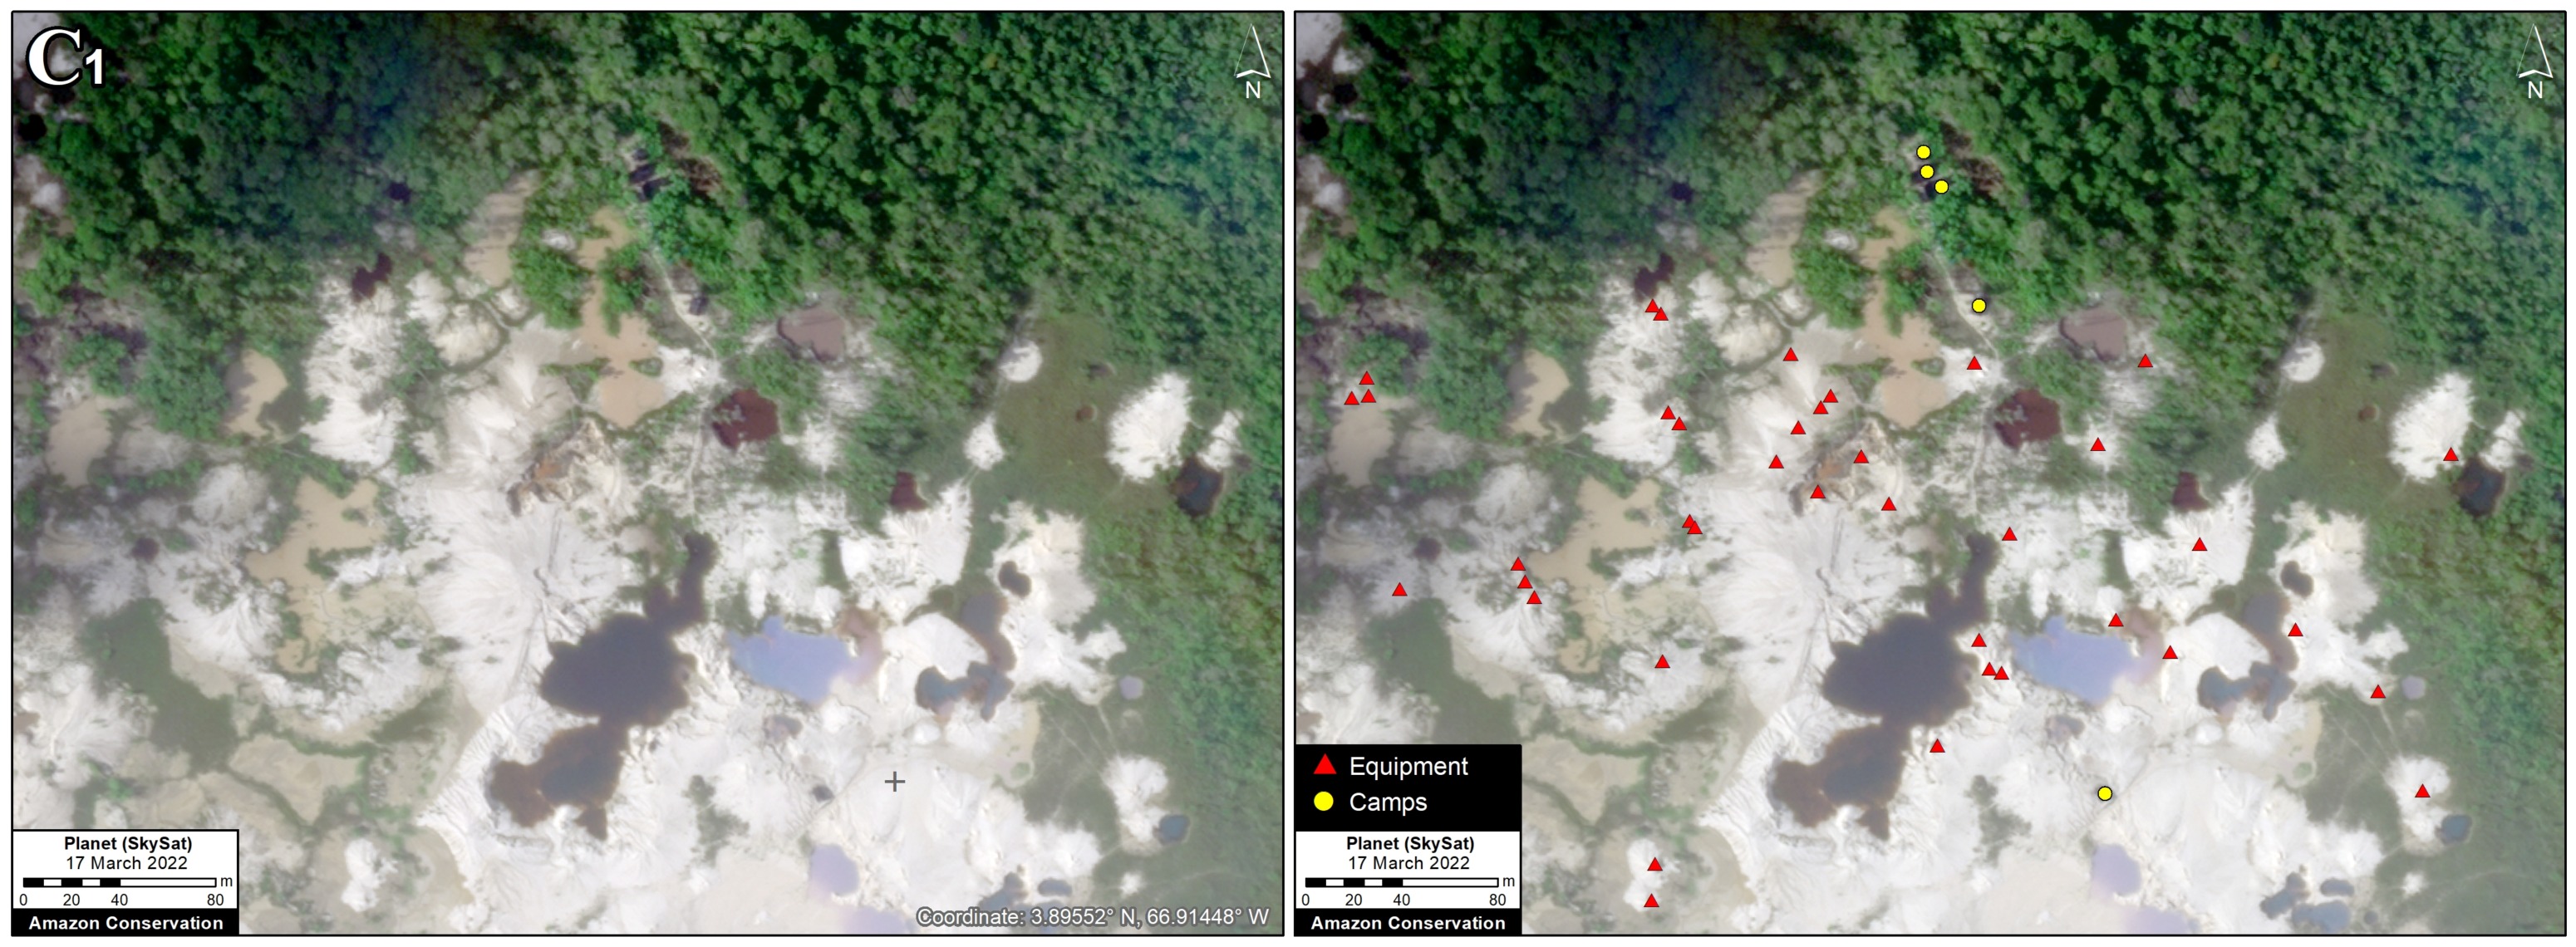
Caura National Park is also experiencing active mining activity. Below are two examples of recent mining activity, featuring very-high resolution imagery from early 2022 (see Zooms B1 and B2).


Zoom B1. Mining deforestation in Caura National Park. Data: Planet/Skysat.


Zoom B2. Mining deforestation in Caura National Park. Data: Planet/Skysat.

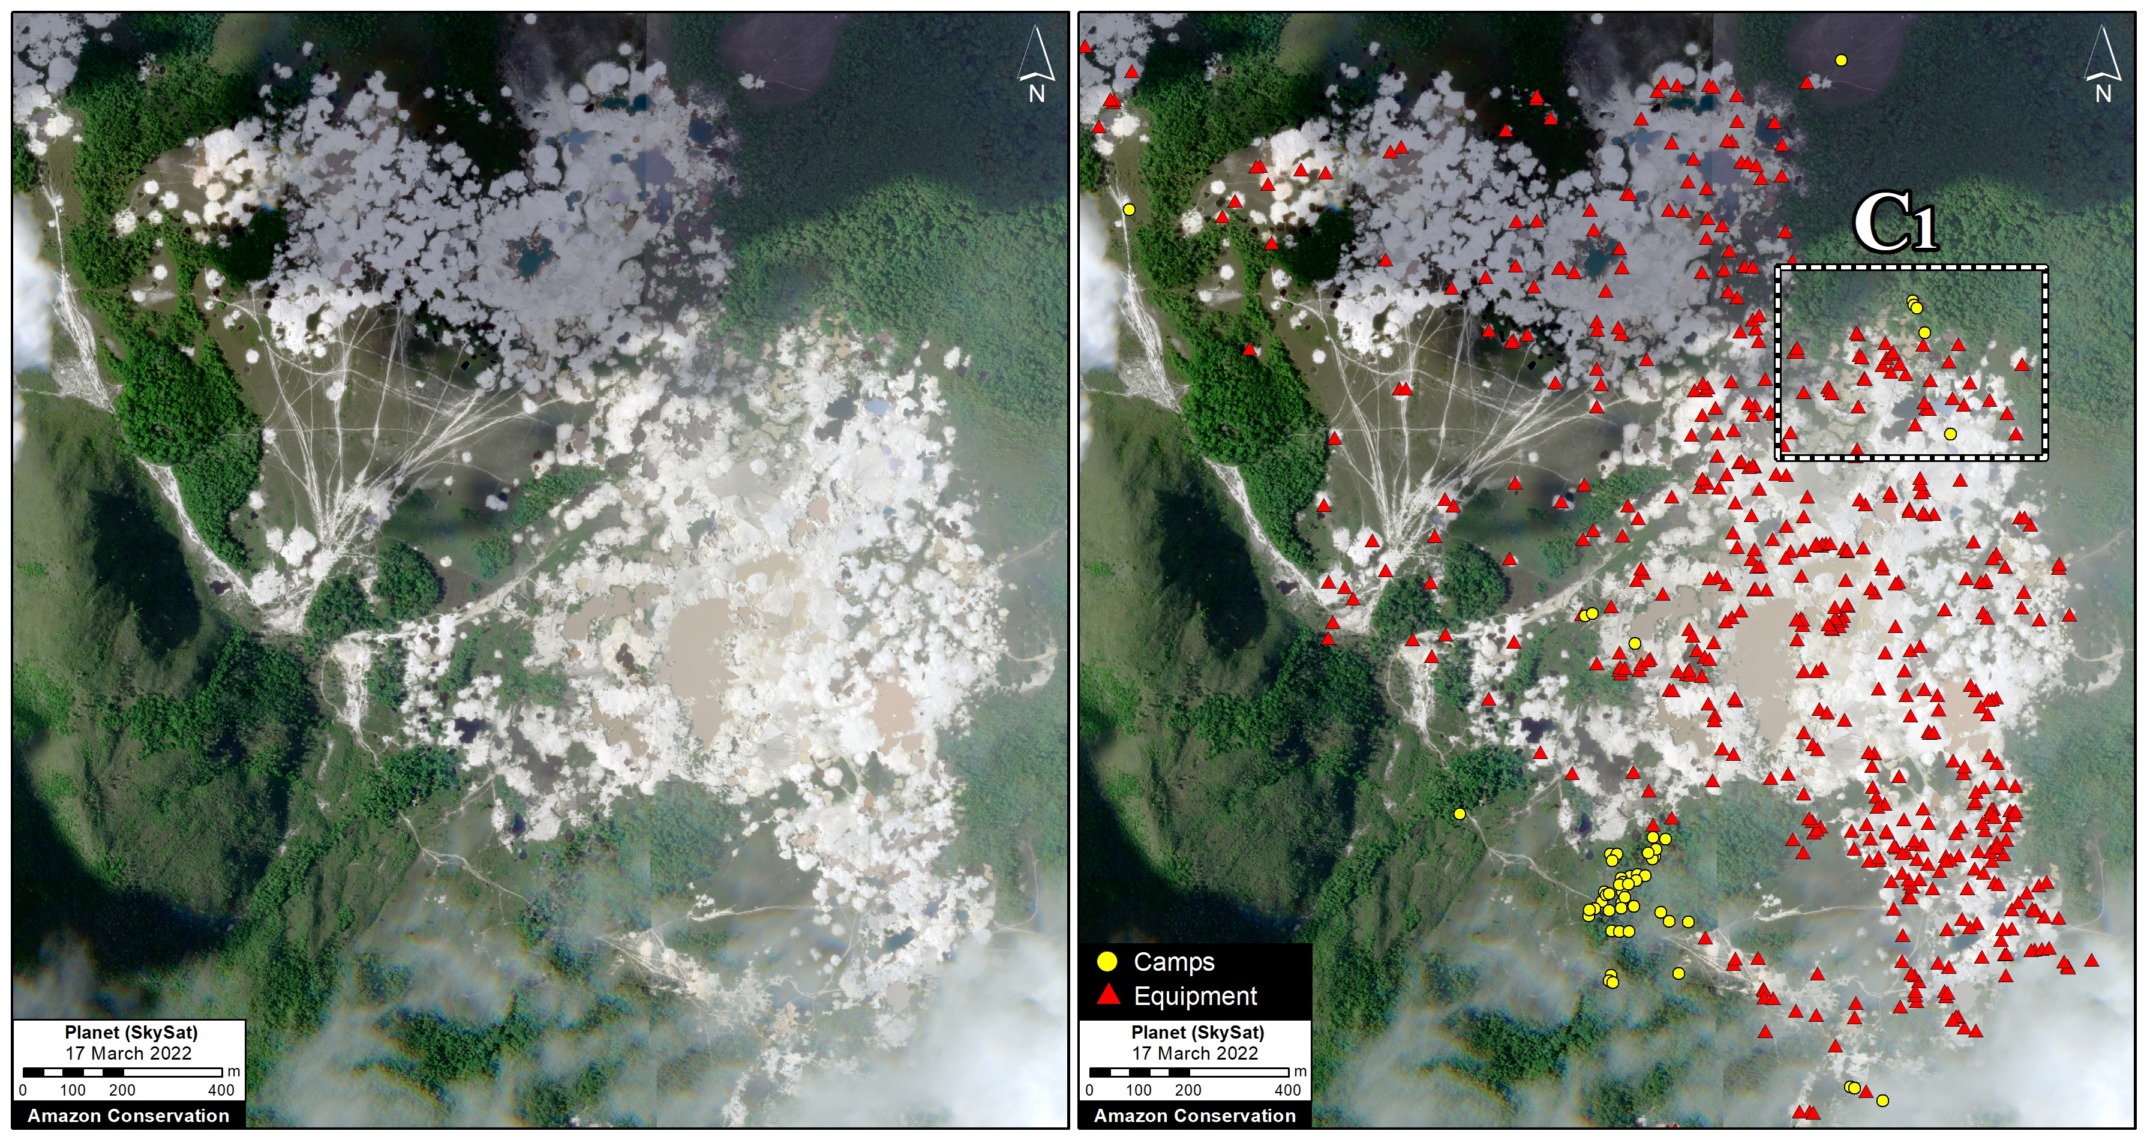
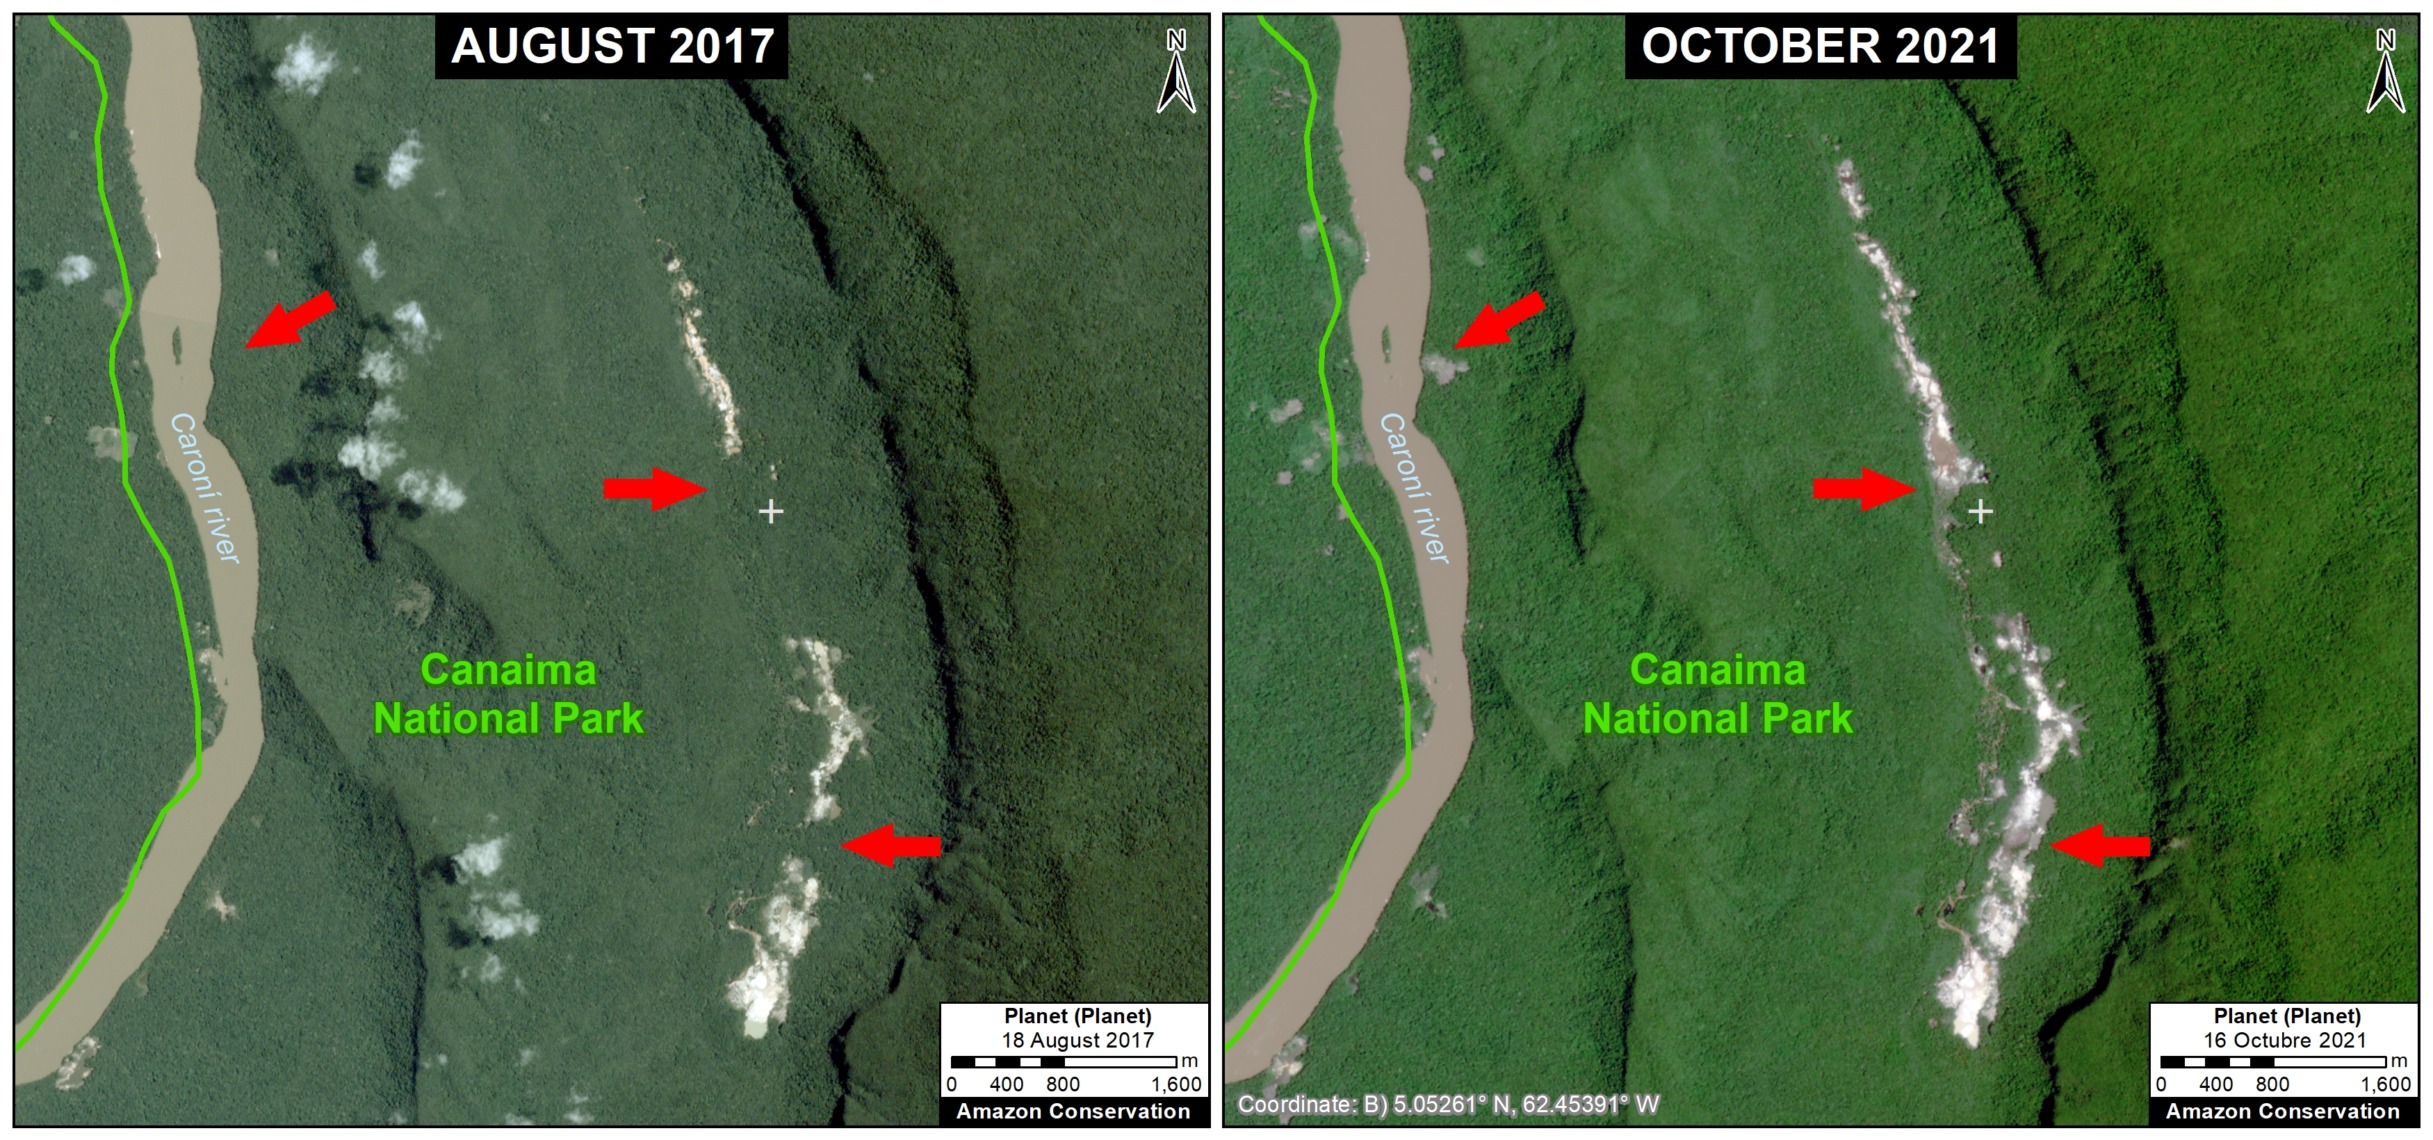
Zoom C. Canaima National Park

The following image shows the recent expansion of mining deforestation in Canaima National Park between 2017 (left panel) and 2020 (right panel).

Zoom C. Mining deforestation in Canaima National Park. Data: Planet/Skysat.

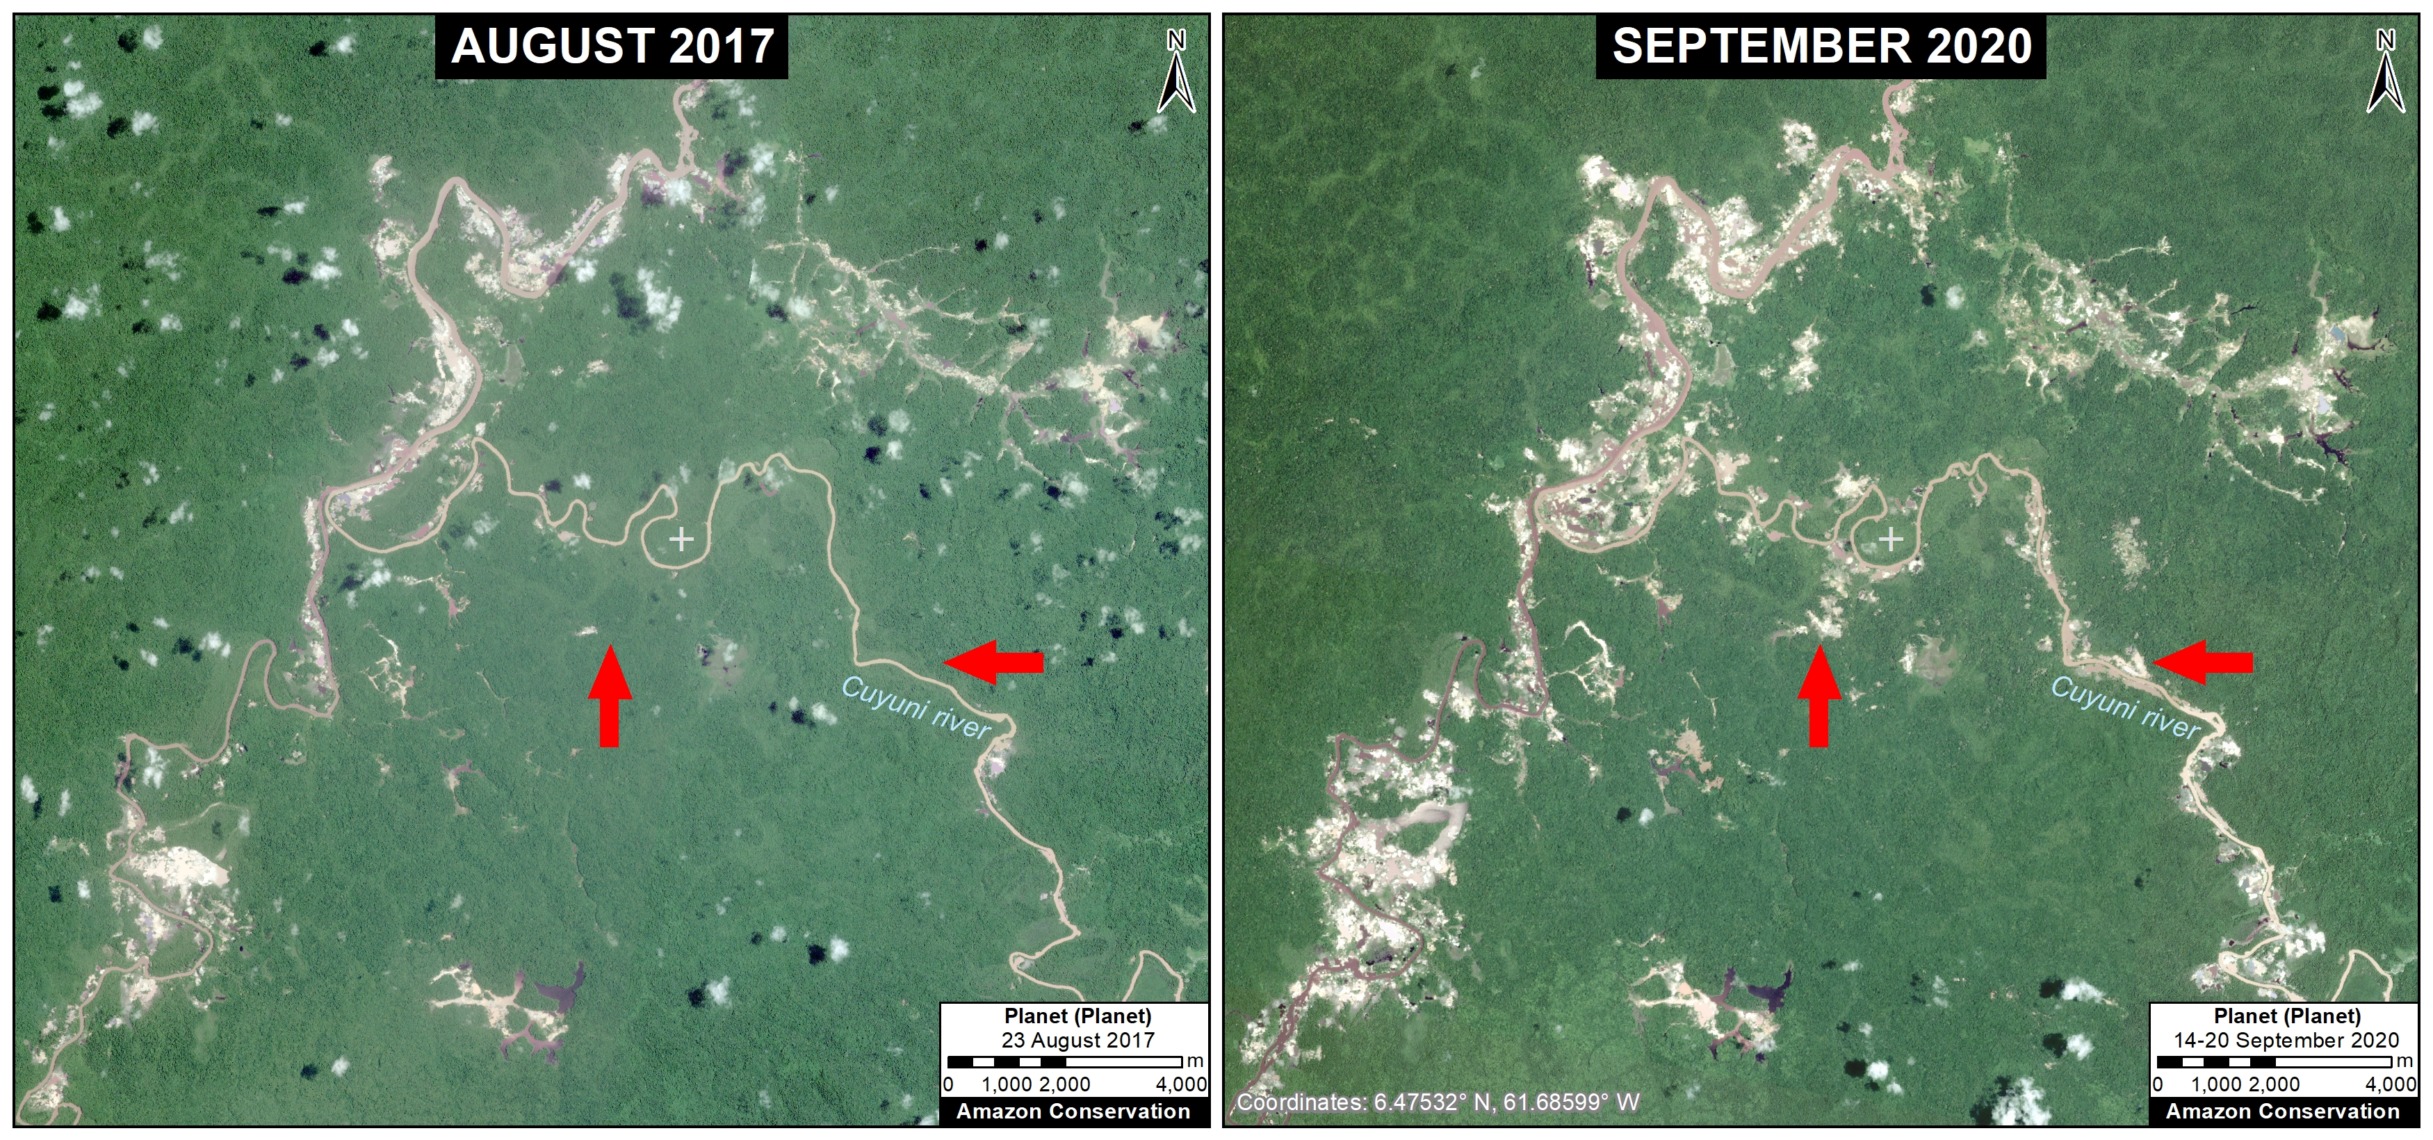
Zoom D: Orinoco Mining Arc

To the north of these protected areas, there is both industrial and river-based mining deforestation in the Orinoco Mining Arc. Zoom D shows an example of major river-based mining deforestation (over 1,800 hectares) between 2017 and 2020, plus a very-high resolution imagery from late 2021.

Zoom D. Mining deforestation in the Orinoco Mining Arc. Data: Planet.

Agriculture

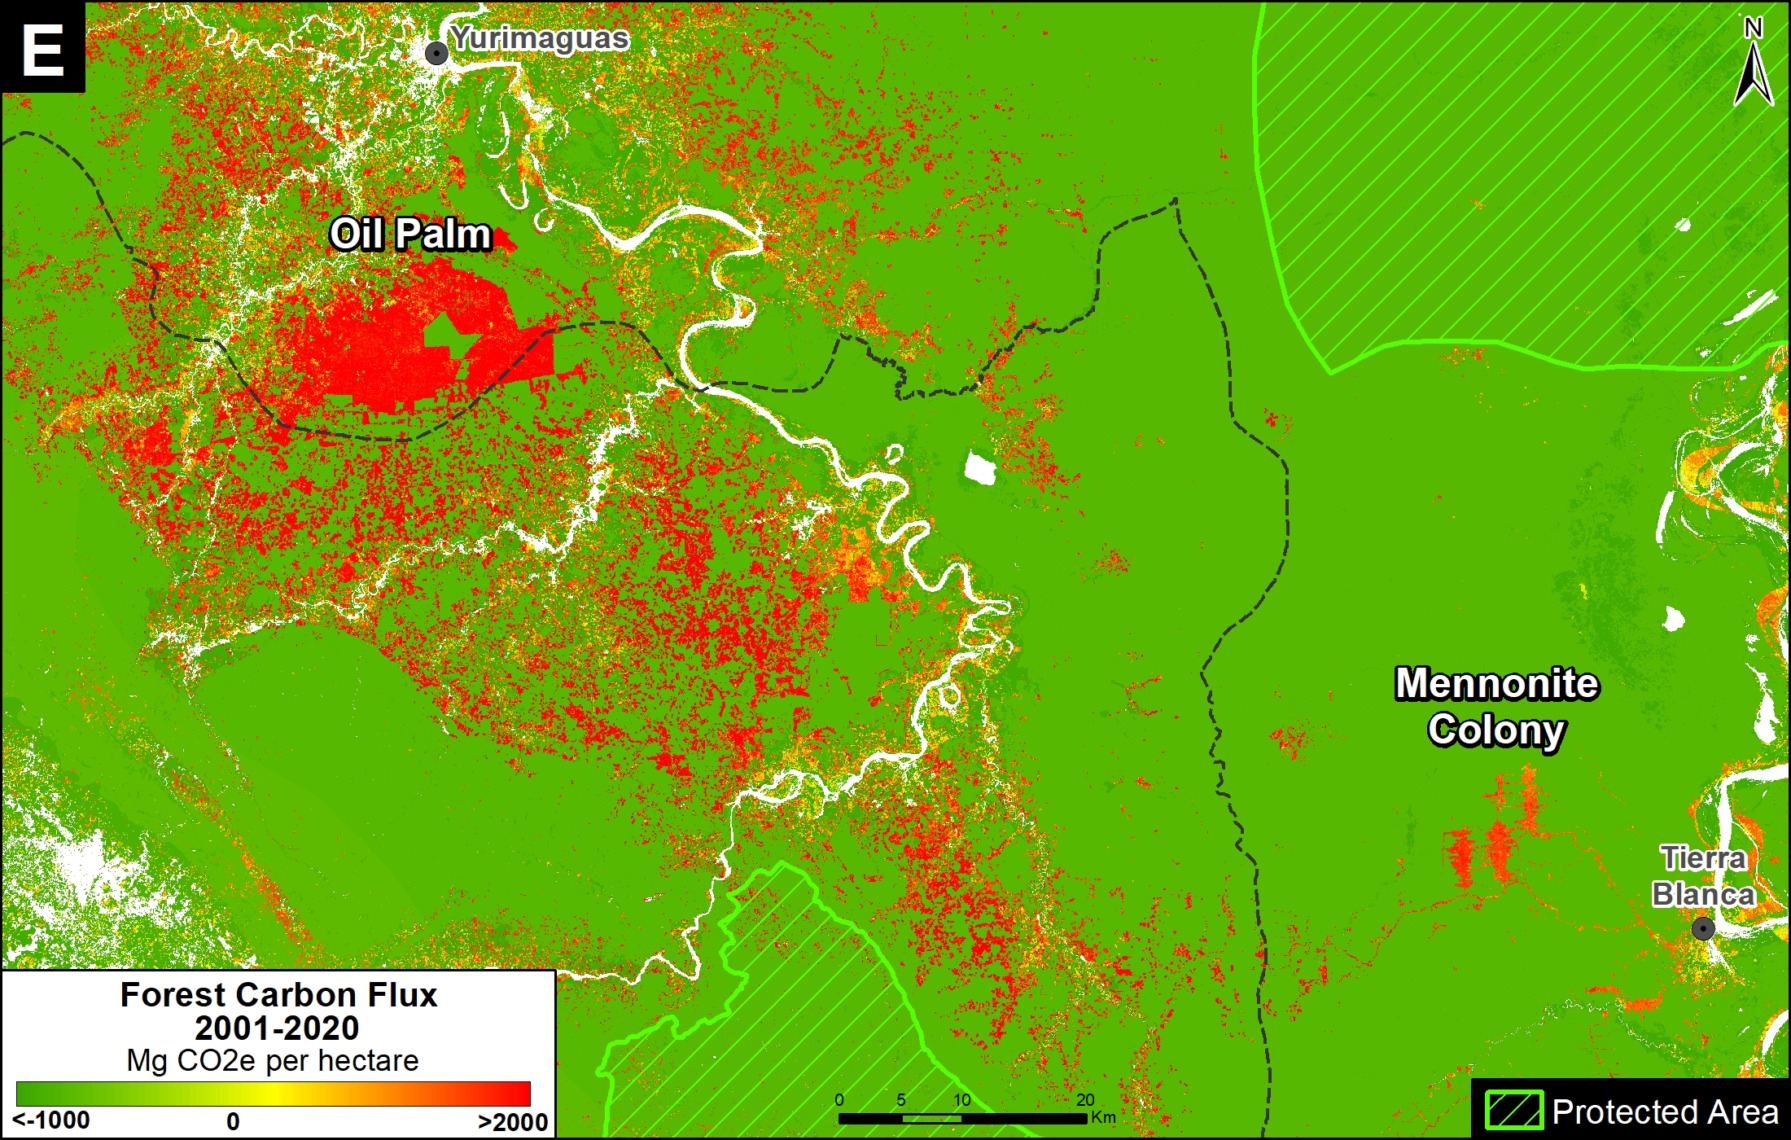
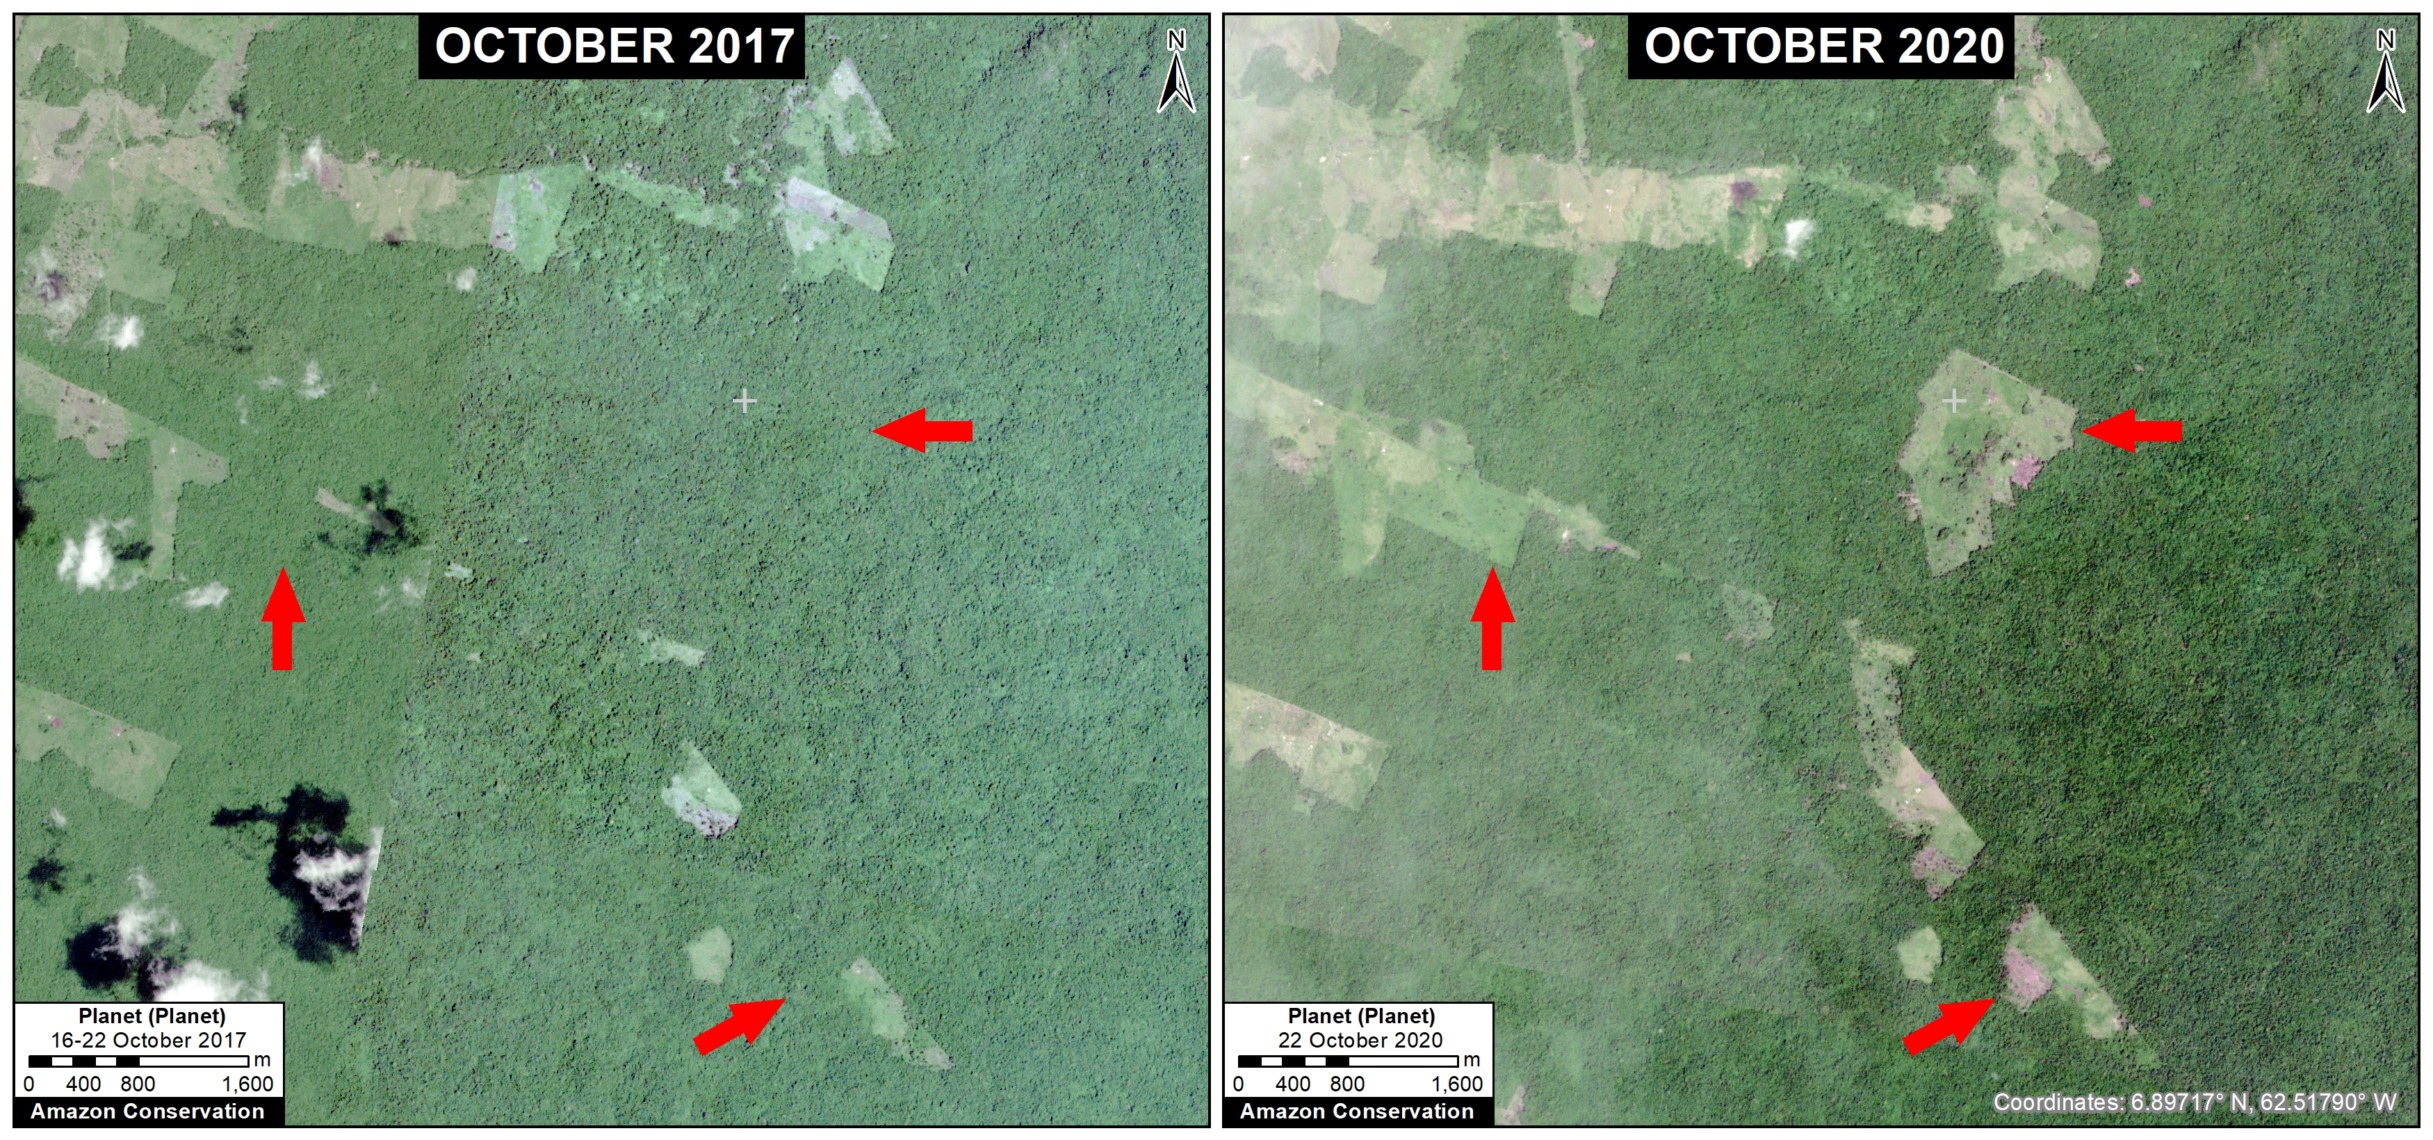
Zoom E shown an example of agricultural expansion (likely cattle ranching) in the northeastern section of the Orinoco Mining Arc. We estimate the forest loss shown in the panels between 2017 and 2020 is over 400 hectares.
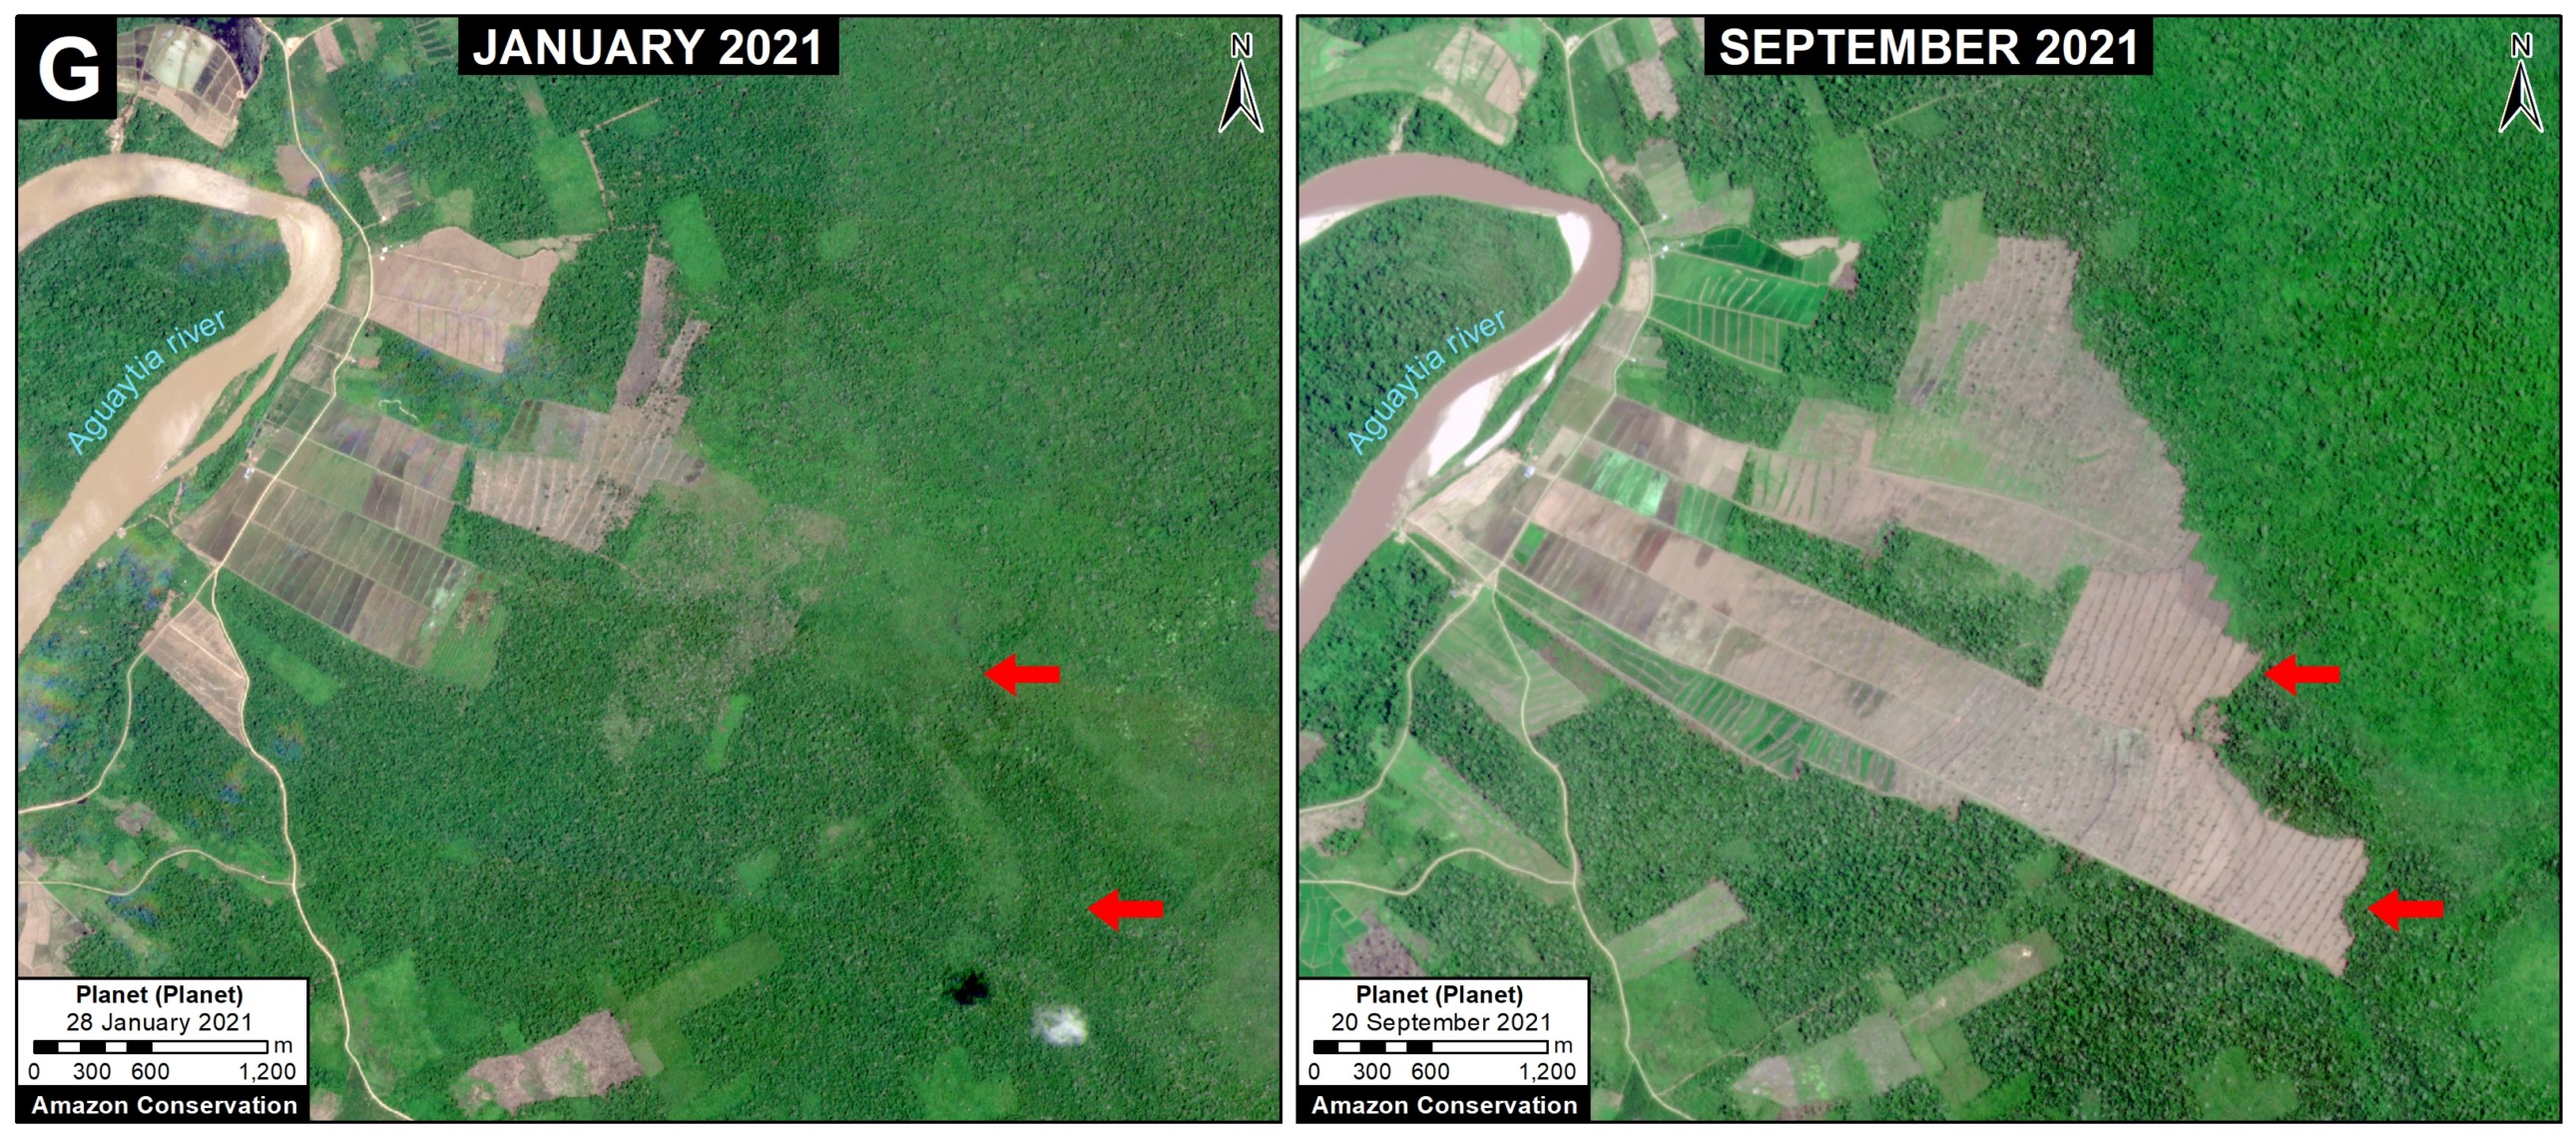
Zoom E. Agricultuire deforestation in the Orinoco Mining Arc. Data: Planet.

Fire

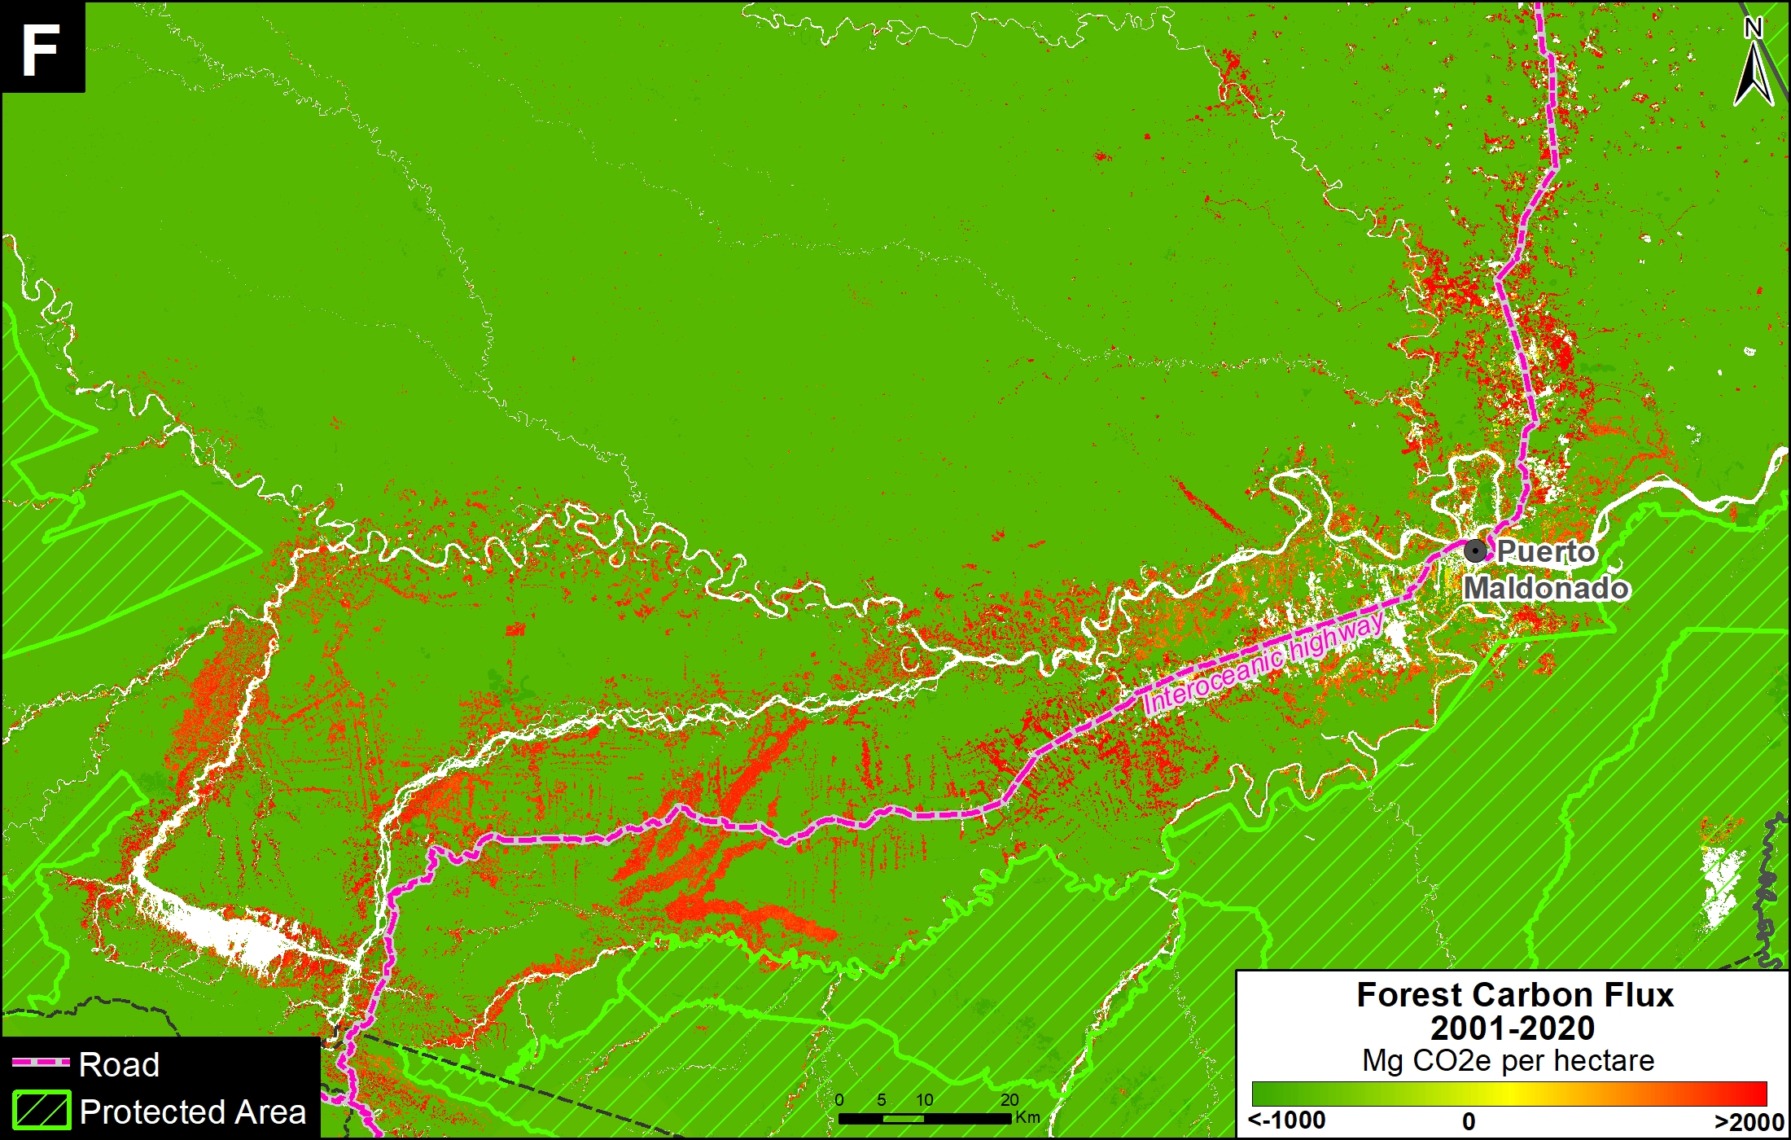
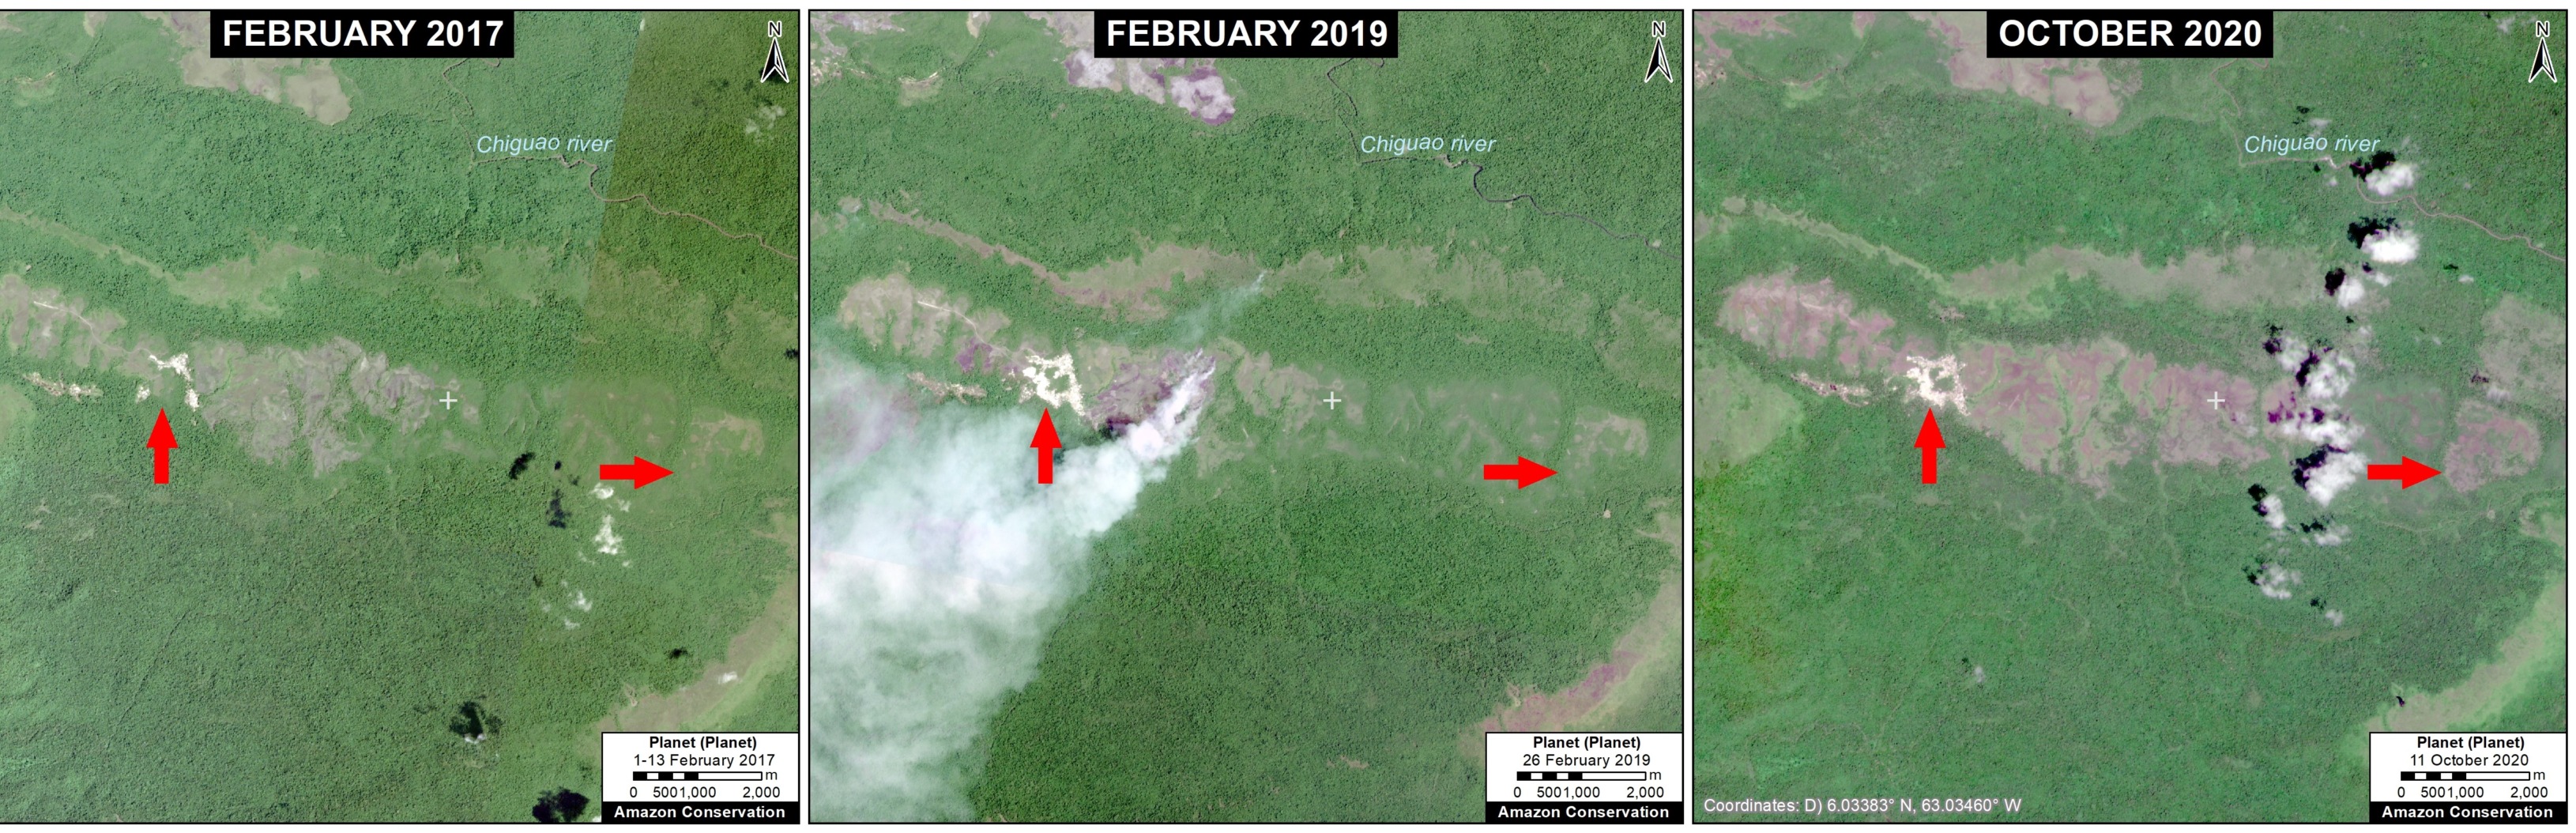
Finally, Zooms F and G show recent examples of major fires impacts. Zoom F is an area that experienced major fires in 2019 within and around Canaima National Park. We estimate the forest loss shown in the panels between 2017 and 2020 is 1,175 hectares.

Zoom F. Major fires in 2019 within and around Canaima National Park. Data: Planet.

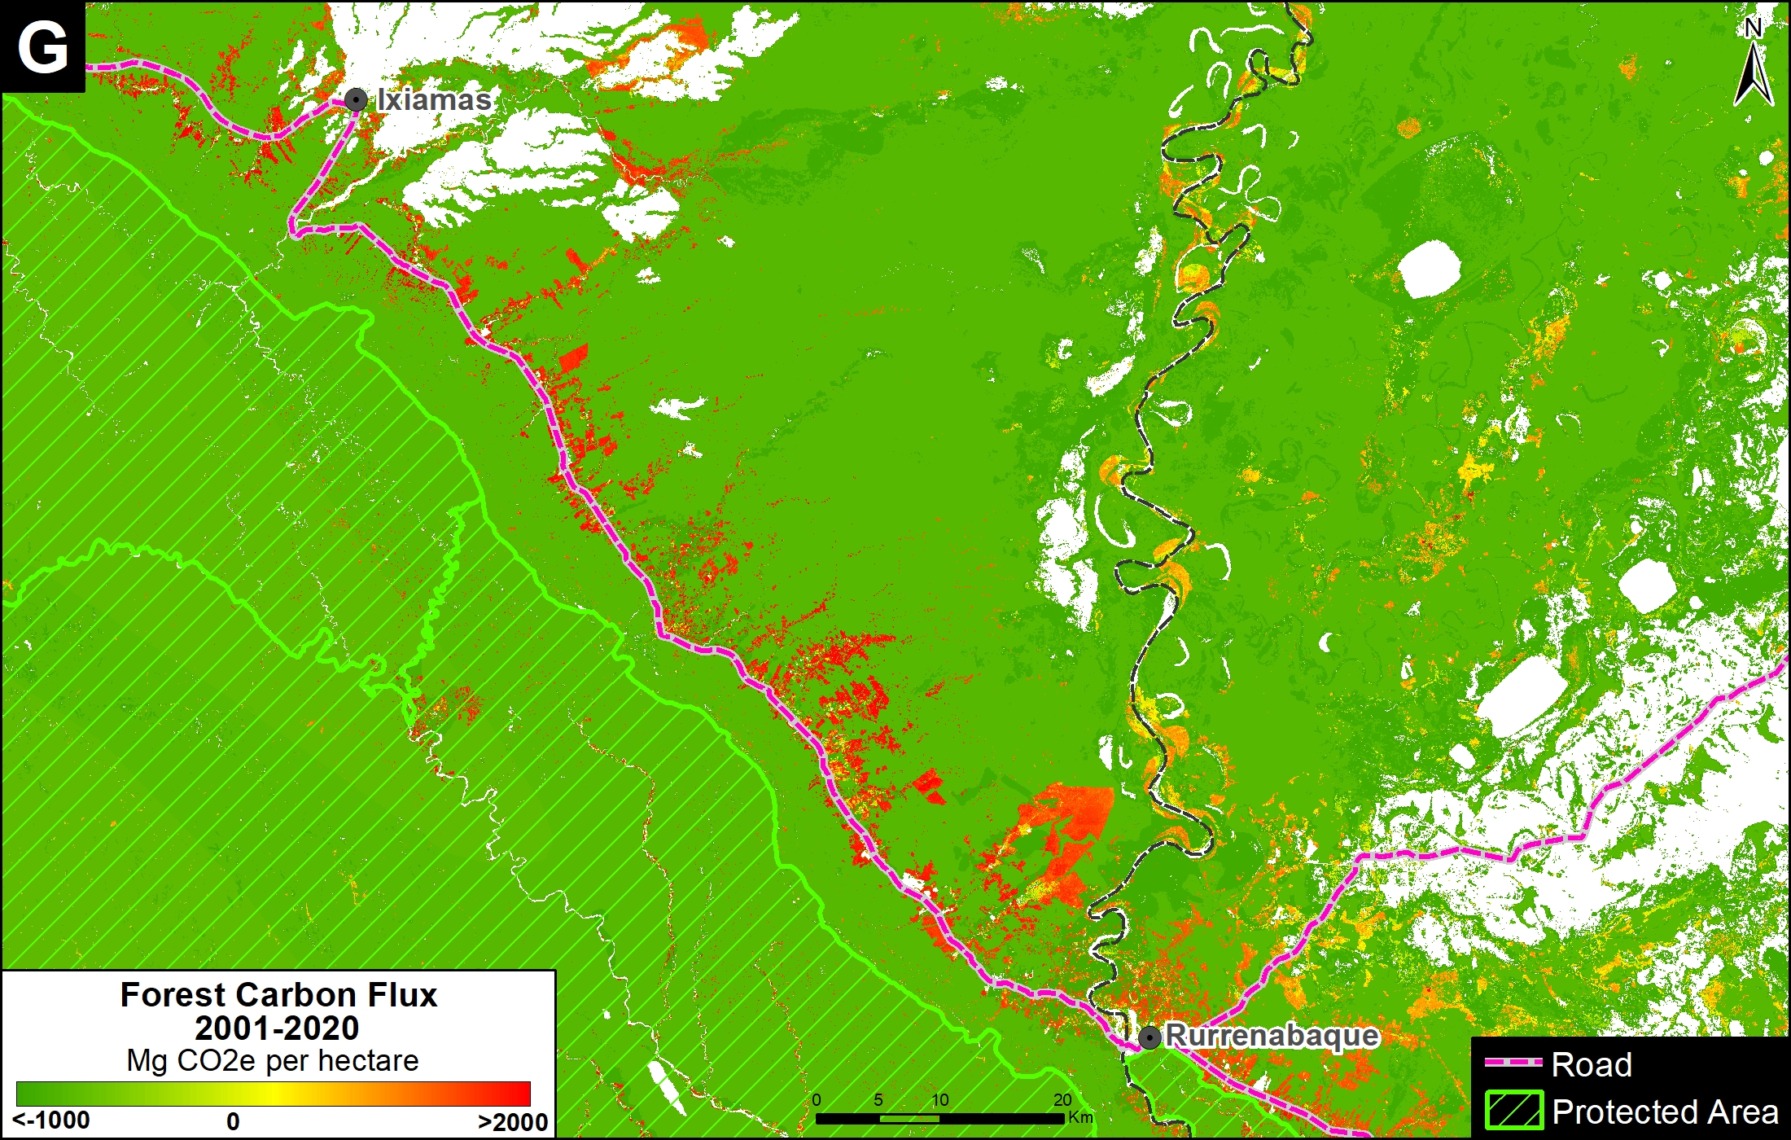
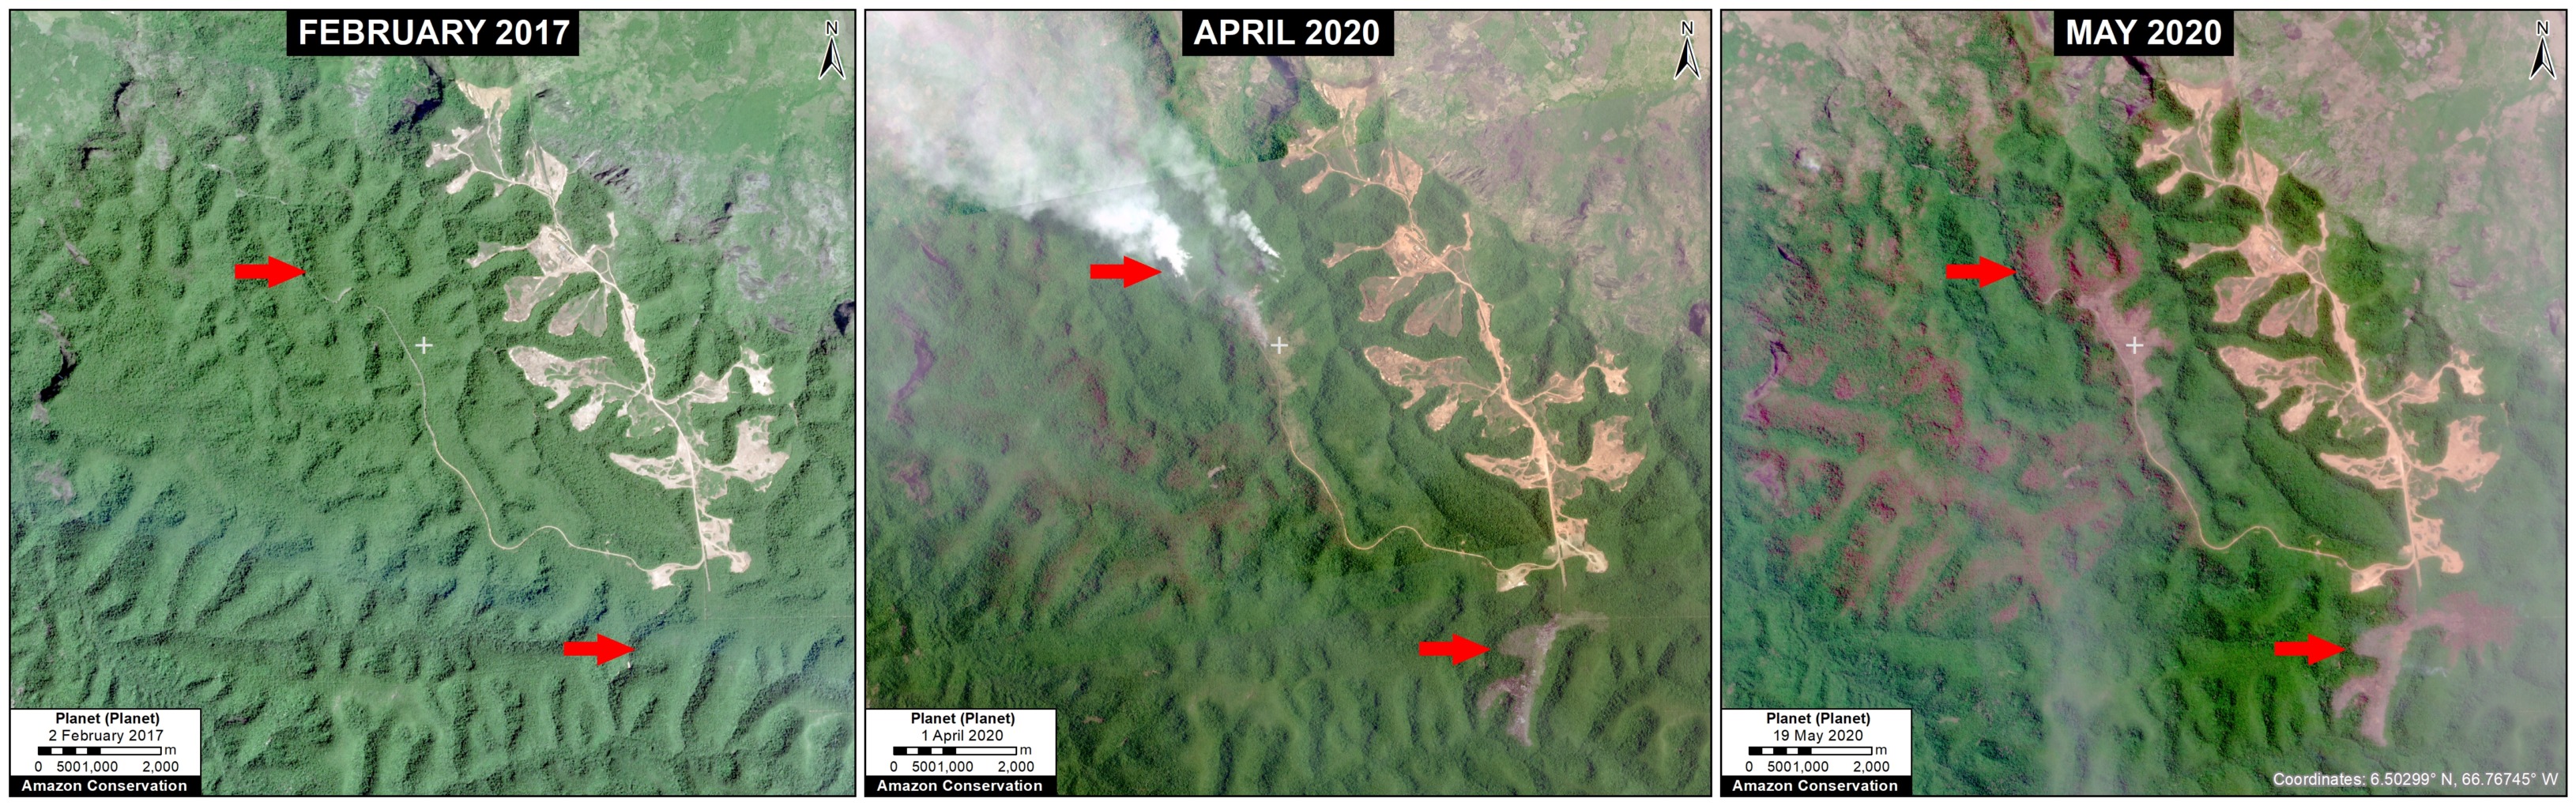
Zoom G is an area that experienced major fires in 2020 in the near mining sites in the western section of the Orinoco Mining Arc. We estimate the forest loss shown in the panels between 2017 and 2020 is 1,128 hectares.

Zoom G. Major fires in 2020 in the Orinoco Mining Arc. Data: Planet.

Methodology

For a study area with maximum inclusion, for the Venezuelan Amazon we used the wider biogeographic boundary (as defined by RAISG) rather than the strict Amazon watershed boundary (which actually only includes a small portion of Venezuela).

We obtained data for the Orinoco Mining Arc (Arco Minero del Orinoco) and protected areas from the organization SOSOrinoco. The latter dataset contains Areas Under Special Administration Regime (Áreas Bajo Régimen de Administración Especial – ABRAE), which meet the IUCN international definition of protected areas: national parks, natural monuments, wildlife refuges, reserves and sanctuaries.

We used “primary forest loss” data as our proxy for 2002-2020 annual deforestation. This 30-meter resolution (based on Landsat) data is produced by the University of Maryland and presented by Global Forest Watch. Note that it includes forest loss from fires and natural causes. 2021 early warning alert data is also from University of Maryland.

To identify primary forest loss hotspots, we conducted a kernel density estimate. This type of analysis calculates the magnitude per unit area of a particular phenomenon, in this case forest cover loss. We conducted this analysis using the Kernel Density tool from Spatial Analyst Tool Box of ArcGIS.

Finally, we investigated the major hotspots with both high resolution (3 meters) and very high resolution (0.5 meters) satellite imagery from the company Planet to identify causes (drivers).

References

SOSOrinoco. 2021. Deforestation & Changes in Vegetation &  Land Use Cover within the so-called Orinoco Mining Arc between 2000-2020.

Acknowledgements

We thank the organization SOSOrinoco for important information and comments related to this report.

Citation

Finer M, Mamani N (2022) Deforestation Hotspots in the Venezuelan Amazon. MAAP: 155.

MAAP #156: Intense Mining Activity in Yapacana National Park (Venezuelan Amazon)

Base Map: Mining areas in Yapacana National Park. Data: SOS Orinoco, ACA/MAAP, Planet.

We present the second report in our series focused on the Venezuelan Amazon.

The first (MAAP #155) documented the loss of over 140,000 hectares (345,000 acres) of primary forest over the past four years. We also zoomed in on the major hotspots, showing that mining is one of the primary deforestation drivers, including in protected areas.

Here we focus on a key protected area, Yapacana National Park.

The park, created in 1978, is a key biogeographical site, with diverse ecosystems (including white sand savannahs), high endemism and biodiversity, and unique Guiana Shield outcrops. Illegal mining started in the park in the 1980s and started to surge in the 2000s (see SOS Orinoco 2020 for details on the complex socio-political issues).

We show Yapacana National Park is currently experiencing intense illegal mining activity.

Specifically, we carried out a detailed estimate of current mining camps and machinery, based on recent and very high-resolution Skysat satellite imagery from Planet (0.5 meters).

We found over 8,000 mining data points (over 4,100 camps and 3,800 pieces of machinery), indicating that Yapacana National Park may currently be the most impacted site in the Amazon (replacing the case La Pampa in the buffer zone of Tambopata National Reserve, in the southern Peruvian Amazon), based on density of mining-related activity.

The goal of this report is to precisely inform the international community about the magnitude of the crisis in Yapacana National Park in hopes of an eventual solution.

Intense Mining in Yapacana National Park

The Base Map (see above) shows the major mining sectors in Yapacana National Park and our Skysat coverage over the recent time period of December 2021 to March 2022 (vertical dark green polygons). In this area, we recorded an astounding 8,214 mining data points (4,167 camps and 3,884 pieces of machinery). This finding is consistent with previous estimates that there are over 2,000 illegal miners operating in the park (and even indicates that this is an underestimate).

The Letters A-C correspond to the zoom images below.


Zoom A: Cerro Yapacana (north)

Zoom A centers on a major mining area in the Cerro Yapacana sector that experienced the deforestation of 360 hectares since the early 2000s, including a spike starting in 2016. It shows a very high-resolution Skysat image from early December 2021, with and without the mining data (left and right panel, respectively). Note how the second image brings out previously “invisible” elements within the overall mining area: 945 mining data points (413 camps and 532 equipment).  Further below, Zooms A1 and A2 further illustrate this point.

Zoom A. Mining activity in the Cerro Yapacana northern sector without (left panel) and with (right panel) the mining data. Data: ACA/MAAP, Planet (Skysat).
Zoom A1. Mining activity in the Cerro Yapacana sector without (left panel) and with (right panel) the mining data. Data: ACA/MAAP, Planet (Skysat).
Zoom A2. Mining activity in the Cerro Yapacana sector without (left panel) and with (right panel) the mining data. Data: ACA/MAAP, Planet (Skysat).

Zoom B: Cerro Yapacana (south)

Zoom B centers on a major mining area in the Cerro Yapacana sector that experienced the deforestation of 175 hectares since the early 2000s, including a spike starting in 2014. It shows a very high-resolution Skysat image from early December 2021, with and without the mining data (left and right panel, respectively). Note how the second image brings out previously “invisible” elements within the overall mining area: 1,175 mining data points (667 camps and 508 equipment). Again, note how the second image brings out previously “invisible” elements within the overall mining area. Zooms B1 and B2 further illustrate this point.

Zoom B. Mining activity in the Cerro Yapacana southern sector without (left panel) and with (right panel) the mining data. Data: ACA/MAAP, Planet (Skysat).
Zoom B1. Mining activity in the Cerro Yapacana southern sector without (left panel) and with (right panel) the mining data. Data: ACA/MAAP, Planet (Skysat).
Zoom B2. Mining activity in the Cerro Yapacana southern sector without (left panel) and with (right panel) the mining data. Data: ACA/MAAP, Planet (Skysat).

Zoom C: Cerro Moyo

Lastly, Zoom C centers on a major mining area in the Cerro Moyo sector that experienced the deforestation of 240 hectares since the early 2000s, including a spike starting in 2011. It shows a very high-resolution Skysat image from March 2022, with and without the mining data (left and right panel, respectively). Again, note how the second image brings out previously “invisible” elements within the overall mining area: 579 data points (55 camps and 524 equipment). Zoom C1 further illustrates this point.

Zoom C. Mining activity in the Cerro Moyo sector without (left panel) and with (right panel) the mining data. Data: ACA/MAAP, Planet (Skysat).
Zoom C1. Mining activity in the Cerro Moyo sector without (left panel) and with (right panel) the mining data. Data: ACA/MAAP, Planet (Skysat).

Methodology

We tasked very high-resolution Skysat satellite imagery (0.5 meters), using the host company Planet’s tasking dashboard, of known mining locations in Yapacana National Park. We then closely and manually analyzed these images, documenting both mining camps and equipment. We researched aerial examples of mining areas in other countries to improve our identification abilities.

As a guide to locate key mining zones in these areas, we used mining area data produced by the organization SOS Orinoco, which used manual visual interpretation methods to identify these areas.

References

BirdLife International. Yapacana National Park (Parque Nacional Yapacana IBA). http://datazone.birdlife.org/site/factsheet/14941

Castillo R. y V. Salas. 2007. Estado de Conservación del Parque Nacional Yapacana. Reporte Especial. En: BioParques: Programa Observadores de Parques

SOS Orinoco. 2019. La Minería Aurífera en el Parque Nacional Yapacana Amazonas Venezolano: Un caso de extrema urgencia ambiental y geopolítica, nacional e internacional.

SOS Orinoco. 2020. La Minería Aurífera en el Parque Nacional Yapacana, Amazonas Venezolano | Un caso de extrema urgencia ambiental y geopolítica, nacional e internacional – Actualización al 2020.

Acknowledgements

We thank the organization SOSOrinoco for important information and comments related to this report.

Citation

Finer M, Mamani N (2022) Intense Mining Activity in Yapacana National Park (Venezuelan Amazon). MAAP: 156.

MAAP #153: Amazon Deforestation Hotspots 2021

Amazon Base Map. Deforestation hotspots across the Amazon in 2021 (as of September 18). Data: UMD/GLAD, ACA/MAAP.

We present a first look at the major 2021 Amazon deforestation hotspots.*

The Amazon Base Map illustrates several key findings:p

  • We estimate the loss of over 1.9 million hectares (4.8 million acres) of primary forest loss across the nine countries of the Amazon biome in 2021.
    k
  • This matches the previous two years, bringing the total deforestation to 6 million hectares (15 million acres) since 2019, roughly the size of the state of West Virginia.
    p
  • In 2021, most of the deforestation occurred in Brazil (70%), followed by Bolivia (14%), Peru (7%), and Colombia (6%).
    p
  • In Brazil, hotspots are concentrated along the major road networks. Many of these areas were also burned following the deforestation.
    j
  • In Bolivia, fires once again impacted several important ecosystems, including the Chiquitano dry forests.
    p
  • In Peru, deforestation continues to impact the central region, most notably from large-scale clearing for a new Mennonite colony.
    p
  • In Colombia, there continues to be an arc of deforestation impacting numerous protected areas and indigenous territories.

Below, we zoom in on the four countries with the highest deforestation (Brazil, Bolivia, Peru, and Colombia), with additional maps and analysis.

Brazil Base Map. Deforestation hotspots in Brazilian Amazon. Data: UMD/GLAD, ACA/MAAP.

Brazilian Amazon

The Brazil Base Map shows the notable concentration of deforestation hotspots along the major roads (especially roads 163, 230, 319, and 364) in the states of Acre, Amazonas, Pará, and Rondônia.


Bolivia Base Map. Deforestation hotspots in Bolivian Amazon. Data: UMD/GLAD, ACA/MAAP.

Bolivian Amazon

The Bolivia Base Map shows the concentration of hotspots due to major fires in the Chiquitano dry forest biome, largely located in the department of Santa Cruz in the southeast section of the Amazon.


Peru Base Map. Deforestation hotspots in the Peruvian Amazon. Data: UMD/GLAD, ACA/MAAP.

Peruvian Amazon

The Peru Base Map shows the concentration of deforestation in the central Amazon (Ucayali region).

We highlight the rapid deforestation (365 hectares) for a new Mennonite colony in 2021, near the town of Padre Marquez (see MAAP #149).

Also, note some additional hotspots in the south (Madre de Dios region), but these are largely from expanding agriculture instead of the historical driver of gold mining.

Indeed, gold mining deforestation has been greatly reduced due to government actions, but this illegal activity still threatens several key areas and indigenous territories (MAAP #130).


Colombia Base Map. Deforestation hotspots in northwest Colombian Amazon. Data: UMD/GLAD, ACA/MAAP.

Colombian Amazon

As described in previous reports (see MAAP #120), the Colombia Base Map shows there continues to be an “arc of deforestation” in the northwest Colombian Amazon (Caqueta, Meta, and Guaviare departments).

This arc impacts numerous Protected Areas (particularly Tinigua and Chiribiquete National Parks) and Indigenous Reserves (particularly Yari-Yaguara II and Nukak Maku).


*Notes and Methodology

The analysis was based on 10-meter resolution primary forest loss alerts (GLAD+) produced by the University of Maryland and also presented by Global Forest Watch. These alerts are derived from the Sentinel-2 satellite operated by the European Space Agency.

We emphasize that this data represents a preliminary estimate and more definitive annual data will come later in the year.

We also note that this data does include forest loss caused by natural forces and burned areas.

Our geographic range for the Amazon is a hybrid between both the biogeographic boundary (as defined by RAISG) and watershed boundary, designed for maximum inclusion.

To identify the deforestation hotspots, we conducted a kernel density estimate. This type of analysis calculates the magnitude per unit area of a particular phenomenon, in this case, forest cover loss. We conducted this analysis using the Kernel Density tool from the Spatial Analyst Tool Box of ArcGIS. We used the following parameters:

Search Radius: 15000 layer units (meters)
Kernel Density Function: Quartic kernel function
Cell Size in the map: 200 x 200 meters (4 hectares)
Everything else was left to the default setting.

For the Base Map, we used the following concentration percentages: Medium: 5-7%; High: 7-14%; Very High: >14%.

Acknowledgements

This work was supported by NORAD (Norwegian Agency for Development Cooperation) and ICFC (International Conservation Fund of Canada).

Citation

Finer M, Mamani N, Spore J (2022) Amazon Deforestation Hotspots 2021. MAAP: 153.

MAAP #147: Amazon Deforestation Hotspots 2021 (1st Look)

Base Map. Deforestation hotspots across the Amazon in 2021 (as of September 18). Data: UMD/GLAD, ACA/MAAP.

We present a first look at the major deforestation hotspots across all nine countries of the Amazon in 2021 (as of September 18).*

The Base Map illustrates several key findings thus far in 2021:p

  • We estimate the loss of over 860,000 hectares (2.1 million acres) of primary forest loss across the nine countries of the Amazon.
    p
  • Amazon deforestation has been concentrated in three countries: Brazil (79%), Peru (7%), Colombia (6%).
    p
  • The vast majority of deforestation (79%) occurred in the Brazilian Amazon, where massive hotspots stretched across the major road networks. Many of these areas were also burned following the deforestation.
    p
  • There continues to be an arc of deforestation in the northwestern Colombian Amazon, impacting numerous protected areas and indigenous territories.
    p
  • In the Peruvian Amazon, deforestation continues to impact the central region, most notably from a new Mennonite colony and large-scale rice plantation.
    p
  • In Bolivia, fires are once again impacting several important ecosystems, including the Beni grasslands and Chiquitano dry forests of the Amazon, and Chaco scrub forest outside the Amazon.

Below, we zoom in on the three countries with the highest deforestation (Brazil, Colombia, and Peru) and show a series of high-resolution satellite images that illustrate some of the major 2021 deforestation events.

Widespread Deforestation in the Brazilian Amazon

The Brazil Base Map shows the notable concentration of deforestation hotspots along the major roads (especially roads 163, 230, 319, and 364). Zooms A-C show high-resolution examples of this deforestation, which largely appears to be associated with clearing rainforests for pasture.

Brazil Base Map. Deforestation hotspots in Brazilian Amazon (as of September 18). Data: UMD/GLAD, ACA/MAAP.
Zoom A. Deforestation in the Brazilian Amazon near road 230 (TransAmazian Highway) between February (left panel) and September (right panel) of 2021. Data: Planet.
Zoom B. Deforestation in the Brazilian Amazon along road 319 in Amazonas state between May (left panel) and September (right panel) of 2021. Data: Planet, ESA.
Zoom C. Deforestation in the Brazilian Amazon along road 163 between November 2020 (left panel) and September 2021 (right panel). Data: Planet, ESA.
Colombia Base Map. Deforestation hotspots in northwest Colombian Amazon (as of September 18). Data: UMD/GLAD, ACA/MAAP.

Arc of Deforestation in the Colombian Amazon

As described in previous reports (see MAAP #120), the Colombia Base Map shows there continues to be an “arc of deforestation” in the northwest Colombian Amazon (Caqueta, Meta, and Guaviare departments).

This arc impacts numerous protected areas (particularly Tinigua and Chiribiquete National Parks) and Indigenous Reserves (particularly Yari-Yaguara II and Nukak Maku).

Zooms D & E show high-resolution examples of this deforestation, which largely appears to be associated with clearing rainforests for pasture.

Zoom D. Deforestation in the Colombian Amazon (Caqueta) between December 2020 (left panel) and September 2021 (right panel). Data: Planet.
Zoom E. Deforestation in the Colombian Amazon between January (left panel) and September (right panel) of 2021. Data: Planet, ESA.
Peru Base Map. Deforestation hotspots in the Peruvian Amazon (as of September 18). Data: UMD/GLAD, ACA/MAAP.

Deforestation in the central Peruvian Amazon

The Peru Base Map shows the concentration of deforestation in the central Peruvian Amazon (Ucayali, Huanuco, and southern Loreto regions).

Zooms F & G show two notable examples of this deforestation: the rapid deforestation in 2021 for a new Mennonite colony (299 hectares) and large-scale rice plantation (382 hectares), respectively.

Also note some additional hotspots in the south (Madre de Dios region) from gold mining and medium-scale agriculture.

The hotspot in the north (Loreto region) is natural forest loss from a windstorm.

Zoom F. Deforestation (299 hectares) in the Peruvian Amazon for a new Mennonite colony between January (left panel) and September (right panel) of 2021 in southern Loreto region. Data: Planet.
Zoom G. Deforestation (382 ha) in the Peruvian Amazon for a new large-scale rice plantation between January (left panel) and September (right panel) of 2021 in Ucayali region. Data: Planet.

*Notes and Methodology

The analysis was based on 10-meter resolution primary forest loss alerts (GLAD+) produced by the University of Maryland and also presented by Global Forest Watch. These alerts are derived from the Sentinel-2 satellite operated by the European Space Agency.

We emphasize that this data represents a preliminary estimate and more definitive annual data will come later next year.

We also note that this data does include forest loss caused by natural forces and burned areas.

Our geographic range for the Amazon is a hybrid between both the biogeographic boundary (as defined by RAISG) and watershed  boundary, designed for maximum inclusion.

To identify the deforestation hotspots, we conducted a kernel density estimate. This type of analysis calculates the magnitude per unit area of a particular phenomenon, in this case forest cover loss. We conducted this analysis using the Kernel Density tool from Spatial Analyst Tool Box of ArcGIS. We used the following parameters:

Search Radius: 15000 layer units (meters)
Kernel Density Function: Quartic kernel function
Cell Size in the map: 200 x 200 meters (4 hectares)
Everything else was left to the default setting.

For the Base Map, we used the following concentration percentages: Medium: 7-10%; High: 11-20%; Very High: >20%.

Acknowledgements

We thank E. Ortiz and A. Ariñez for their helpful comments on this report.

This work was supported by NORAD (Norwegian Agency for Development Cooperation) and ICFC (International Conservation Fund of Canada).

Citation

Finer M, Mamani N, Spore J (2020) Amazon Deforestation Hotspots 2021. MAAP: 147.

MAAP #144: The Amazon & Climate Change: Carbon Sink vs Carbon Source

Base Map. Forest Carbon Flux across the Amazon, 2001-2020. Data: Harris et al 2021. Analysis: Amazon Conservation/MAAP.

A pair of recent scientific studies revealed that parts of the Amazon now emit more carbon into the atmosphere than they absorb (Gatti et al 2021, Harris et al 2021).

Here, we dig deeper and highlight the key finding: the Brazilian Amazon has become a net carbon source over the past 20 years, whereas the total Amazon is still a net carbon sink.

We also show that protected areas and indigenous territories are crucial carbon sinks, showing once again their importance and effectiveness for overall conservation across the Amazon (MAAP #141).

One of the noted studies (Harris et al 2021) presented a new global monitoring system for forest carbon flux based on satellite data.

Here, we independently analyze this data with a focus on the Amazon.*

The flux is the crucial difference between forest carbon emissions (such as deforestation) and removals from the atmosphere (such as intact forests and regrowth).

A negative flux indicates that removals exceed emissions and the area is a carbon sink, thus buffering climate change. The Base Map illustrates these sinks in green.

A positive flux indicates that emissions exceed removals and the area has become a carbon source, thus exacerbating climate change. The Base Map illustrates these sources in red.

Below, we illustrate the carbon flux results and then zoom in on some of the key carbon sinks (such as protected areas and indigenous territories) and carbon sources (high deforestation areas) across the Amazon.

Amazon Carbon Flux

The two graphs below show levels of carbon removals in green and carbon emissions in red across the western Amazon (Bolivia, Colombia, Ecuador, and Peru), northeastern Amazon (French Guiana, Guyana, Suriname, and Venezuela), Brazilian Amazon, and total Amazon. The resulting carbon flux is highlighted in pink.

The arrows highlight three critical results:

  • The Brazilian Amazon has become a net carbon source (positive flux indicated by yellow arrow in Graph 1). That is, emissions now exceed removals (3,600 million tonnes of carbon dioxide equivalent over the past 20 years), exacerbating climate change.
    l
  • The total Amazon is still a net carbon sink (negative flux indicated by blue arrow in Graph 1). That is, removals still exceed emissions (-1,700 million tonnes of carbon dioxide equivalent over the past 20 years), helping mitigate climate change, mainly thanks to the role of the western and northeastern Amazon.
    j
  • Protected areas and indigenous territories are effective carbon sinks, while other areas outside these key designations are the major carbon source (positive flux indicated by orange arrow in Graph 2).
Graph 1. Carbon Flux in the Amazon, 2001-20. Data: Harris et al 2021. Analysis: Amazon Conservation/MAAP.
Graph 2. Carbon Flux in the Amazon, 2001-20. Data: Harris et al 2021. Analysis: Amazon Conservation/MAAP.

Key Amazon Carbon Sinks: Protected Areas & Indigenous Territories

Zooms 1 and 2 show two major carbon sinks in the western Amazon.

Zoom 1 focuses in on the northwestern Amazon, stretching across four countries (Brazil, Peru, Colombia, and Ecuador). This region includes large protected areas (such as Yasuni National Park in Ecuador, Chiribiquete National Park in Colombia, and Yaguas National Park in Peru) and indigenous territories (such as Vale do Javari in Brazil).

Zoom 2 focuses in on the southwestern Amazon, stretching across three countries (Brazil, Peru, and Bolivia). This region also includes large protected areas (such as Alto Purus, Manu, and Bahuaja Sonene National Parks in Peru and Madidi National Park in Bolivia).

Base Map: Amazon carbon sinks, indicated by insets 1 and 2. Data: Harris et al 2021.


Key Amazon Carbon Sources: High Deforestation Areas

Zooms A-H show eight major carbon sources in the western Amazon.

Zooms A and B show two of the major deforestation fronts in the Brazilian Amazon. Zoom A shows the massive deforestation around the city of Porto Velho, in the state of Rondônia and near the border with the state of Amazonas. Zoom B shows the massive deforestation along the BR-163 highway in the state of Pará.

Base Map: Amazon carbon sources, indicated by letters A-G. Data: Harris et al 2021.

Moving to the western Amazon, Zoom C shows the arc of deforestation in the northwestern Colombian Amazon and Zoom D shows the major deforestation front in the northern Ecuadorian Amazon.

Zooms E and F show two of the major deforestation fronts in the Peruvian Amazon. Zoom E shows large-scale deforestation from oil palm plantations and a new Mennonite colony in the north. Zoom F shows the major deforestation front in the south, along the Interoceanic Highway, surrounded by gold mining and small-scale agriculture.


Finally, Zoom G shows the deforestation along the road connecting Rurrenabaque and Ixiamas, including the new large-scale sugar cane plantation.


*Methodology & Notes

Base Map, Figure 1, and Zoom maps are based on 30-meter, satellite-based data obtained from Harris et al (2021). Our geographic range included nine countries and consists of a combination of the Amazon biogeographic limit (as defined by RAISG) plus the Amazon watershed limit in Bolivia. See Base Map above for delineation of this hybrid Amazon limit, designed for maximum inclusion.

References

Gatti, LV et al (2021) Amazonia as a carbon source linked to deforestation and climate change. Nature 595, 388–393.

Harris NL et al (2021) Global maps of twenty-first century forest carbon fluxes. Nature Climate Change 11, 234-240.

Acknowledgements

We thank M. Silman (Wake Forest University), D. Gibbs (WRI), M.E. Gutierrez (ACCA), D. Larrea (ACEAA), J. Beavers (ACA), and A. Folhadella (ACA) for their helpful comments on this report.

This work was supported by the Norwegian Agency for Development Cooperation (NORAD), and International Conservation Fund of Canada (ICFC).

Citation

Finer M, Mamani N (2021) The Amazon & Climate Change: Carbon Sink vs Carbon Source. MAAP: 144.

MAAP #141: Protected Areas & Indigenous Territories Effective Against Deforestation in the Western Amazon

Base Map. Primary forest loss across the western Amazon, with magnified visualization of the data. Click to enlarge. See Methodology for data sources.

As deforestation continues to threaten primary forest across the Amazon, key land use designations are one of the best hopes for the long-term conservation of critical remaining intact forests.

Here, we evaluate the impact of two of the most important land use designations: protected areas and indigenous territories.

Our study area focused on the four mega-diverse countries of the western Amazon (Bolivia, Colombia, Ecuador, & Peru), covering a vast area of over 229 million hectares (see Base Map).

We calculated primary forest loss over the past four years (2017-2020) across the western Amazon and analyzed the results across three major land use categories:

1) Protected Areas (national and state/department levels), which covered 43 million hectares as of 2020.

2) Indigenous Territories (official), which covered over 58 million hectares as of 2020.

3) Other (that is, all remaining areas outside protected areas and indigenous territories), which covered the remaining 127 million hectares as of 2020.

In addition, we took a deeper look at the Peruvian Amazon and also included long-term forestry lands.

In summary, we found that, averaged across all four years, protected areas had the lowest primary forest loss rate, closely followed by indigenous territories (see Figure 1). Outside of these critical areas, the primary forest loss rate was more than double.

Below, we describe the key results in greater detail, including a detailed look at each country.


Key Findings – Western Amazon

Figure 1. Primary forest loss rates in the western Amazon.

Overall, we documented the loss of over 2 million hectares of primary forests across the four countries of the western Amazon between 2017 and 2020. Of the four years, 2020 had the most forest loss (588,191 ha).

Of this total, 9% occurred in protected areas (179,000 ha) and 15% occurred in indigenous territories (320,000 ha), while the vast majority (76%) occurred outside key these land use designations (1.6 million ha).

To standardize these results for the varying area coverages, we calculated primary forest loss rates (loss/total area of each category). Figure 1 displays the combined results for these rates across all four countries.

From 2017-19, protected areas (green) had the lowest primary forest loss rates across the western Amazon (less than 0.10%).

Indigenous territories (brown) also had low primary forest loss rates from 2017-18 (less than 0.11%), but this rose in 2019 (0.18%) due to fires in Bolivia.

In the intense COVID pandemic year of 2020, this overall pattern flipped, with elevated primary forest loss in protected areas, again largely due to major fires in Bolivia. Thus, indigenous territories had the lowest primary forest loss rate followed by protected areas (0.15% and 0.19%, respectively) in 2020.

Averaged across all four years, protected areas had the lowest primary forest loss rate (0.11%), closely followed by indigenous territories (0.14%). Outside of these critical areas (red), the primary forest loss rate was more than double (0.30%). The lowest primary forest loss rates (less than 0.10%) occurred in the protected areas of Ecuador and Peru (0.01% and 0.03%, respectively), and indigenous territories of Colombia (0.07%).

Country Results

Figure 2. Primary forest loss rates in the Colombian Amazon.

Colombian Amazon

Colombia had, by far, the highest primary forest loss rates outside protected areas and indigenous territories (averaging 0.67% across all four years).

By contrast, Colombian indigenous territories had one of the lowest primary forest loss rates across the western Amazon (averaging 0.07% across all four years).

The primary forest loss rates for protected areas were on average nearly double that of indigenous territories (mostly due to the high deforestation in Tinigua National Park), but still much lower than non-protected areas.


Figure 3. Primary forest loss rates in the Ecuadorian Amazon.

Ecuadorian Amazon

Overall, Ecuador had the lowest primary forest loss rates across all three categories.

Protected areas had the lowest primary forest loss rate of any category across the western Amazon (averaging 0.01% across all four years).

Indigenous territories also had relatively low primary forest loss rates, averaging half that of outside protected areas and indigenous territories (0.10% vs 0.21%, respectively).


Figure 4. Primary forest loss rates in the Bolivian Amazon.

Bolivian Amazon

Bolivia had the most dynamic results, largely due to intense fire seasons in 2019 and 2020. Indigenous territories had the lowest primary forest loss rates, with 2019 being the only exception, due to large fires in the Santa Cruz department that affected the Monte Verde indigenous territory.

Protected areas had the lowest primary forest loss rate in 2019, but in extreme contrast, the highest the following year in 2020, also due to large fires in the Santa Cruz department that affected Noel Kempff Mercado National Park.

Overall, primary forest loss was highest outside protected areas and indigenous territories (averaging 0.33% across all four years).


Figure 5a. Primary forest loss rates in the Peruvian Amazon. Data: UMD.

Peruvian Amazon

Following Ecuador, Peru also had relatively low primary forest loss rates, particularly in protected areas (averaging 0.03% across all four years).

Primary forest loss in indigenous territories (that is, combined data for native communities and Territorial/Indigenous Reserves for groups in voluntary isolation) was surprisingly high, similar to that of areas outside protected areas across all four years. For example, in 2020, elevated primary forest loss was concentrated in several titled native communities in the regions of Amazonas, Ucayali, Huánuco, and Junín.


Figure 5b. Deforestation rates in the Peruvian Amazon. Data: MINAM/Geobosques.

As noted above, we conducted a deeper analysis for the Peruvian Amazon, using deforestation data produced by the Peruvian government and adding the additional category of long-term forestry lands (known as Permanent Production Forests, or BPP in Spanish) (see Annex map).

We also separated the data for indigenous territories into native communities and Territorial/Indigenous Reserves for groups in voluntary isolation, respectively.

These data also show that deforestation was lowest in the remote Territorial/Indigenous Reserves, closely followed by protected areas (0.01% vs 0.02% across all four years, respectively). Deforestation in titled native communities was 0.21% across all four years. Surprisingly, deforestation was higher in the forestry lands than areas outside protected areas and indigenous territories (0.30% vs 0.27% across all four years).


Annex – Peruvian Amazon

The following map shows added detail for Peru, most notably the inclusion of long-term forestry lands (known as Permanent Production Forests, or BPP in Spanish).


*Methodology

To estimate deforestation across all three categories, we used annual forest loss data (2017-20) from the University of Maryland (Global Land Analysis and Discovery GLAD laboratory) to have a consistent source across all four countries (Hansen et al 2013).

We obtained this data, which has a 30-meter spatial resolution, from the “Global Forest Change 2000–2020” data download page. It is also possible to visualize and interact with the data on the main Global Forest Change portal.

It is important to note that these data include both human-caused deforestation and forest loss caused by natural forces (landslides, wind storms, etc…).

We also filtered this data for only primary forest loss, following the established methodology of Global Forest Watch. Primary forest is generally defined as intact forest that has not been previously cleared (as opposed to previously cleared secondary forest, for example). We applied this filter by intersecting the forest cover loss data with the additional dataset “primary humid tropical forests” as of 2001 (Turubanova et al 2018). For more details on this part of the methodology, see the Technical Blog from Global Forest Watch (Goldman and Weisse 2019).

Thus, we often use the term “primary forest loss” to describe the data.

Data presented as primary forest loss or deforestation rate is standardized per the total area covered of each respective category. For example, to properly compare raw forest loss data in areas that are 100 hectares vs 1,000 hectares total size respectively, we divide by the area to standardize the result.

Our geographic range included four countries of the western Amazon and consists of a combination of the Amazon watershed limit (most notably in Bolivia) and Amazon biogeographic limit (most notably in Colombia) as defined by RAISG. See Base Map above for delineation of this hybrid Amazon limit, designed for maximum inclusion.

Additional data sources include: National and state/deprartment level protected areas: RUNAP 2020 (Colombia), SNAP 2017 & RAISG 2020 (Ecuador), SERNAP & ACEAA 2020 (Bolivia), and SERNANP 2020 (Peru).

Indigenous Territories: RAISG 2020 (Colombia, Ecuador, and Bolivia), and MINCU & ACCA 2020 (Peru). For Peru, this includes titled native communities and Indigenous/Territorial Reserves for indigenous groups in voluntary isolation.

For the additional analysis in Peru, we used deforestation data from MINAM/Geobosques (note this is actual deforestation and not primary forest loss) and BPP data from SERFOR. We also separated data from titled native communities and Territorial/Indigenous Reserves for groups in voluntary isolation.

Acknowledgements

We thank M. MacDowell (AAF) A. Folhadella (ACA), J. Beavers (ACA), S. Novoa (ACCA), and D. Larrea (ACEAA) for their helpful comments on this report.

This work was supported by the Andes Amazon Fund (AAF), Norwegian Agency for Development Cooperation (NORAD), and International Conservation Fund of Canada (ICFC).


Citation

Finer M, Mamani N, Silman M (2021) Protected Areas & Indigenous Territories Effective Against Deforestation in the Western Amazon. MAAP: 141.

MAAP #136: Amazon Deforestation 2020 (Final)

Base Map. Forest loss hotspots across the Amazon in 2020. Data: Hansen/UMD/Google/USGS/NASA, RAISG, MAAP. The letters A-E correspond to the zoom examples below.

*To download the report, click “Print” instead of “Download PDF” at the top of the page.

In January, we presented the first look at 2020 Amazon deforestation based on early warning alert data (MAAP #132).

Here, we update this analysis based on the newly released, and more definitive, annual data.*

The Base Map illustrates the final results and indicates the major hotspots of primary forest loss across the Amazon in 2020.

We highlight several key findings:

  • The Amazon lost nearly 2.3 million hectares (5.6 million acres) of primary forest loss in 2020 across the nine countries it spans.
    g
  • This represents a 17% increase in Amazon primary forest loss from the previous year (2019), and the third-highest annual total on record since 2000 (see graph below).
    j
  • The countries with the highest 2020 Amazon primary forest loss are 1) Brazil, 2) Bolivia, 3) Peru, 4) Colombia, 5) Venezuela, and 6) Ecuador.
    h
  • 65% occurred in Brazil (which surpassed 1.5 million hectares lost), followed by 10% in Bolivia, 8% in Peru, and 6% in Colombia (remaining countries all under 2%).
    k
  • For Bolivia, Ecuador, and Peru, 2020 recorded historical high Amazon primary forest loss. For Colombia, it was the second highest on record.

In all of the data graphs, orange indicates the 2020 primary forest loss and red indicates all years with higher totals than 2020.

For example, the Amazon lost nearly 2.3 million hectares in 2020 (orange), the third highest on record behind only 2016 and 2017 (red).

Note that the three highest years (2016, 2017, and 2020) had one major thing in common: uncontrolled forest fires in the Brazilian Amazon.

See below for country-specific graphs, key findings, and satellite images for the top four 2020 Amazon deforestation countries (Brazil, Bolivia, Peru, and Colombia).


Brazilian Amazon

2020 had the sixth-highest primary forest loss on record (1.5 million hectares) and a 13% increase from 2019.

Many of the 2020 hotspots occurred in the Brazilian Amazon, where massive deforestation stretched across nearly the entire southern region.

A common phenomenon observed in the satellite imagery through August was that rainforest areas were first deforested and then later burned, causing major fires due to the abundant recently-cut biomass (Image A). This was also the pattern observed in the high-profile 2019 Amazon fire season. Much of the deforestation in these areas appears to associated with expanding cattle pasture areas.

In September 2020 (and unlike 2019), there was a shift to actual Amazon forest fires (Image B). See MAAP #129 for more information on the link between deforestation and fire in 2020.

Note that the three highest years (2016, 2017, and 2020) had one major thing in common: uncontrolled forest fires in the Brazilian Amazon.

Image A. Deforestation in Brazilian Amazon (Amazonas state) of 2,540 hectares between January (left panel) and November (right panel) 2020. Data: Planet.
Image B. Forest fire in Brazilian Amazon (Para state) that burned 9,000 hectares between March (left panel) and October (right panel) 2020. Data: Planet.

Bolivian Amazon

2020 had the highest primary forest loss on record in the Bolivian Amazon, surpassing 240,000 hectares.

Indeed, the most intense hotspots across the entire Amazon ocurred in southeast Bolivia, where fires raged through the drier Amazon forests (known as the Chiquitano and Chaco ecosystems).

Image C shows the burning of a massive area (over 260,000 hectares) in the Chiquitano dry forests (Santa Cruz department).


Image C. Forest fire in Bolivian Amazon (Santa Cruz) that burned over 260,000 hectares between April (left panel) and November (right panel) 2020. Data: ESA.

Peruvian Amazon

2020 also had the highest primary forest loss on record in the Peruvian Amazon, surpassing 190,000 hectares.

This deforestation is concentrated in the central region. On the positive, the illegal gold mining that plagued the southern region has decreased thanks to effective government action (see MAAP #130).

Image D shows expanding deforestation (over 110 hectares), and logging road construction (3.6 km), in an indigenous territory south of Sierra del Divisor National Park in the central Peruvian Amazon (Ucayali region). The deforestation appears to be associated with an expanding small-scale agriculture or cattle pasture frontier.


Image D. Deforestation and logging road construction in Peruvian Amazon (Ucayali region) between March (left panel) and November (right panel) 2020. Data: Planet.

Colombian Amazon

2020 had the second-highest primary forest loss on record in the Colombian Amazon, nearly 140,000 hectares.

As described in previous reports (see MAAP #120), there is an “arc of deforestation” concentrated in the northwest Colombian Amazon. This arc impacts numerous protected areas (including national parks) and Indigenous Reserves.

For example, Image E shows the recent deforestation of over 500 hectares in Chiribiquete National Park. Similar deforestation in that sector of the park appears to be conversion to cattle pasture.


Image E. Deforestation in Colombian Amazon of over 500 hectares in Chiribiqete National Park between January (left panel) and December (right panel) 2020. Data: ESA, Planet.

*Notes and Methodology

To download the report, click “Print” instead of “Download PDF” at the top of the page.

The analysis was based on 30-meter resolution annual data produced by the University of Maryland (Hansen et al 2013), obtained from the “Global Forest Change 2000–2020” data download page. It is also possible to visualize and interact with the data on the main Global Forest Change portal.

Importantly, this data detects and classifies burned areas as forest loss. Nearly all Amazon fires are human-caused. Also, this data does include some forest loss caused by natural forces (landslides, wind storms, etc…).

Note that when comparing 2020 to early years, there are several methodological differences from the University of Maryland introduced to data after 2011. For more details, see “User Notes for Version 1.8 Update.”

It is worth noting that we found the early warning (GLAD) alerts to be a good (and often conservative) indicator of the final annual data.

Our geographic range includes nine countries and consists of a combintion of the Amazon watershed limit (most notably in Bolivia) and Amazon biogeographic limit (most notably in Colombia) as defined by RAISG. See Base Map above for delineation of this hybrid Amazon limit, designed for maximum inclusion. Inclusion of the watershed limit in Bolivia is a recent change incorporated to better include impact to the Amazon dry forests of the Chaco.

We applied a filter to calculate only primary forest loss. For our estimate of primary forest loss, we intersected the forest cover loss data with the additional dataset “primary humid tropical forests” as of 2001 (Turubanova et al 2018). For more details on this part of the methodology, see the Technical Blog from Global Forest Watch (Goldman and Weisse 2019).

To identify the deforestation hotspots, we conducted a kernel density estimate. This type of analysis calculates the magnitude per unit area of a particular phenomenon, in this case forest cover loss. We conducted this analysis using the Kernel Density tool from Spatial Analyst Tool Box of ArcGIS. We used the following parameters:

Search Radius: 15000 layer units (meters)
Kernel Density Function: Quartic kernel function
Cell Size in the map: 200 x 200 meters (4 hectares)
Everything else was left to the default setting.

For the Base Map, we used the following concentration percentages: Medium: 7-10%; High: 11-20%; Very High: >20%.


Hansen, M. C., P. V. Potapov, R. Moore, M. Hancher, S. A. Turubanova, A. Tyukavina, D. Thau, S. V. Stehman, S. J. Goetz, T. R. Loveland, A. Kommareddy, A. Egorov, L. Chini, C. O. Justice, and J. R. G. Townshend. 2013. “High-Resolution Global Maps of 21st-Century Forest Cover Change.” Science 342 (15 November): 850–53.

Acknowledgements

We thank E. Ortiz (AAF), M. Silman (WFU), M. Weisse (WRI/GFW) for their helpful comments on this report.

This work was supported by NORAD (Norwegian Agency for Development Cooperation) and ICFC (International Conservation Fund of Canada).

Citation

Finer M, Mamani N (2020) Amazon Deforestation Hotspots 2020 (Final). MAAP: 136.

MAAP: Fires in the Bolivian Amazon 2020

Base Map. Major fires in the Bolivian Amazon during 2020. Data: MAAP/ACEAA.

We have detected 120 major fires this year in the Bolivian Amazon, as of the first of October (see Base Map).*

The majority of these fires (54%) occurred in savannas, located in the department of Beni.

Another 38% of the major fires were located in forests, mostly in the dry forests of the Chiquitano.

We emphasize that 25% of the major fires were located in Protected Areas (see below)..

*The data, updated through October 1, is based on our novel real-time Amazon Fires Monitoring app, which is based on the detection of elevated aerosol emissions (by the European Space Agency’s Sentinel-5 satellite) that indicate the burning of large amounts of biomass (defined here as a “major fire”).


Major Fires in Protected Areas of the Bolivian Amazon in 2020. Data: MAAP/ACEAA.

Major Fires in Protected Areas

The most impacted Protected Areas are Noel Kempff Mercado National Park (21,000 acres burned), and Copaibo Municipal Protected Area (99,000 acres burned).

Other impacted Protected Areas impacted include Iténez National Park, Keneth Lee Reserve and Pampas del Río Yacuma Integrated Management Natural Area.


Satellite Images of the Major Fires in the Bolivian Amazon

We present a series of high-resolution satellite images of the major fires in the Bolivian Amazon.

Image 1 shows a major fire in the extreme northwest of Noel Kempff Mercado National Park in September. Note that the fires are burning in the transition between Amazon forest and savanna.

Image 1. Major Fire #61 (Sept 8, 2020). Data: Planet.

Image 2 shows a major fire in Copaibo Municipal Protected Area in September. Note that it is located in the transition zone of the moist Amazon forest and Chiquitano dry forest.

Image 2. Major Fire #65 (September 7, 2020). Data: Planet.

Image 3 shows another major fire in Copaibo Municipal Protected Area, also in the transition zone of the Amazon forest and the Chiquitano dry forest.

Image 3. Major Fire #51 (September 4, 2020). Data: Planet.

Image 4 shows a major fire in the savannas of Beni.

Image 4. Major Fire #68 (September 12, 2020). Data: Planet.

Citation

Finer M, Ariñez A (2020) Fires in the Bolivian Amazon 2020. MAAP.

MAAP #123: Detecting Illegal Logging in the Peruvian Amazon

Image 1. Example of a 2019 logging road with signs of illegality. Data: Planet.

In the Peruvian Amazon, the widespread illegal logging is difficult to detect with satellites because it is selective for high-value species (not clearcutting).

It is possible, however, to detect the associated logging roads.

In this report, we present a novel technique to identify illegal logging: analyze new logging roads in relation to detailed land use data available from government agencies.

Thus, our new method detects the crime in real-time and preventive action is still possible. This is important because when an intervention against illegal logging normally occurs, stopping a boat or truck with illegal timber, the damage is done.

This analysis has two parts. First, we identified the new logging roads built in the Peruvian Amazon during 2019, updating our previous work for 2015-18 (see Base Map).

Second, we analyzed the new logging road data in relation to governmental land use information in order to identify possible illegality.

This data is from 2019, but we are now applying this technique in real time during 2020.

Base Map. 2019 Logging roads, in relation to 2015-18 logging roads. Data: MAAP.

Logging Roads 2019

The Base Map illustrates the location of logging roads built in the Peruvian Amazon during the last 5 years.

Previously (MAAP #99), we documented the construction of 3,300 kilometers of logging roads between 2015 and 2018.

Here, we estimate the construction of an additional 1,500 kilometers in 2019 (see red).

Note that forest roads are mainly concentrated in the Ucayali, Madre de Dios and Loreto regions.

Below, we show three types of possible illegality that detected in 2019:

  • Logging roads in areas without forestry concessions or permits (Cases 1-2).
    .
  • Logging roads in existing forest concessions, but whose current status is defined as “Non-Active or Undefined” (Cases 3-5).
    .
  • Logging roads in Native Communities (Case 6).

Cases of Possible Illegality

Logging roads in areas without forestry concessions or permits

Case 1. We detected the opening of a new logging road network (55 km) in an area without forestry concessions or permits, between the limits of the Loreto and San Martín regions. The image shows the digitized logging roads (red, left panel), and non-digitized satellite image (right panel). The arrows provide reference points between panels.

Case 1. Data: MAAP, Planet. Click to enlarge.

Case 2. We detected the construction of a new logging road network (5.8 km) in the buffer zone of Asháninka Communal Reserve, reaching only 300 meters from the protected area. The image shows the digitized logging roads (red, left panel), and non-digitized satellite image (right panel). The arrows provide reference points between panels.

Case 2. Data: MAAP, Planet, IBC, SERNANP. Click to enlarge.

Logging roads in existing forest concessions, but whose current state is labelled as “Non-Active or Undefined” 

Case 3. We detected the construction of a new logging road (45.3 km) that crosses a native community and reaches a forest concession whose status is defined as “Undefined,” in the Loreto region just north of Pacaya Samiria National Reserve. The image shows the digitized logging roads (red, left panel), and non-digitized satellite image (right panel). The arrows provide reference points between panels.

Case 3. Data: MAAP, ESA, IBC, SERFOR. Click to enlarge.

Case 4. We detected the construction of a new logging road network (53.2 km), of which nearly half (21.4 km) crosses a forest concession whose status is defined is “Non Active”, near the town of Sepahua in the Ucayali region. The image shows the digitized logging roads (red, left panel), and non-digitized satellite image (right panel). The arrows provide reference points between panels.

Case 4. Data: MAAP, Planet, IBC, SERFOR. Click to enlarge.

Case 5. We detected the construction of a new logging road (17.7 km) in a forestry concession whose current status is defined as “Non Active,” in the Madre de Dios region. The image shows the digitized logging roads (red, left panel), and non-digitized satellite image (right panel). The arrows provide reference points between panels.

Case 5. Data: MAAP, ESA, IBC, SERFOR. Click to enlarge.

Logging roads in Native Communities

Case 6. We detected the construction of a logging road (23.4 km) within an indigenous community in the Ucayali region. We did not find evidence of a permit for this activity. The image shows the digitized logging roads (red, left panel), and non-digitized satellite image (right panel). The arrows provide reference points between panels.

Case 6. Data: MAAP, Planet, SERNANP, IBC, SERFOR. Click to enlarge.

Methodology

Our analysis included two main steps:

The first step consisted of evaluating linear patterns in the 2019 early warning and final forest loss data, available from Global Forest Watch (data from the University of Maryland) and Geobosques (data from the Peruvian Ministry of the Environment). From the linear patterns, we distinguished between logging access roads and other types of roads and highways. Logging roads tend to have linear patterns that branch into the interior of the forest where the commercial timber is found. Other types of roads have a more defined destination, such as towns or farms. Once logging roads were identified, we downloaded the associated high-resolution imagery (3 meters) from Planet Explorer and digitized the roads in ArcGIS. During this process, additional logging roads detected in the high resolution images were also digitized.

The second step focused on the legality analysis. The new logging road data were overlaid with other types of land use information, such as forestry concessions on the GeoSERFOR portal (SERFOR), permits and concessions on the SISFOR portal (OSINFOR), indigenous communities (IBC 2019), protected areas (SERNANP), population centers (INEI 2019), and official road networks (MTC 2018). For example, as shown above, this process identified logging roads near protected areas, within indigenous communities, and within non-active forest concessions.

We analyzed information on several websites now available from national and regional authorities, such as SISFOR (OSINFOR), GEOSERFOR (SERFOR), and IDERs (Spatial Data Infrastructure of Regional governments). These new resources provide valuable information, however may have limitations in ability to constantly update information on the status of concessions and forest permits, especially from regional governments.

Annex – Logging road data per region

REGION, Logging Roads (Km)

LORETO, 231.2
MADRE DE DIOS, 477.8
UCAYALI, 720.0
HUANUCO, 45.5
JUNÍN, 19.8
PASCO, 15.1
SAN MARTIN, 2.4

TOTAL, 1511.7

References

Planet Team (2017). Planet Application Program Interface: In Space for Life on Earth. San Francisco, CA. https://api.planet.com

Acknowledgments

We thank R. Valle (OSINFOR), A. Felix (DAI), D. Suarez (ACCA), and G. Palacios for their helpful comments on this report.

This report was conducted with technical assistance from USAID, via the Prevent project. Prevent is an initiative that, over the next 5 years, will work with the Government of Peru, civil society, and the private sector to prevent and combat environmental crimes in Loreto, Ucayali and Madre de Dios, in order to conserve the Peruvian Amazon.

This publication is made possible with the support of the American people through USAID. Its content is the sole responsibility of the authors and does not necessarily reflect the views of USAID or the US government.

Citation

Finer M, Paz L, Novoa S, Villa L (2020) Detecting Illegal Logging in the Peruvian Amazon. MAAP: 123.

Amazon Fire Tracker 2020: Images of the Brazilian Amazon Fires

Our innovative new app for Real-time Amazon Fire Monitoring has now detected over 350 major fires in the Brazilian Amazon this season.*

Specifically, we have detected 365 major fires as of August 17, since the first major fire detected on May 28.

The fire season is accelerating, as 79% of the major fires have occured in August.

Below, we present a series of satellite images showing key examples from August 2020.

We highlight our key finding that the vast majority of major fires (88%burned recently deforested areas covering 557,000 acres (226,000 hectares). Thus, the fires are actually a striking indicator of the rampant deforestation currently threatening the the Brazilian Amazon.

We have detected 4 Forest fires (1% of the major fires) covering 2,790 acres (1,130 hectares) and 3 savanna fires covering 38,000 acres (15,000 hectares). The rest of the major fires are burning older agricultural areas.

Other key findings include:

  • The vast majority of the fires (96%) are illegal, occuring past the 120 day moratorium established in July.
  • At least 18 of the major fires have been in protected areas or indigenous territories.
  • Most of the fires (70%) have occurred in two departments: Amazonas and Para. Mato Grosso and Rondonia each account for 15%.

We have detected an additional 10 major fires in the Bolivian Amazon, and that will be the feature of a future report.

Images of the 2020 Brazilian Amazon Fires

1) Fires burning recently deforested areas

Brazilian Amazon Fire #338 (August 16, 2020)

Brazilian Amazon Fire #335 (August 16, 2020)

Brazilian Amazon Fire #233 (August 11, 2020)


Brazilian Amazon Fire #230 (August 11, 2020)

Brazilian Amazon Fire #221 (August 11, 2020)

Brazilian Amazon Fire #202 (August 10, 2020)

Brazilian Amazon Fire #188 (August 9, 2020)

Brazilian Amazon Fire #124 (August 6, 2020)

Brazilian Amazon Fire #110 (August 4, 2020)

Brazilian Amazon Fire #109 (August 4, 2020)

Brazilian Amazon Fire #76 (August 1, 2020)

2) Forest Fires 

Brazilian Amazon Fire #218, August 2020

Brazilian Amazon Fire #195, August 2020

3) Grassland (Savanna) Fires 

Brazilian Amazon Fire #219, August 2020

*Notes and Methodology

The app specializes in filtering out thousands of the traditional heat-based fire alerts to prioritize only those burning large amounts of biomass (defined here as a major fire).

In a novel approach, the app combines data from the atmosphere (aerosol emissions in smoke) and the ground (heat anomaly alerts) to effectively detect and visualize major Amazon fires.

When fires burn, they emit gases and aerosols. A new satellite (Sentinel-5P from the European Space Agency) detects these aerosol emissions. Thus, the major feature of the app is detecting elevated aerosol emissions which in turn indicate the burning of large amounts of biomass. For example, the app distinguishes small fires clearing old fields (and burning little biomass) from larger fires burning recently deforested areas or standing forest (and burning lots of biomass).

We define “major fire” as one showing elevated aerosol emission levels on the app, thus indicating the burning of elevated levels of biomass. This typically translates to an aerosol index of >1 (or cyan-green to red on the app). To identify the exact source of the elevated emissions, we reduce the intensity of aerosol data in order to see the underlying terrestrial heat-based fire alerts. Typically for major fires, there is a large cluster of alerts. The major fires are then confirmed, and burn areas estimated, using high-resolution satellite imagery from Planet Explorer.

See MAAP #118 for additional details.

No fires permitted in the Brazilian state of Mato Grosso after July 1, 2020. No fires permitted in all of Brazilian Amazon after July 15, 2020. Thus, we defined “illegal” as any major fires detected after these respective dates.

There was no available Sentinel-5 aerosol data on July 4, 15, and 26.

Acknowledgements

This analysis was done by Amazon Conservation in collaboration with SERVIR Amazonia.

Citation

Finer M, Nicolau A, Vale H, Villa L, Mamani N (2020) Amazon Fire Tracker 2020: Images of the Brazilian Amazon Fires. MAAP.