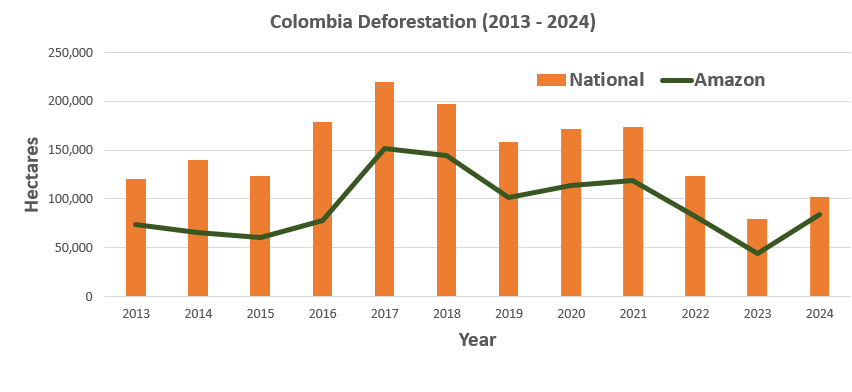
The Colombian Environment Ministry recently announced that, after the country experienced its lowest deforestation in over 20 years in 2023, forest clearing rose 35% in 2024 (Graph 1). In addition, the Ministry reported an increase in medium-sized clearing, indicating relatively organized and funded operations (Note 1).
Over the past 10 years, 60% of the national deforestation has occurred in the Colombian Amazon. As Graph 1 indicates, there was a large increase in 2017 following the peace accords with the guerrilla group FARC, and a subsequent decrease in 2022 and 2023 (Note 2). Initial estimates indicate an increase for 2024 (Note 3). Overall, there have been nearly 1,200,000 hectares of deforestation across the Colombian Amazon over the past 10 years.
Much of the clearing in the Colombian Amazon is likely illegal (Law of 2021), occurring in national protected areas and Indigenous reserves.
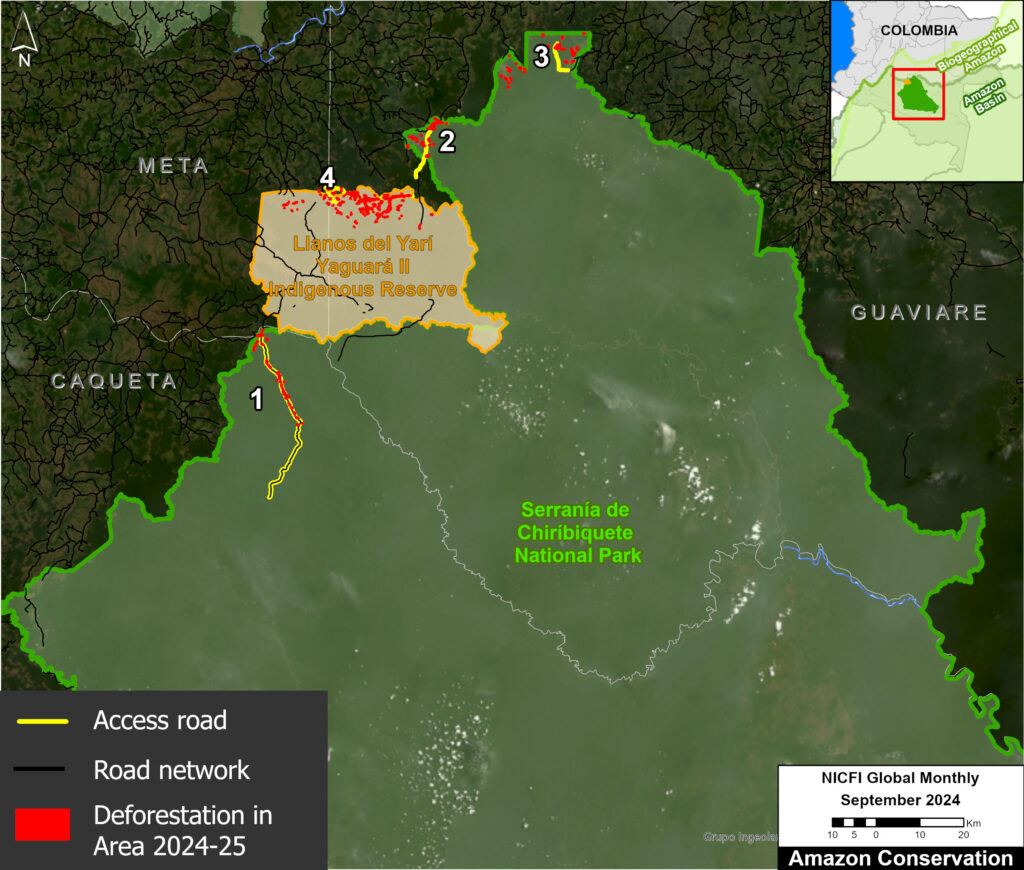
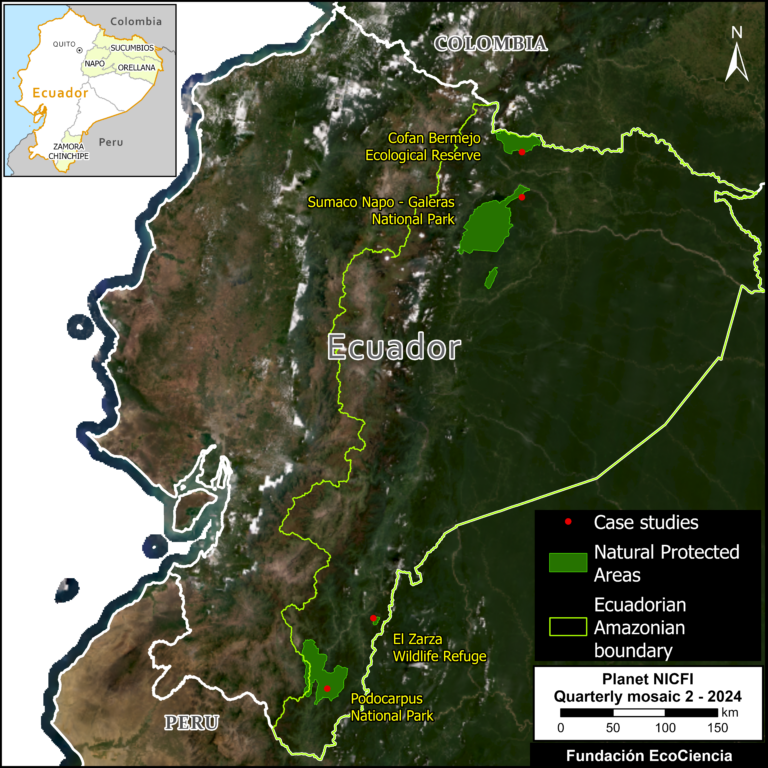
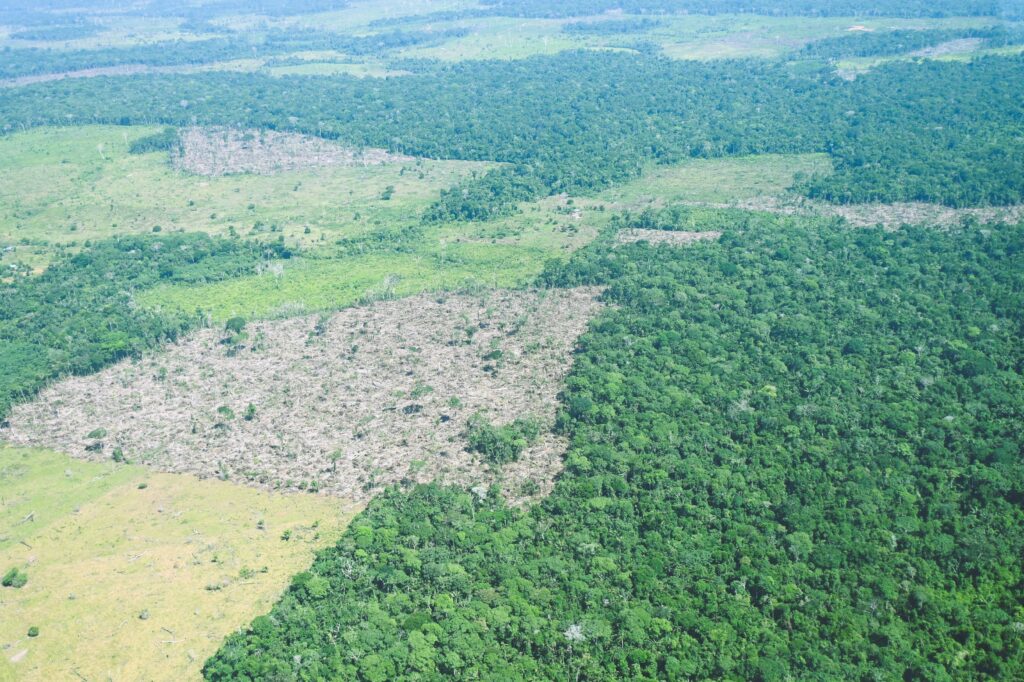
Here, we highlight recent 2024-25 deforestation in two key areas in the core of the Colombian Amazon: Chiribiquete National Park (Parque Nacional Natural Serranía de Chiribiquete) and the adjacent Llanos del Yarí – Yaguará II Indigenous Reserve (Resguardo Indígena Llanos del Yarí – Yaguará II). See the Base Map for additional context.
These areas are affected by several deforestation pressures, such as the expansion of road infrastructure, extensive livestock farming, pasture expansion, land grabbing, and illicit crops (coca). These pressures often interact, with access roads facilitating livestock farming and pasture expansion, which then facilitates land grabbing.
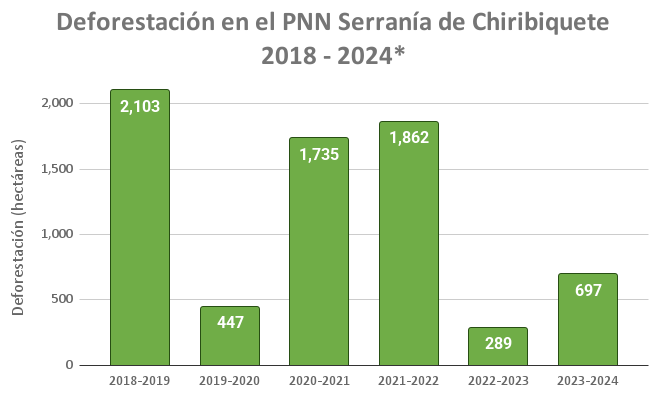
These drivers have led to the deforestation of over 7,100 hectares in Chiribiquete National Park since its most recent expansion in 2018 (see Annex 1).
Most recently, we estimate the deforestation of 525 hectares in Chiribiquete National Park (concentrated in the northern sector) during 2024-25, plus an additional 856 hectares in Llanos del Yarí – Yaguará II Indigenous Reserve. Note that most of the deforestation follows access roads.
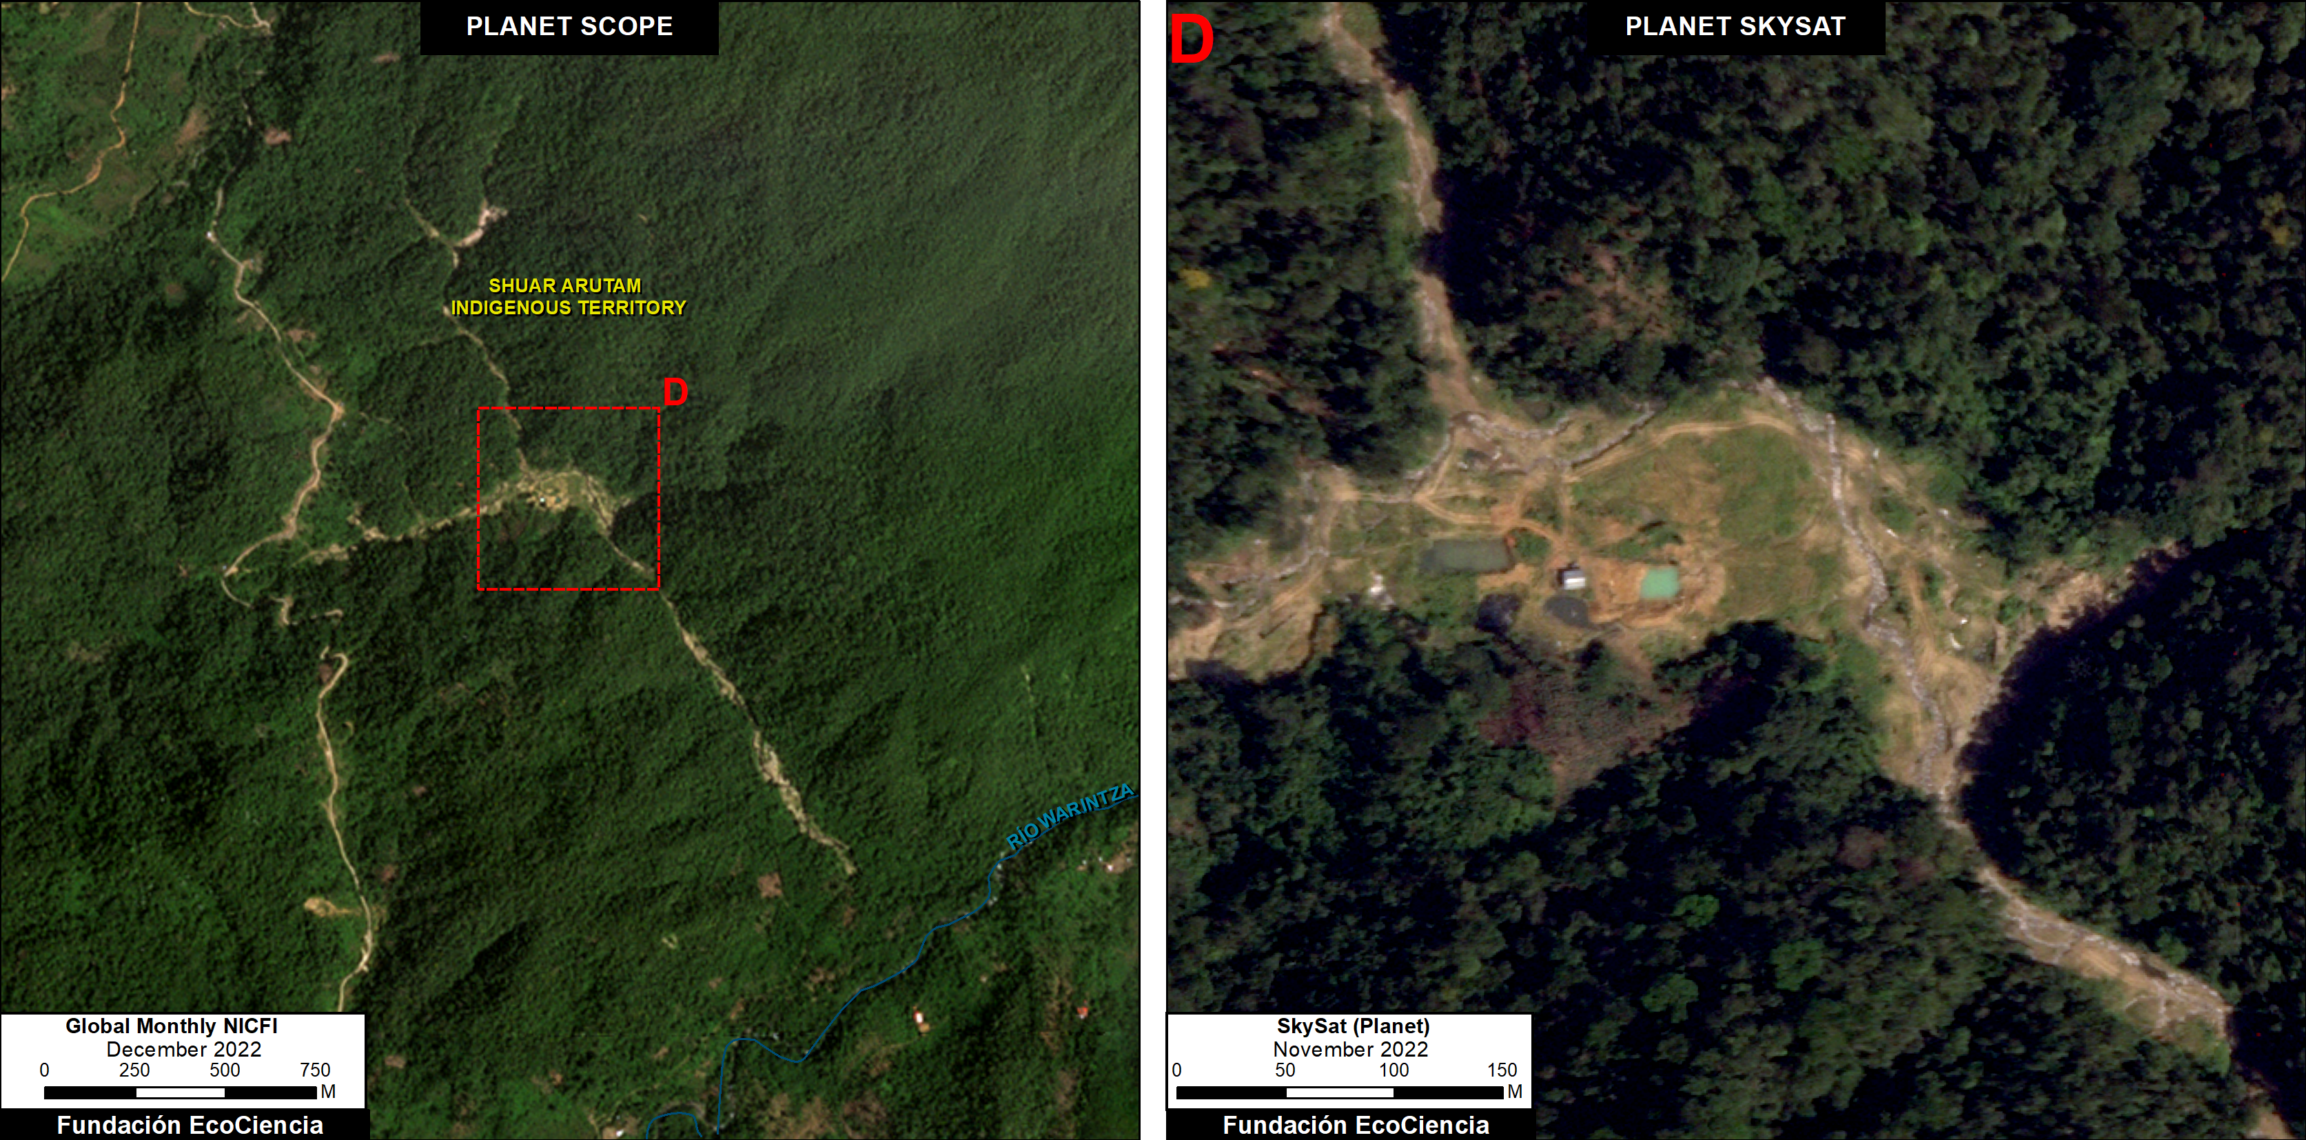
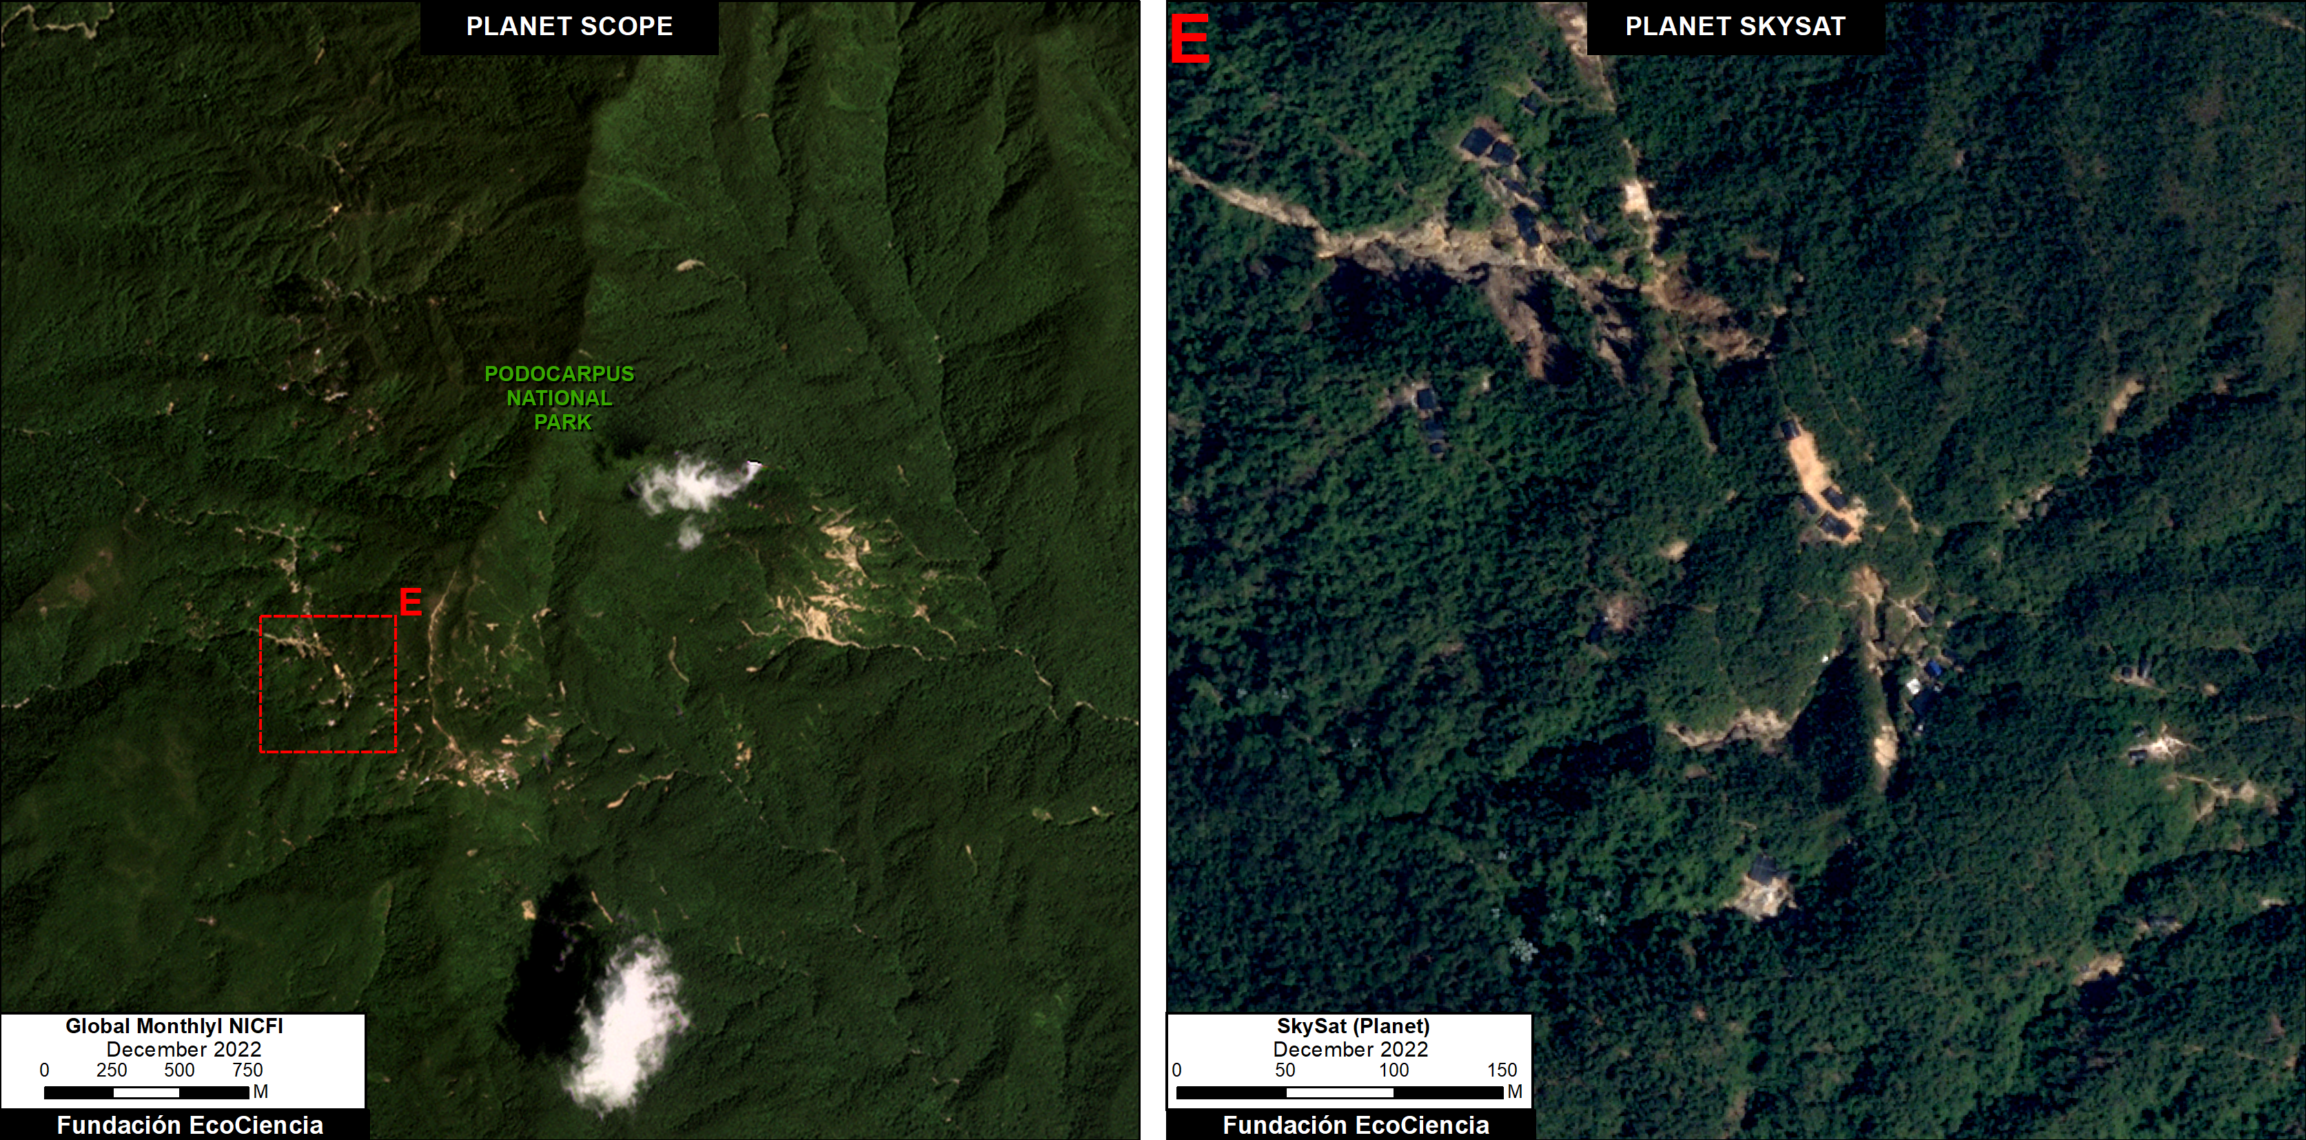
Below, we illustrate the key cases of recent deforestation in both areas, highlighting the role of access roads as facilitators of illegal clearing. These case studies feature satellite images and overflight photos.
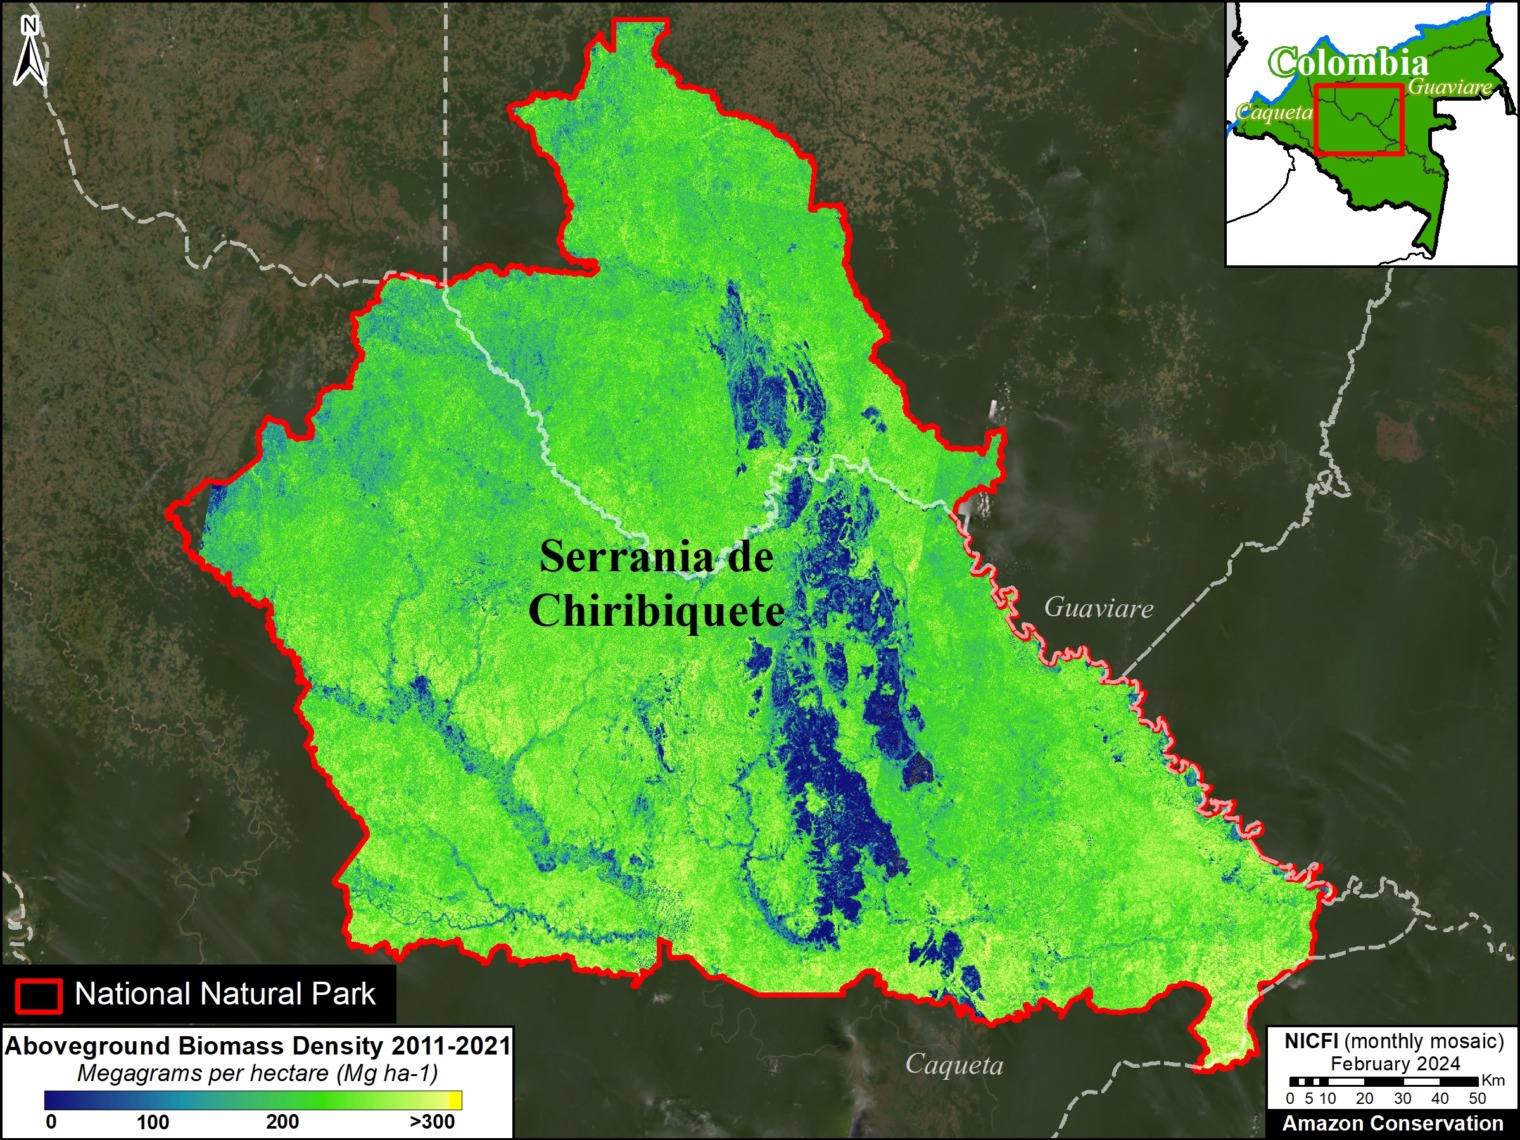
Any deforestation in these areas is noteworthy not only due to its impacts on primary forests, biodiversity, and Indigenous groups, but also on carbon reserves. In an upcoming report, we reveal that Chiribiquete National Park is one of the Amazon’s most important and significant carbon sinks.
This report was conducted in collaboration with our Colombian partner Foundation for Conservation and Sustainable Development (Fundación para la Conservación y el Desarrollo Sostenible – FCDS), and with financial support from the Overbrook Foundation.
Illegal Deforestation Cases
Chiribiquete National Park: Sector el Camuya
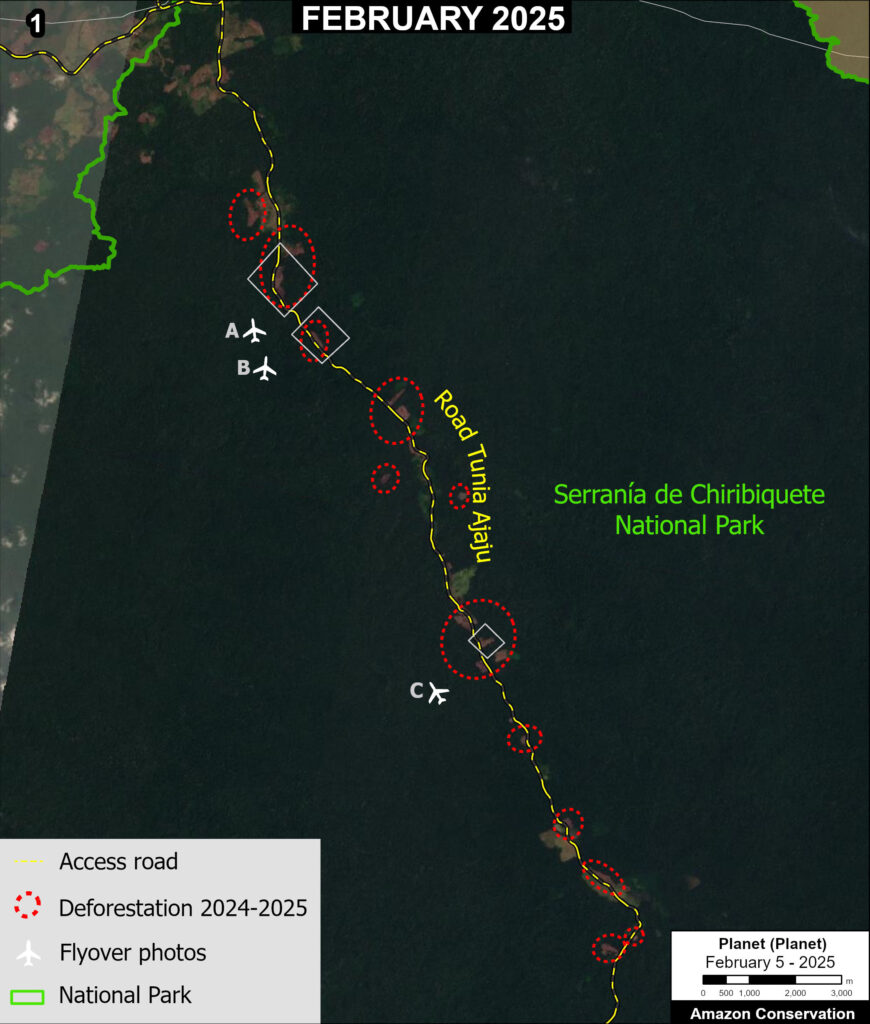
Zoom 1 shows the deforestation of 198 hectares during 2024 and early 2025 (indicated by red circles), along the Tunia-Ajaju road in the northwest sector of Chiribiquete National Park.
This road extends 45.3 kilometers into the park.
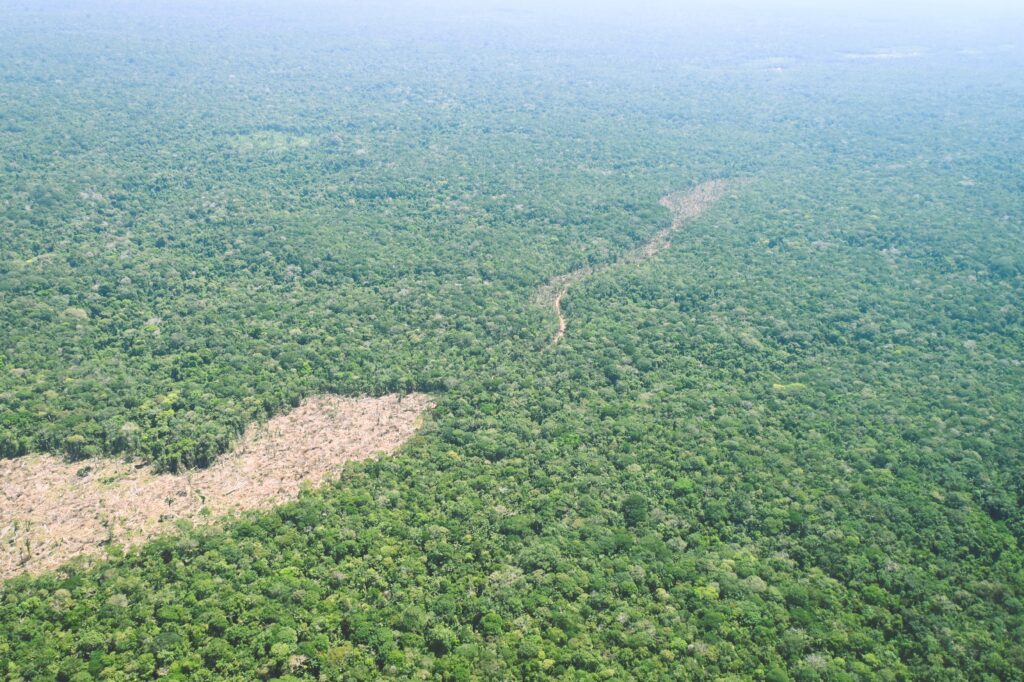
In January 2025, FCDS conducted a low-altitude overflight over this sector (see Photos 1A-C).
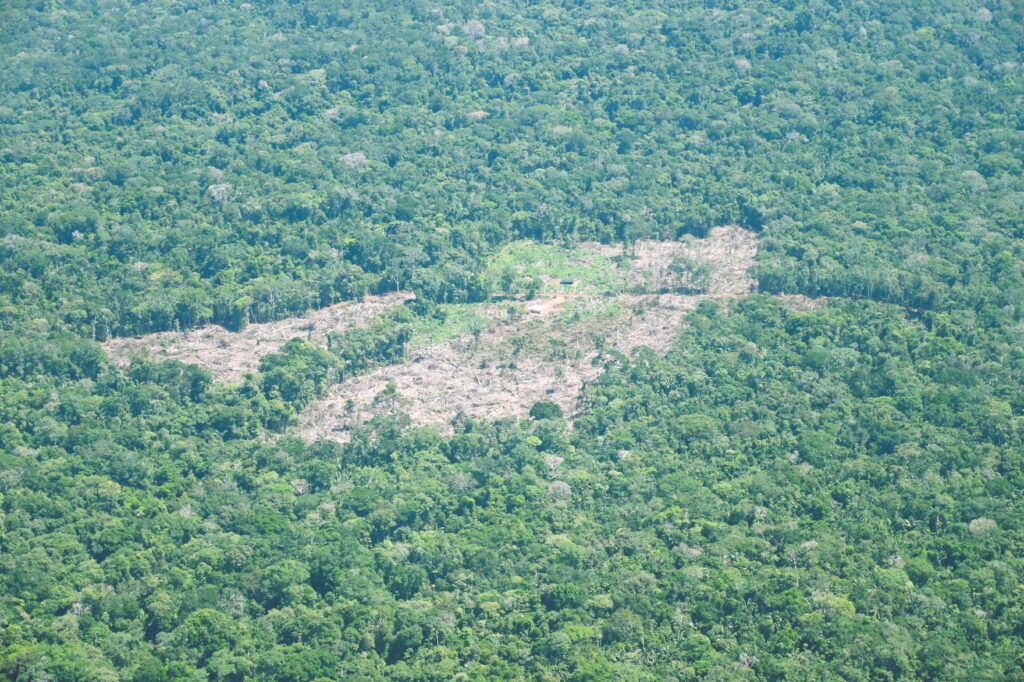
These photos bring an added level of spatial resolution and perspective, providing greater insight into the cause of the recent deforestation.
Photo 1A highlights deforestation associated with the opening of access roads in the park.
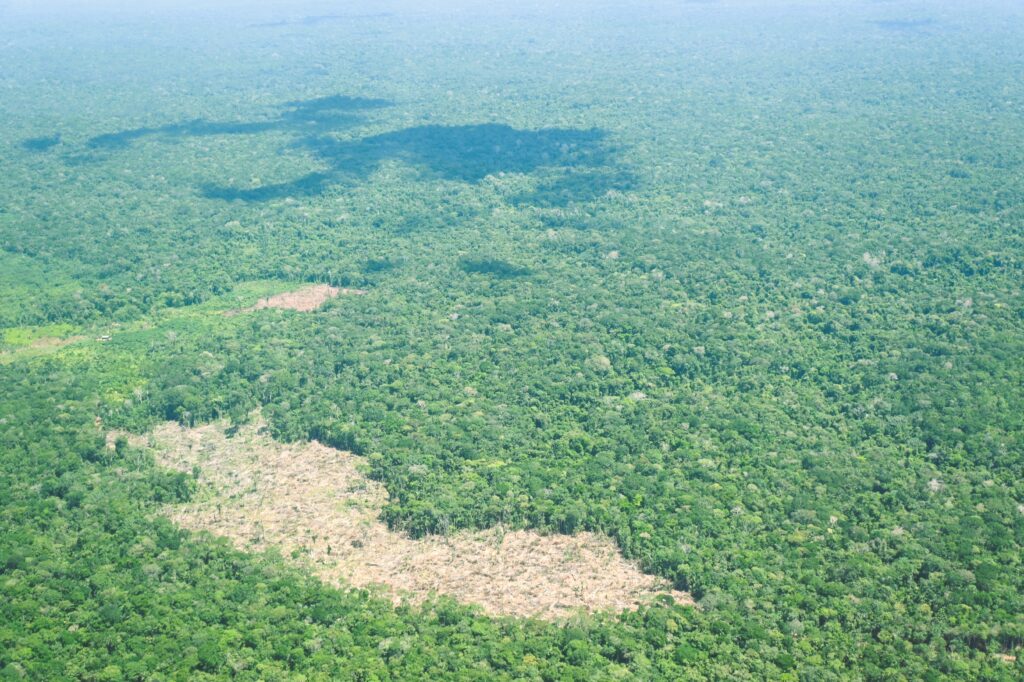
Photos 1B-C illustrate more clearly the fresh deforestation for expansion of the agricultural frontier.
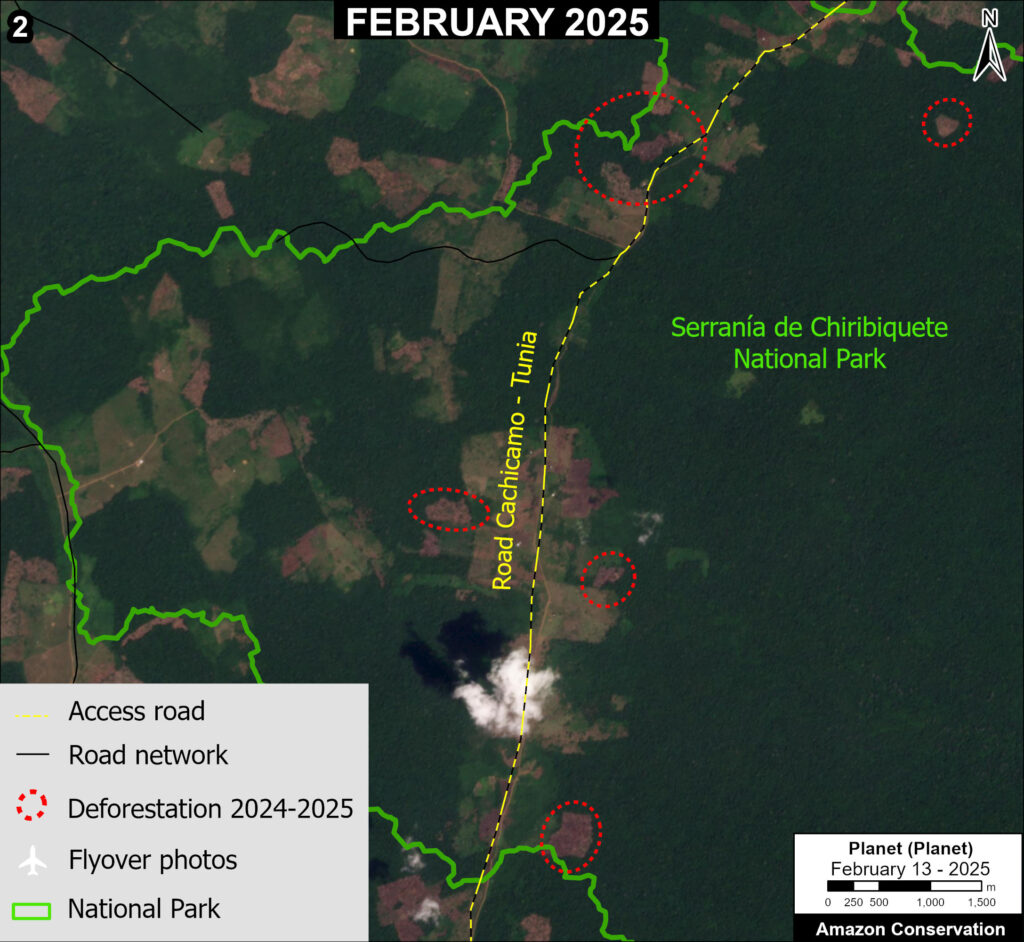
Chiribiquete National Park: Sector El Palmar
Zoom 2 shows the deforestation of 179 hectares during 2024 and early 2025 (indicated by red circles), along the Cachicamo-Tunia road in the northern sector of Chiribiquete National Park.
This road extends 21 kilometers inside the park.
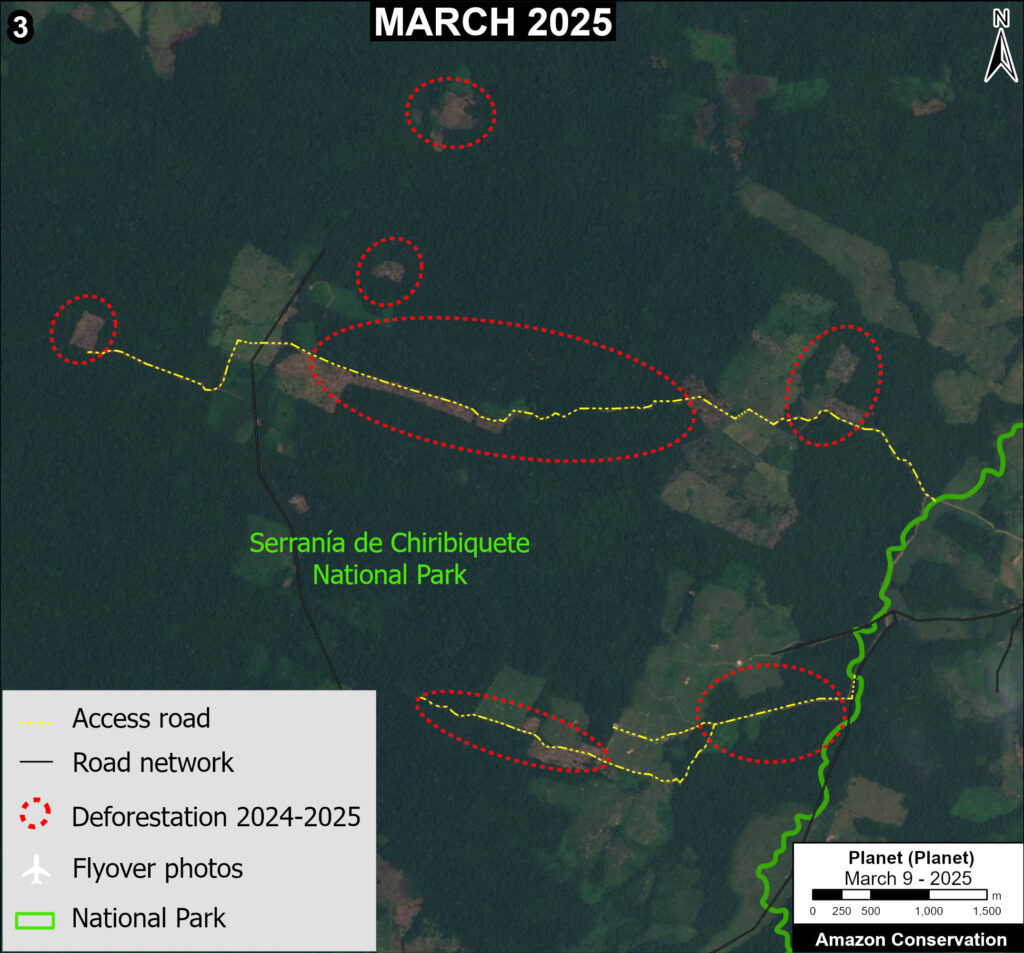
Chiribiquete National Park: Sector Norte
Zoom 3 shows the deforestation of 148 hectares during 2024 and early 2025 (indicated by red circles) along or near new access roads in the northeast sector of Chiribiquete National Park.
We estimate the construction of 15.2 kilometers inside the park during this period (also indicated by red circles).
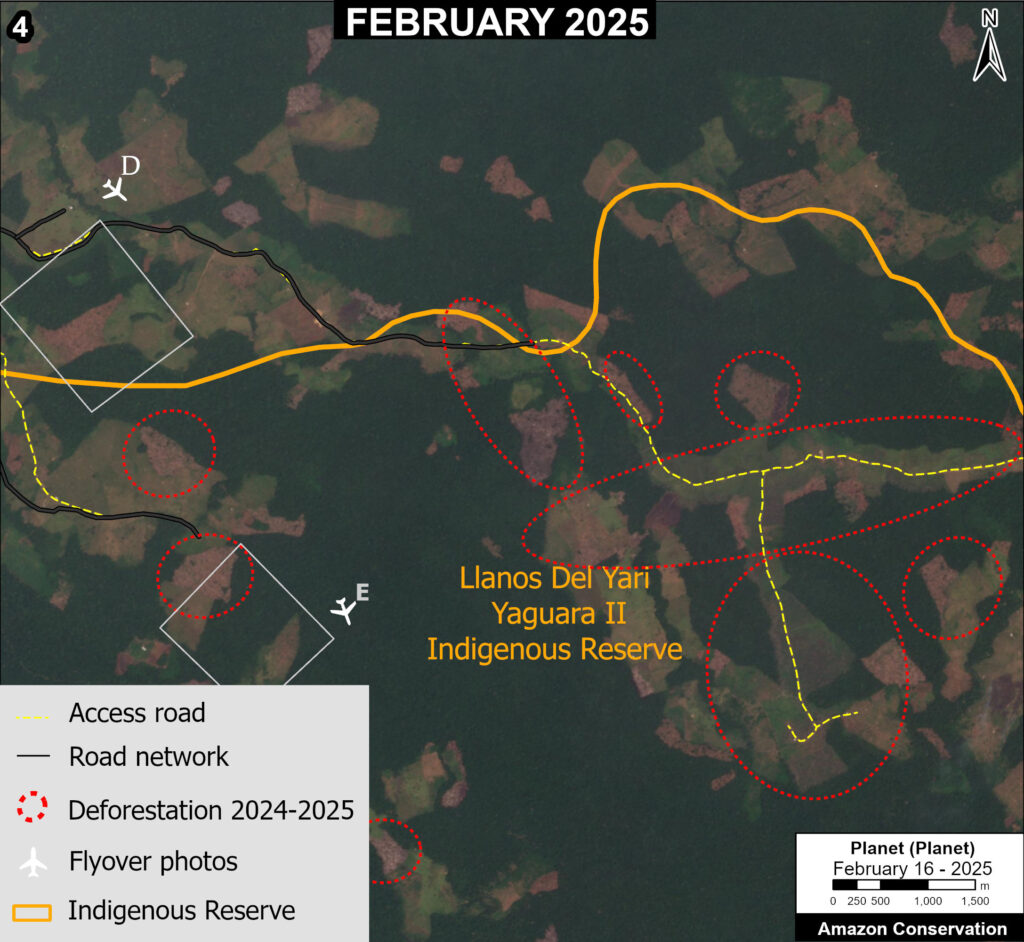
Yarí – Yaguará II Indigenous Reserve
Zoom 4 shows the major deforestation of 1,070 hectares during 2024 and early 2025 along or near a new illegal road in the northern part of Yarí – Yaguará II Indigenous Reserve.
This road extends 22 kilometers inside the reserve.
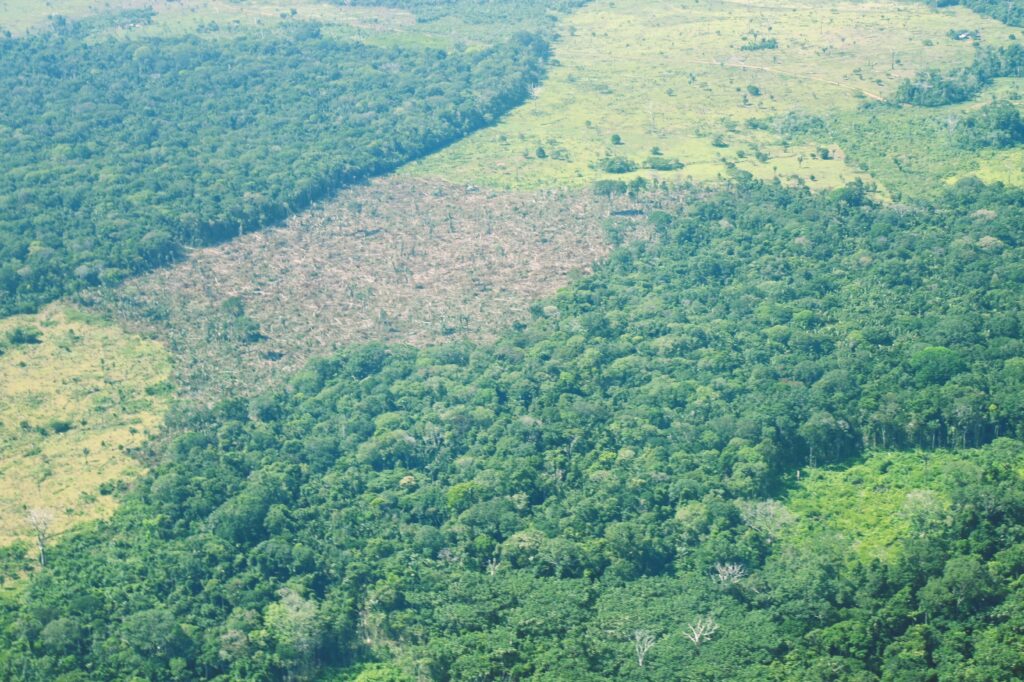
In January 2025, FCDS conducted a low-altitude overflight over this area, confirming and documenting the new patches of deforestation (see Photos 4D-E).
As noted above, these photos bring an added level of spatial resolution and perspective, providing greater insight into the cause of the recent deforestation.
Both Photos 4D-E indicate the expansion of livestock agricultural activities.
Policy Implications
The recent deforestation in protected areas and Indigenous territories described above highlights the shortcomings of several current policies of the State of Colombia, which have failed to stem the expansion of cattle ranching and illicit crops as a first step towards land grabbing and permanent deforestation. Several steps could be taken to overcome that failure:
- Improved coordination between public entities concerned with law enforcement against drivers of deforestation, shortening investigation processes and leading to more effective and comprehensive responses.
- The inclusion of targets for the reduction of deforestation and the mitigation of impacts on natural forests in agreements for the cessation of hostilities and the de-escalation of the conflict between the national government and armed groups.
- Monitoring and regulation of public investments for the expansion of livestock farming by local and national governments, to reduce public incentives for deforestation.
Annex 1.
Notes
1 Griffin, O (2025) Colombia deforestation rose 35% in 2024, minister says
2 Based on data from Colombia’s Institute of Hydrology, Meteorology and Environmental Studies (Instituto de Hidrología, Meteorología y Estudios Ambientales – IDEAM), a government agency of the Ministry of Environment and Sustainable Development.
3 Based on data from the University of Maryland/Global Forest Watch.
Acknowledgments
This report was conducted in collaboration with our Colombian partner Foundation for Conservation and Sustainable Development (Fundación para la Conservación y el Desarrollo Sostenible – FCDS), and with financial support from the Overbrook Foundation.