Amazon Fire Tracker 2020: Images of the Brazilian Amazon Fires

Our innovative new app for Real-time Amazon Fire Monitoring has now detected over 350 major fires in the Brazilian Amazon this season.*

Specifically, we have detected 365 major fires as of August 17, since the first major fire detected on May 28.

The fire season is accelerating, as 79% of the major fires have occured in August.

Below, we present a series of satellite images showing key examples from August 2020.

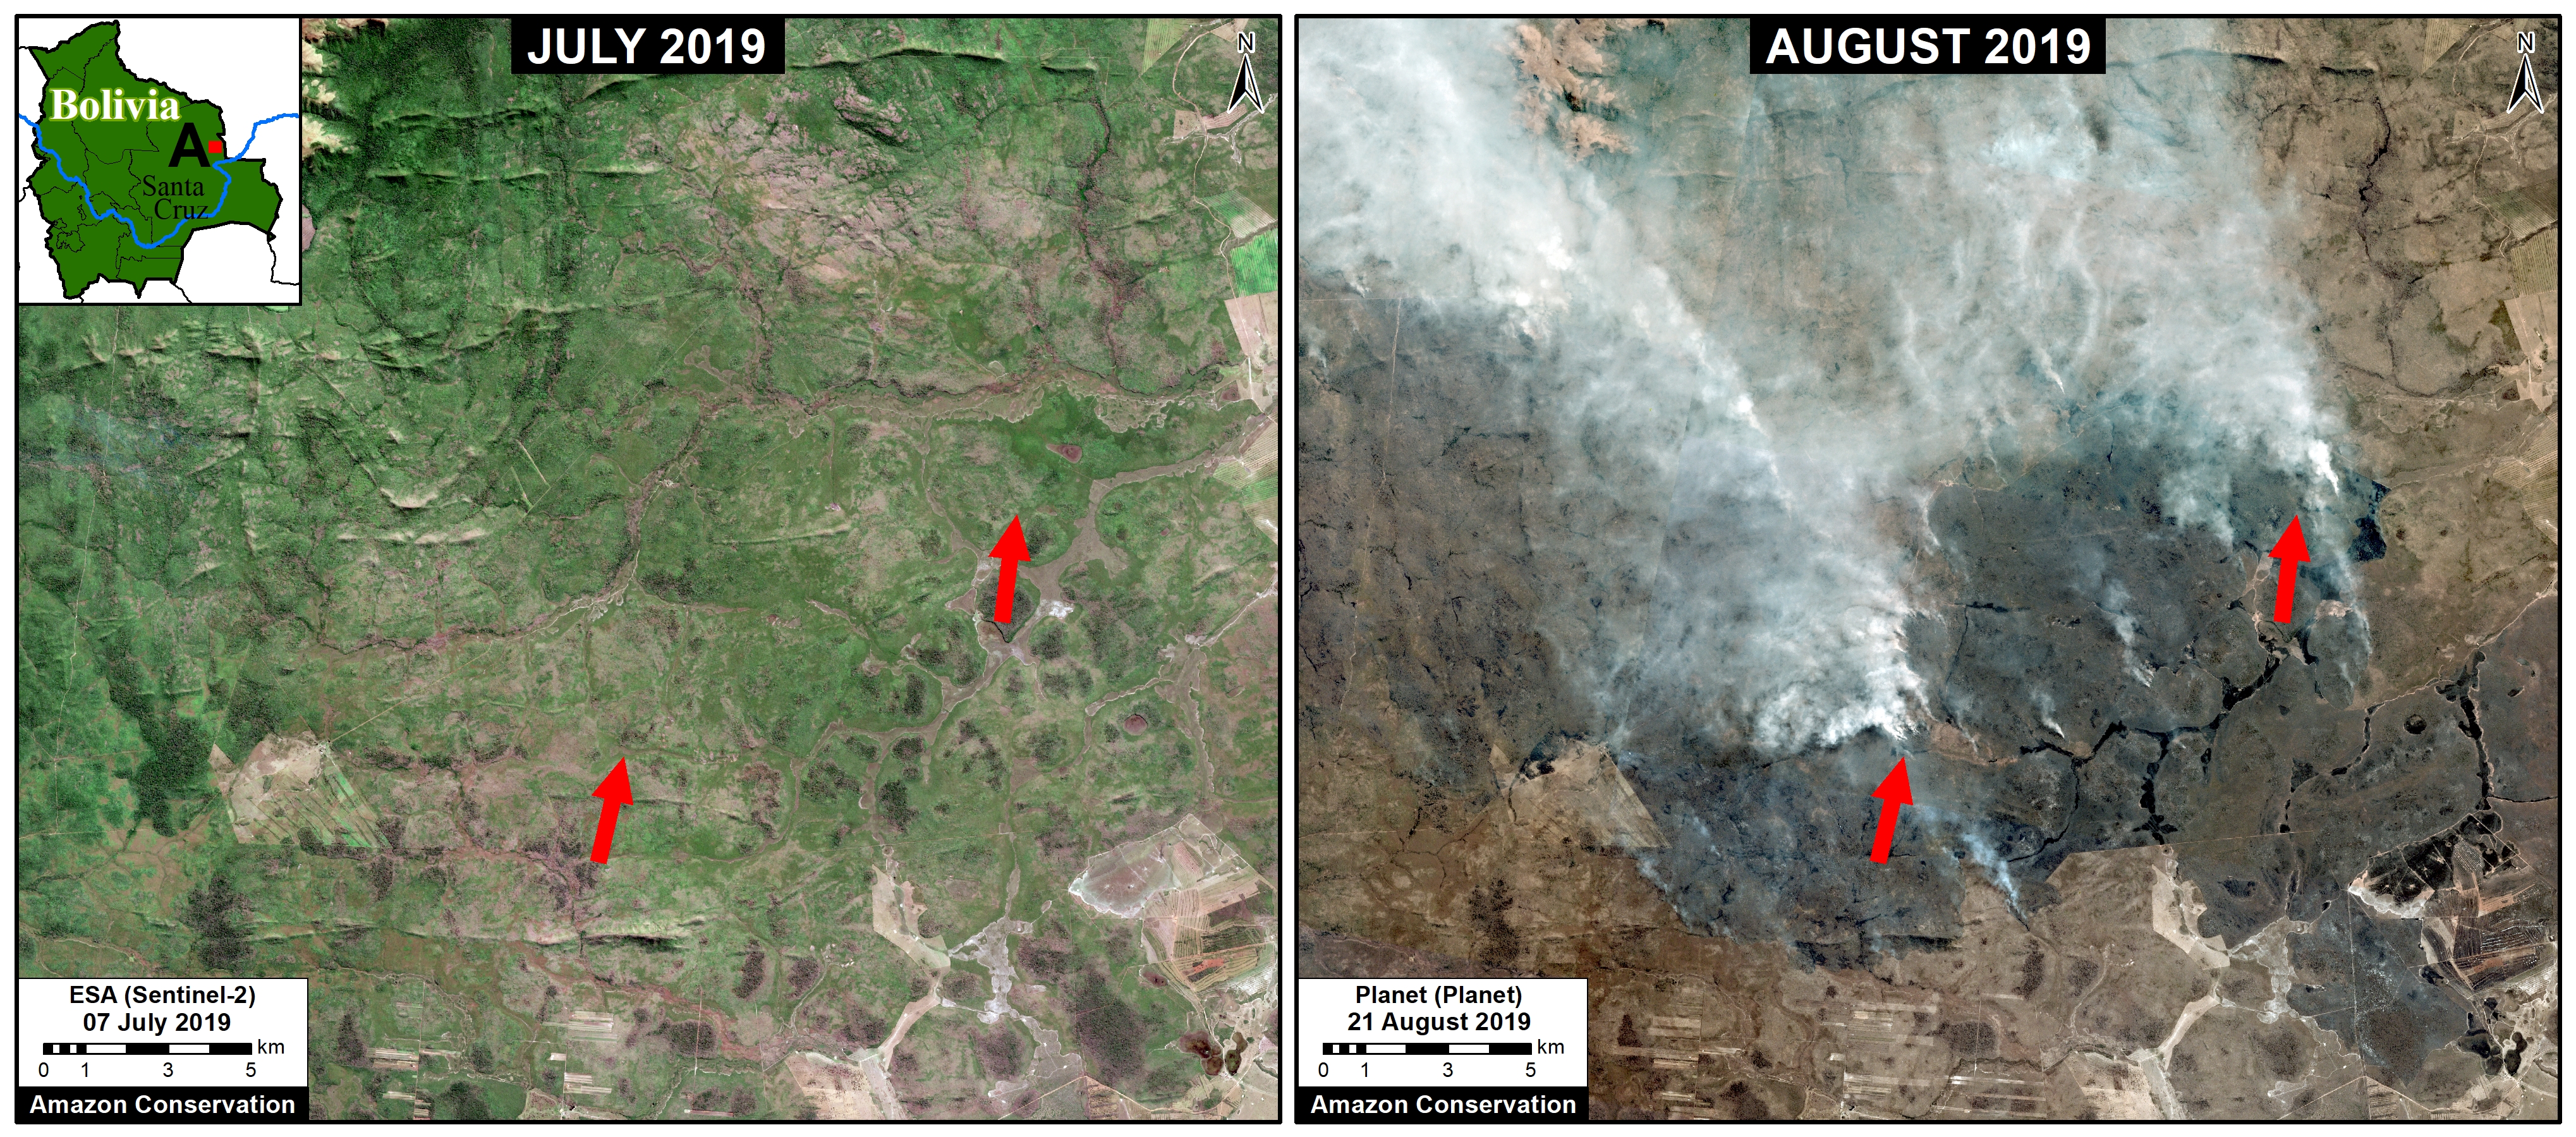
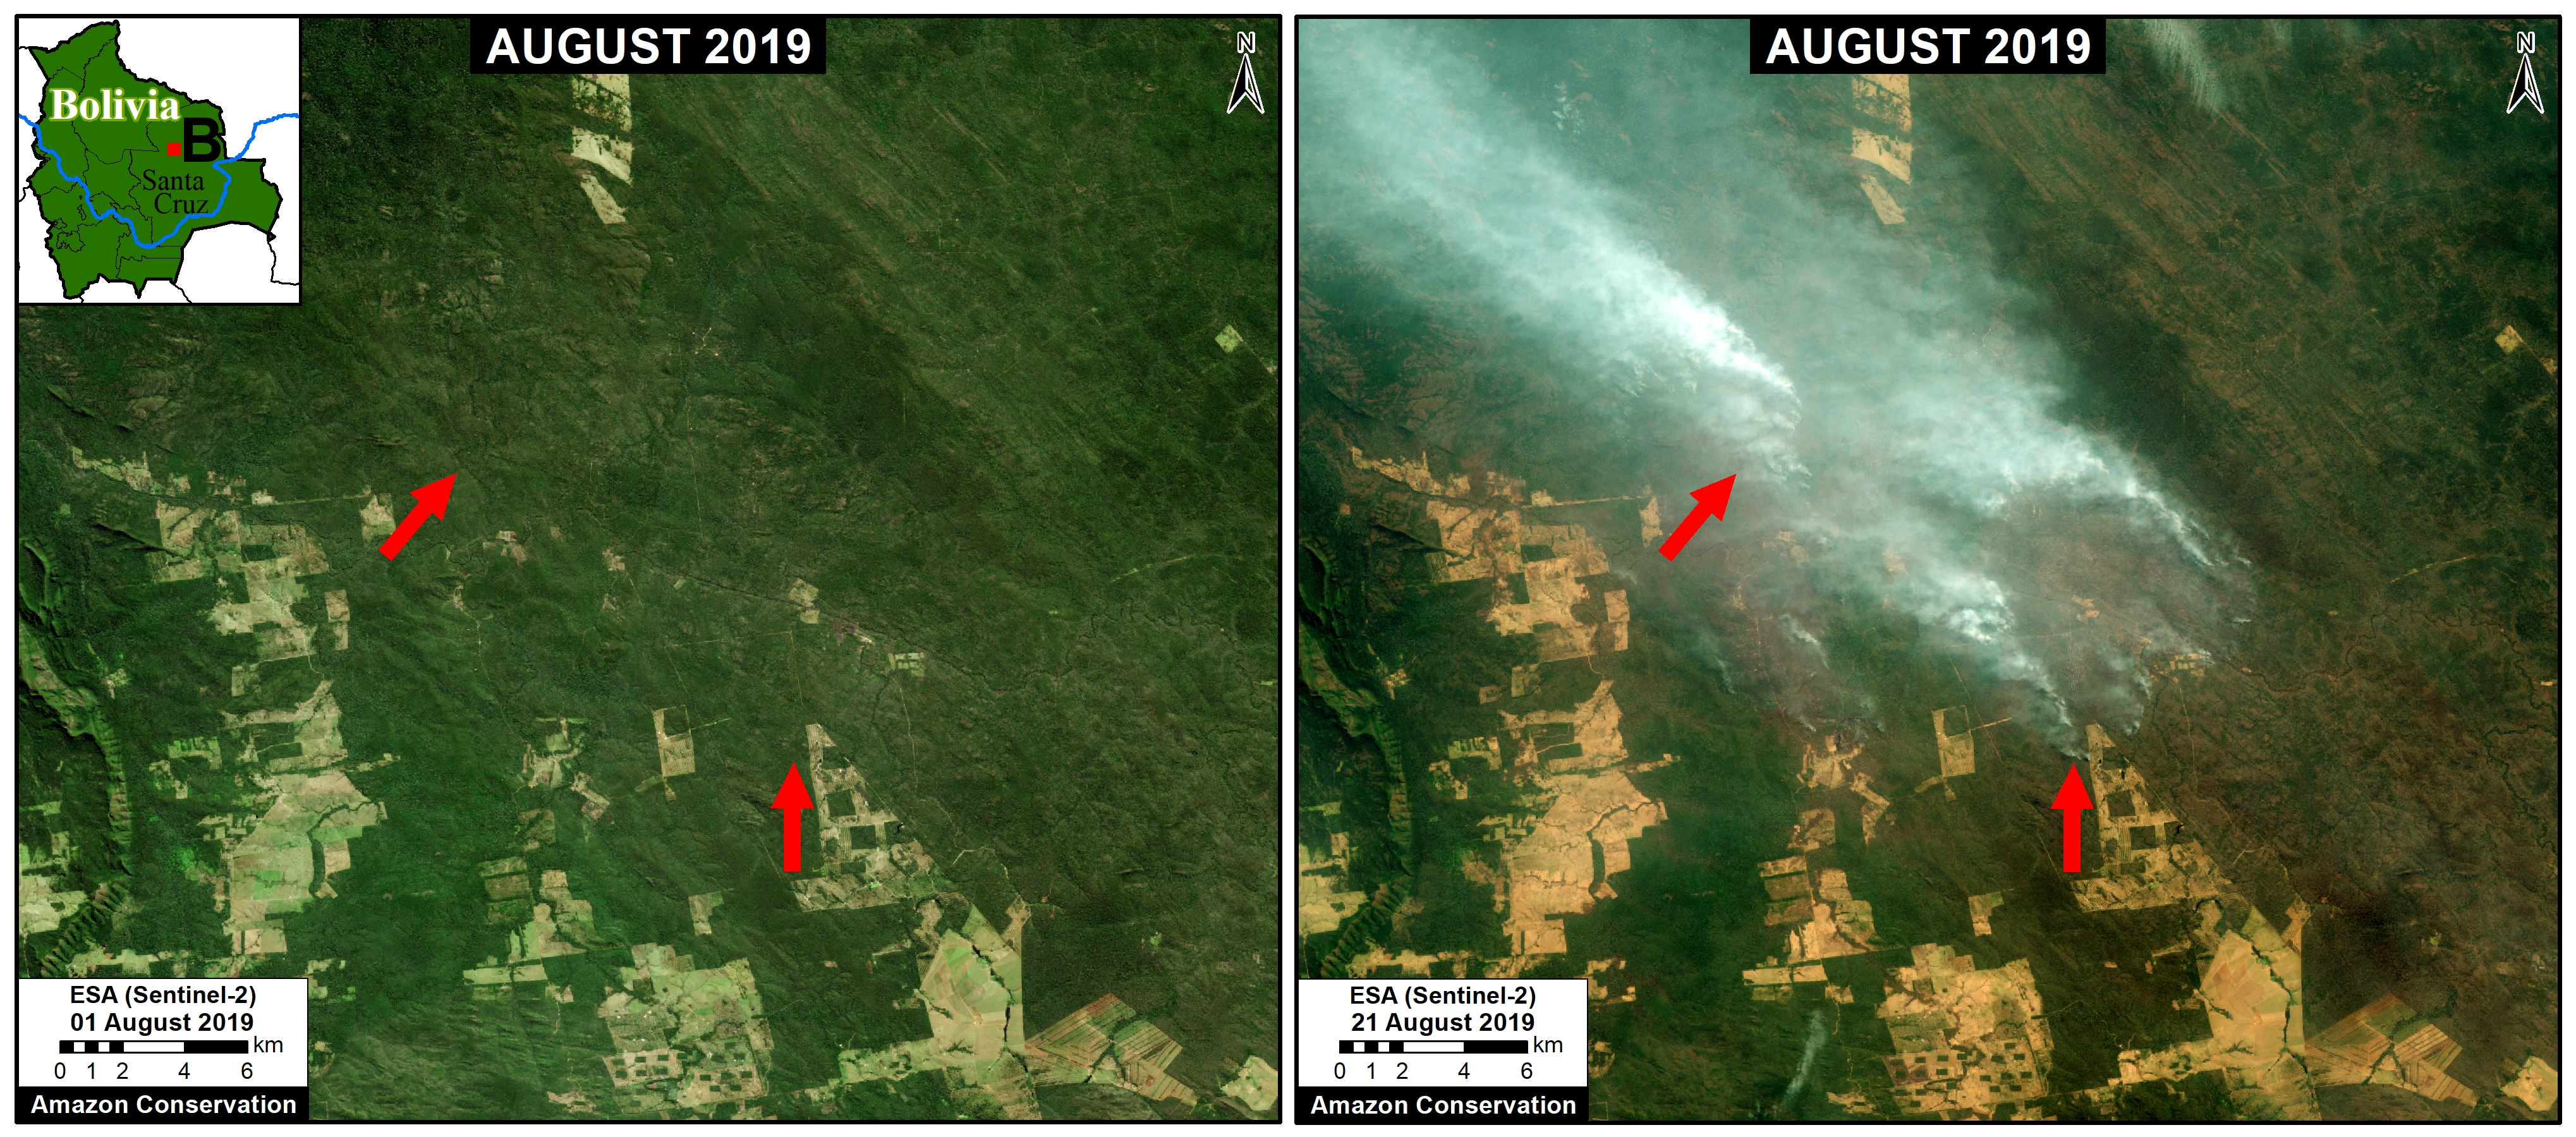
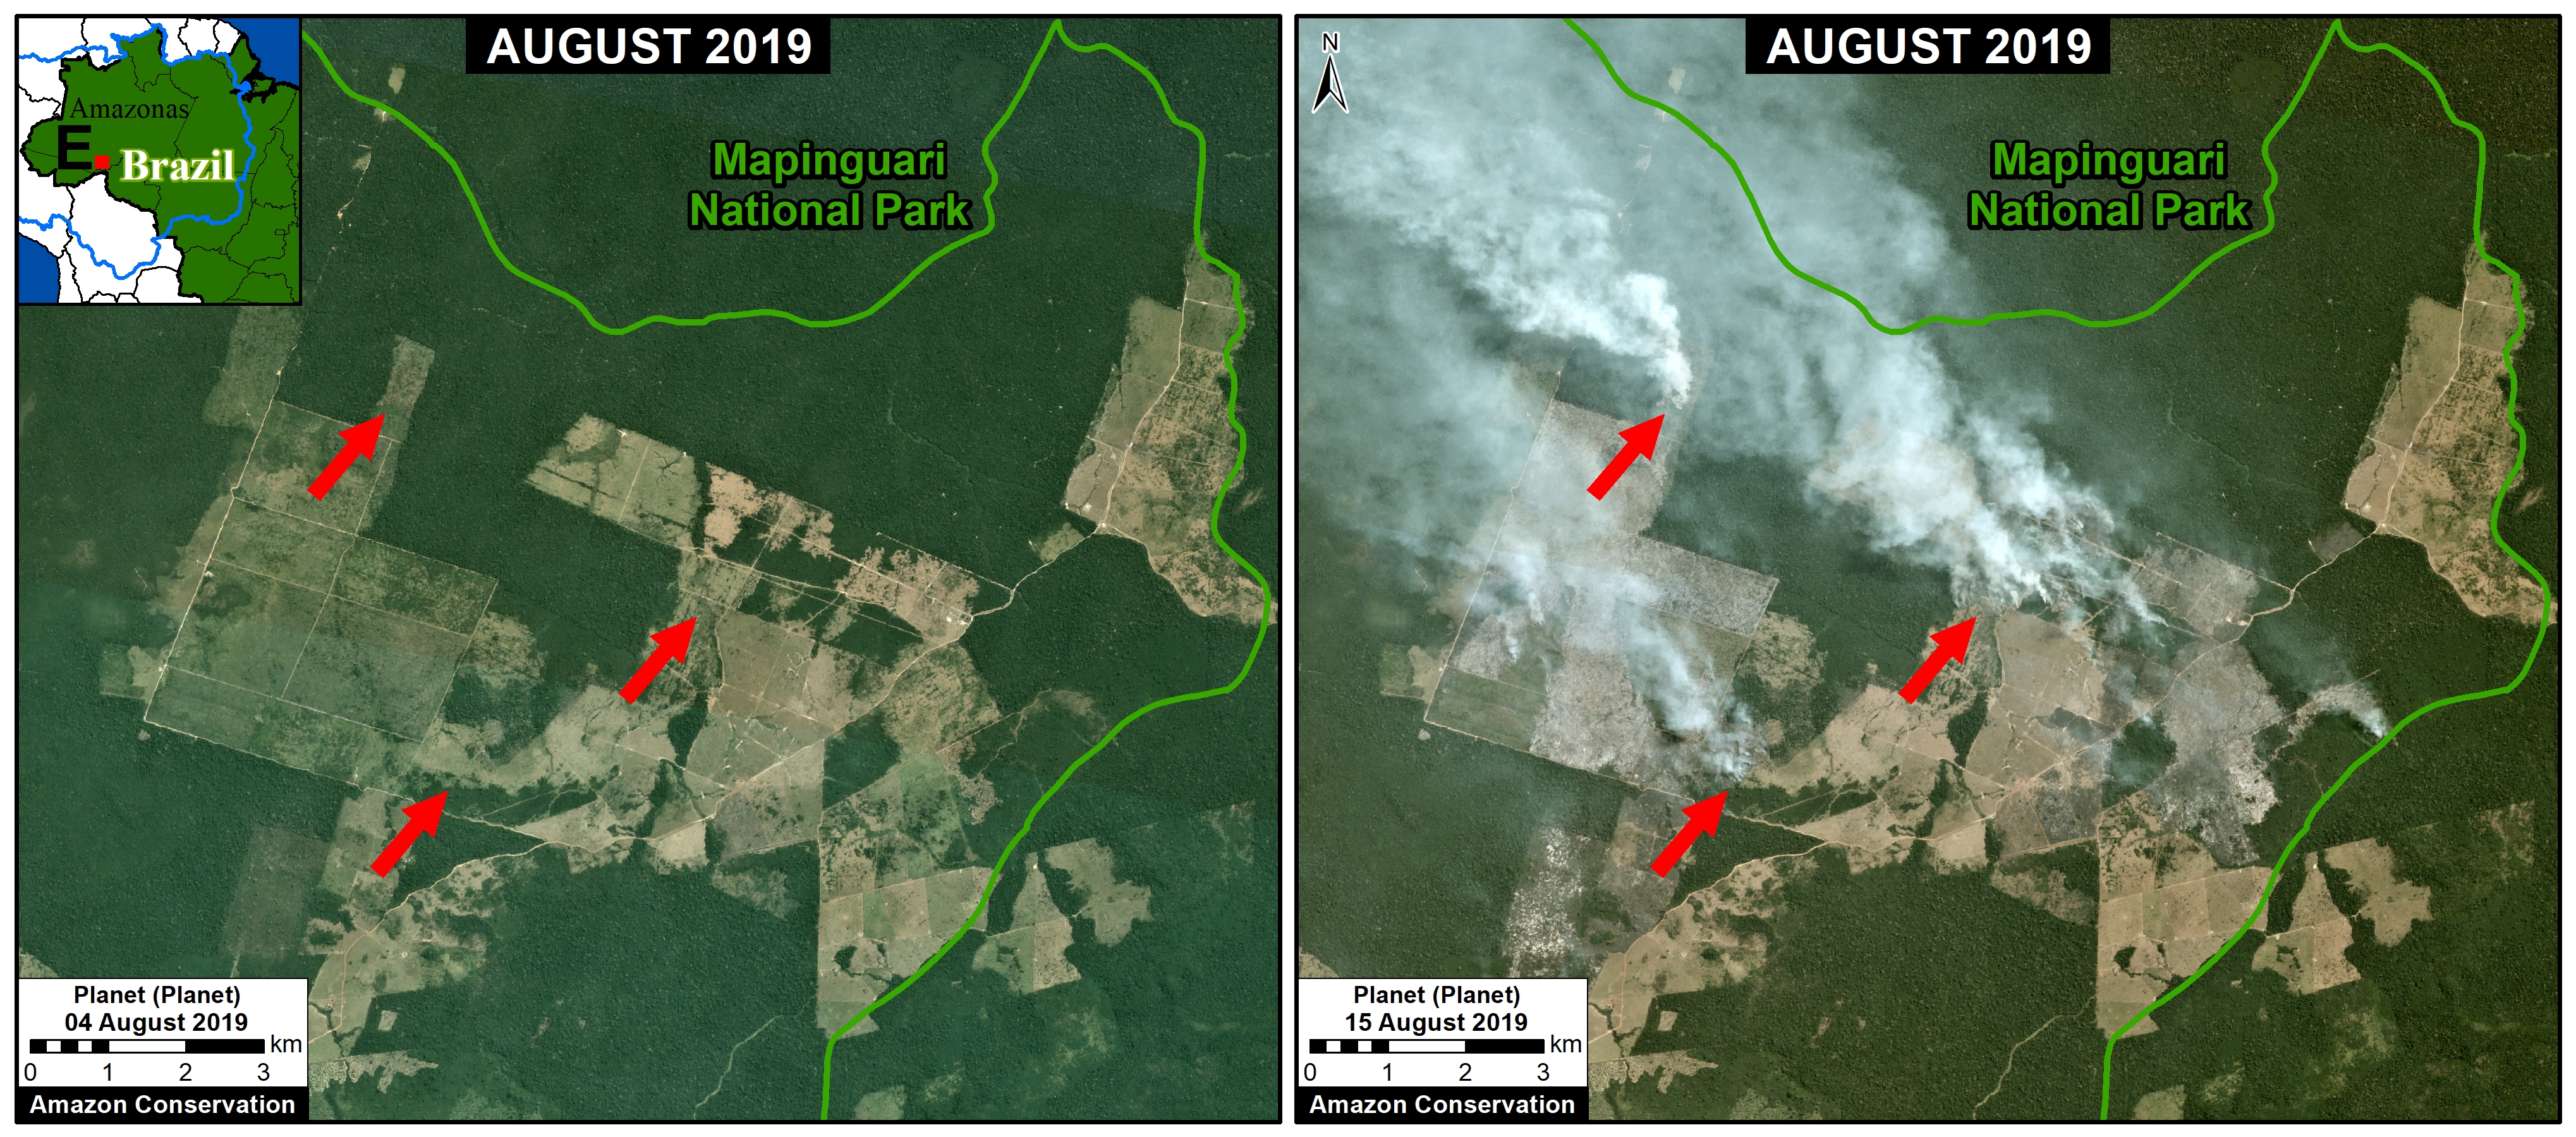
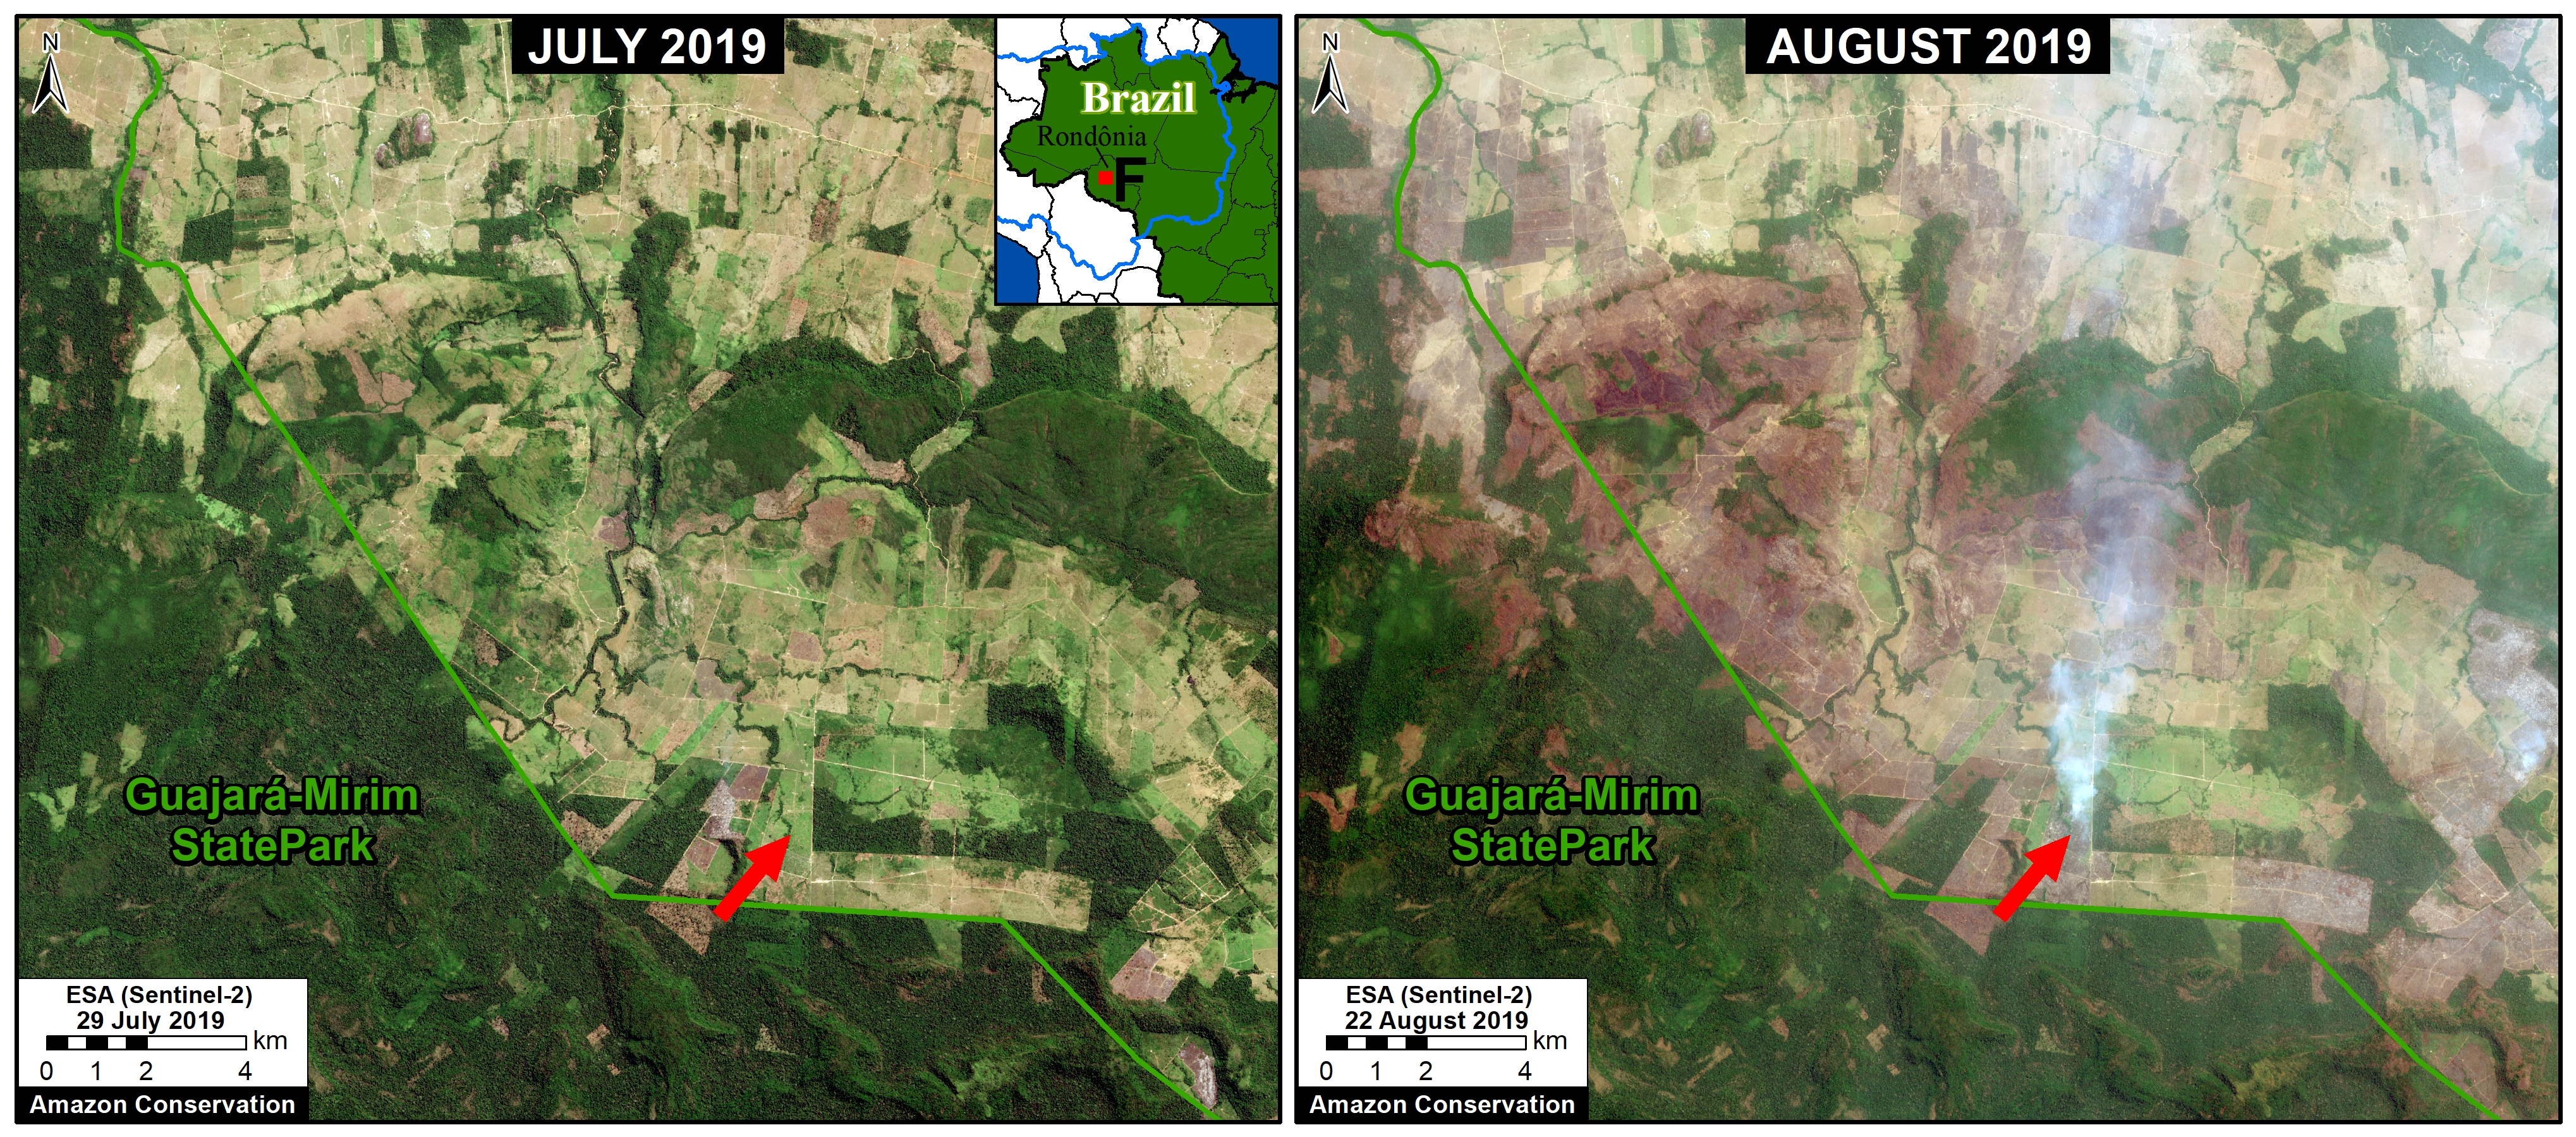
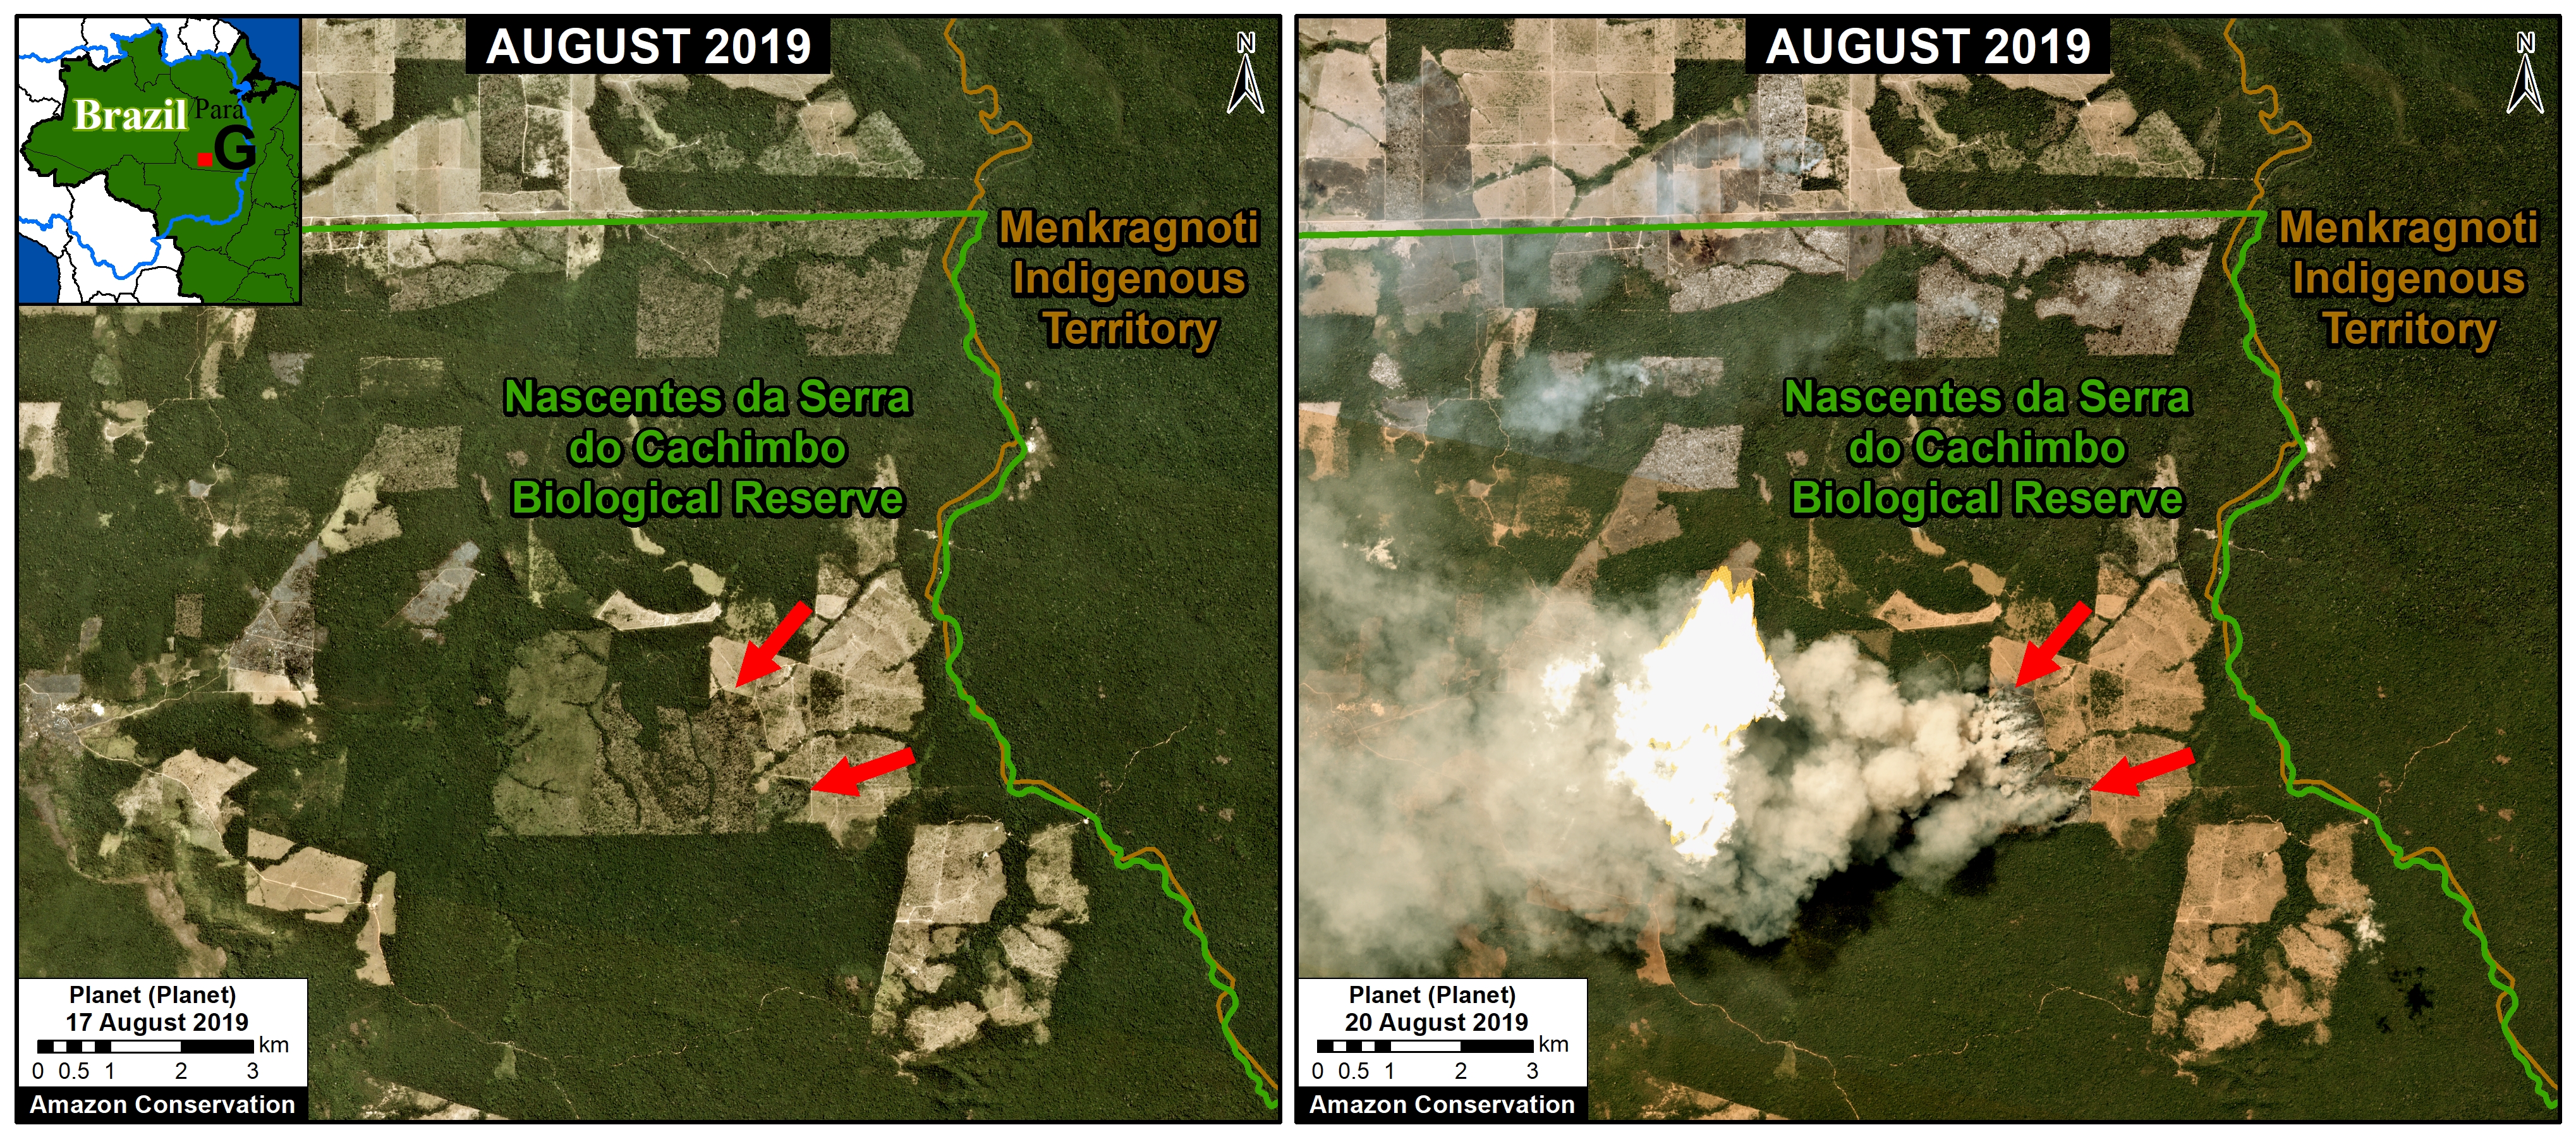
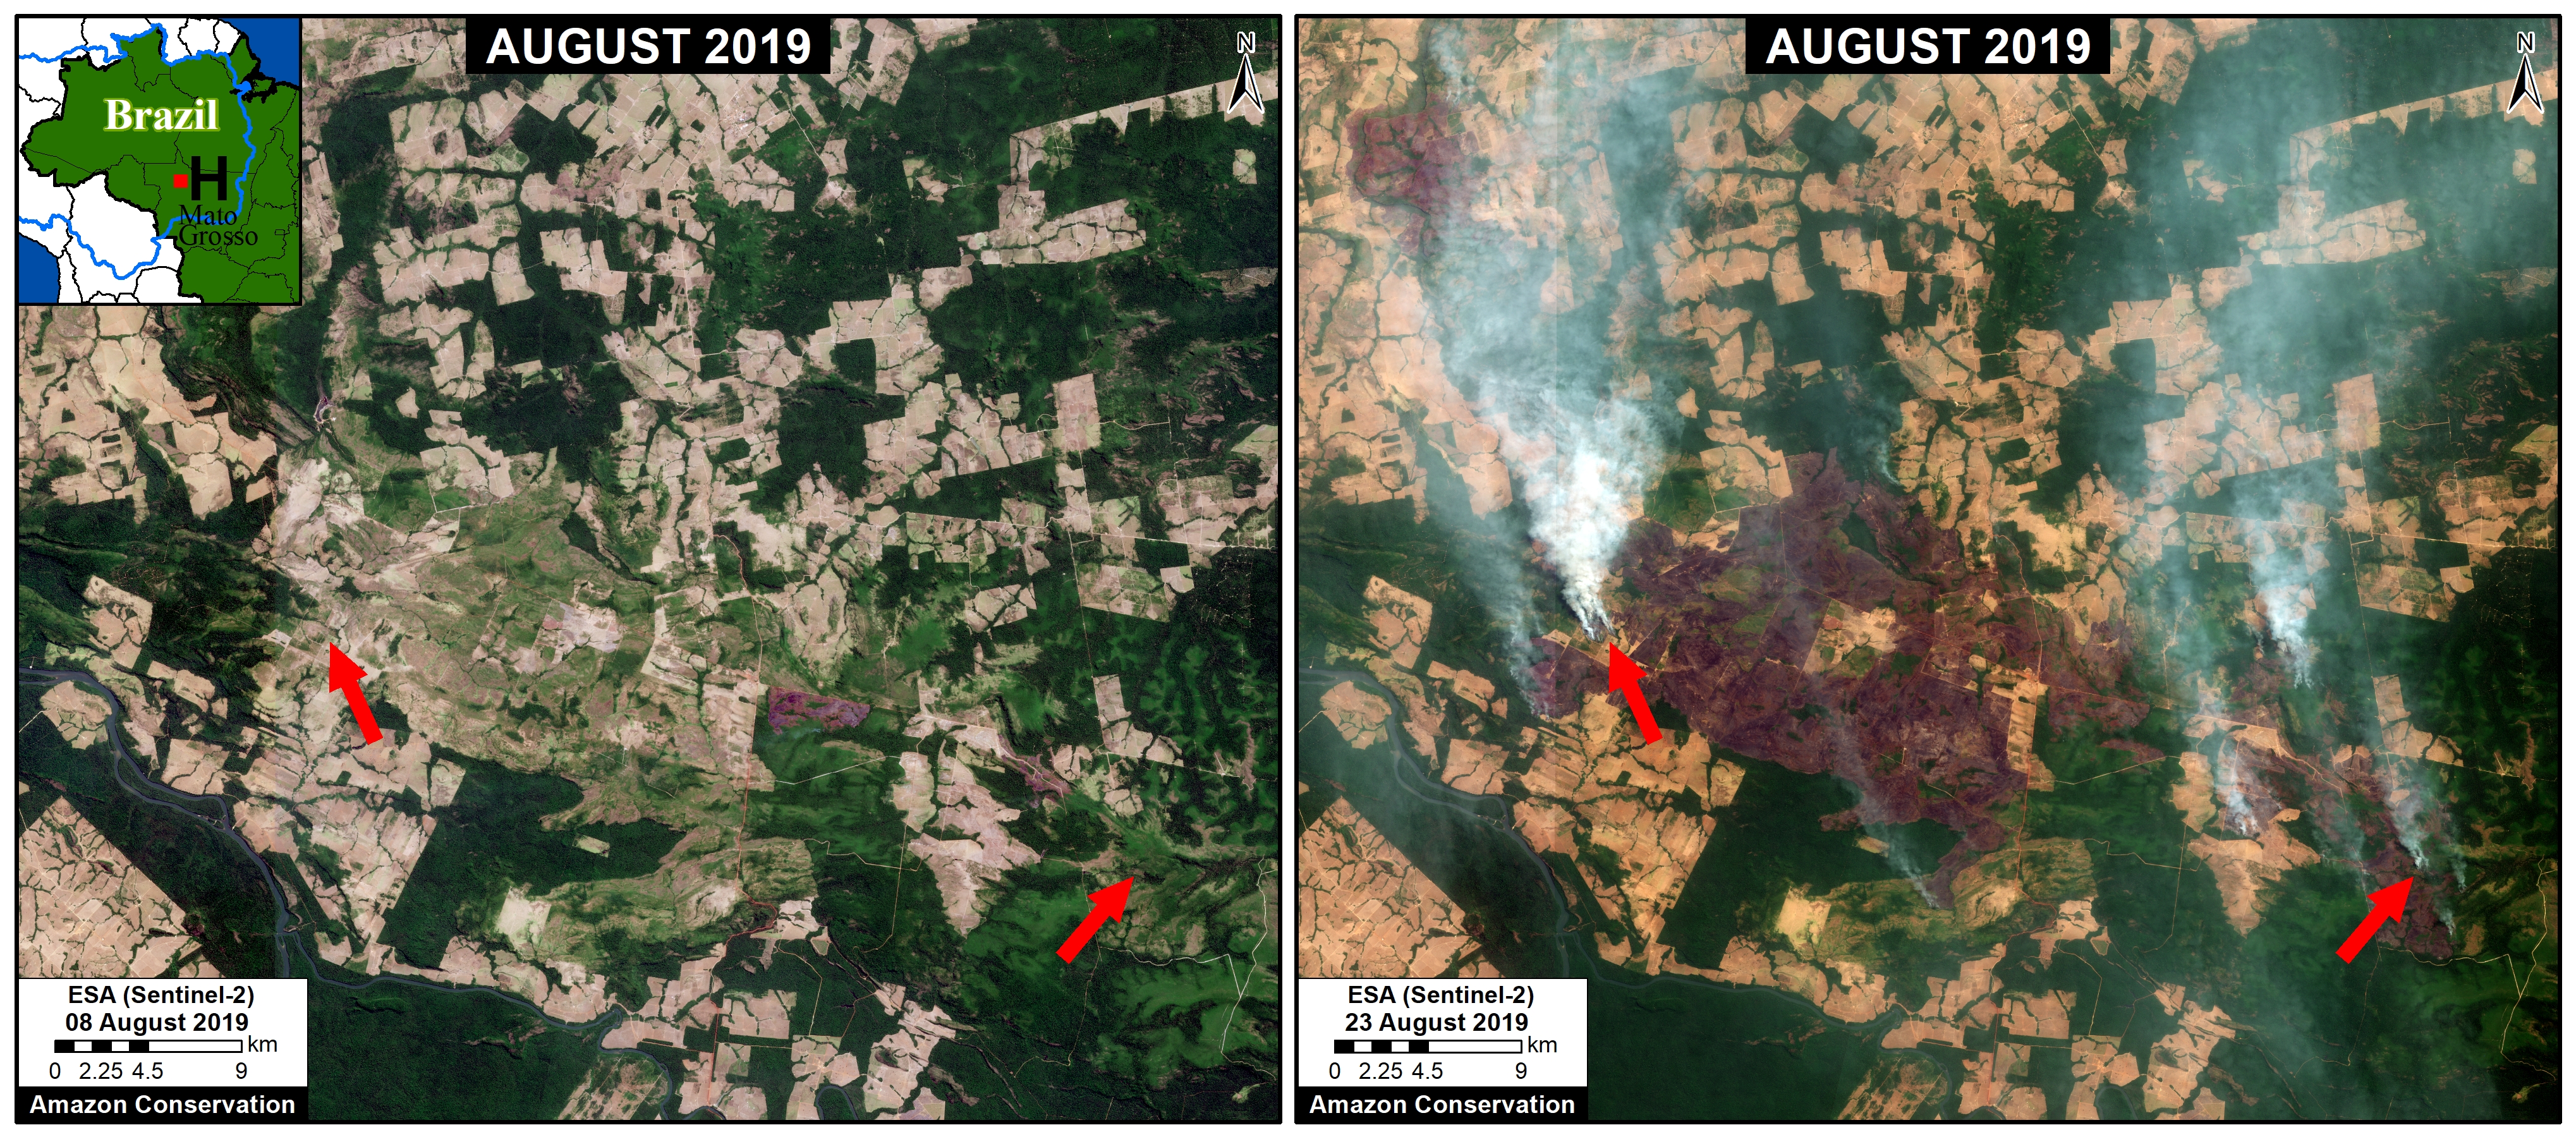
We highlight our key finding that the vast majority of major fires (88%burned recently deforested areas covering 557,000 acres (226,000 hectares). Thus, the fires are actually a striking indicator of the rampant deforestation currently threatening the the Brazilian Amazon.

We have detected 4 Forest fires (1% of the major fires) covering 2,790 acres (1,130 hectares) and 3 savanna fires covering 38,000 acres (15,000 hectares). The rest of the major fires are burning older agricultural areas.

Other key findings include:

  • The vast majority of the fires (96%) are illegal, occuring past the 120 day moratorium established in July.
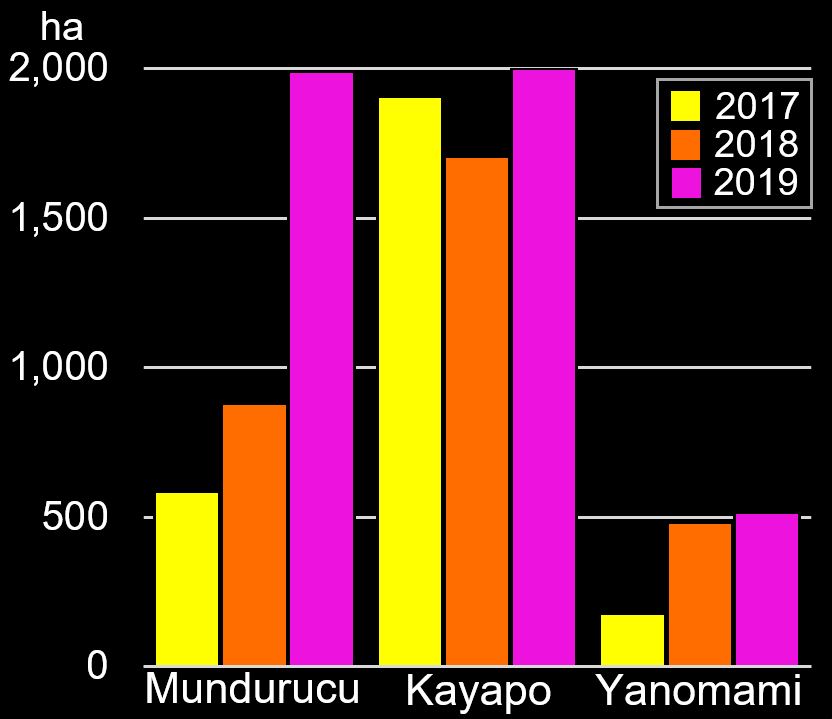
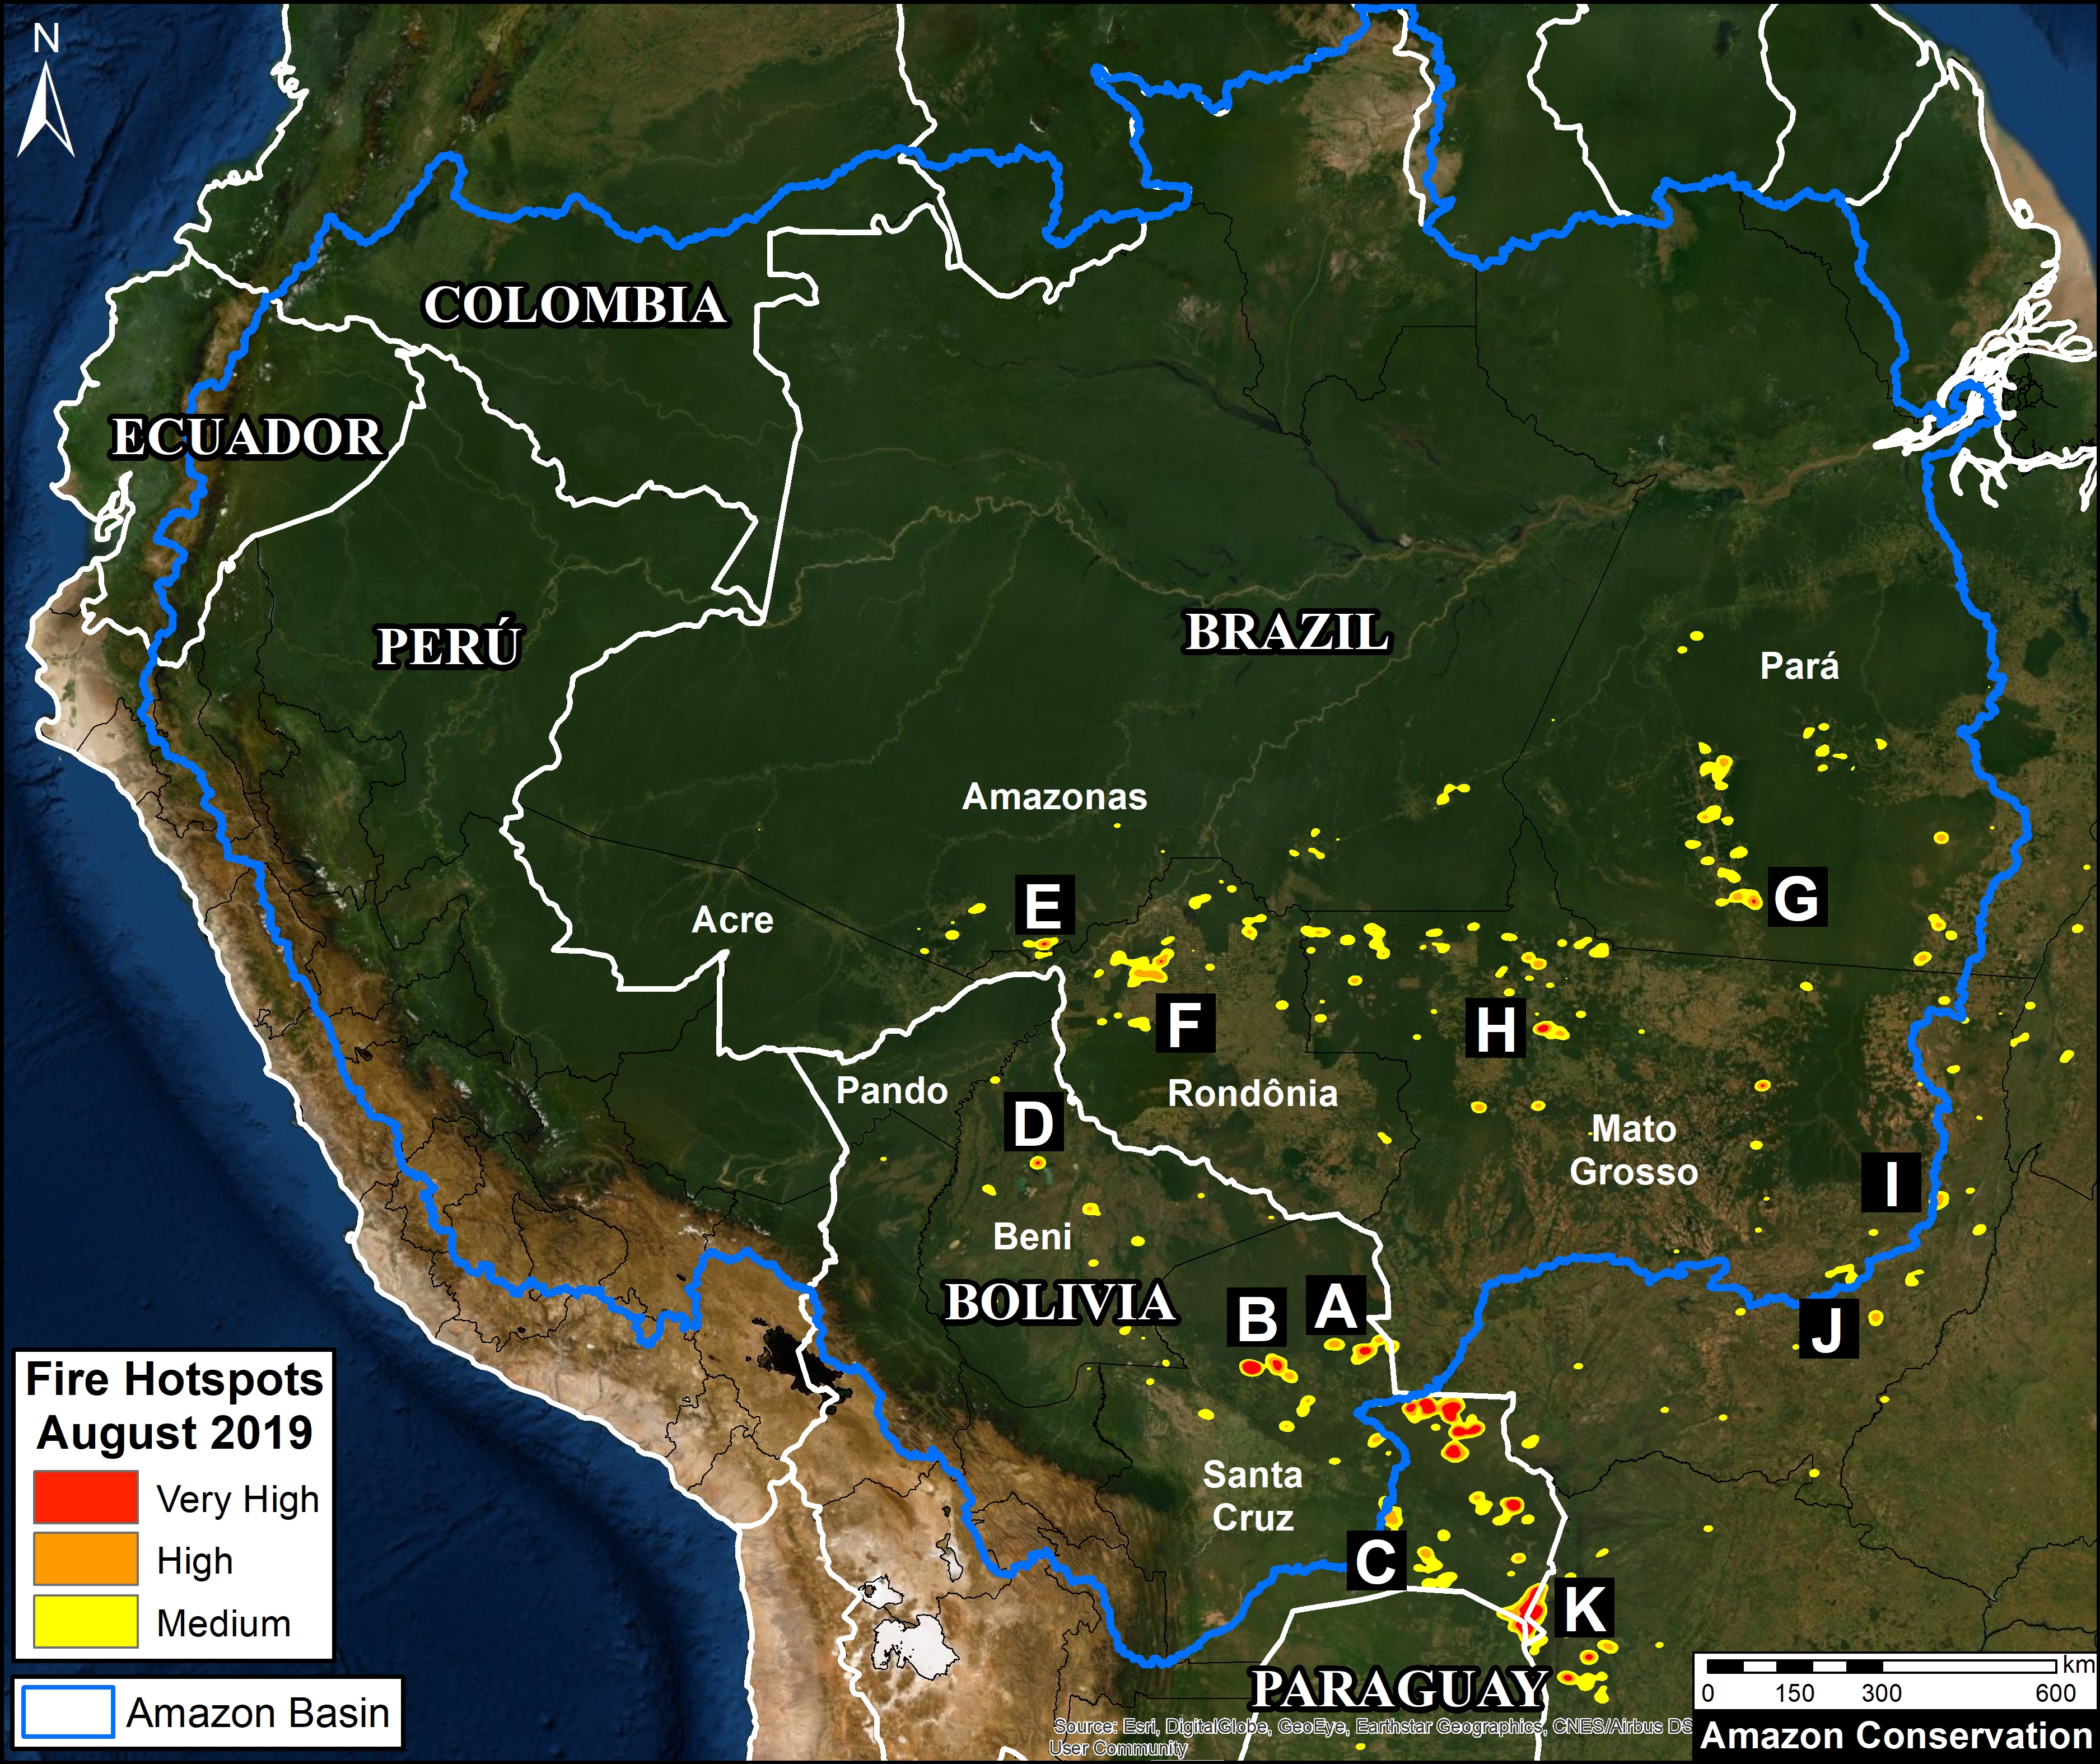
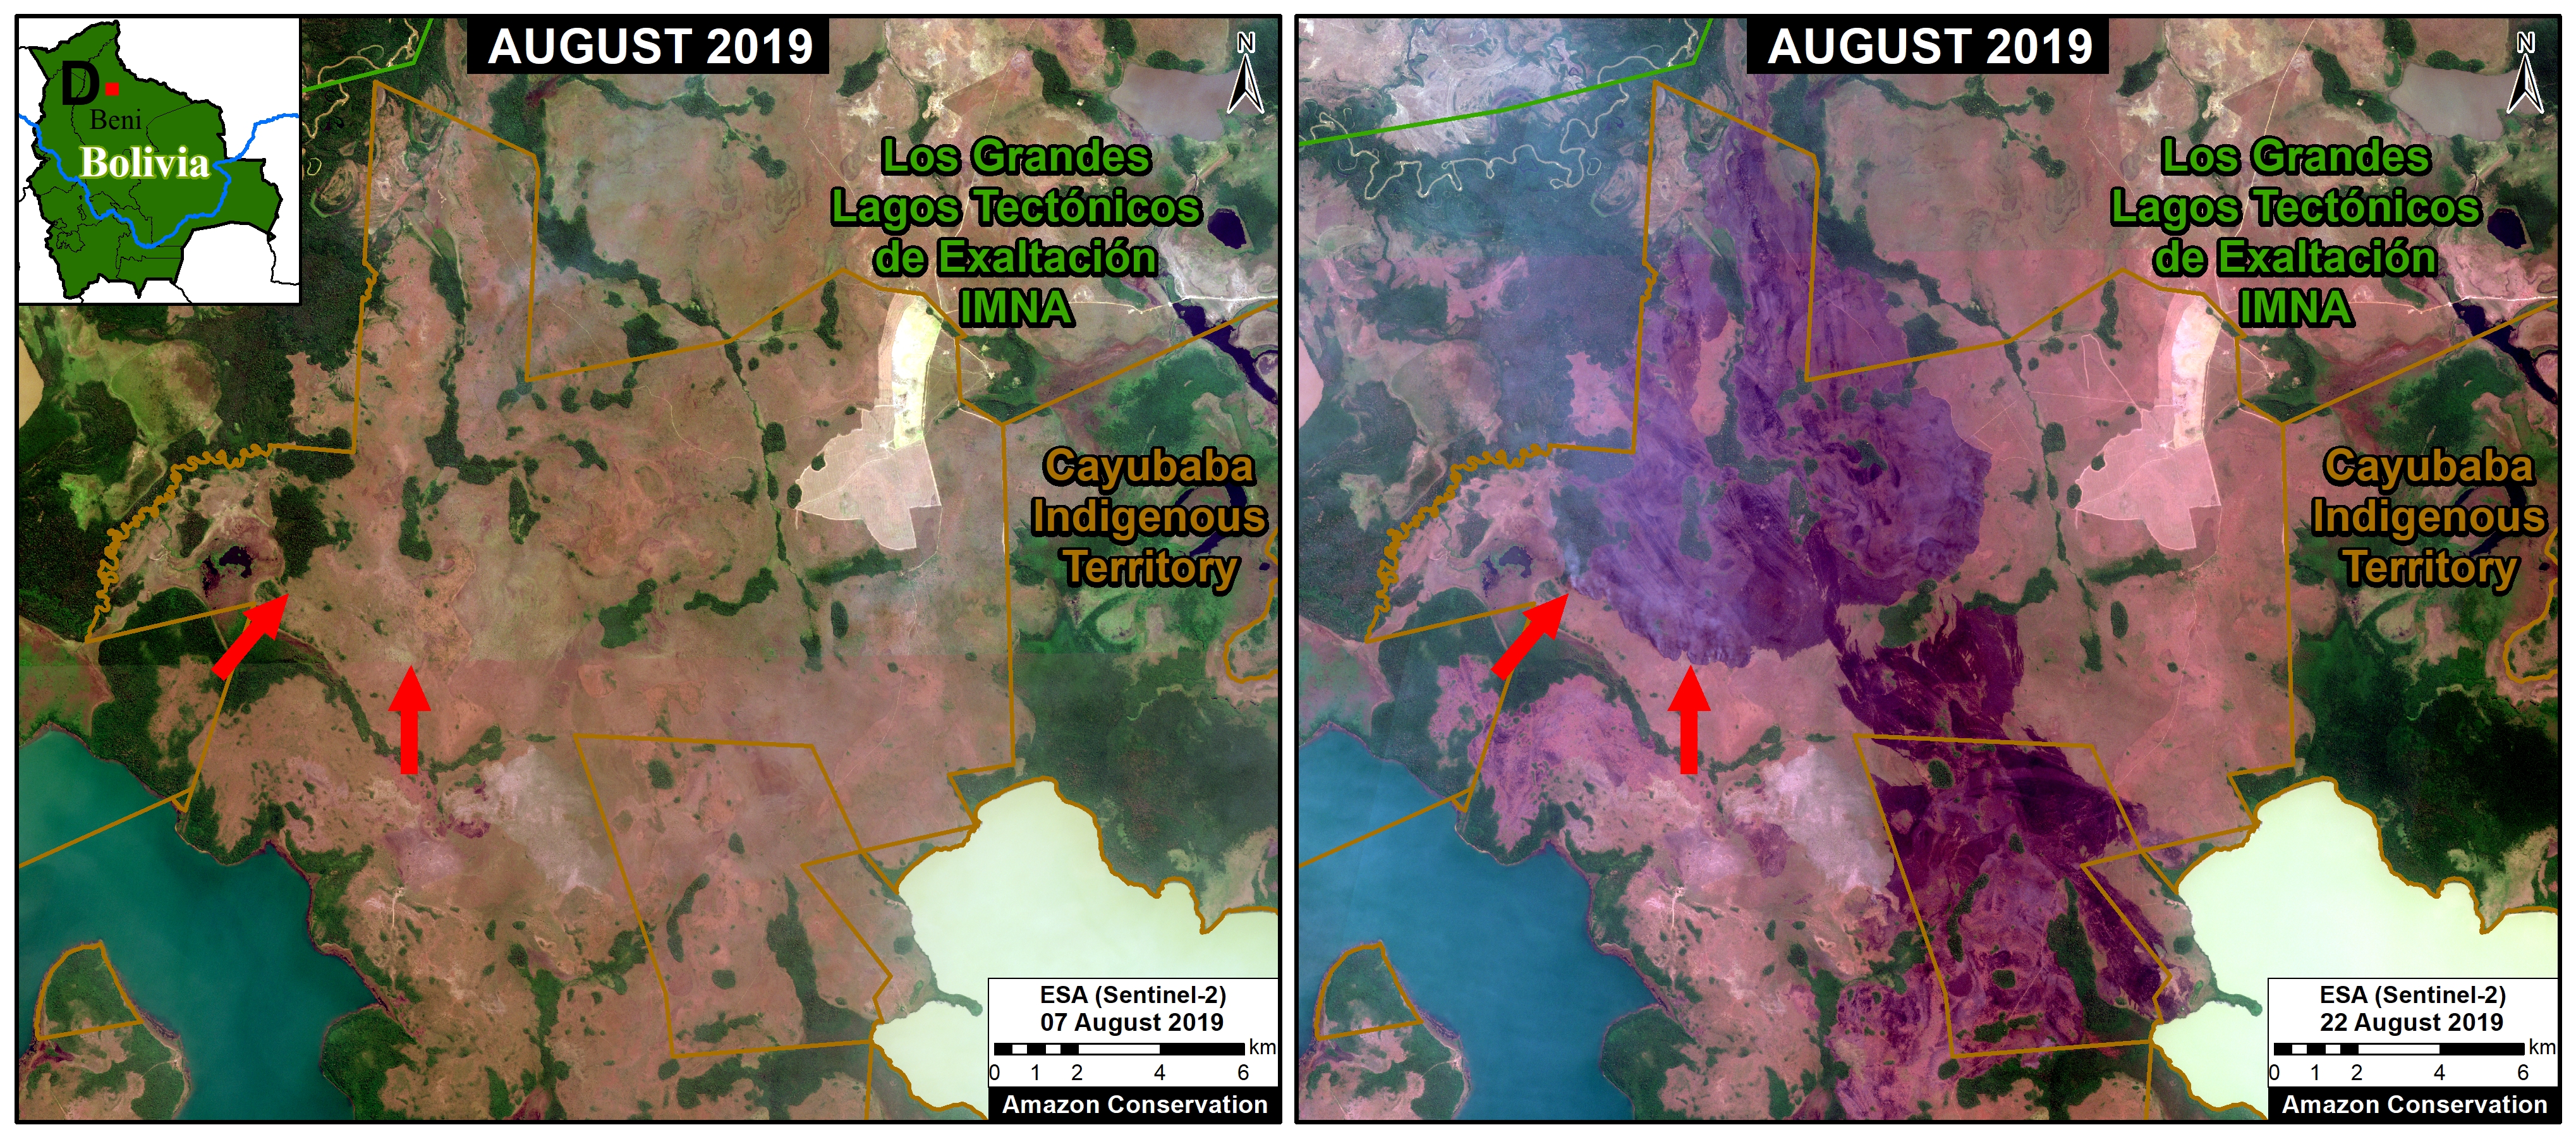
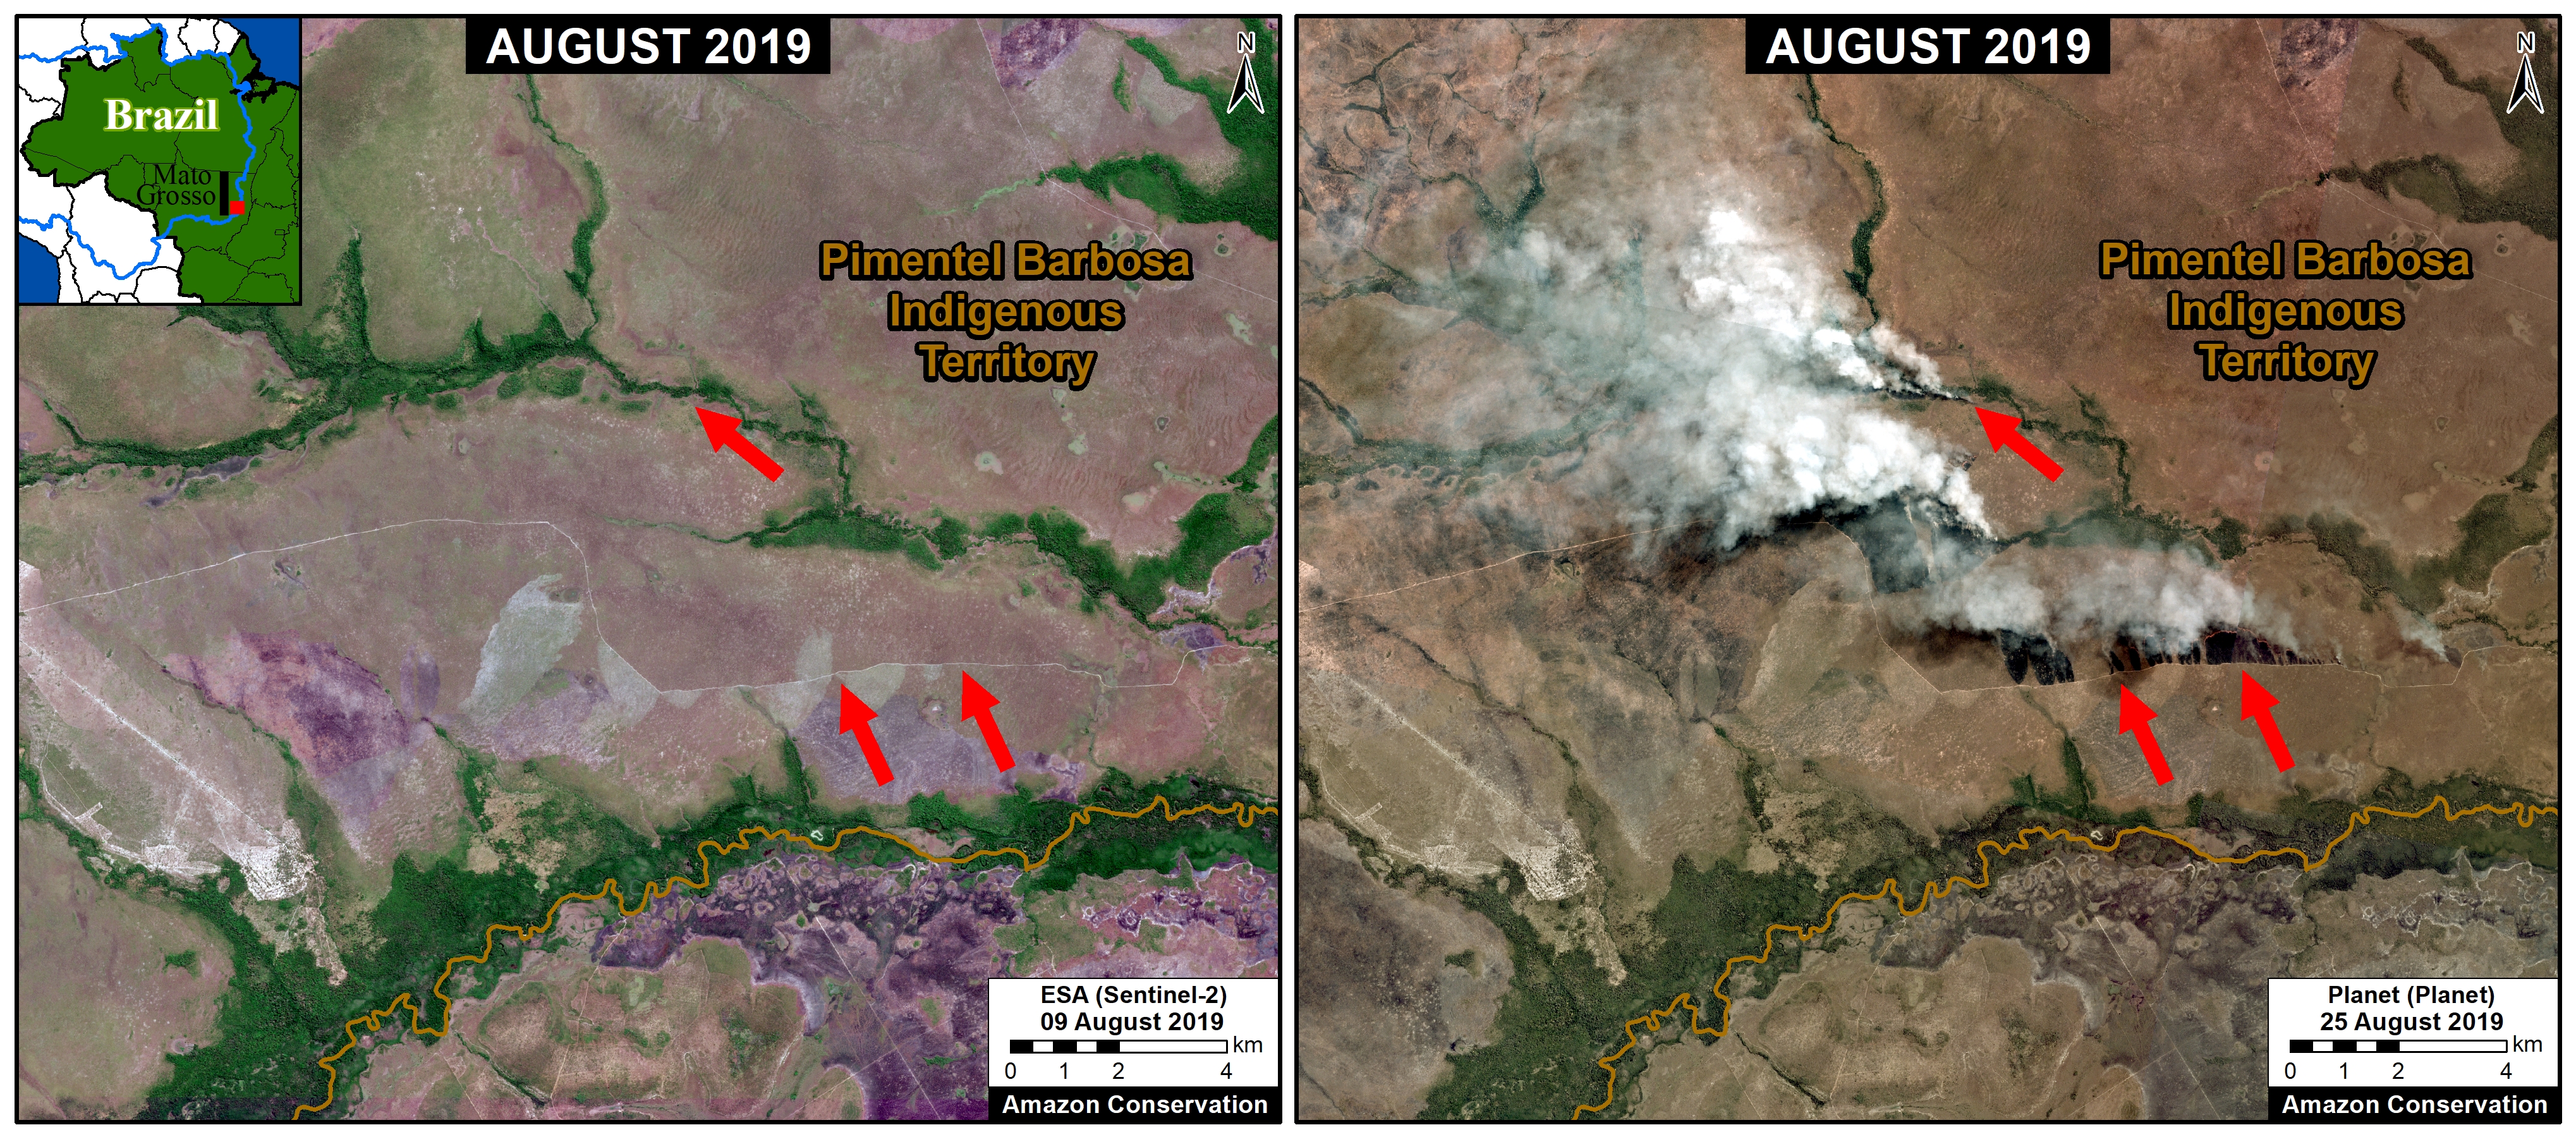
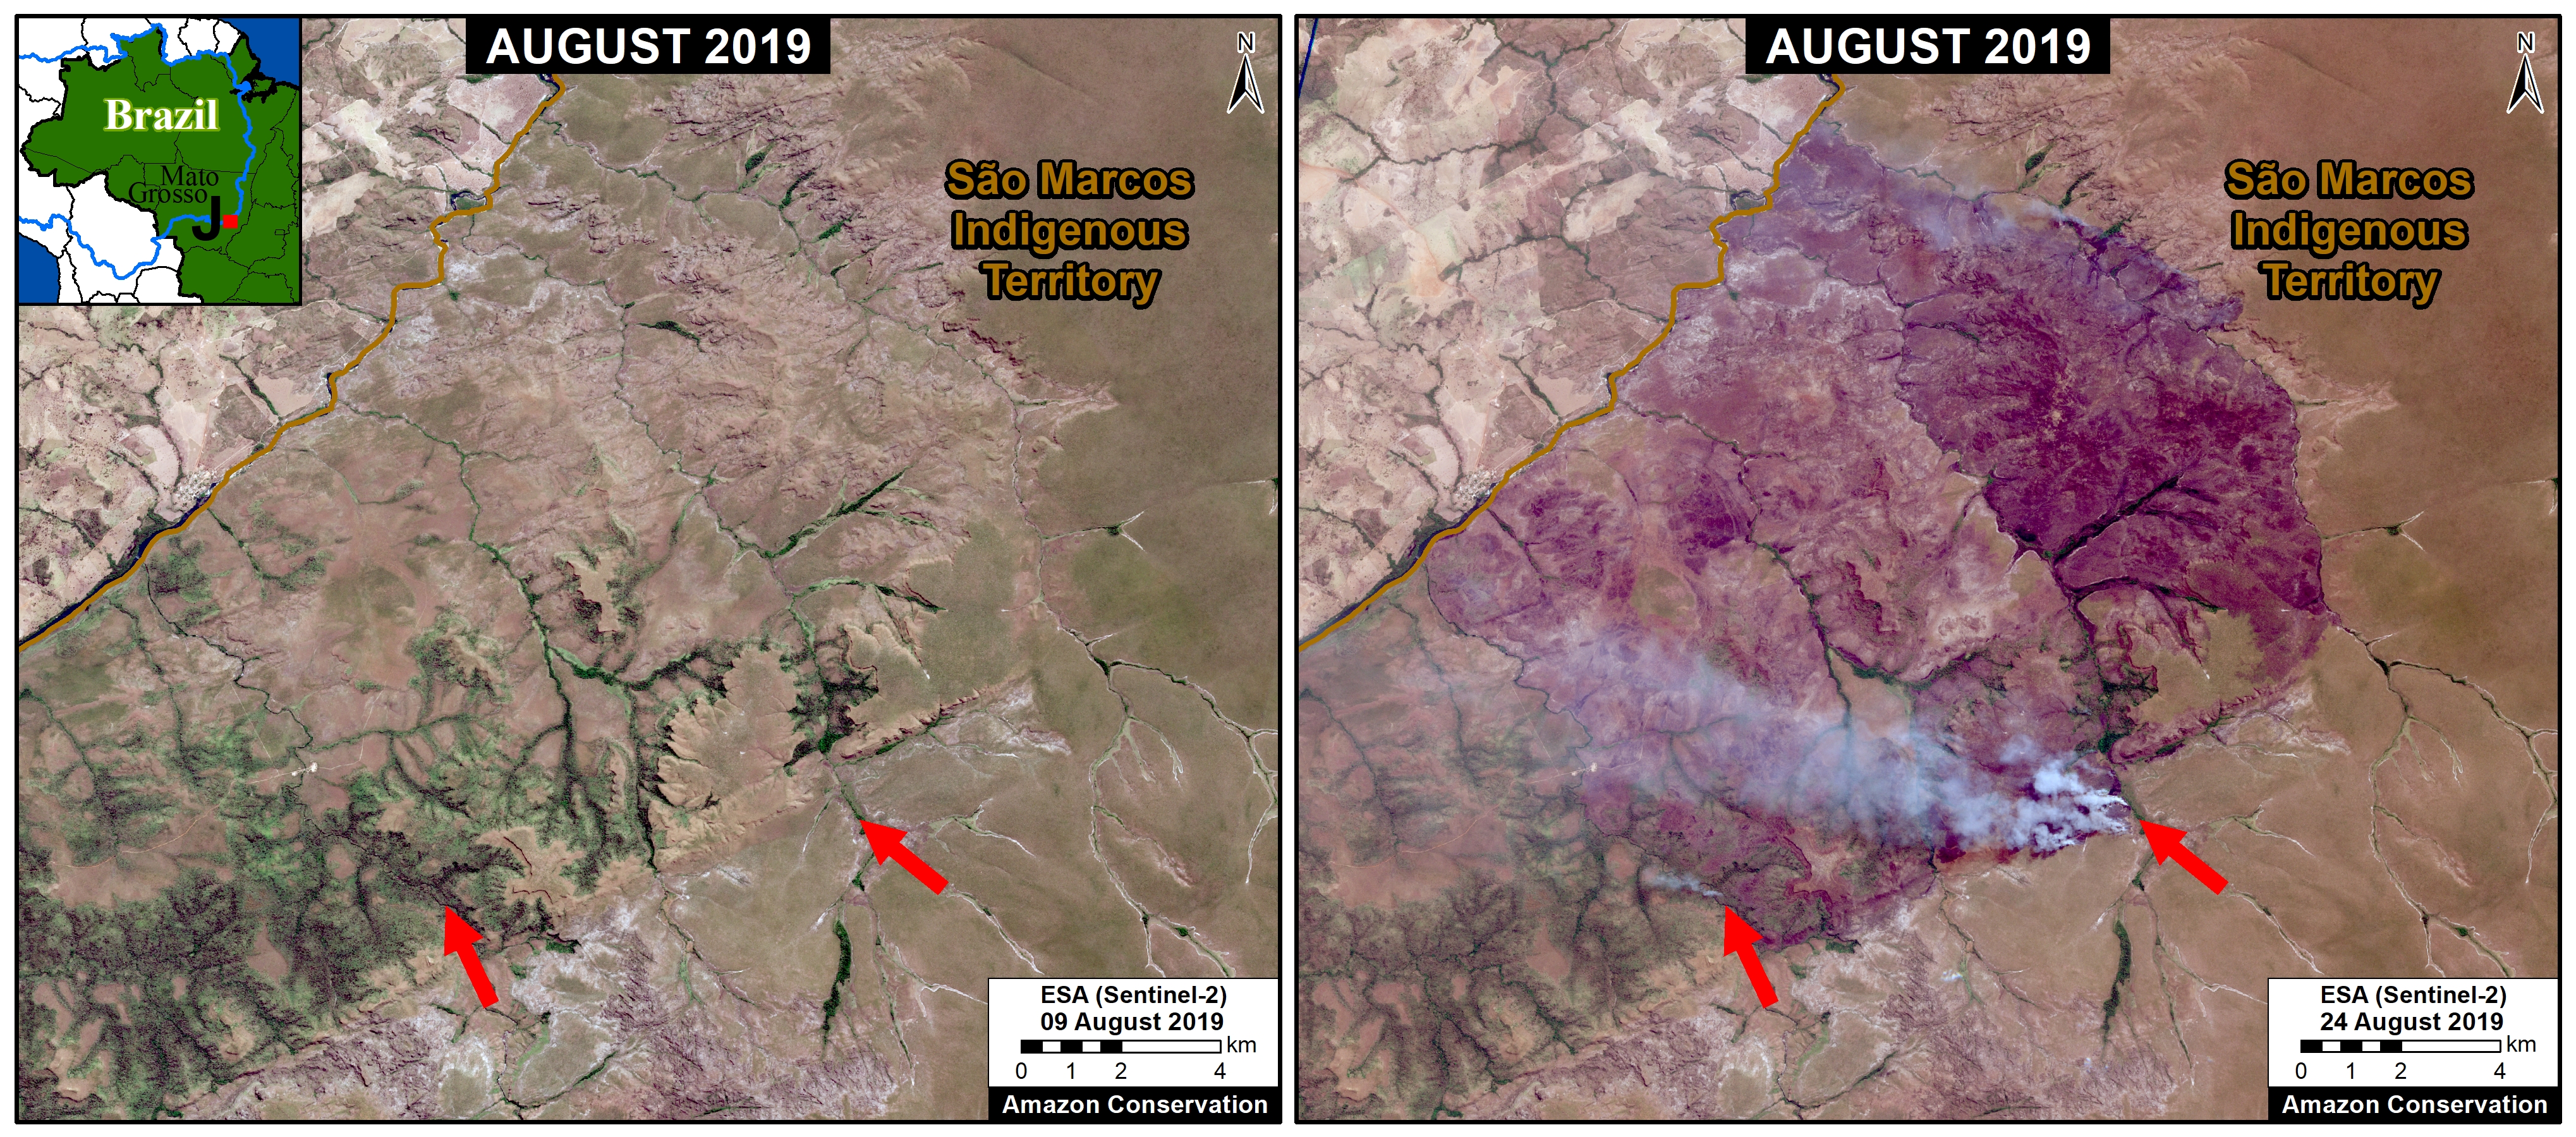
  • At least 18 of the major fires have been in protected areas or indigenous territories.
  • Most of the fires (70%) have occurred in two departments: Amazonas and Para. Mato Grosso and Rondonia each account for 15%.

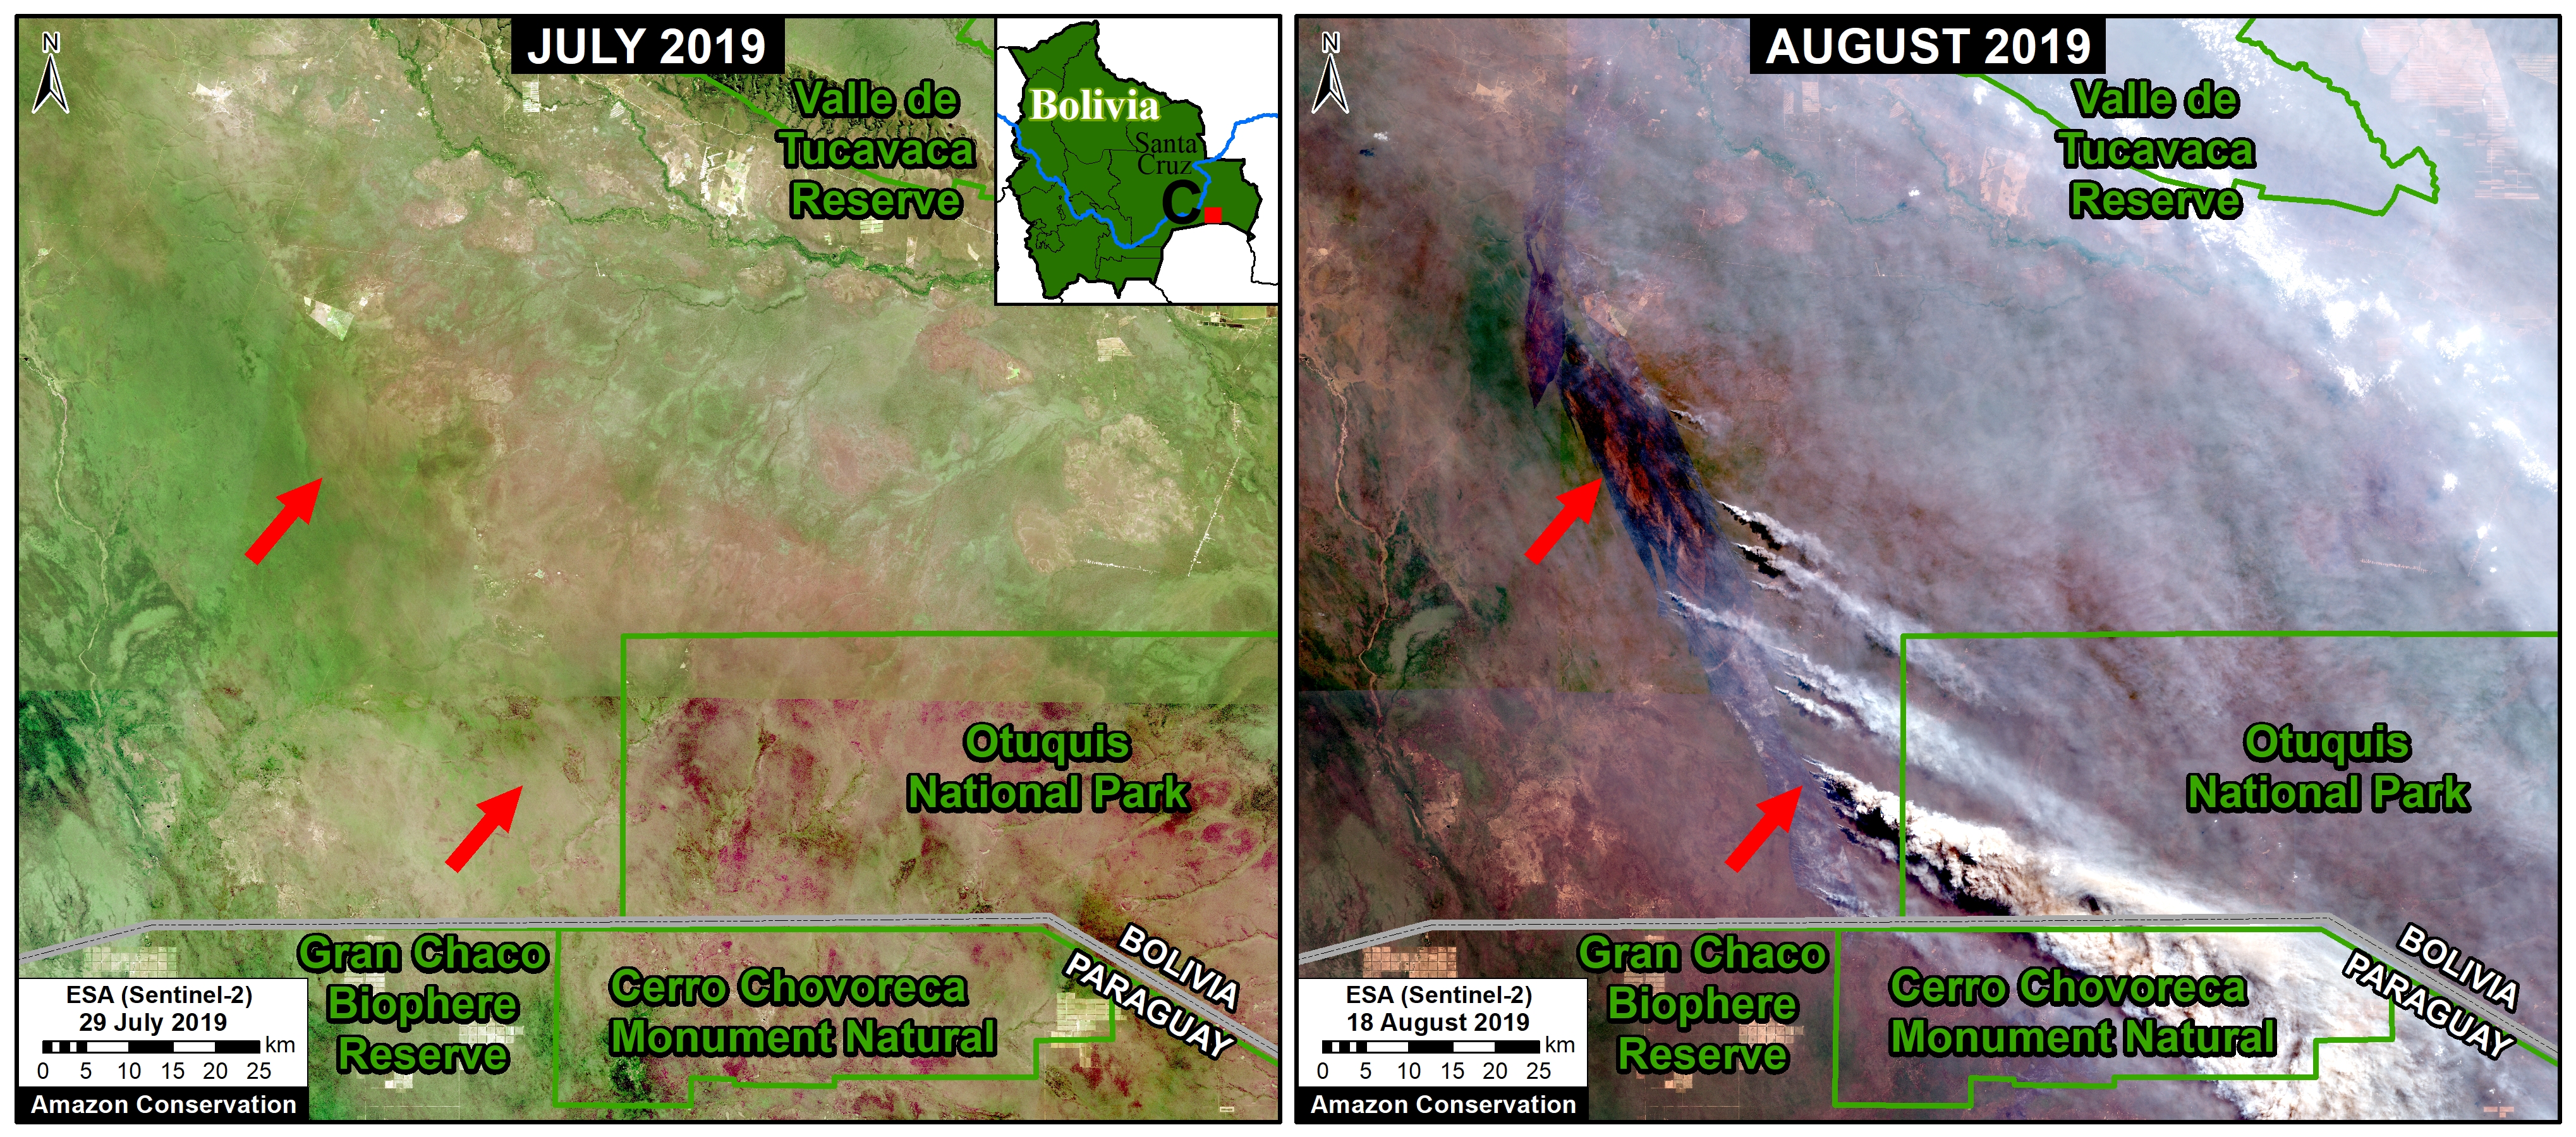
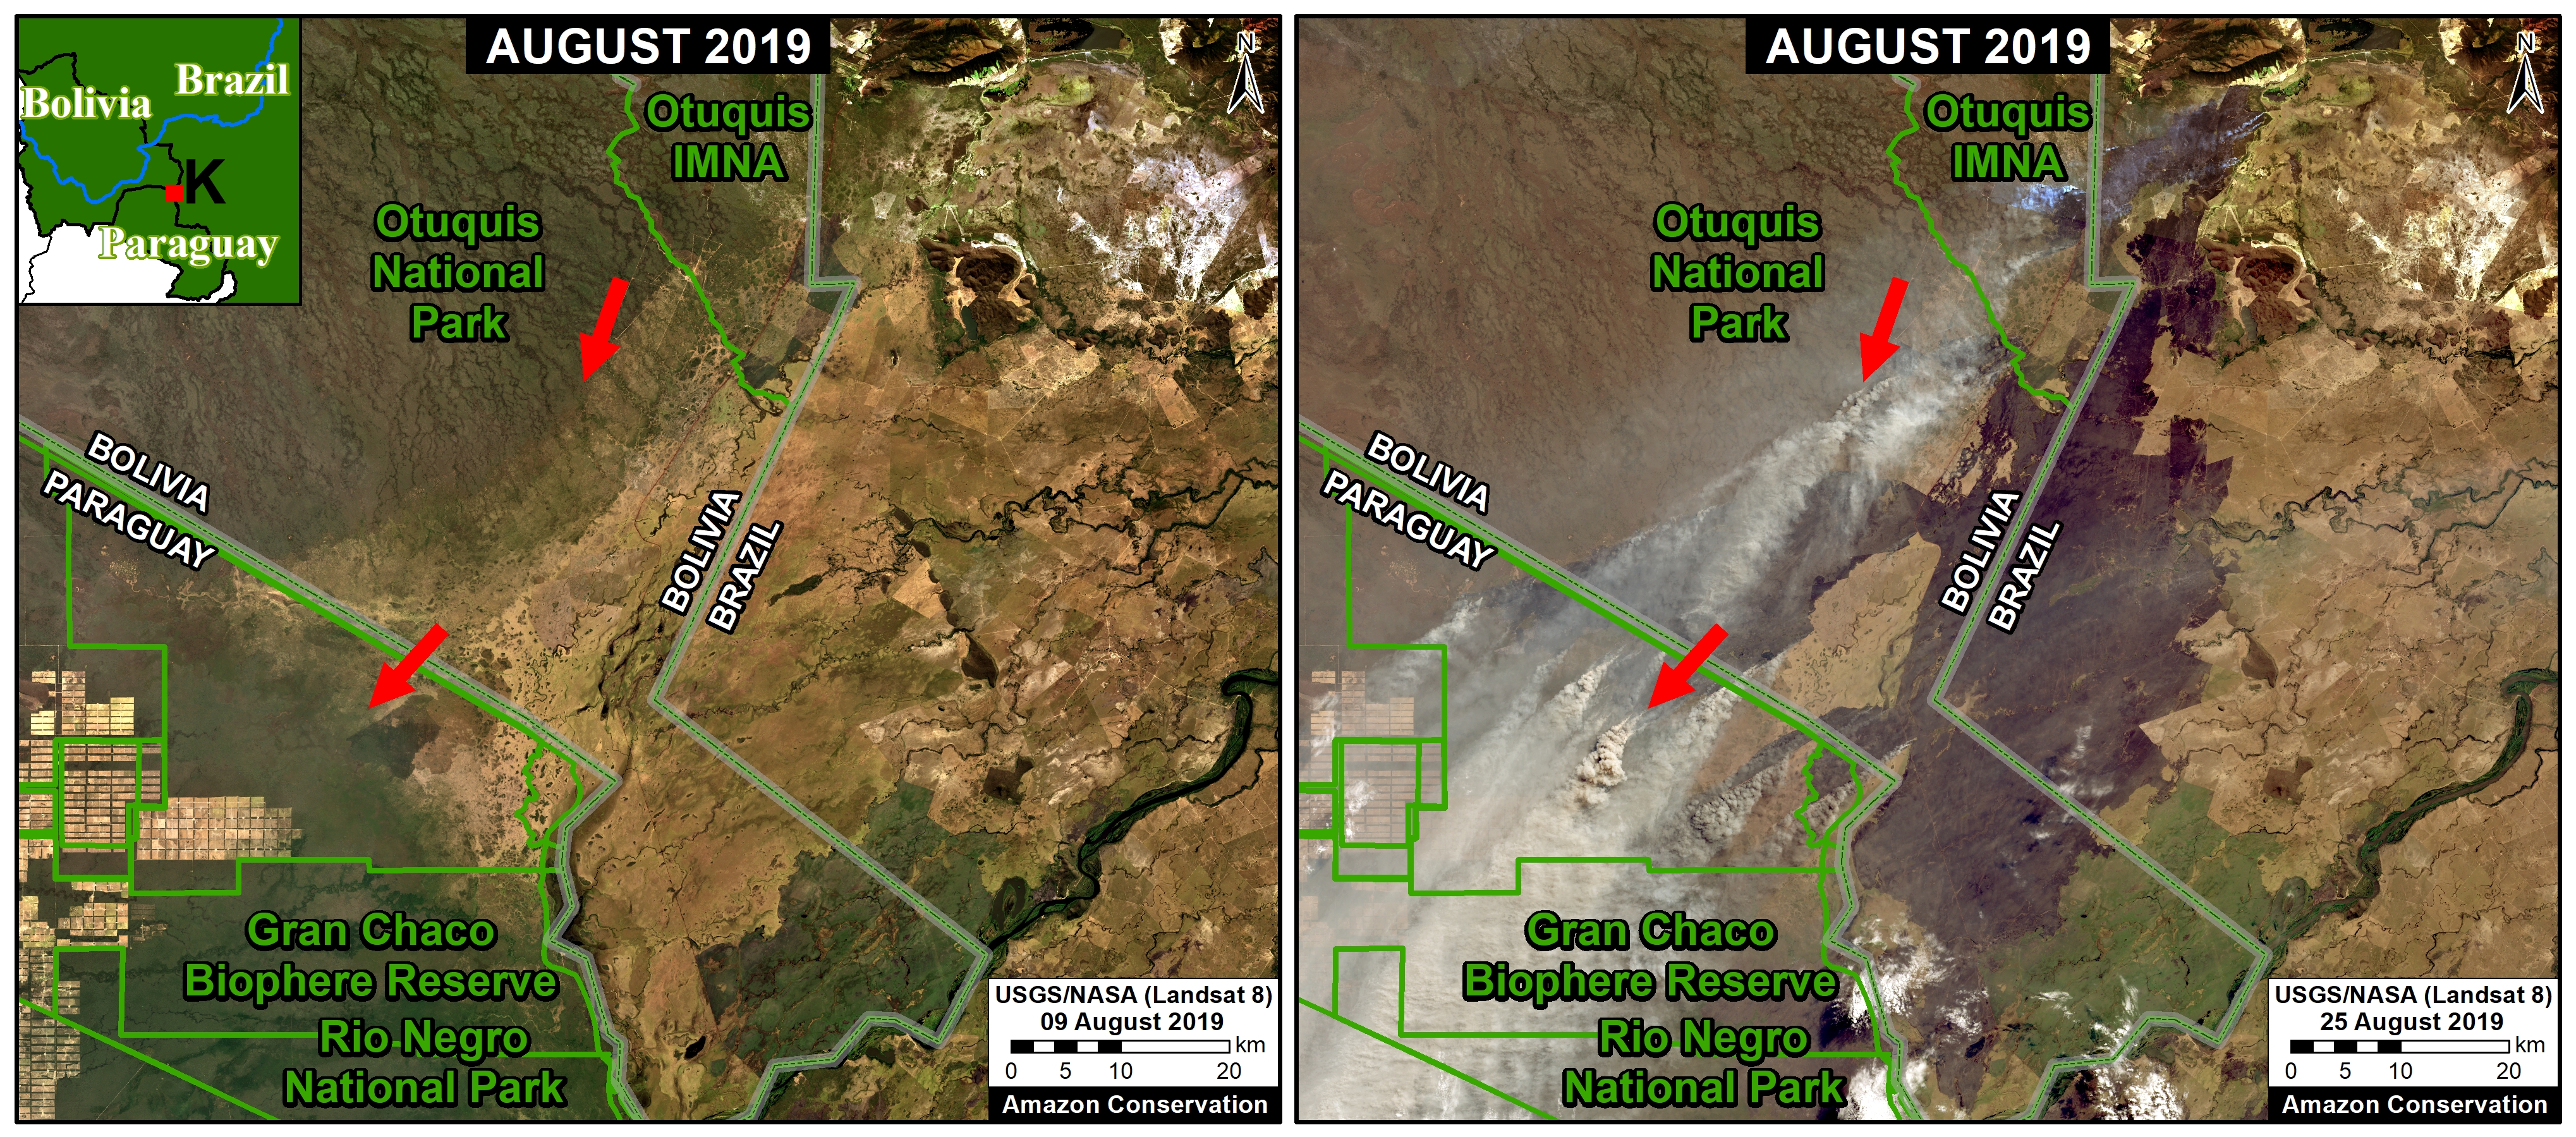
We have detected an additional 10 major fires in the Bolivian Amazon, and that will be the feature of a future report.

Images of the 2020 Brazilian Amazon Fires

1) Fires burning recently deforested areas

Brazilian Amazon Fire #338 (August 16, 2020)

Brazilian Amazon Fire #335 (August 16, 2020)

Brazilian Amazon Fire #233 (August 11, 2020)


Brazilian Amazon Fire #230 (August 11, 2020)

Brazilian Amazon Fire #221 (August 11, 2020)

Brazilian Amazon Fire #202 (August 10, 2020)

Brazilian Amazon Fire #188 (August 9, 2020)

Brazilian Amazon Fire #124 (August 6, 2020)

Brazilian Amazon Fire #110 (August 4, 2020)

Brazilian Amazon Fire #109 (August 4, 2020)

Brazilian Amazon Fire #76 (August 1, 2020)

2) Forest Fires 

Brazilian Amazon Fire #218, August 2020

Brazilian Amazon Fire #195, August 2020

3) Grassland (Savanna) Fires 

Brazilian Amazon Fire #219, August 2020

*Notes and Methodology

The app specializes in filtering out thousands of the traditional heat-based fire alerts to prioritize only those burning large amounts of biomass (defined here as a major fire).

In a novel approach, the app combines data from the atmosphere (aerosol emissions in smoke) and the ground (heat anomaly alerts) to effectively detect and visualize major Amazon fires.

When fires burn, they emit gases and aerosols. A new satellite (Sentinel-5P from the European Space Agency) detects these aerosol emissions. Thus, the major feature of the app is detecting elevated aerosol emissions which in turn indicate the burning of large amounts of biomass. For example, the app distinguishes small fires clearing old fields (and burning little biomass) from larger fires burning recently deforested areas or standing forest (and burning lots of biomass).

We define “major fire” as one showing elevated aerosol emission levels on the app, thus indicating the burning of elevated levels of biomass. This typically translates to an aerosol index of >1 (or cyan-green to red on the app). To identify the exact source of the elevated emissions, we reduce the intensity of aerosol data in order to see the underlying terrestrial heat-based fire alerts. Typically for major fires, there is a large cluster of alerts. The major fires are then confirmed, and burn areas estimated, using high-resolution satellite imagery from Planet Explorer.

See MAAP #118 for additional details.

No fires permitted in the Brazilian state of Mato Grosso after July 1, 2020. No fires permitted in all of Brazilian Amazon after July 15, 2020. Thus, we defined “illegal” as any major fires detected after these respective dates.

There was no available Sentinel-5 aerosol data on July 4, 15, and 26.

Acknowledgements

This analysis was done by Amazon Conservation in collaboration with SERVIR Amazonia.

Citation

Finer M, Nicolau A, Vale H, Villa L, Mamani N (2020) Amazon Fire Tracker 2020: Images of the Brazilian Amazon Fires. MAAP.

MAAP #122: Amazon Deforestation 2019

Table 1. Amazon 2019 primary forest loss for 2019 (red) compared to 2018 (orange). Data: Hansen/UMD/Google/USGS/NASA, MAAP.

Newly released data for 2019 reveals the loss of over 1.7 million hectares (4.3 million acres) of primary Amazon forest in our 5 country study area (Bolivia, Brazil, Colombia, Ecuador, and Peru).* That is twice the size of Yellowstone National Park.

Table 1 shows 2019 deforestation (red) in relation to 2018 (orange).

Primary forest loss in the Brazilian Amazon (1.29 million hectares) was over 3.5 times higher than the other four countries combined, with a slight increase in 2019 relative to 2018. Many of these areas were cleared in the first half of the year and then burned in August, generating international attention.

Primary forest loss rose sharply in the Bolivian Amazon (222,834 hectares), largely due to uncontrolled fires escaping into the dry forests of the southern Amazon.

Primary forest loss rose slightly in the Peruvian Amazon (161,625 hectares) despite a relatively successful crackdown on illegal gold mining, pointing to small-scale agriculture (and cattle) as the main driver.

On the positive side, primary forest loss decreased in the Colombian Amazon (91,400 hectares) following a major spike following the 2016 peace accords (between the government and FARC). It is worth noting, however, that we have now documented the loss of 444,000 hectares (over a million acres) of primary forest in the Colombian Amazon in the past four years since the peace agreement (see Annex).

*Two important points about the data. First, we use annual forest loss from the University of Maryland to have a consistent source across all five countries. Second, we applied a filter to only include loss of primary forest (see Methodology).

2019 Deforestation Hotspots Map

The Base Map below shows the major 2019 deforestation hotspots across the Amazon.

2019 deforestation hotspots across the Amazon. Data: Hansen/UMD/Google/USGS/NASA, MAAP.

Many of the major deforestation hotspots were in Brazil. Early in the year, in March, there were uncontrolled fires up north in the state of Roraima. Further south, along the Trans-Amazonian Highway, much of the deforestation occurred in the first half of the year, followed by the high profile fires starting in late July. Note that many of these fires were burning recently deforested areas, and were not uncontrolled forest fires (MAAP #113).

The Brazilian Amazon also experienced escalating gold mining deforestation in indigenous territories (MAAP #116).

Bolivia also had an intense 2019 fire season. Unlike Brazil, many were uncontrolled fires, particularly in the Beni grasslands and Chiquitano dry forests of the southern Bolivian Amazon (MAAP #108).

In Peru, although illegal gold mining deforestation decreased (MAAP #121), small-scale agriculture (including cattle) continues to be a major driver in the central Amazon (MAAP #112) and an emerging driver in the south.

In Colombia, there is an “arc of deforestation” in the northwestern Amazon. This arc includes four protected areas (Tinigua, Chiribiquete and Macarena National Parks, and Nukak National Reserve) and two Indigenous Reserves (Resguardos Indígenas Nukak-Maku and Llanos del Yari-Yaguara II) experiencing substantial deforestation (MAAP #120). One of the main deforestation drivers in the region is conversion to pasture for land grabbing or cattle ranching.

Annex – Colombia peace accord trend

Annex 1. Deforestation of primary forest in the Colombian Amazon, 2015-20. Data: Hansen/UMD/Google/USGS/NASA, UMD/GLAD. *Until May 2020

Methodology

The baseline forest loss data presented in this report were generated by the Global Land Analysis and Discovery (GLAD) laboratory at the University of Maryland (Hansen et al 2013) and presented by Global Forest Watch. Our study area is strictly what is highlighted in the Base Map.

For our estimate of primary forest loss, we used the annual “forest cover loss” data with density >30% of the “tree cover” from the year 2001. Then we intersected the forest cover loss data with the additional dataset “primary humid tropical forests” as of 2001 (Turubanova et al 2018). For more details on this part of the methodology, see the Technical Blog from Global Forest Watch (Goldman and Weisse 2019).

For boundaries, we used the biogeographical limit (as defined by RAISG) for all countries except Bolivia, where we used the Amazon watershed limit (see Base Map).

All data were processed under the geographical coordinate system WGS 1984. To calculate the areas in metric units, the projection was: Peru and Ecuador UTM 18 South, Bolivia UTM 20 South, Colombia MAGNA-Bogotá, and Brazil Eckert IV.

Lastly, to identify the deforestation hotspots, we conducted a kernel density estimate. This type of analysis calculates the magnitude per unit area of a particular phenomenon, in this case forest cover loss. We conducted this analysis using the Kernel Density tool from Spatial Analyst Tool Box of ArcGIS. We used the following parameters:

Search Radius: 15000 layer units (meters)
Kernel Density Function: Quartic kernel function
Cell Size in the map: 200 x 200 meters (4 hectares)
Everything else was left to the default setting.

For the Base Map, we used the following concentration percentages: Medium: 7%-10%; High: 11%-20%; Very High: >20%.

References

Goldman L, Weisse M (2019) Explicación de la Actualización de Datos de 2018 de Global Forest Watch. https://blog.globalforestwatch.org/data-and-research/blog-tecnico-explicacion-de-la-actualizacion-de-datos-de-2018-de-global-forest-watch

Hansen, M. C., P. V. Potapov, R. Moore, M. Hancher, S. A. Turubanova, A. Tyukavina, D. Thau, S. V. Stehman, S. J. Goetz, T. R. Loveland, A. Kommareddy, A. Egorov, L. Chini, C. O. Justice, and J. R. G. Townshend. 2013. “High-Resolution Global Maps of 21st-Century Forest Cover Change.” Science 342 (15 November): 850–53. Data available on-line from: http://earthenginepartners.appspot.com/science-2013-global-forest.

Turubanova S., Potapov P., Tyukavina, A., and Hansen M. (2018) Ongoing primary forest loss in Brazil, Democratic Republic of the Congo, and Indonesia. Environmental Research Letters  https://doi.org/10.1088/1748-9326/aacd1c 

Acknowledgements

We thank G. Palacios for helpful comments to earlier versions of this report.

This work was supported by the following major funders: Norwegian Agency for Development Cooperation (NORAD), Gordon and Betty Moore Foundation, International Conservation Fund of Canada (ICFC), Metabolic Studio, Erol Foundation, MacArthur Foundation, and Global Forest Watch Small Grants Fund (WRI).

Citation

Finer M, Mamani N (2020) 2019 Amazon Deforestation. MAAP: 122.

MAAP #116: Amazon Gold Mining, Part 2: Brazil

Base Map. Major gold mining deforestation zones across the Amazon. Data: MAAP.

We present the second part of our series on Amazon gold mining, with a focus on the Brazil*

Specifically, we focus on mining in indigenous territories in the Brazilian Amazon.

Extractive activities, such as gold mining, are constitutionally not permitted on indigenous lands, but the Bolsonaro administration is advancing a bill (PL 191) that would reverse this.

The Base Map indicates three Brazilian indigenous territories where we identified recent major gold mining deforestation:

  1. Munduruku (Pará)
  2. Kayapó (Pará)
  3. Yanomami (Roraima)

We documented the gold mining deforestation of 10,245 hectares (25,315 acres) across all three indigenous territories over the past three years (2017 – 2019). That is the equivalent of 14,000 soccer fields.

Below, see more detailed data, including a series of satellite GIFs of the recent gold mining deforestation in each territory.

*Part 1 looked at the Peruvian Amazon (see MAAP #115). For information on Suriname, see this report from Amazon Conservation Team. For all other countries see this resource from RAISG.


Graph 1. Gold mining deforestation in three indigenous territories in the Brazilian Amazon.

Mining Deforestation Increasing

In 2019, all three territories experienced an increase in gold mining deforestation.

In Munduruku Territory, we documented the loss of 3,456 hectares due to mining activity between 2017 and 2019. Note the major spike in 2019, where mining deforestation reached 2,000 hectares.

In Kayapó Territory, we documented the loss of 5,614 hectares between 2017 and 2019. Note that mining deforestation also reached 2,000 hectares in 2019.

In Yanomami Territory, we documented the loss of 1,174 hectares between 2017 and 2019. Note that mining deforestation reached 500 hectares in 2019.

Overall,  44% (4,500 hectares) of the gold mining deforestation occurred in 2019, indicating an increasing trend.

A. Munduruku (Pará)

The GIF below shows an example of gold mining deforestation in Munduruku Territory between 2017 and 2019.

Gold mining deforestation in Munduruku Territory between 2017 and 2019. Data: Planet, MAAP.

B. Kayapó (Pará)

The GIF below shows an example of gold mining deforestation in Kayapó Territory between 2017 and 2019.

Gold mining deforestation in Kayapó Territory between 2017 and 2019. Data: Planet, MAAP.

C. Yanomami (Roraima)

The GIF below shows an example of gold mining deforestation in Yanomami Territory between 2017 and 2019.

Gold mining deforestation in Yanomami Territory between 2017 and 2019. Data: Planet, MAAP.

Annex: Detailed Territory Maps

Below see detailed gold mining deforestation maps for all three Brazilian indigenous territories detailed in this report. Click each image to enlarge.

Gold mining deforestation in Munduruku Territory between 2017 and 2019. Data: MAAP. Click to enlarge.
Gold mining deforestation in Kayapó Territory between 2017 and 2019. Data: MAAP. Click to enlarge.
Gold mining deforestation in Yanomami Territory between 2017 and 2019. Data: MAAP. Click to enlarge.

Acknowledgements

We thank S. Novoa (ACCA), V. Guidotti de Faria (Imaflora), and G. Palacios for helpful comments to earlier versions of this report.

This work was supported by the following major funders: Global Forest Watch Small Grants Fund (WRI), Norwegian Agency for Development Cooperation (NORAD),  International Conservation Fund of Canada (ICFC), Metabolic Studio, and Erol Foundation.

Citation

Finer M, Mamani N (2020) Amazon Gold Mining, part 2: Brazil. MAAP: 116.

MAAP #115: Illegal Gold Mining in the Amazon, part 1: Peru

Base Map. The main illegal gold mining areas in the Peruvian Amazon. Data: MAAP.

In a new series, we highlight the main illegal gold mining frontiers in the Amazon.

Here, in part 1, we focus on Peru. In the upcoming part 2, we will look at Brazil.

The Base Map indicates our focus areas in Peru*:

  • Southern Peru (A. La Pampa, B. Alto Malinowski, C. Camanti, D. Pariamanu);
  • Central Peru (E. El Sira).

Notably, we found an important reduction in gold mining deforestation in La Pampa (Peru’s worst gold mining area) following the government’s launch of Operation Mercury in February 2019.

Illegal gold mining continues, however, in three other major areas of the southern Peruvian Amazon (Alto Malinowski, Camanti, and Pariamanu), where we estimate the mining deforestation of 5,300 acres (2,150 hectares) since 2017.

Of that total, 22% (1,162 acres) occurred in 2019, indicating that displaced miners from Operation Mercury have NOT caused a surge in these three areas.

Below, we show a series of satellite videos of the recent gold mining deforestation (2017-19) in each area.

*Recent press reports indicate the increase in illegal gold mining activity in northern Peru (Loreto region), along the Nanay and Napo Rivers, but we have not yet detected associated deforestation.

A. La Pampa (Southern Peru)

In MAAP #104, we reported a major reduction (92%) of gold mining deforestation in La Pampa during the first four months of Operation Mercury, a governmental mega-operation to confront the illegal mining crisis in this area.

The following video shows how gold mining deforestation has declined considerably since February 2019, the beginning of the operation. Note the rapid deforestation during the years 2016-18, followed by a sudden stop in 2019.

B. Alto Malinowski (Southern Peru)

The following video shows gold mining deforestation in a section of the upper Malinowski River (Madre de Dios region). We estimate the mining deforestation of 4,120 acres (1,668 hectares) throughout the Alto Malinowski area during the 2017 – 2019 period.

Of that total, 20% (865 acres) occurred in 2019, indicating that displaced miners from Operation Mercury have not caused a surge in this area adjacent to La Pampa.

According to our analysis of governmental information (see Annex 2), the recent mining activity is likely illegal because: a) much of it occurs outside of titled mining concessions, b) and all of it occurs outside of the mining corridor established for legal mining activity (see Annex 1).

Note that the mining deforestation is within the Kotsimba Indigenous Community territory. However, it has not penetrated Bahuaja Sonene National Park, in part due to the actions of the Peruvian Protected Areas Service (SERNANP).

C. Camanti (Southern Peru)

The following video shows the gold mining deforestation of 944 acres (382 hectares) in the Camanti district (Cusco region), during the 2017 – 2019 period.

Of that total, 21% (198 acres) occurred in 2019, indicating that there has been no increase in mining activity in this area since the beginning of Operation Mercury in February (in contrast to press reports that have suggested that many displaced miners have moved to this area).

According to governmental information (see Annex 2), this mining activity is likely illegal because: a) much of it occurs outside of titled mining concessions, b) all occurs outside of the mining corridor, and c) all occurs inside both a protected forest (Bosque Protector) and buffer zone of the Amarakaeri Communal Reserve.

SERNANP (Peruvian Protected Areas Service) informed us that in December 2019, as part of Operation Mercury, the Public Ministry (Ministerio Público) led an interdiction with the support of law enforcement. Machinery, mining camps, and mercury were destroyed or removed during the raid. In 2020, as part of an extension of Operation Mercury, the Environmental Prosecutor’s Office (FEMA) of the Public Ministry announced that the buffer zone of the Amarakaeri Communal Reserve will be constantly monitored.

D. Pariamanu (Southern Peru)

The following video shows gold mining activity along a section of the Pariamanu River (Madre de Dios region). We estimate the gold mining deforestation of 245 acres (99 hectares) in the Pariamanu area, during the 2017 – 2019 period.

Of that total, 40% (99 acres) occurred in 2019, indicating that there has been a slight increase in mining activity since the beginning of Operation Mercury in February. This finding suggests that displaced miners may be moving to this area.

According to governmental information (see Annex 2), this mining activity is likely illegal because it is not within active mining concessions and outside the mining corridor. Morevoer,  the mining deforestation is within Brazil nut forestry concessions.

E. El Sira (Central Peru)

The following video shows the gold mining deforestation of 52 acres (21 hectares) in the buffer zone of El Sira Communal Reserve (Huánuco region), during the 2017 – 2019 period.


Although the mining activity occurs in an active mining concession, a recent report indicates that it is illegal because it does not have the deforestation authorization.

Annex 1: Mining Corridor

The mining corridor is the area that the Peruvian Government has defined as potentially legal for mining activity in the Madre de Dios region via a formalization process. As of 2019, over 100 miners have been formalized in Madre de Dios.

In general, mining activity in the corridor is considered legal, either formaly (the formalization process is completed with environmental and operational permits approved) or informaly (in the process of formalization). Thus, mining activity within the corridor is not considered illegal since it is not a prohibited area.

The following two videos show examples of gold mining deforestation in the mining corridor during 2019.

Annex 2: Land Use Map

For greater context, we present a map of qualifying titles directly related to the mining sector, in southern Peru. Layers include the mining corridor (see above), mining concession status (titled, pending, revoked), indigenous territories, and protected areas.

Land use map for southern Peruvian Amazon mining areas. Data: GEOCATMIN/INGEMMET. Click to enlarge.

Acknowledgements

We thank E. Ortiz (AAF), A. Flórez (SERNANP), P. Rengifo (ACCA), A. Condor (ACCA), A. Folhadella (Amazon Conservation), and G. Palacios for helpful comments to earlier versions of this report.

This work was supported by the following major funders: NASA/USAID (SERVIR), Norwegian Agency for Development Cooperation (NORAD), Gordon and Betty Moore Foundation, International Conservation Fund of Canada (ICFC), Metabolic Studio, Erol Foundation, MacArthur Foundation, and Global Forest Watch Small Grants Fund (WRI).

Citation

Finer M, Mamani N (2020) Illegal Gold Mining Frontiers, part 1: Peru. MAAP: 115.

MAAP #114: Oil Drilling Pushes Deeper into Yasuni National Park

Base Map. Oil Exploitation in Yasuni National Park. Click to enlarge.

Yasuni National Park, located in the heart of the Ecuadorian Amazon, is one of the most biodiverse places in the world and forms part of the ancestral territory of the Waorani (see Base Map).

Under the ground of this vast area, however, are large oil fields.

In July 2019, the Waorani won an important legal victory to prevent oil activity in the western part of their territory (Block 22).

However, here we show the construction of new oil drilling platforms in the controversial ITT Block, in the northeast part of Yasuni National Park.

We calculated the deforestation of 57.3 hectares (141.6 acres) for drilling platforms and access roads within ITT and the adjacent Block 31.

In addition, incorporating edge effects caused by the deforestation, we estimate the impacted area is actually 655 hectares (1,619 acres), exceeding the limit of 300 hectares (741 acres) established in the public referendum of 2018.*


ITT Block

The ITT Block covers one of the most remote and intact parts of Yasuni National Park. In 2007, the Ecuadorian government launched a unique initiative to keep ITT’s oil underground in exchange for economic compensation from the international community (Yasuni-ITT Initiative).

In 2013, however, the Initiative failed and was abandoned. Indeed, the government is now actively advancing it’s ITT oil extraction plans.

Next, we present a video of satellite images showing the recent oil-related activity inside the ITT Block, within Yasuni National Park. It involves the construction of 4 drilling platforms (Tambococha A,B,D, E) and an access road, between 2017 and 2019. The associated deforestation is 28.5 hectares (70 acres).

Zona Intangible (Untouchable Zone)

There are plans for at least 3 more drilling platforms deeper into Yasuni National Park (see yellow circle in map below). These platforms would bring oil activity close to the buffer zone of an area known as the Zona Intangible, or Untouchable Zone.

The government established the Zona Intangible in 2007 as an area where extractive activities, including oil, are prohibited to protect the territory of the Waorani relatives in voluntary isolation (Tagaeri and Taromenane).

Planned oil platforms (yellow circle) near the buffer zone of the Zona Intangible. Click to enlarge.

*Notes

Edge effects are the impacts that extend into the surrounding forest from the edge of deforestation. These impacts include changes in forest structure and microclimate, higher tree mortality, and increased susceptibility to fire. Based on Broadbent et al (2008), we incorporated an edge effect of 100 meters, which represents the median distance of edge effects recorded in 62 scientific studies. This is a conservative estimate given that an edge effect of 300-2000 meters could be also be justified according to the data.

In MAAP #82, we documented the oil-related deforestation of more than 400 hectares (990 acres) throughout all of Yasuni National Park.

Referenes

Bass M, Finer M, Jenkins C et al (2010) Global Conservation Significance of Ecuador’s Yasuní National Park. PLOS ONE. Link: https://journals.plos.org/plosone/article?id=10.1371/journal.pone.0008767

Finer M et al (2009) Ecuador’s Yasuní Biosphere Reserve: a brief modern history and conservation challenges. ERL. Link: https://iopscience.iop.org/article/10.1088/1748-9326/4/3/034005/fulltext/

Broadbent EB, Asner GP et al (2008) Forest fragmentation and edge effects from deforestation
and selective logging in the Brazilian Amazon. Bio Cons 141:1745–1757.

Acknowledgements

We thank A. Puyol (EcoCiencia), M. Bayon (Colectivo de Geografía Crítica del Ecuador), E. Martínez,  and G. Palacios for helpful comments to earlier versions of this report.

This work was supported by the following major funders: Norwegian Agency for Development Cooperation (NORAD), MacArthur Foundation, International Conservation Fund of Canada (ICFC), Metabolic Studio, and Global Forest Watch Small Grants Fund (WRI).

Citation

Finer M, Thieme A, Hettler B (2019) Oil Drilling Pushes Deeper into Yasuni National Park (Ecuador). MAAP: 114.

MAAP #108: Understanding the Amazon Fires with Satellites, part 2

Base Map. Updated Amazon fire hotspots map, August 20-26, 2019. Red, Orange, and Yellow indicate the highest concentrations of fire, as detected by NASA satellites that detect fires at 375 meter resolution. Data. VIIRS/NASA, MAAP.

Here we present an updated analysis on the Amazon fires, as part of our ongoing coverage and building off what we reported in MAAP #107.

First, we show an updated Base Map of the “fire hotspots” across the Amazon, based on very recent fire alerts (August 20-26). Hotspots (shown in red, orange, and yellow) indicate the highest concentrations of fire as detected by NASA satellites.

Our key findings include:

– The major fires do NOT appear to be in the northern and central Brazilian Amazon characterized by tall moist forest (Rondônia, Acre, Amazonas, Pará states),* but in the drier southern Amazon of Brazil and Bolivia characterized by dry forest and shrubland (Mato Grosso and Santa Cruz).

– The most intense fires are actually to the south of the Amazon, along the border of Bolivia and Paraguay, in areas characterized by drier ecosystems.

– Most of the fires in the Brazilian Amazon appear to be associated with agricultural lands. Fires at the agriculture-forest boundary may be expanding plantations or escaping into forest, including indigenous territories and protected areas.

– The large number of agriculture-related fires in Brazil highlights a critical point: much of the eastern Amazon has been transformed into a massive agricultural landscape over the past several decades. The fires are a lagging indicator of massive previous deforestation.

– We continue to warn against using satellite-based fire detection data alone as a measure of impact to Amazonian forests. Many of the detected fires are in agricultural areas that were once forest, but don’t currently represent forest fires.

In conclusion, the classic image of wildfires scorching everything in their path are currently more accurate for the unique and biodiverse dry forests of the southern Amazon then the moist forests to the north. However, the numerous fires at the agriculture-moist forest boundary are both a threat and stark reminder of how much forest has been, and continues to be, lost by deforestation.

Next, we show a series of 11 satellite images that show what the fires look like in major hotspots and how they are impacting Amazonian forests. The location of each image corresponds to the letters (A-K) on the Base Map.

*If anyone has detailed information to the contrary, please send spatial coordinates to maap@amazonconservation.org

Zooms A, B: Chiquitano Dry Forest (Bolivia)

Some of the most intense fires are concentrated in the dry Chiquitano of southern Bolivia. The Chiquitano is part of the largest tropical dry forest in the world and is a unique, high biodiversity, and poorly explored Amazonian ecosystem. Zooms A-C illustrate fires in the Chiquitano between August 18-21 of this year, likely burning a mixture of dry forest, scrubland, and grassland.

Zoom A. Recent fires in the dry Chiquitano of southern Bolivia. Data: Planet.
Zoom B. Recent fires in the dry Chiquitano of southern Bolivia. Data: Planet.

Zoom D: Beni Grasslands (Bolivia)

Zoom D shows recent fires and burned areas in Bolivia’s Beni grasslands.

Zoom D. Recent fires and burned areas in Bolivia’s Beni grasslands. Data: ESA.

Zooms E,F,G,H: Brazilian Amazon (Amazonas, Rondônia, Pará, Mato Grosso)

Zoom E-H take us to moist forest forests of the Brazilian Amazon, where much of the media and social media attention has been focused. All fires we have seen in this area are in agricultural fields or at the agriculture-forest boundary. Note Zoom E is just outside a national park in Amazonas state; Zoom F shows fires at the agriculture-forest boundary in Rondônia state; Zoom G shows fires at the agriculture-forest boundary within a protected area in Pará state; and Zoom H shows fires at the agriculture-forest boundary in Mato Grosso state.

Zoom E. Fires at the agriculture-forest boundary outside a national park in Amazonas state. Data: Planet.
Zoom F. Fires at the agriculture-forest boundary in Rondônia state. Data: ESA.
Zoom G. Fires at the agriculture-forest boundary within a protected area in Pará state.
Zoom H. Fires at the agriculture-forest boundary in Mato Grosso. Data: ESA.

Zooms I, J: Southern Mato Grosso (Brazil)

Zooms I and J shows fires in grassland/scrubland at the drier southern edge of the Amazon Basin. Note both of these fires are within Indigenous Territories.

Zoom I. Fires within an Indigenous Territory at the drier southern edge of the Amazon Basin. Data: Planet.
Zoom J. Fires within an Indigenous Territory at the drier southern edge of the Amazon Basin. Data: Planet.

Zooms C, K: Bolivia/Brazil/Paraguay Border

Zooms C and K show large fires burning in the drier ecosytems at the Bolivia-Brazil-Paraguay border. This area is outside the Amazon Basin, but we include it due it’s magnitude.

Zoom C. Recent fires in the dry Chiquitano of southern Bolivia. Data: Planet.
Zoom K. Large fires burning around the Gran Chaco Biosphere Reserve. Data: NASA/USGS.

Acknowledgements

We thank  J. Beavers (ACA), A. Folhadella (ACA), M. Silman (WFU), S. Novoa (ACCA), M. Terán (ACEAA), and D. Larrea (ACEAA) for helpful comments to earlier versions of this report.

This work was supported by the following major funders: MacArthur Foundation, International Conservation Fund of Canada (ICFC), Metabolic Studio, and Global Forest Watch Small Grants Fund (WRI).

Citation

Finer M, Mamani N (2019) Seeing the Amazon Fires with Satellites. MAAP: 108.

MAAP #102: Saving the Ecuadorian Chocó

Chocó endemic, Long-wattled Umbrellabird. ©Stephen Davies

The Ecuadorian Chocó, located on the other (western) side of the Andes Mountains from its Amazonian neighbor, is renowned for its high levels of endemic species (those that live nowhere else on Earth).

It is part of the “Tumbes-Chocó-Magdalena” Biodiversity Hotspot, home to numerous endemic plants, mammals, and birds (1,2), such as the Long-wattled Umbrellabird.

It is also one of the most threatened tropical forests in the world (1).

Here, we conduct a deforestation analysis for the northern Ecuadorian Chocó (see Base Map below) to better understand the current conservation scenario. Importantly, we compare the original forest extent (left panel) to the actual forest cover (right panel).

We document the loss of over 60% (1.8 million hectares) of low, mid, and upper elevation forest (compare the three tones of green between panels).

See our other Key Results below.


Base Map

Base Map. Ecuadorian Chocó, original forest extent (left panel) vs. actual forest cover (right panel). Data: MAE, Hansen/UMD/Google/USGS/NASA
Key Results, Ecuadorian Chocó. Data: MAAP, MAE, Hansen/UMD/Google/USGS/NASA

Key Results

Our key results include:*

  • 61% forest loss (1.8 million hectares) across all three elevations.
    • 68% loss (1.2 million ha) of lowland rainforest,
    • 50% loss (611,200 ha) of mid and upper elevation forests.
      .
  • 20% of the forest loss (365,000 ha) occurred after 2000.
    • 4,650 ha lost during most recent 2017-18 period (mostly in lowlands).
  • 39% total forest remaining (1.17 million ha) across all three elevations.
    • Just 32% (569,000 ha) lowland rainforest remaining.
  • 99% of Cotacachi-Cayapas Ecological Reserve remaining.
  • 61% of Mache-Chindul Ecological Reserve remaining.

*Forest loss data corresponds to the study area indicated in the Base Map. Data sources: pre-2017 from Ecuadorian Environment Ministry; 2017-18 from University of Maryland (Hansen 2013). Elevation definitions: Lowland forest <400 meters (dark green), mid-elevation forest 400-1000 m (olive green), and upper elevation forest >1000 m (bright green).


High Resolution Zooms

In the Base Map, we indicate two areas (insets A and B) where we zoom in with high-resolution satellite imagery to see what recent deforestation looks like in the region.

Zoom A shows the deforestation of 380 hectares directly to the north of an oil palm plantation, possibly for an expansion.

Zoom B shows the deforestation of 50 hectares with the Chachi Indigenous Reserve.

Zoom A. Data: Planet, ESA, MAAP.
Zoom B. Data: Planet, MAAP.
Chocó Conservation Opportunity. Data: Jocotoco Foundation, MAE, Hansen/UMD/Google/USGS/NASA.

Conservation Opportunity

Efforts are underway to protect a critical stretch of low to mid elevation Chocó forest to the west of Cotacachi-Cayapas Ecological Reserve.

It involves the unique opportunity to acquire over 22,000 hectares of forest that would help safeguard connectivity between public and private conservation and indigenous areas. Connecting these areas provides the only opportunity to protect the entire altitudinal gradient from 100-4900 m on the western slope of the tropical Andes. It will also establish an effective buffer zone for governmental reserves and reduce the socio-economic vulnerability of local communities.

To support this effort, please contact the Jocotoco Foundation (Martin.Schaefer@jocotoco.org) or the International Conservation Fund of Canada (carlos@ICFCanada.org).


References

1) Critical Ecosystem Partnership Fund (2005) Ecosystem Profile: Tumbes-Chocó-Magdalena. Link: https://www.cepf.net/our-work/biodiversity-hotspots/tumbes-choco-magdalena

2) Mittermeier RA et al (2011) Global Biodiversity Conservation: The Critical Role of Hotspots. Biodiversity Hotspots, 3-22.

Acknowledgements

We thank M. Schaefer (Jocotoco), C. Garcia (ICFC), D. Pogliani (ACCA), S. Novoa (ACCA), R. Catpo (ACCA), H. Balbuena (ACCA) y T. Souto (ACA) for helpful comments on earlier versions of this report.

Citation

Finer M, Mamani N (2019) Saving the Ecuadorian Chocó. MAAP: 102.

MAAP #93: Shrinking Primary Forests of the Peruvian Amazon

Base Map. Data: SERNANP, IBC, Hansen/UMD/Google/USGS/NASA, PNCB/MINAM, GLCF/UMD, ANA.

The primary forests of the Peruvian Amazon, the second largest stretch of the Amazon after Brazil, are steadily shrinking due to deforestation.

Here, we analyze both historic and current data to identify the patterns.

The good news: As the Base Map shows, the Peruvian Amazon is still home to extensive primary forest.* We estimate the current extent of Peruvian Amazon primary forest to be 67 million hectares (165 million acres), greater than the total area of France.

Importantly, we found that 48% of the current primary forests (32.2 million hectares) are located in officially recognized protected areas and indigenous territories (see Annex).**

The bad news: The Peruvian Amazon primary forests are steadily shrinking.

We estimate the original extent of primary forests to be 73.1 million hectares (180.6 million acres). Thus, there has been a historic loss of 6.1 million hectares (15 million acres), or 8% of the original. A third of the historic loss (2 million hectares) has occurred since 2001.

Below, we show three zooms (in GIF format) of the expanding deforestation, and shrinking primary forests, in the southern, central, and northern Peruvian Amazon.


GIF of deforestation in the southern Peruvian Amazon. Data: see Base Map

Southern Peruvian Amazon

Note these three important trends in the GIF (click to enlarge):

  • Increasing deforestation all along the route of the Interoceanic Highway;
  • Increasing gold mining deforestation across several different fronts near the southwestern section of the highway;
  • Increasing agricultural deforestation around Iberia, along the northern section of the highway near the border with Brazil.


GIF of deforestation in the central Peruvian Amazon. Data: see Base Map

Central Peruvian Amazon

Note these three important trends in the GIF (click to enlarge):

  • The substantial historic (pre 1990) deforestation around the cities Pucallpa and Tarapoto;
  • Increasing deforestation along the road leading west from Pucallpa;
  • Large-scale deforestation for oil palm plantations outside of Pucallpa and Yurimaguas.


Base Map plus protected areas and indigenous communities.

Northern Peruvian Amazon

Note these three important trends in the GIF (click to enlarge):

  • The historic (pre 1990) deforestation around Iquitos;
  • Increasing deforestation along the Iquitos-Nauta road;
  • Large-scale deforestation for United Cacao plantation near the town of Tamshiyacu.


Base Map plus protected areas and indigenous communities. Data: SERNANP, IBC, Hansen/UMD/Google/USGS/NASA, PNCB/MINAM, GLCF/UMD, RAISG, Ministerio de Cultura.

Annex

The Base Map with three additional categories: Protected Areas, titled Native Communities, and Indigenous Reserves.


Notes

*Defining primary forest: According to the Supreme Decree (No. 018-2015-MINAGRI) approving the Regulations for Forest Management under the framework of the new 2011 Forestry Act (No. 29763), the official definition of primary forest in Peru is: “Forest with original vegetation characterized by an abundance of mature trees with species of superior or dominant canopy, which has evolved naturally.” Using methods of remote sensing, our interpretation of that definition are areas that from the earliest available image are characterized by dense closed-canopy coverage and experienced no major clearing events.

It should be emphasized that our definition of primary forest does not mean that the area is pristine. These primary forests may have been degraded by selective logging and hunting.

**Historical Peruvian Amazon primary forests: 73,188,344 hectares. Current Peruvian Amazon primary forests: 67,043,378 hectares. Of this total, 27.6% are located in designated protected areas (18.5 million hectares), 18% in titled Native Communities (12 million hectares), and 4% in Indigenous Reserves/ Territories designated for indigenous peoples in voluntary isolation (2.9 million hectares). There is some overlap between these three categories, and the final combined percentage (48%) takes this into account.

Metodology

To generate the estimate of original (historical) expanse of primary forests in the Peruvian Amazon, we combined two satellite-based data sources. First, we used data from the Global Land Cover Facility (GLCF 2014), which established a forest cover baseline as of 1990 (The GLCF products are based on the Landsat Global Land Survey collection, which were compiled for years circa 1975, 1990, 2000 and 2005). Areas with no data due to shadows and clouds were filled in with GLCF data covering 2000-2005 time frame. The historical primary forest layer was created by combining the following three GLCF data layers: “Persistent Forest,” “Forest Gain,” and “Forest Loss.” Next, we incorporated the “Hydrography” data layer generated by the Peruvian Environment Ministry (Programa Nacional de Conservación de Bosques) to avoid including water bodies. We defined the limit of the analysis as the hydrographical basin of the Amazon. We generally define “historical Peruvian Amazon primary forest” as the expanse of primary forests before the European colonization of Peru (around 1750).

To generate the estimate of current primary forests, we subtracted areas determined to experience deforestation or forest loss from 1990 to 2017. For data covering 1990-2000, we incorporated two datasets: GLCF forest loss 1990-2000 and “No Forest as of 2000” (“No Bosque al 2000”) generated by the Peruvian Environment Ministry. For data covering 2001-2016, we used annual data generated by the Peruvian Environment Ministry. Finally, for 2017, we used early warning alert data generated by the Peruvian Environment Ministry. As a result, we define current primary forests as an area of historical forest with no observable (30 meter resolution) forest loss from 1990 to 2017.

Global Land Cover Facility (GLCF) and Goddard Space Flight Center (GSFC). 2014. GLCF Forest Cover Change 2000 2005, Global Land Cover Facility,University of Maryland, College Park.

Citation:

Finer M, Mamani N (2018) Shrinking Primary Forests of the Peruvian Amazon. MAAP: 93.

MAAP #83: Climate Change Defense: Amazon Protected Areas and Indigenous Lands

Base Map. Data: Asner et al 2014, MINAM/PNCB, SERNANP, IBC

Tropical forests, especially the Amazon, sequester huge amounts of carbon, one of the main greenhouse gases driving climate change.

Here, we show the importance of protected areas and indigenous lands to safeguard these carbon stocks.

In MAAP #81, we estimated the loss of 59 million metric tons of carbon in the Peruvian Amazon during the last five years (2013-17) due to forest loss, especially deforestation from mining and agricultural activities.

This finding reveals that forest loss represents nearly half (47%) of Peru’s annual carbon emissions, including from burning fossil fuels.1,2

In contrast, here we show that protected areas and indigenous lands have safeguarded 3.17 billion metric tons of carbon, as of 2017.3,4

The Base Map (on the right) shows, in shades of green, the current carbon densities in relation to these areas.

The breakdown of results are:
1.85 billion tons safeguarded in the Peruvian national protected areas system;
1.15 billion tons safeguarded in titled native community lands; and
309.7 million tons safeguarded in Territorial Reserves for indigenous peoples in voluntary isolation.

The total safeguarded carbon (3.17 billion metric tons) is the equivalent to 2.5 years of carbon emissions from the United States.5

Below, we show several examples of how protected areas and indigenous lands are safeguarding carbon reservoirs in important areas, indicated by insets A-E.

A. Yaguas National Park

The following Image A shows how three protected areas, including the new Yaguas National Park, are effectively safeguarding 202 million metric tons of carbon in the northeastern Peruvian Amazon. This area is home to some of the highest carbon densities in the country.

Image 83a. Yaguas. Data: Asner et al 2014, MINAM/PNCB, SERNANP

B. Manu National Park, Amarakaeri Communal Reserve, CC Los Amigos

The following Image B shows how Los Amigos, the world’s first conservation concession, is effectively safeguarding 15 million metric tons of carbon in the southern Peruvian Amazon. Two surrounding protected areas, Manu National Park and Amarakaeri Communal Reserve, safeguard an additional 194 million metric tons. This area is home to some of the highest carbon densities in the country.

Image 83b. Los Amigos-Manu-Amarakaeri. Data: Asner et al 2014, MINAM/PNCB, SERNANP, ACCA

C. Tambopata National Reserve, Bahuaja Sonene National Park

The following Image C shows how two important natural protected areas, Tambopata National Reserve and Bahuaja Sonene National Park, are helping conserve carbon stocks in an area with intense illegal gold mining activity.

D. Sierra del Divisor National Park, National Reserve Matsés

Image 83d. Data: Asner et al 2014, MINAM/PNCB, SERNANP

The following Image D shows how four protected areas, including the new Sierra del Divisor National Park, and adjacent National Reserve Matsés are effectively safeguarding 270 million metric tons of carbon in the eastern Peruvian Amazon.

This area is home to some of the highest carbon densities in the country.

E. Murunahua Indigenous Reserve

The following Image E shows the carbon protected in the Murunahua Indigenous Reserve (for indigenous peoples in voluntary isolation) and the surrounding titled native communities.

Imagen 83e. Datos: Asner et al 2014, MINAM/PNCB, SERNANP

References

1  UNFCCC. Emissions Summary for Peru. http://di.unfccc.int/ghg_profile_non_annex1

2  No incluye las emisiones por la degradación de bosques

Asner GP et al (2014). The High-Resolution Carbon Geography of Perú. Carnegie Institution for Science. ftp://dge.stanford.edu/pub/asner/carbonreport/CarnegiePeruCarbonReport-English.pdf

Sistema de Áreas Naturales Protegidas del Perú, que incluye áreas de administración nacional, regional, y privado. Datos de las tierras indígenas son de Instituto de Bien Común. Datos de pérdida forestal son de la Programa Nacional de Conservación de Bosques para la Mitigación del Cambio Climático (MINAM/PNCB).

UNFCCC. Emissions Summary for United States. http://di.unfccc.int/ghg_profile_annex1

Citation

Finer M, Mamani N (2017). Climate Change Defense: Amazon Protected Areas and Indigenous Lands. MAAP: 83.

Acknowledgments

This report was made possible by the generous support of the Norwegian Agency for Development Cooperation (NORAD).

Image #6: Expanding Gold Mining Deforestation Enters Amarakaeri Communal Reserve (Madre de Dios, Peru)

Recall that in Image of the Week #1 and Image of the Week #5 we documented how gold mining deforestation continues to expand within the Department of Madre de Dios, Peru (in the areas known as La Pampa and Upper Malinowski, respectively). Here, Image of the Week #6 documents how expanding deforestation from the mining zone known as Huepetuhe/Delta-1 is now entering the Amarakaeri Communal Reserve, an important Peruvian protected area that is co-managed by indigenous communities and Peru’s National Protected Areas Service (known as SERNANP).

Our analysis shows that gold mining deforestation, expanding from Huepetuhe/Delta-1, entered the southeast corner of the reserve in 2013 and expanded in 2014 and 2015. We also show that gold mining deforestation is spreading within the reserve’s south-eastern buffer zone.

2015_MDD_Amarakaeri_MAAP_6a_v8
Image of the Week 6a. Deforestation detected within and around the Amarakaeri Communal Reserve and its buffer zone. Zoom Area #1 indicates focal area in Images 6b and 6c, while Zoom Area #2 indicates focal area in Image 6d. Key data sources: MINAM, SERNANP, ACCA, USGS, IBC, Hansen/UMD/Google/USGS/NASA.

Key Findings:

According to our CLASlite analysis, deforestation entered the southeast corner of the Amarakaeri Communal Reserve in 2013 and expanded in 2014 and 2015 (see Zoom #1 below). Additional analysis revealed that the driver of this deforestation was gold mining due to the pattern and appearance of the forest loss.

We also detected increasing gold mining deforestation within the reserve’s south-eastern buffer zone between 2014 and 2015 (see Zoom #2 below). See below for more details.

We also detected a small amount of deforestation in 2014 from Hunt Oil’s drilling of Pad A within the reserve (see “B” in Image 6a). Note that overall deforestation from this gas exploration project has been very low because the company did not build an access road.

Gold Mining Deforestation Enters the Reserve (Zoom Area #1)

2015_MDD_Amarakaeri_MAAP_6b_v7 (1)
Image 6b. Zoom Area #1 provides an enhanced view of the deforestation within the southeast section of Amarakaeri Communal Reserve and its surrounding buffer zone. Key data sources: MINAM, SERNANP, ACCA, Hansen/UMD/Google/USGS/NASA, USGS.


Image 6b is a zoom view of the deforestation within the southeast section of Amarakaeri Communal Reserve and its surrounding buffer zone (see Zoom Area #1 in Image 6a for context).

Here, one can more clearly see how the gold mining deforestation entered the southeast corner of the reserve in 2013 and expanded in 2014 and 2015.

Total gold mining deforestation within this section of the Reserve is currently 11 hectares. Although this is currently only 1% of the Reserve’s total area, it represents a growing trend that may worsen.

Note that all of the rest of the deforestation in the image is within the reserve’s surrounding buffer zone.


Satellite Image Time-series of Deforestation Entering the Reserve (Zoom Area #1)

2015_MDD_Amarakaeri_MAAP_6c_v4
Image 6c. Satellite (Landsat 8) image time-series (2013 – 2015) of deforestation within the southeast section of the Amarakaeri Communal Reserve. Note that all four panels show the same location over time. Key data sources: USGS, SERNANP.

To better understand the deforestation dynamics over time within the southeast corner of the Amarakaeri Communal Reserve, we created a satellite (Landsat 8) image time-series. As seen in Image 6c, gold mining deforestation within the reserve is first seen in July 2013, and then slowly expands on several fronts until February 2015, the last good Landsat image for the area. Note that all four panels show the same location. Also note that all area in each panel outside the reserve is within its official buffer zone.

Gold Mining Deforestation Encroaching Upon Another Part of the Reserve (Zoom Area #2)

2015_MDD_Amarakaeri_MAAP_6e_v8
Image 6d. Zoom view of the deforestation within the south-eastern buffer zone of the Amarakaeri Communal Reserve. Left panel shows deforestation results data and right panel shows high resolution SPOT 7 imagery for the area in white dashed lines. Key data sources: MINAM, SERNANP, ACCA, Hansen/UMD/Google/USGS/NASA, USGS, and SPOT 7 from Airbus.

Image 6d shows how gold mining deforestation is encroaching on another part of the south-eastern section of the reserve (see Zoom Area #2 in Image 6a for context). As seen in the left panel, the deforestation within the buffer zone began expanding most notably in 2014 and 2015.

To confirm the driver of the deforestation, we acquired high resolution satellite imagery (SPOT 7 with 1.5 m resolution). As seen in the right panel of Image 6d, the pattern of the recent deforestation is characteristic of gold mining, and not other possible drivers such as agriculture.

Data Description:

Background map is a mosaic of two Landsat 8 images (30 m resolution) from April 10, 2014 and August 30, 2013. Any variation of green indicates forest cover. Note there is some scattered cloud cover. Data is from USGS.

Protected areas data is from SERNANP. Dark green indicates an established Peruvian national protected area or conservation concession and yellow-green indicates an official protected area buffer zone.

Black indicates areas that were deforested as of 2000 according to data from the Peruvian Environment Ministry (MINAM 2009). Yellow, orange, and red indicate areas that were deforested from 2000 to 2012 (each color covers a four year period) (Hansen MC et al. 2013 Science 342: 850–53; Data download).

Purple, pink, and teal indicate areas that were deforested between January 2013 and February 2015 based on our analysis of Landsat imagery using CLASlite forest monitoring software.

Citation

Finer M, Novoa S (2015) Gold Mining Deforestation Enters Amarakaeri Communal Reserve (Madre de Dios, Peru). MAAP: Image #6. Link: https://www.maapprogram.org/2015/08/image-of-the-week-6-gold-mining-deforestation-enters-amarakaeri-communal-reserve/