Following the intense Amazon fire seasons of both 2019 and 2020, we are closely tracking 2021 with our unique real-time Amazon fire monitoring app.*
We have documented 246 major fires across the Amazon thus far this year, as of August 1 (see Base Map below).
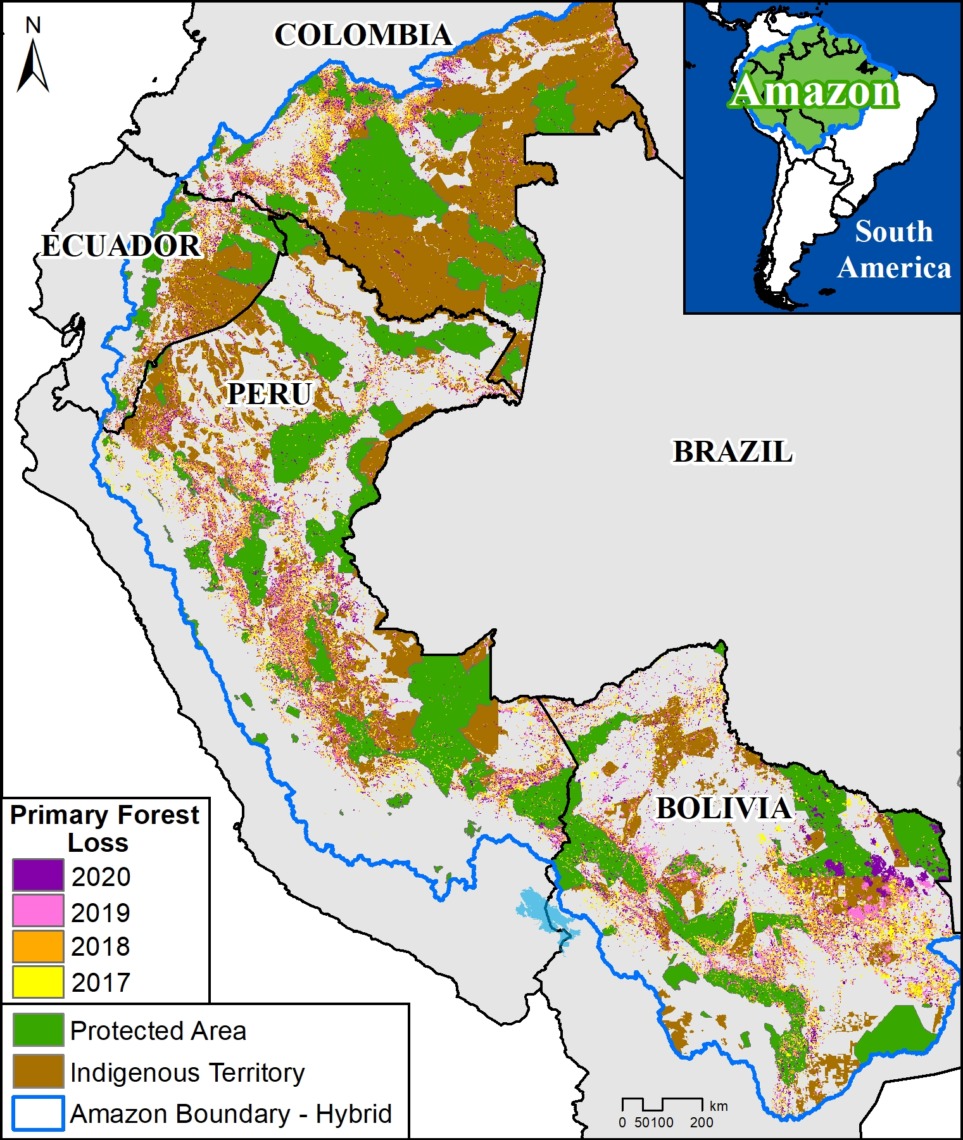
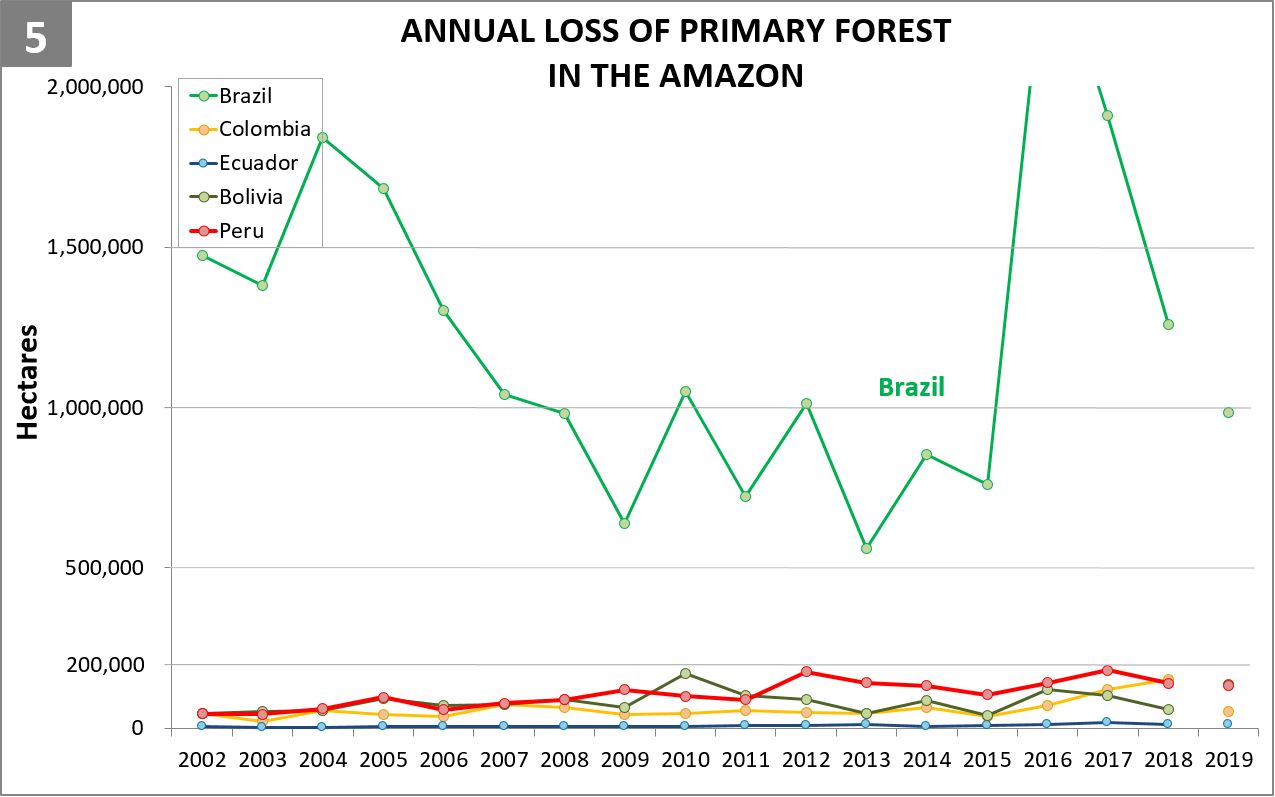
The vast majority have been in the Brazilian Amazon (75%), followed by Bolivia, Peru, and Colombia.
Our key findings include:
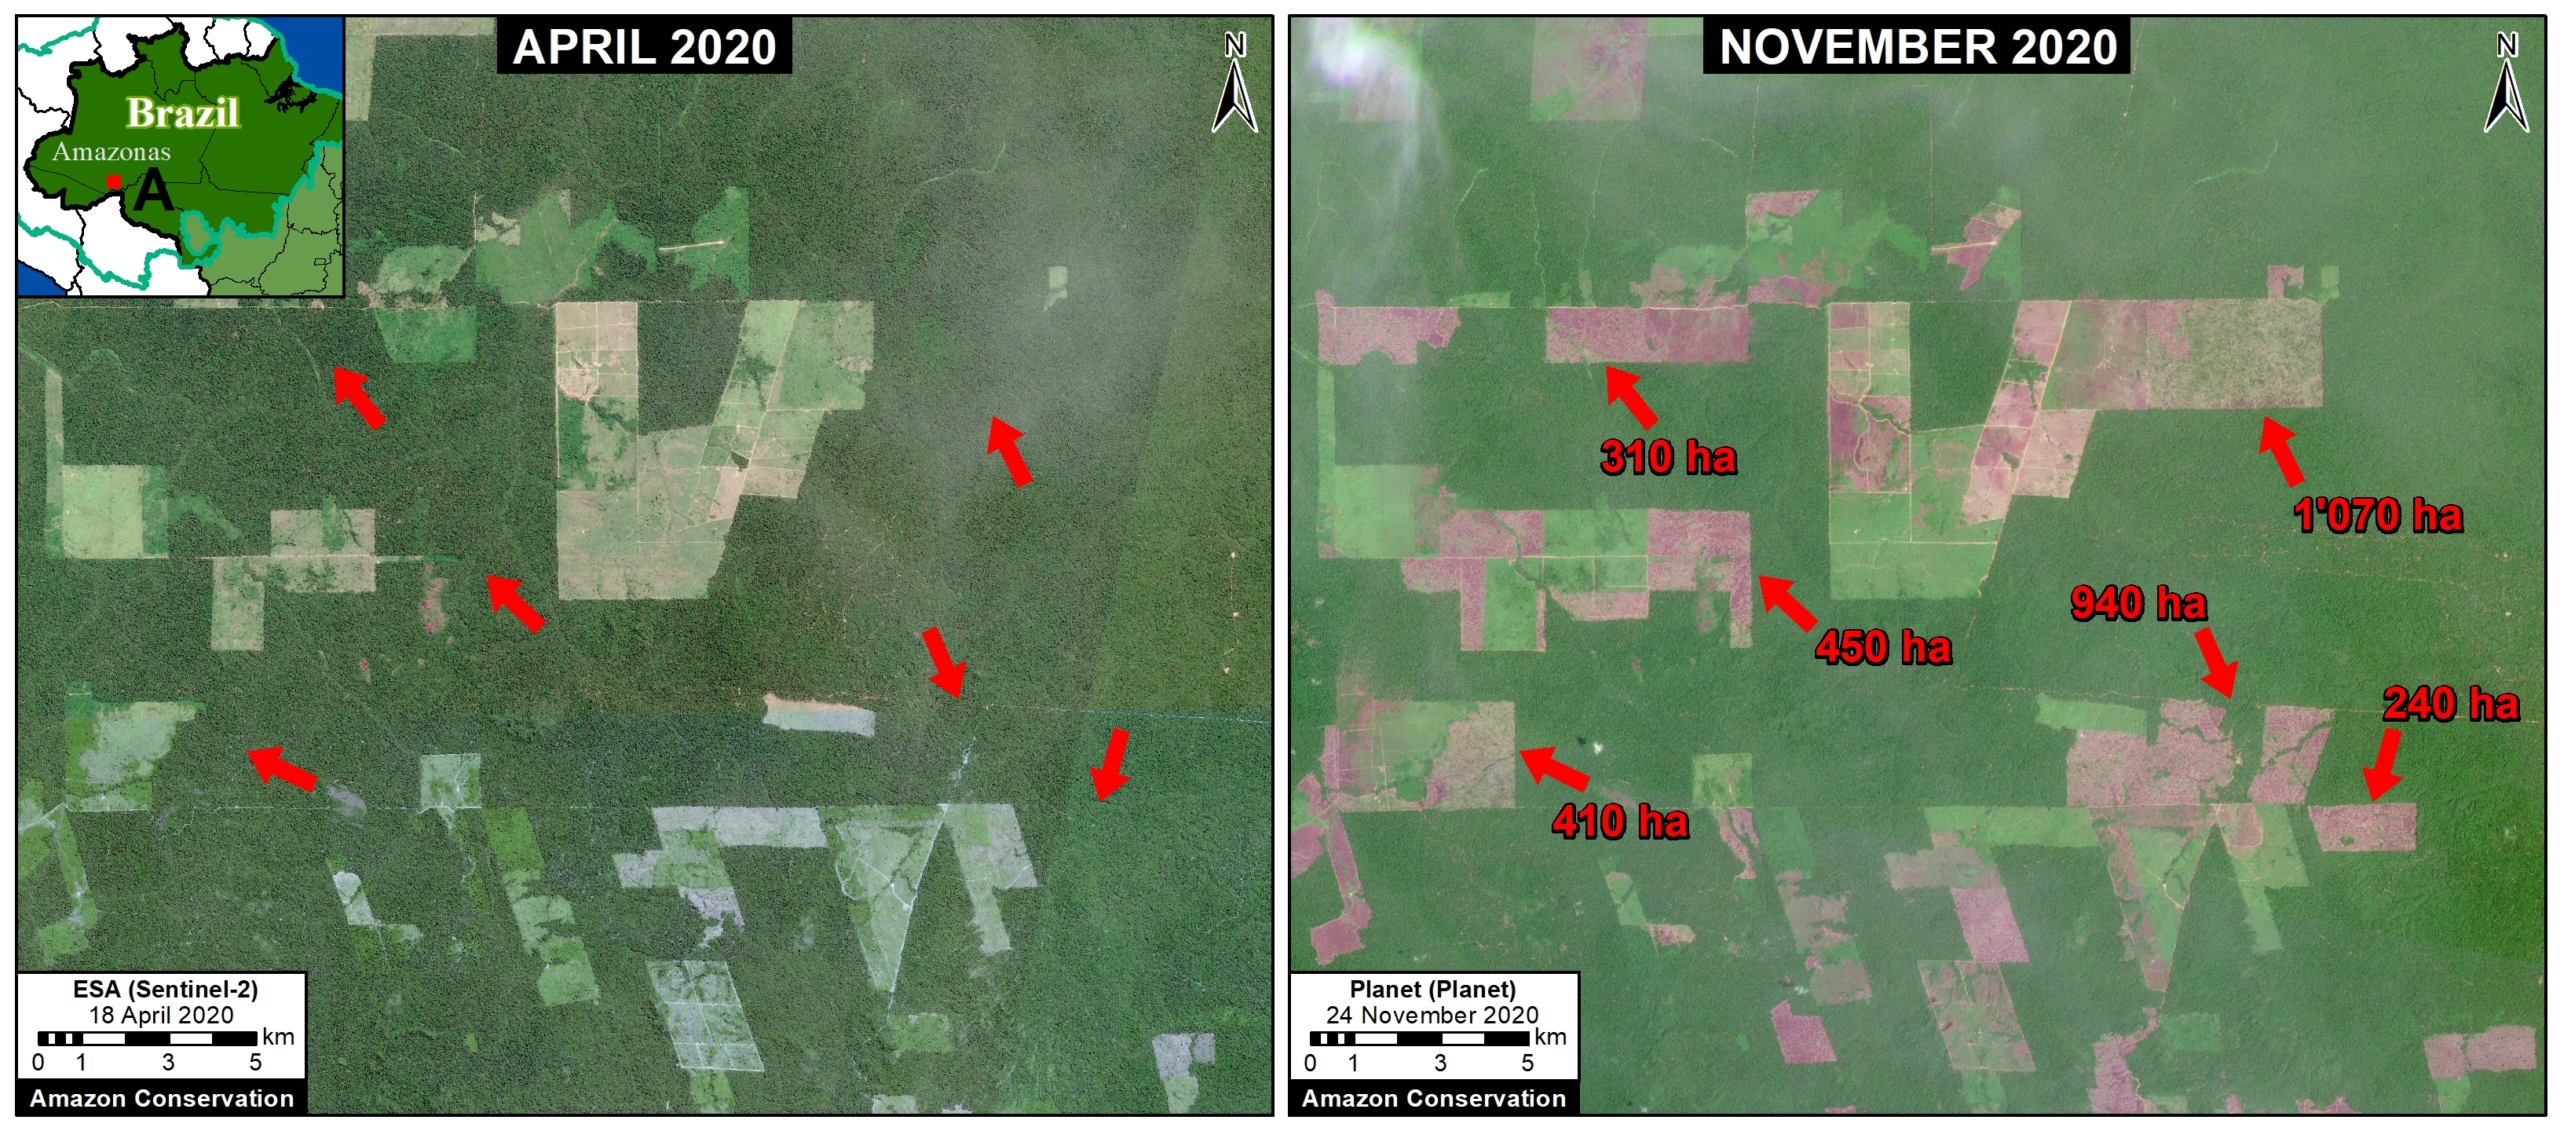
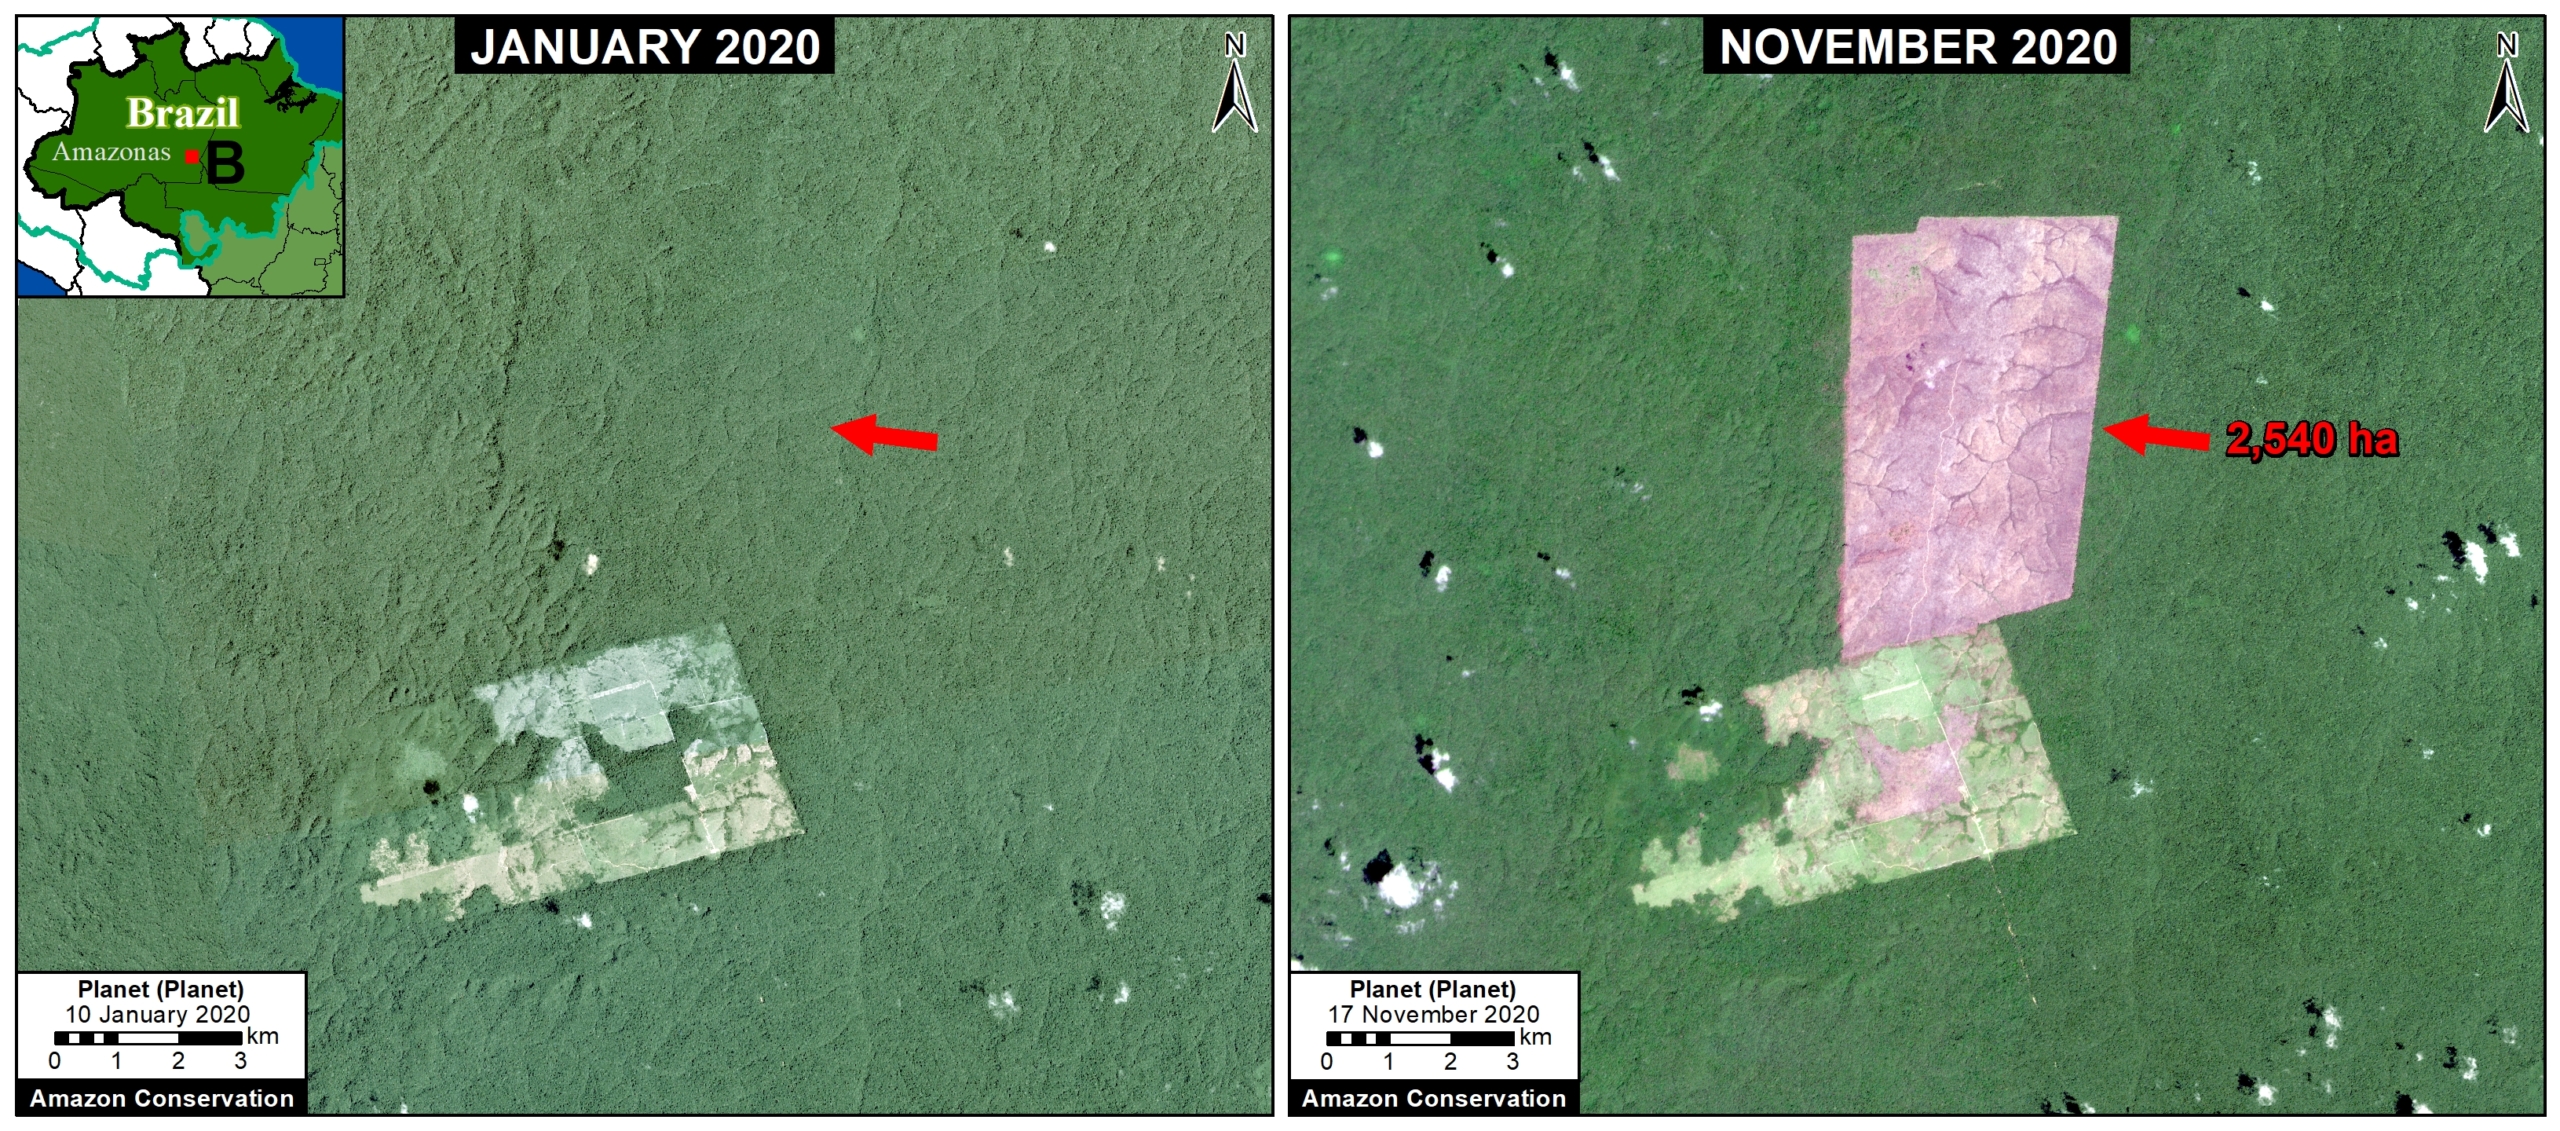
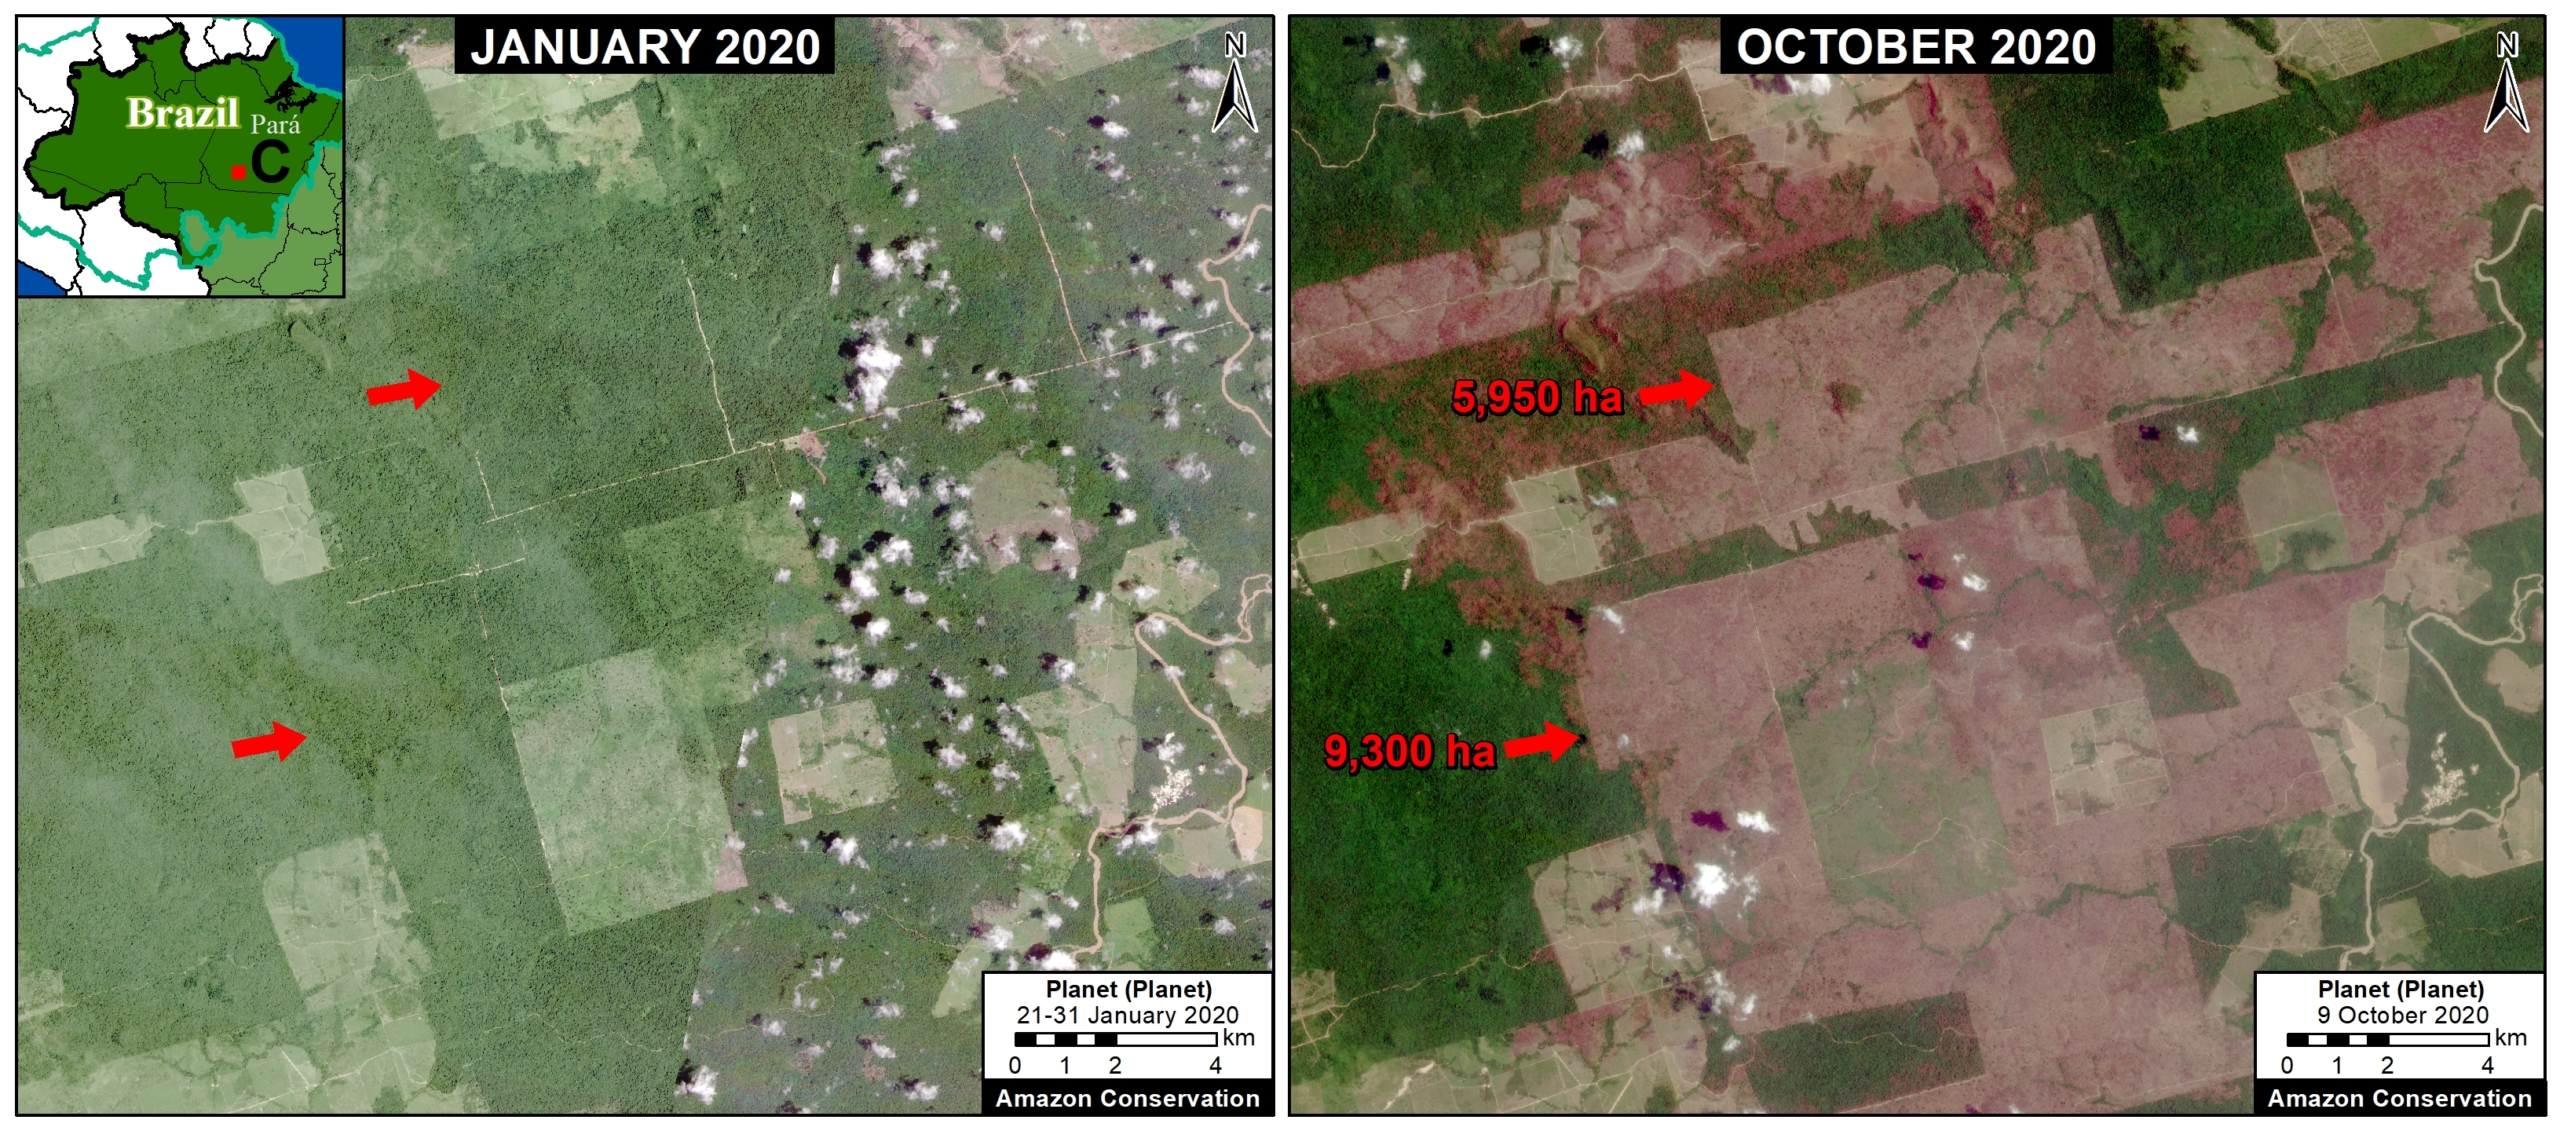
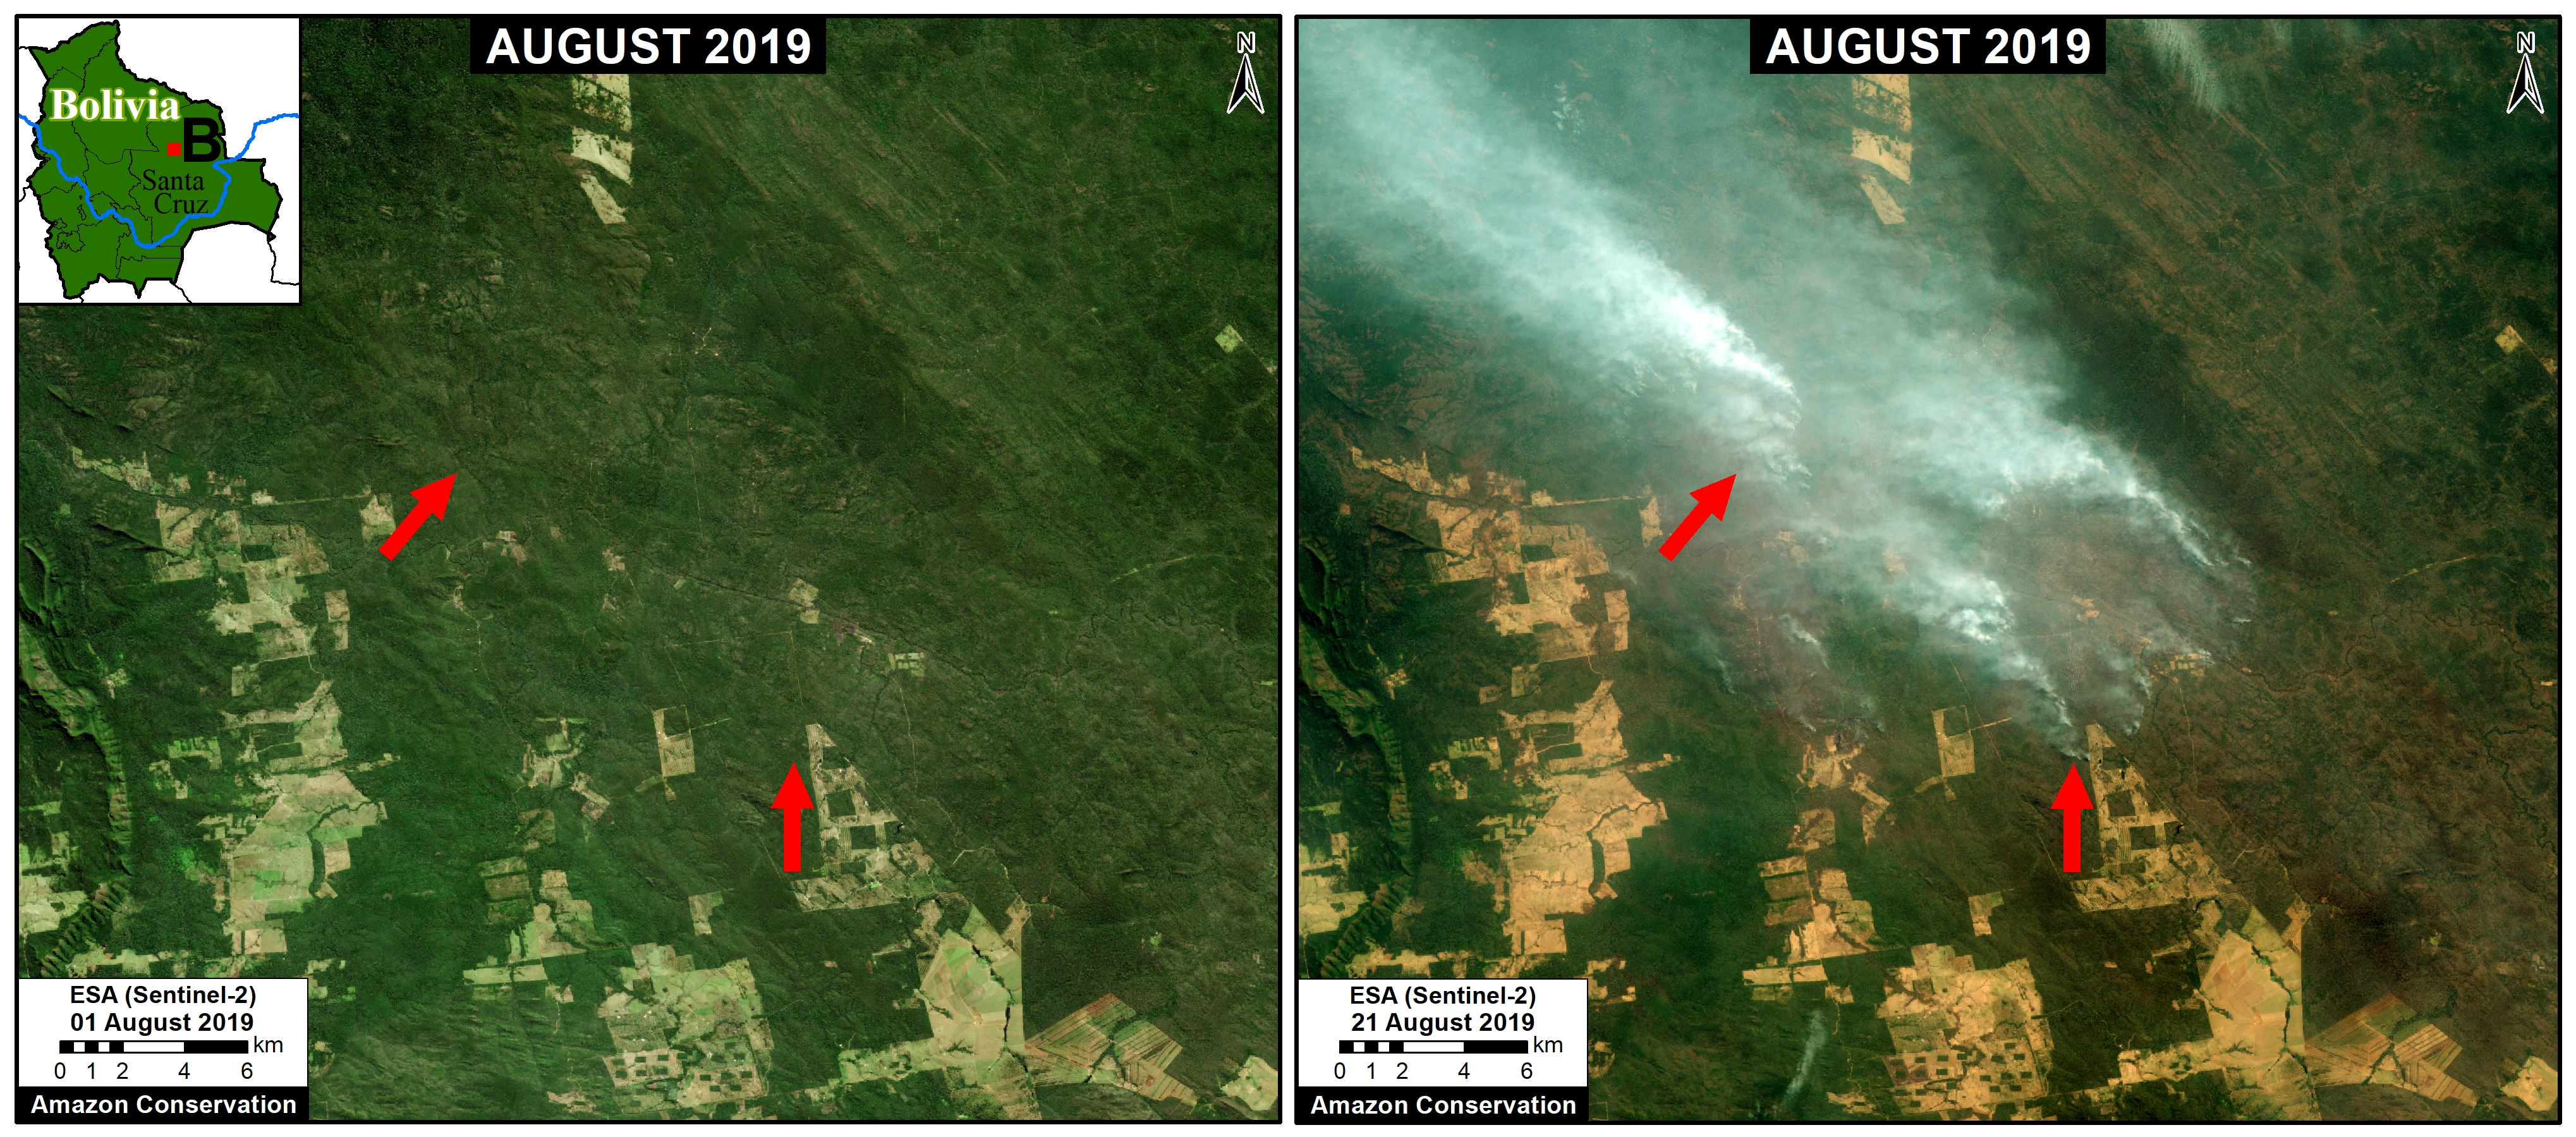
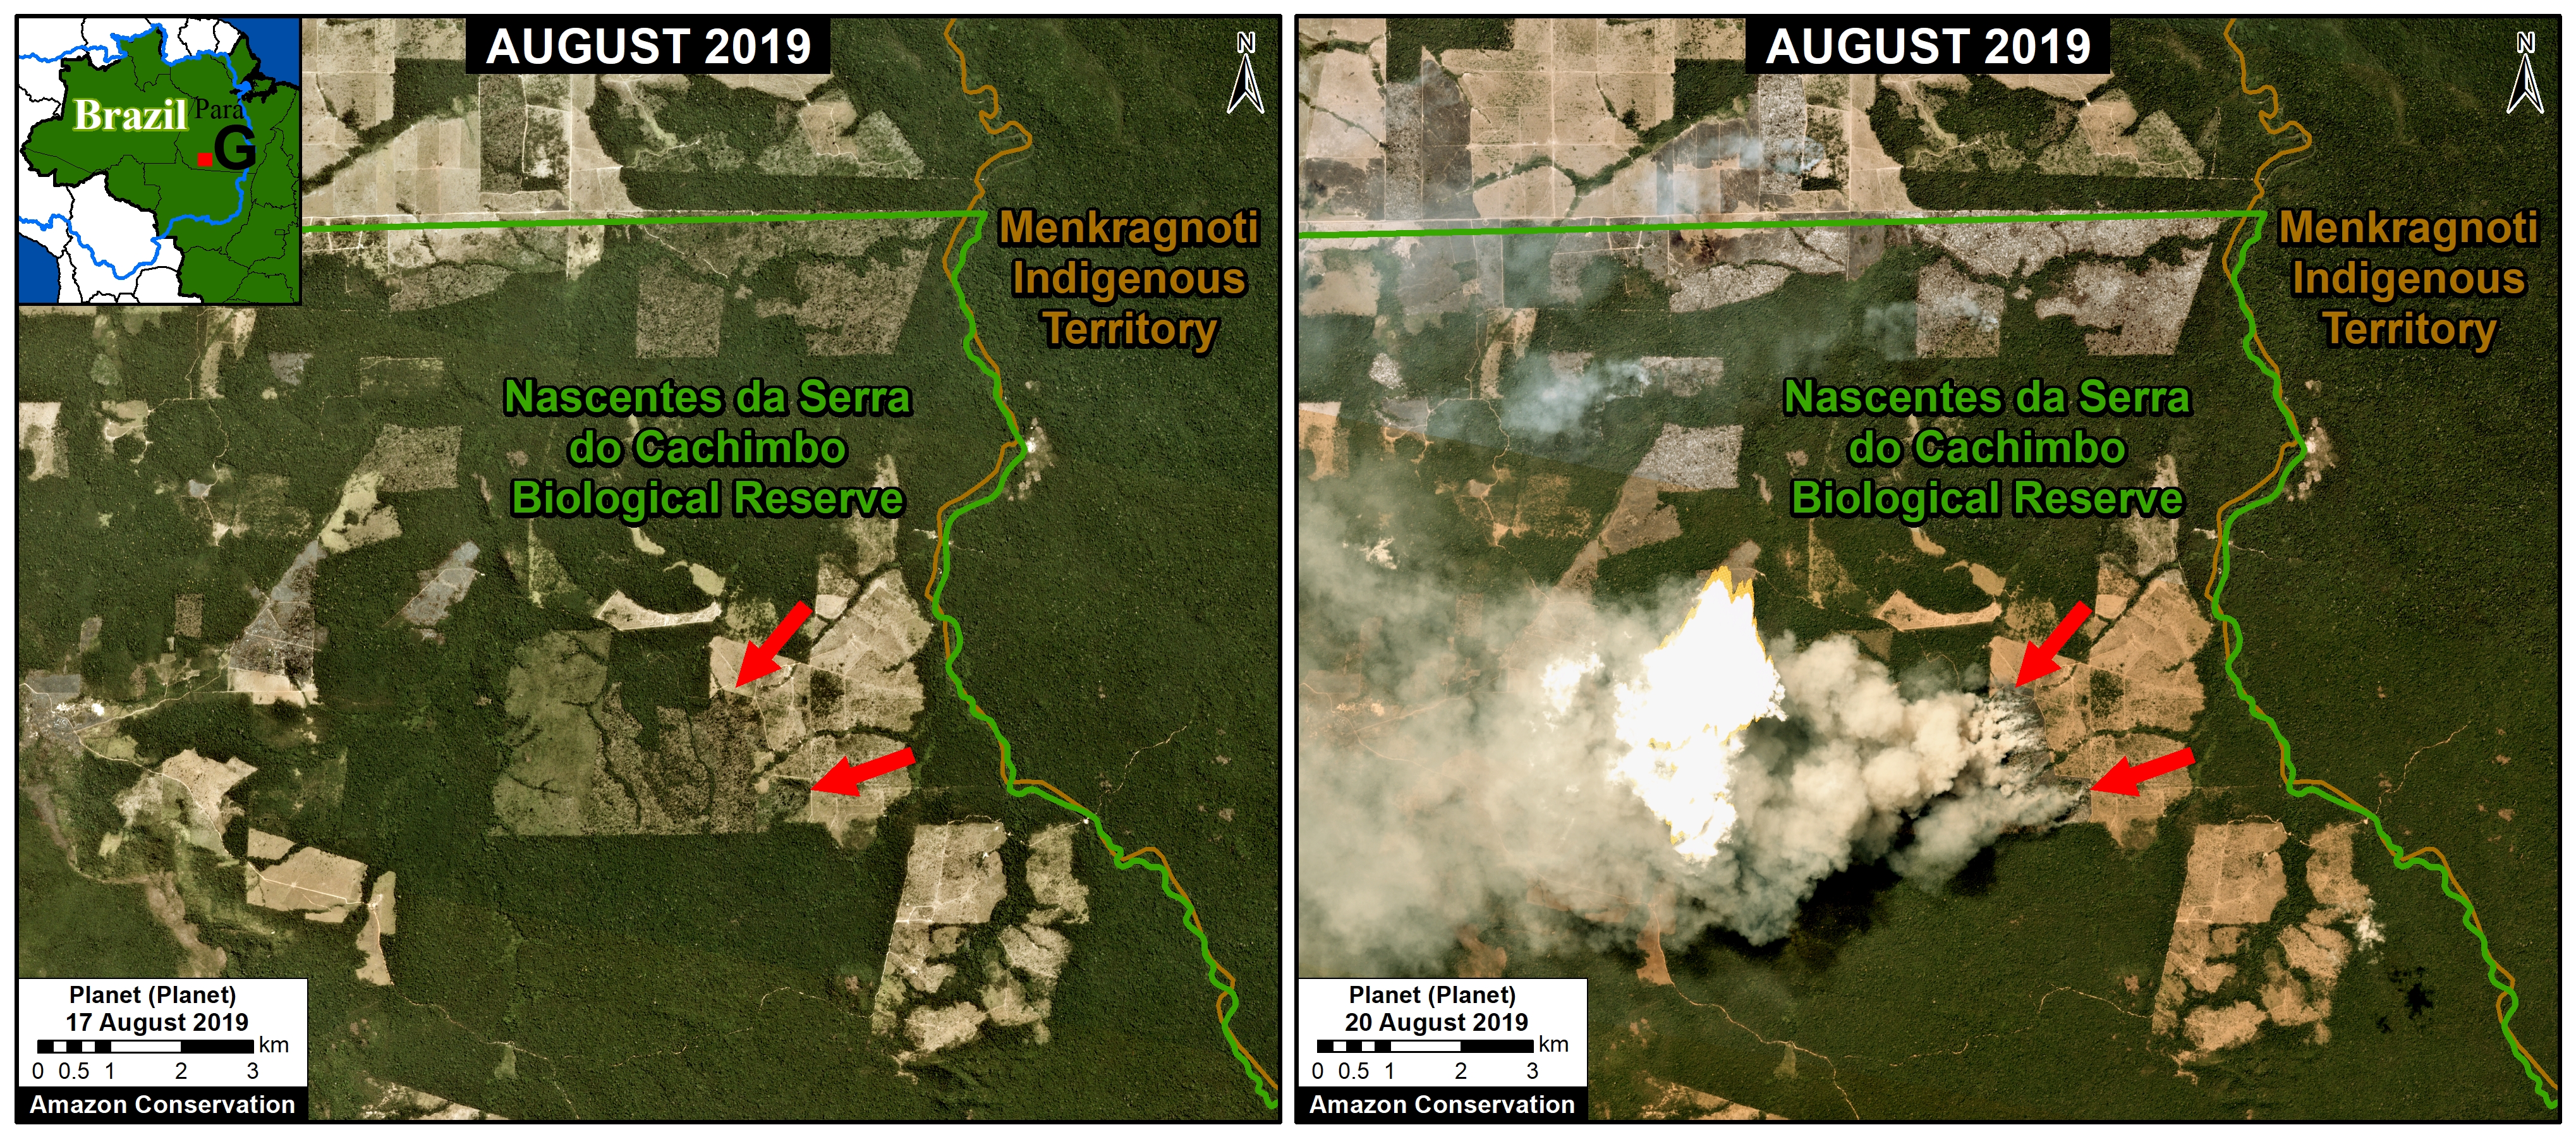
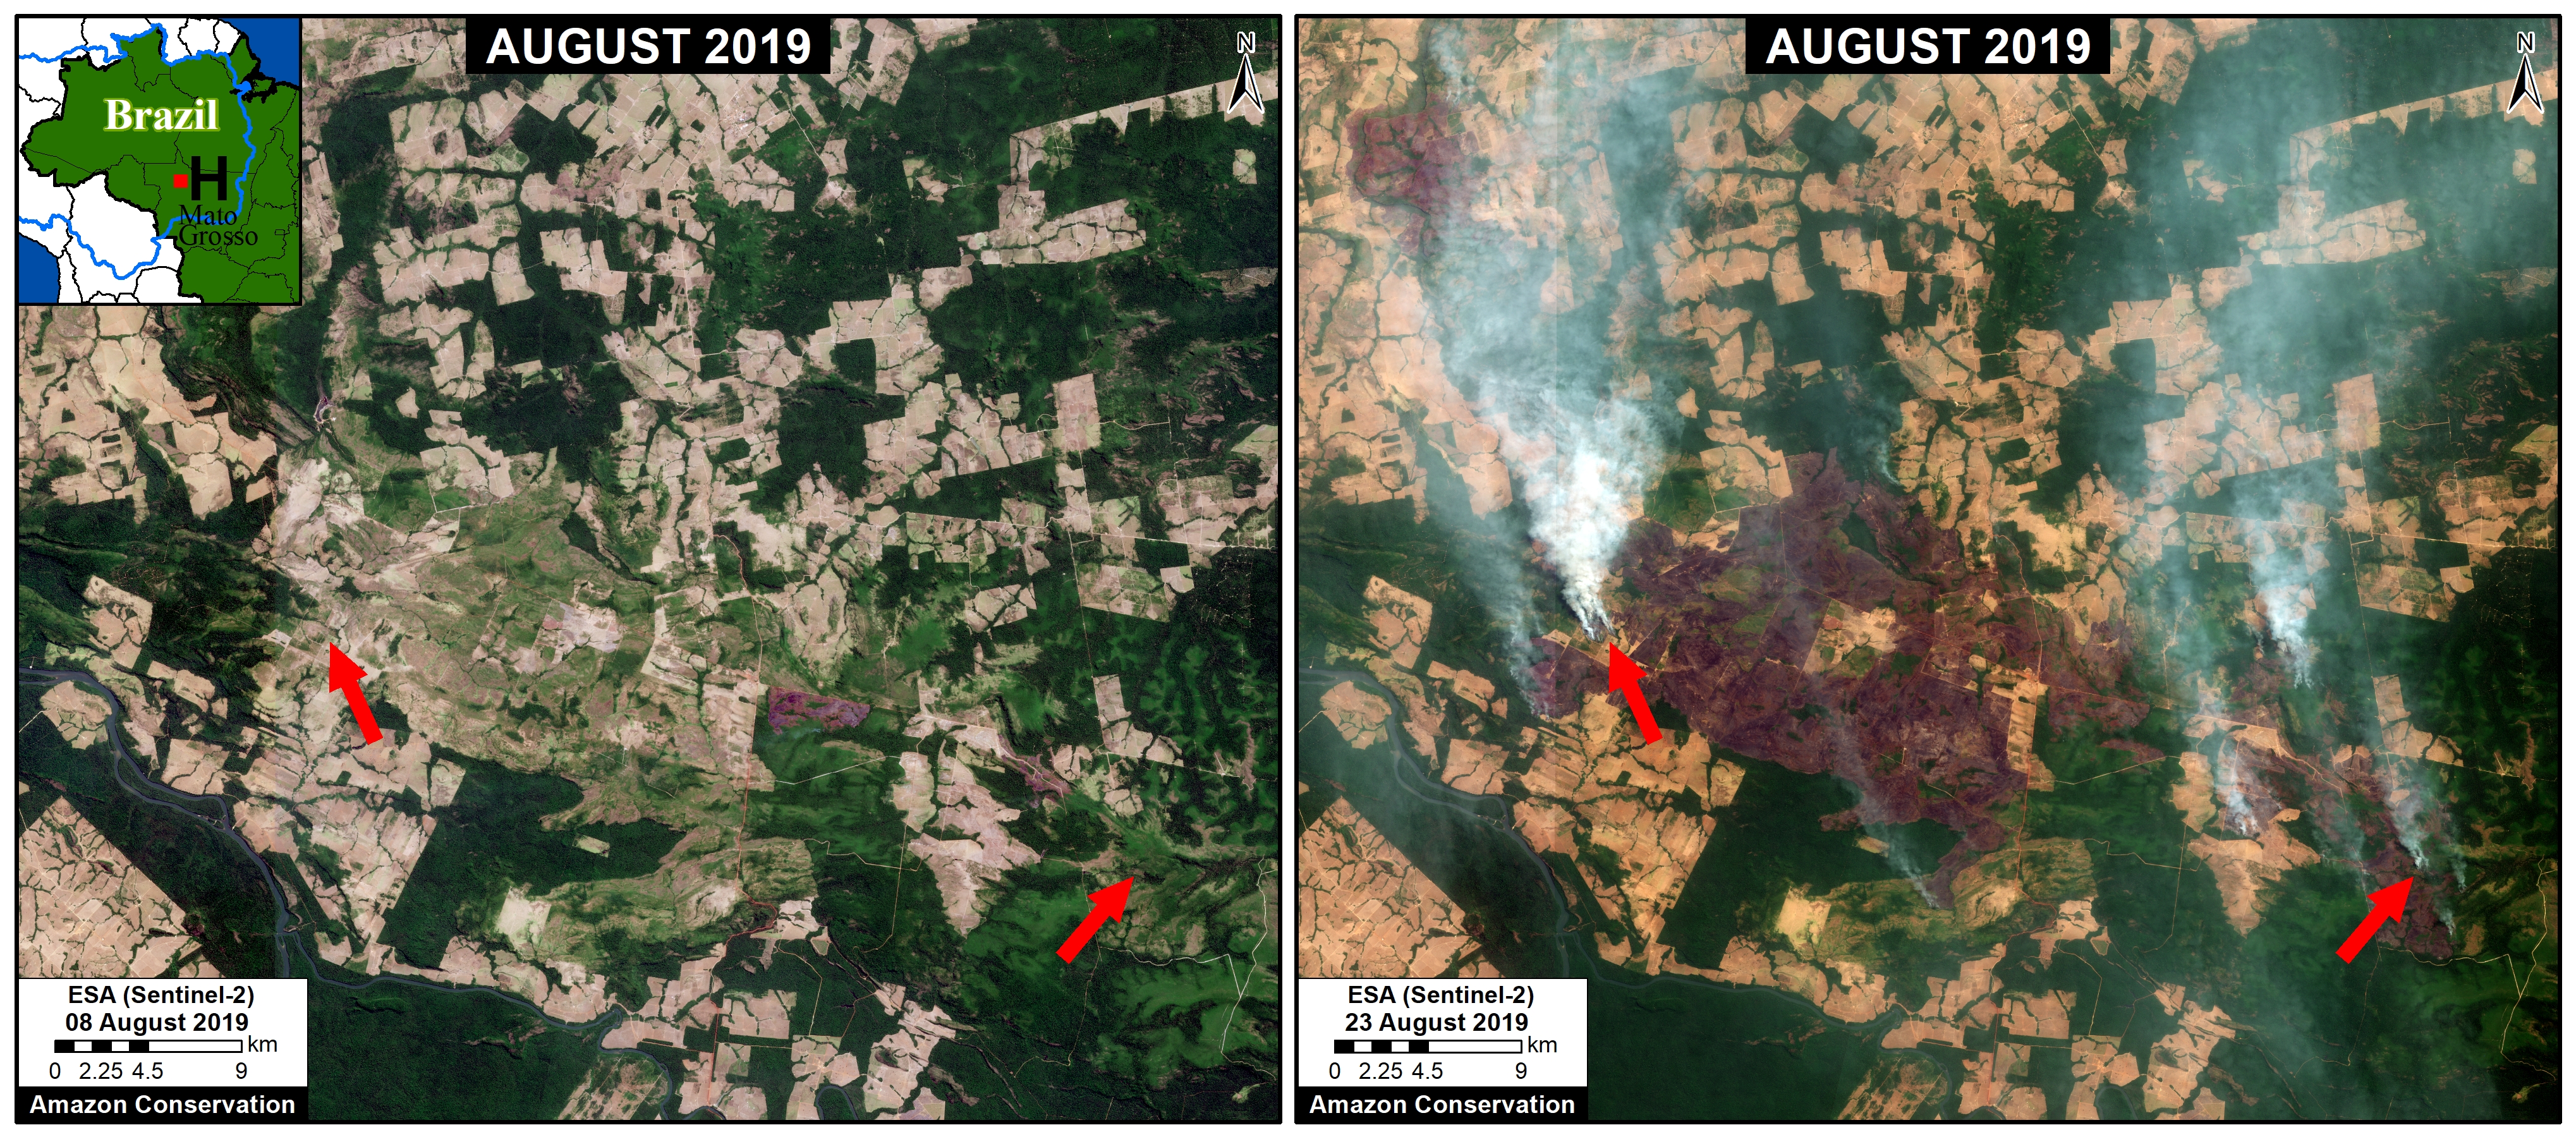
- In the Brazilian Amazon, the majority (67%) of major fires have burned recently deforested areas. Thus, the critical pattern is Deforestation followed by Fire, as many major fires are actually burning the remains of freshly cut areas. These fires have burned over 44,000 hectares (109,000 acres), highlighting the current high deforestation in Brazil.
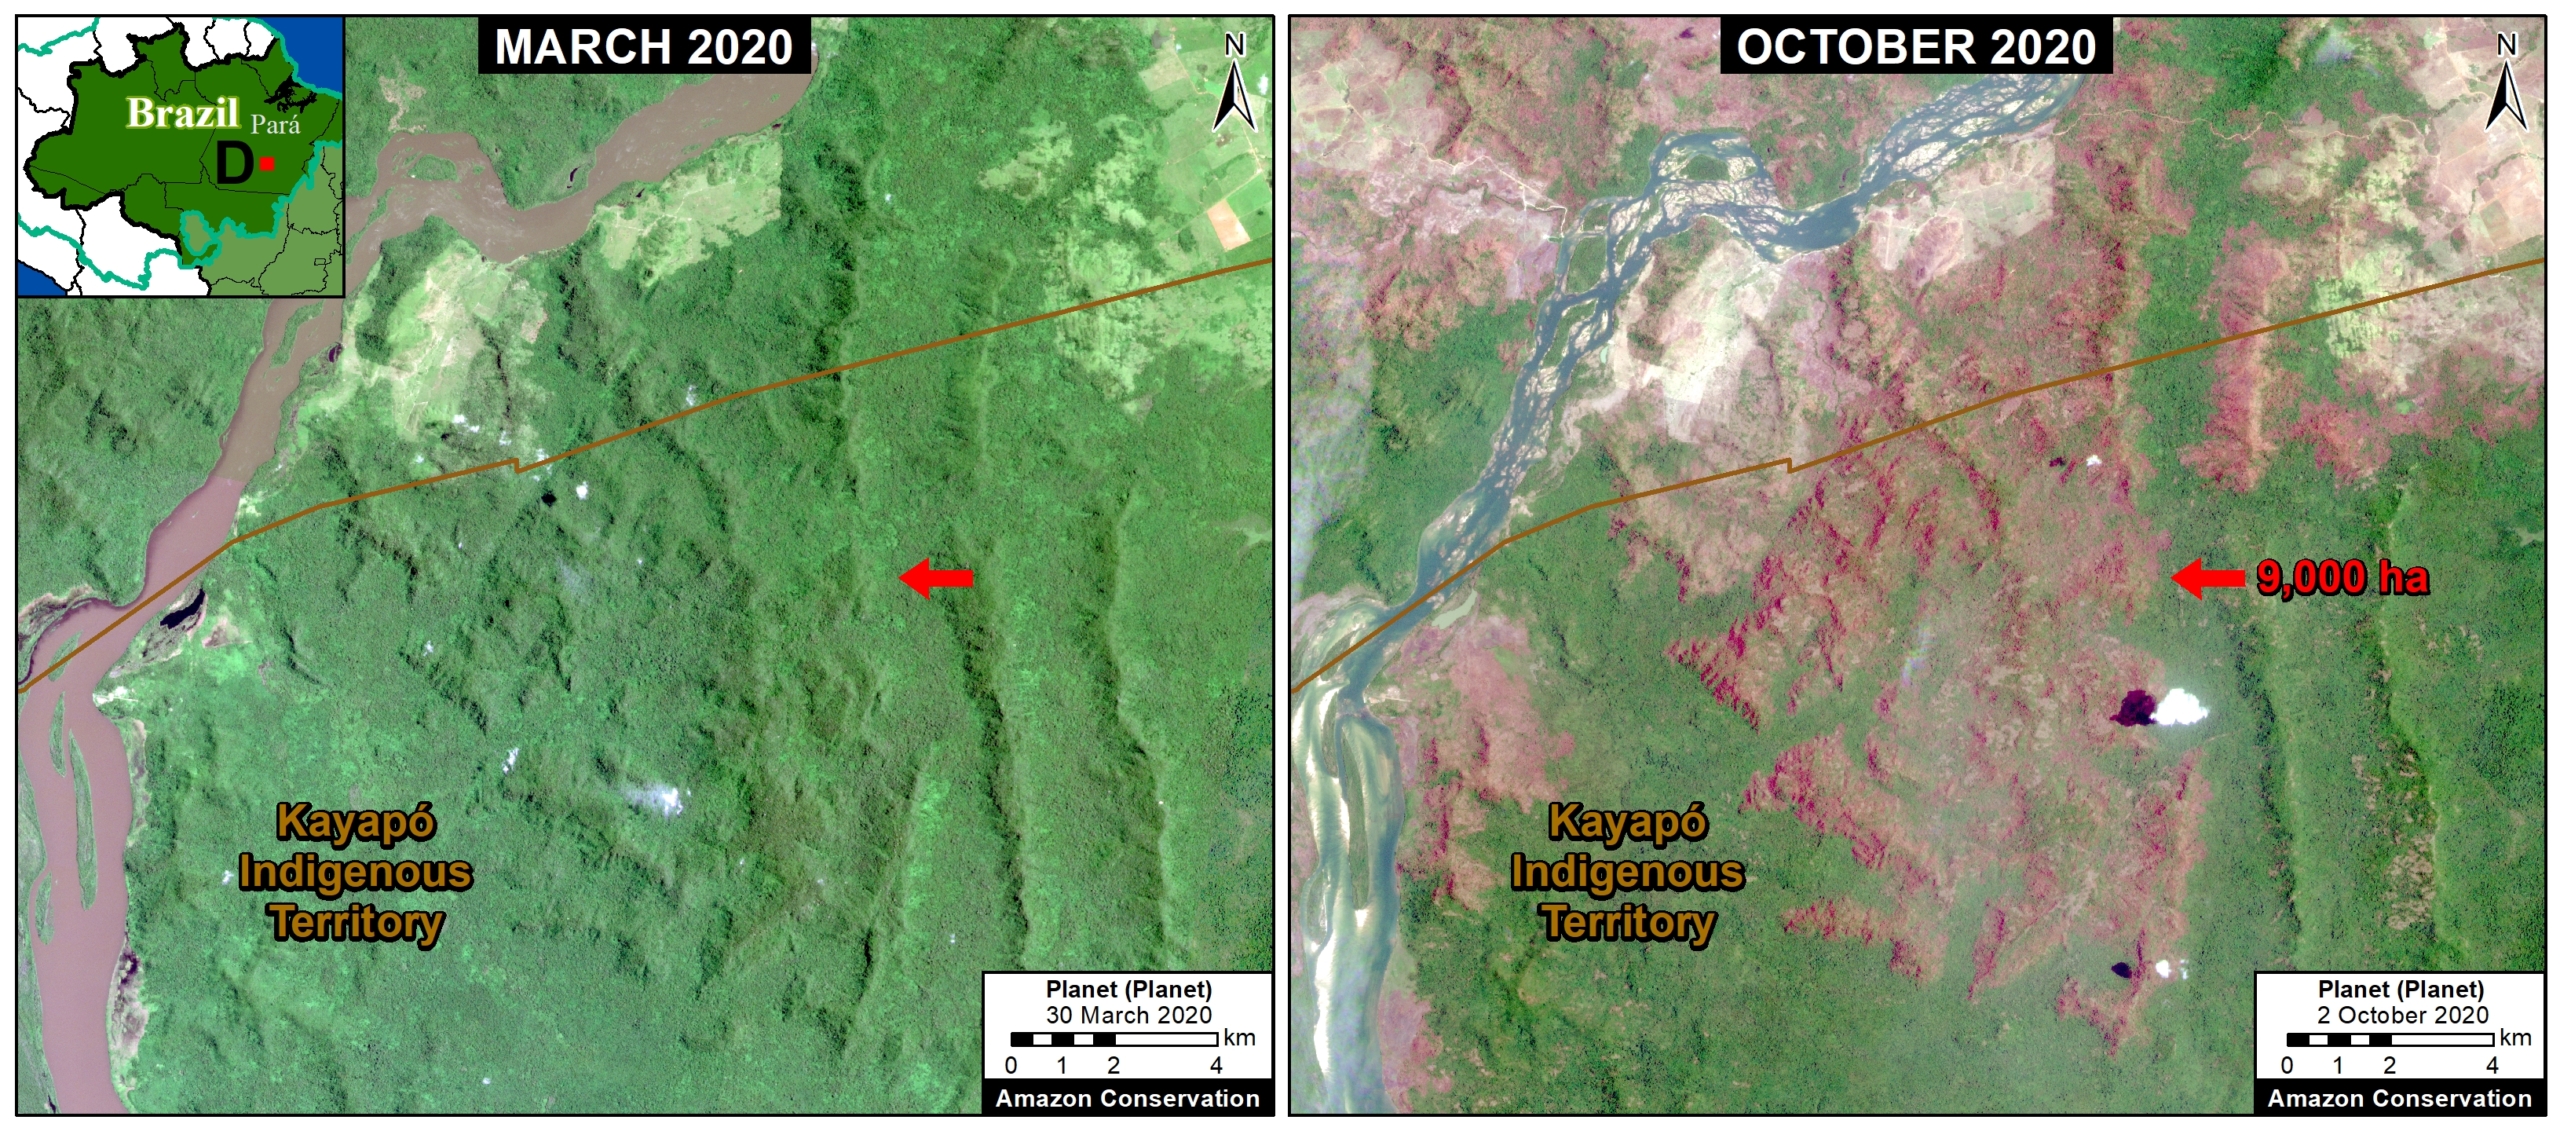
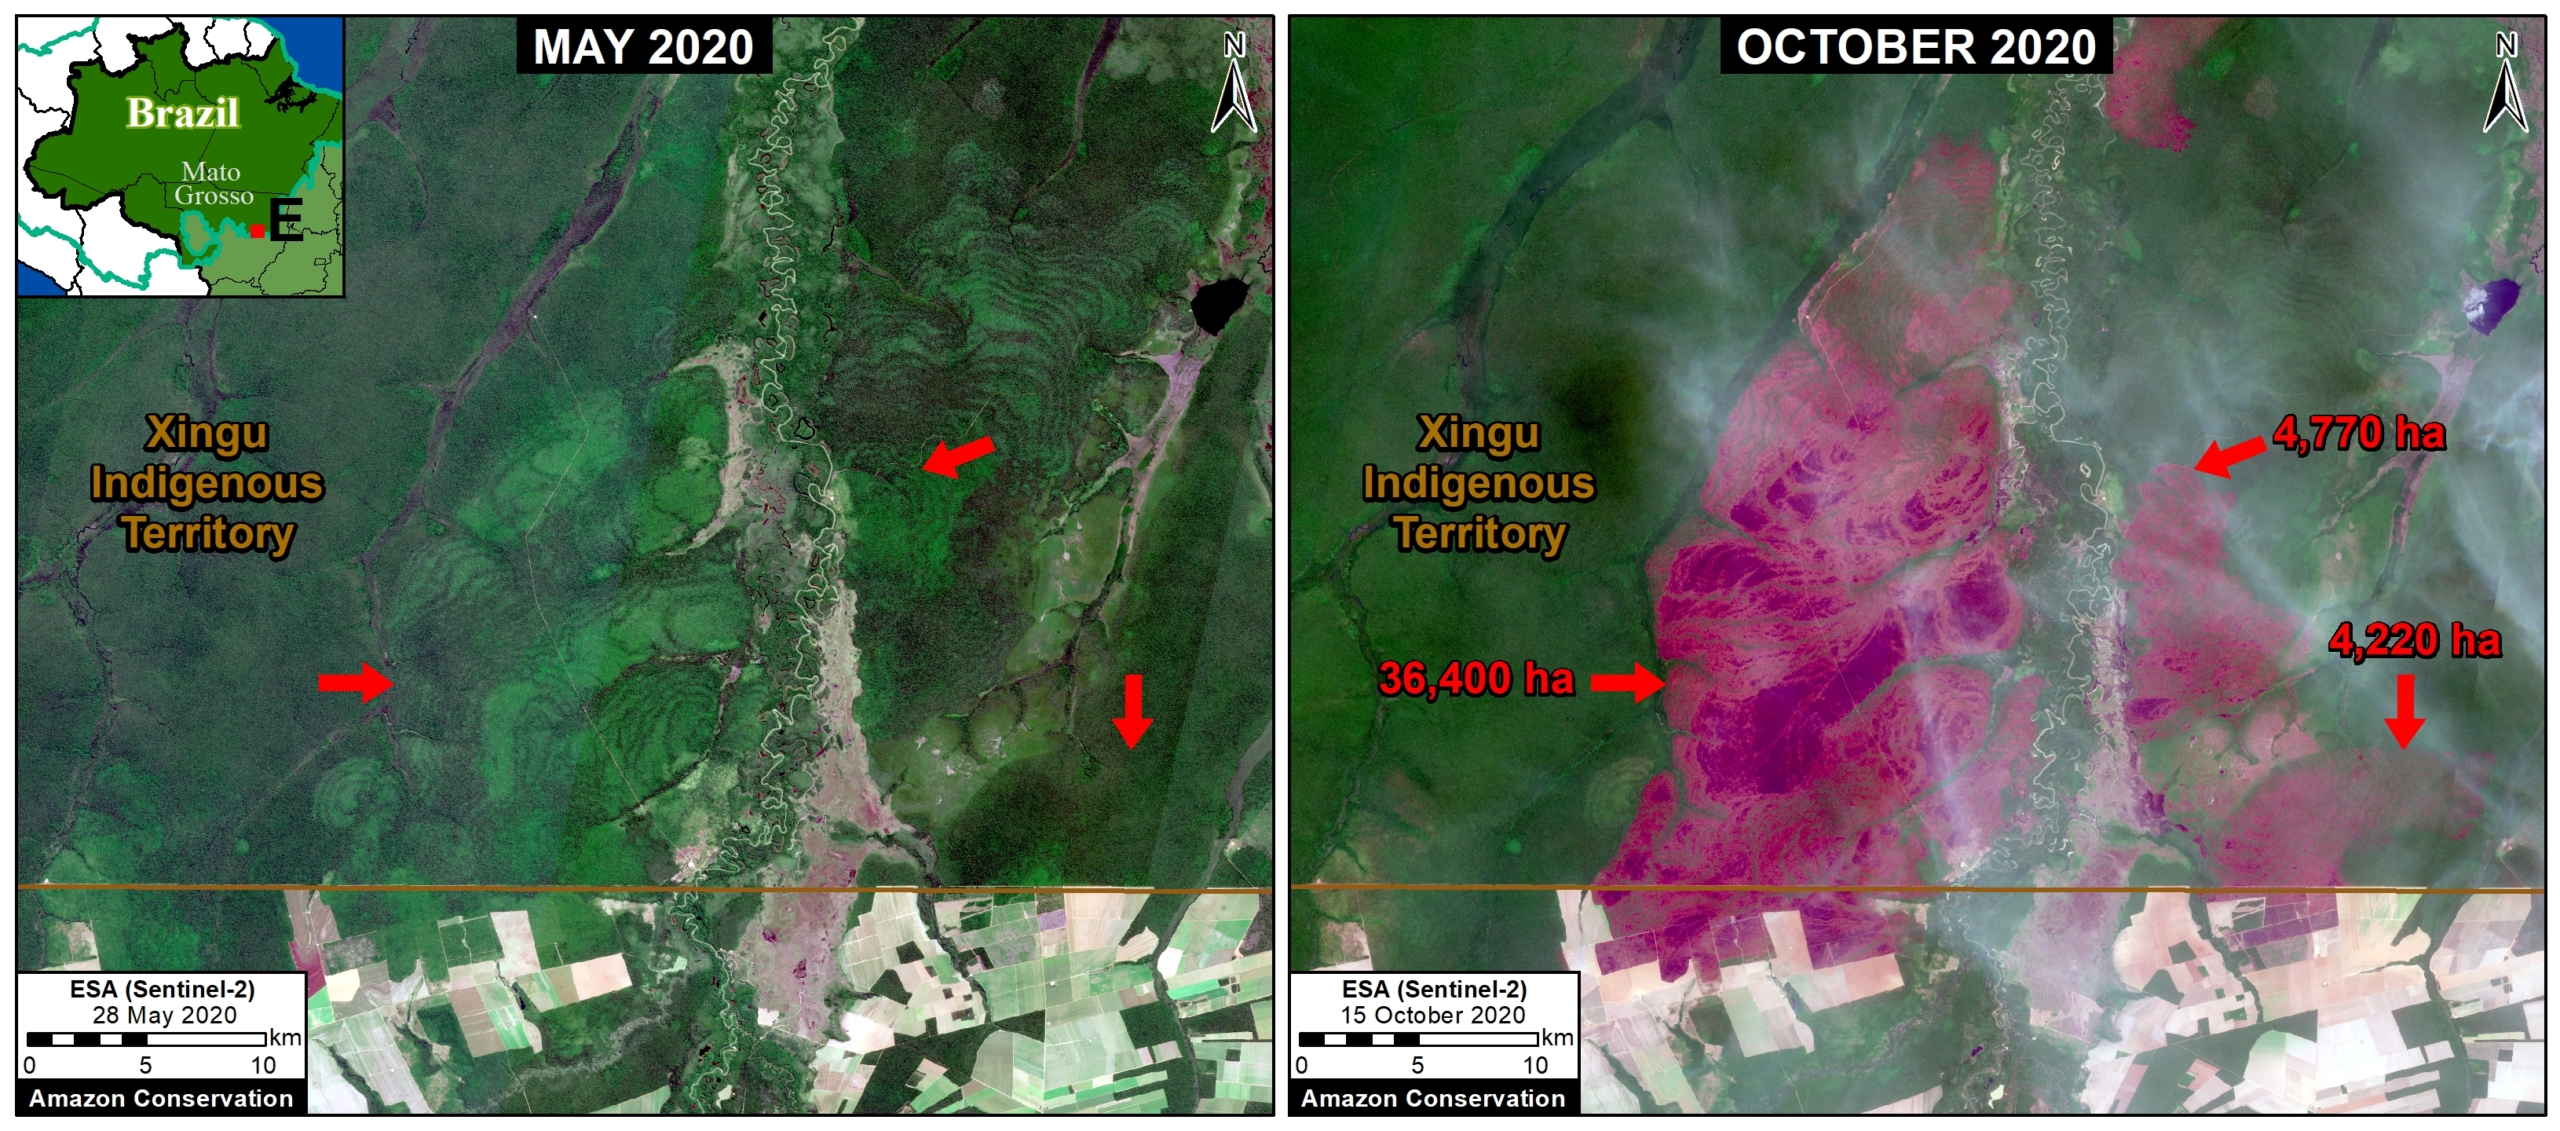
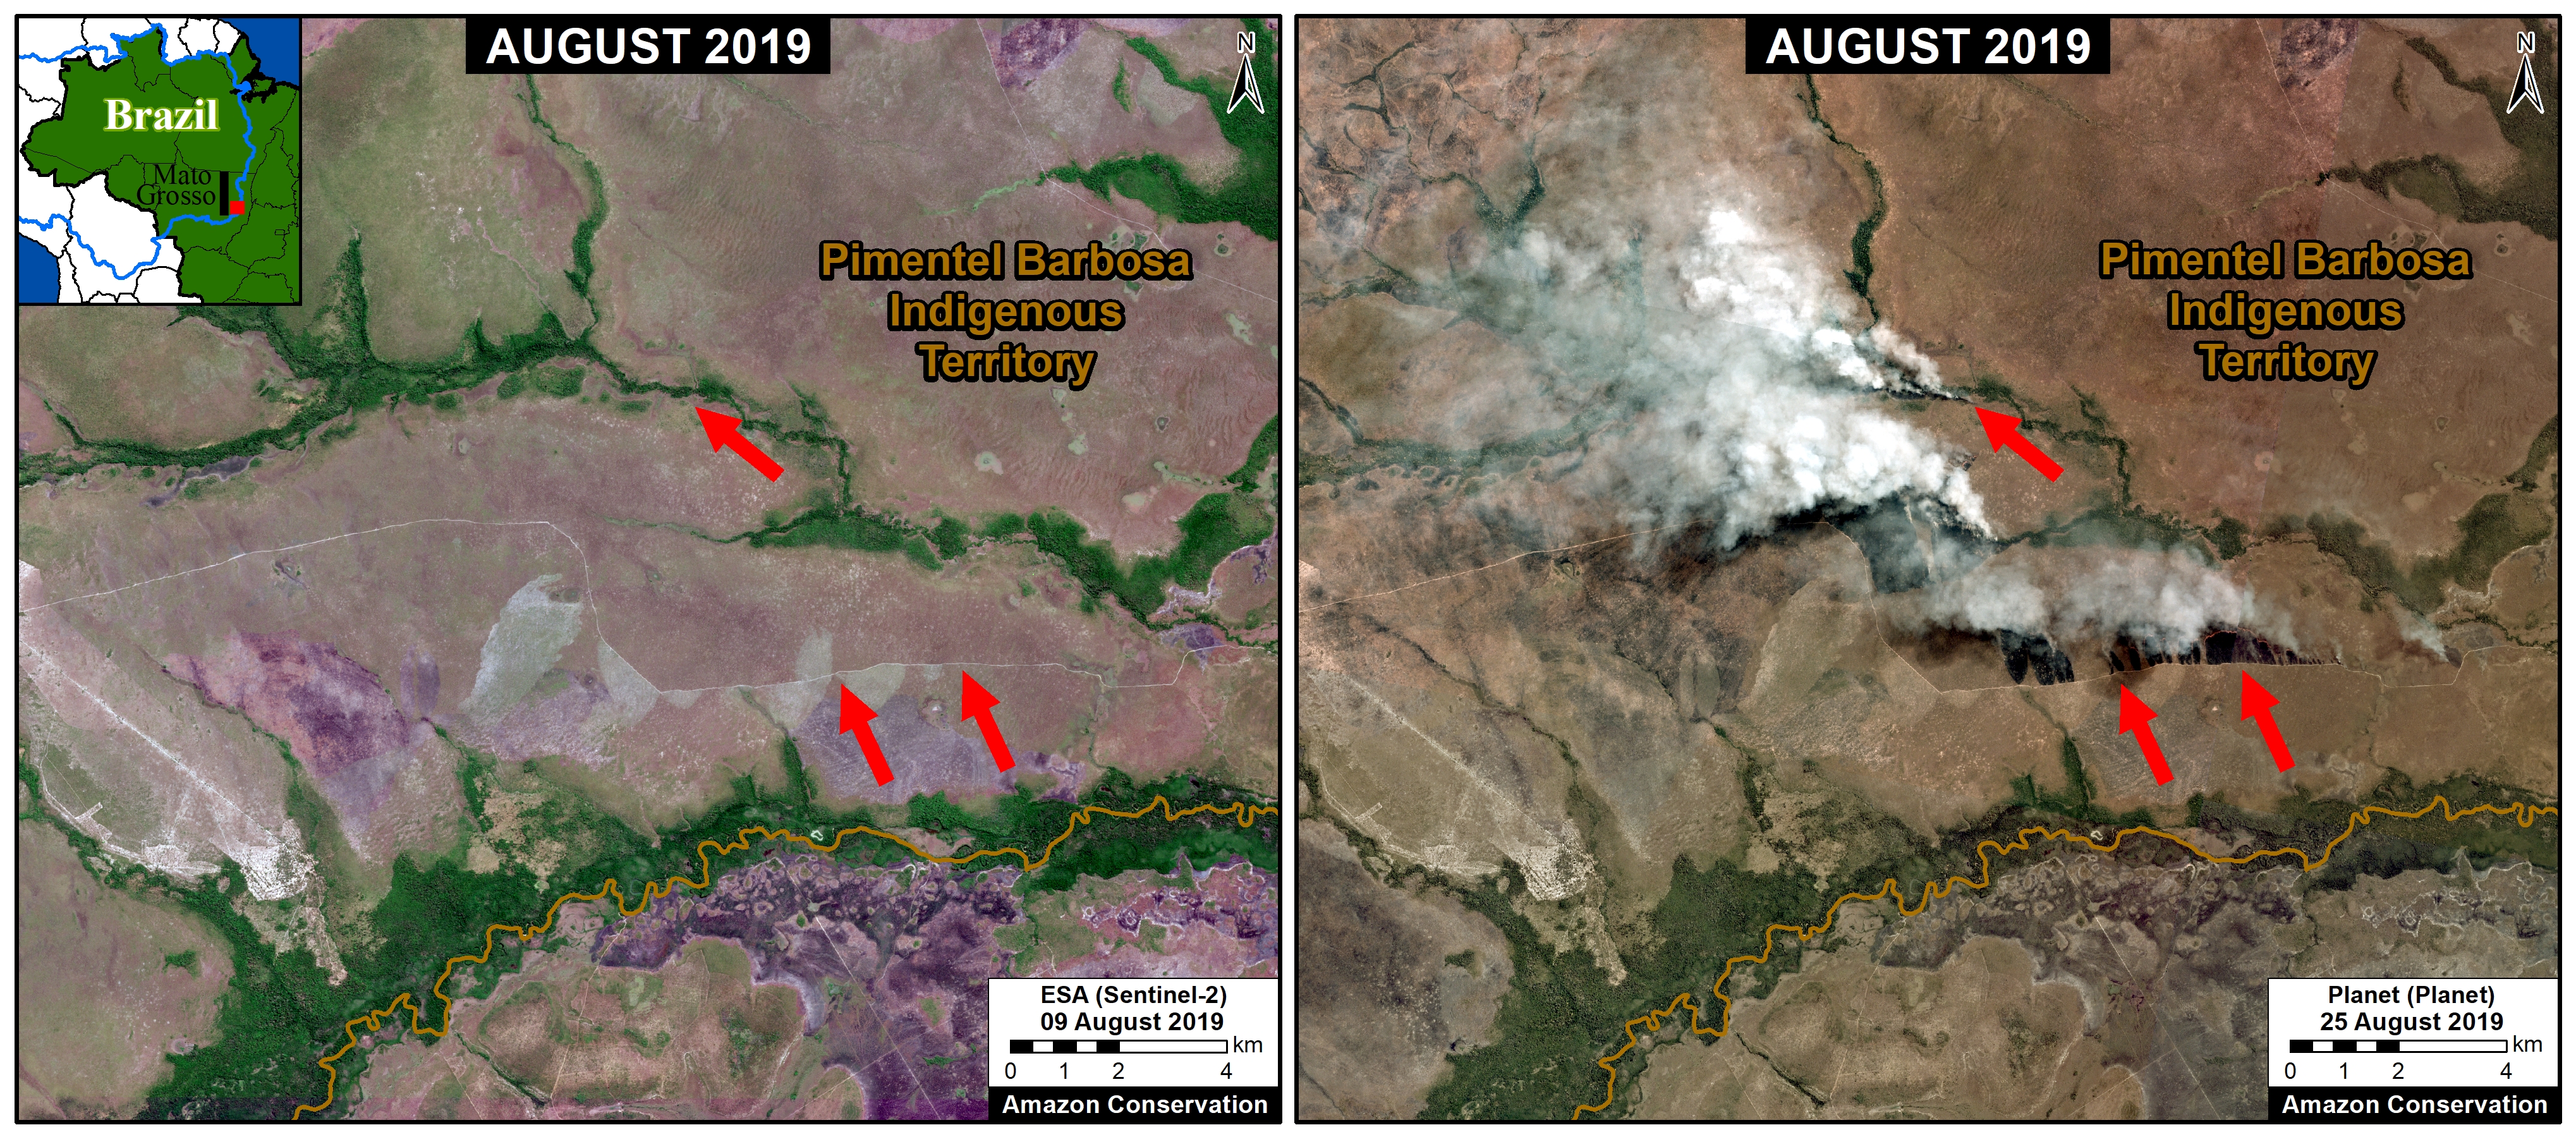
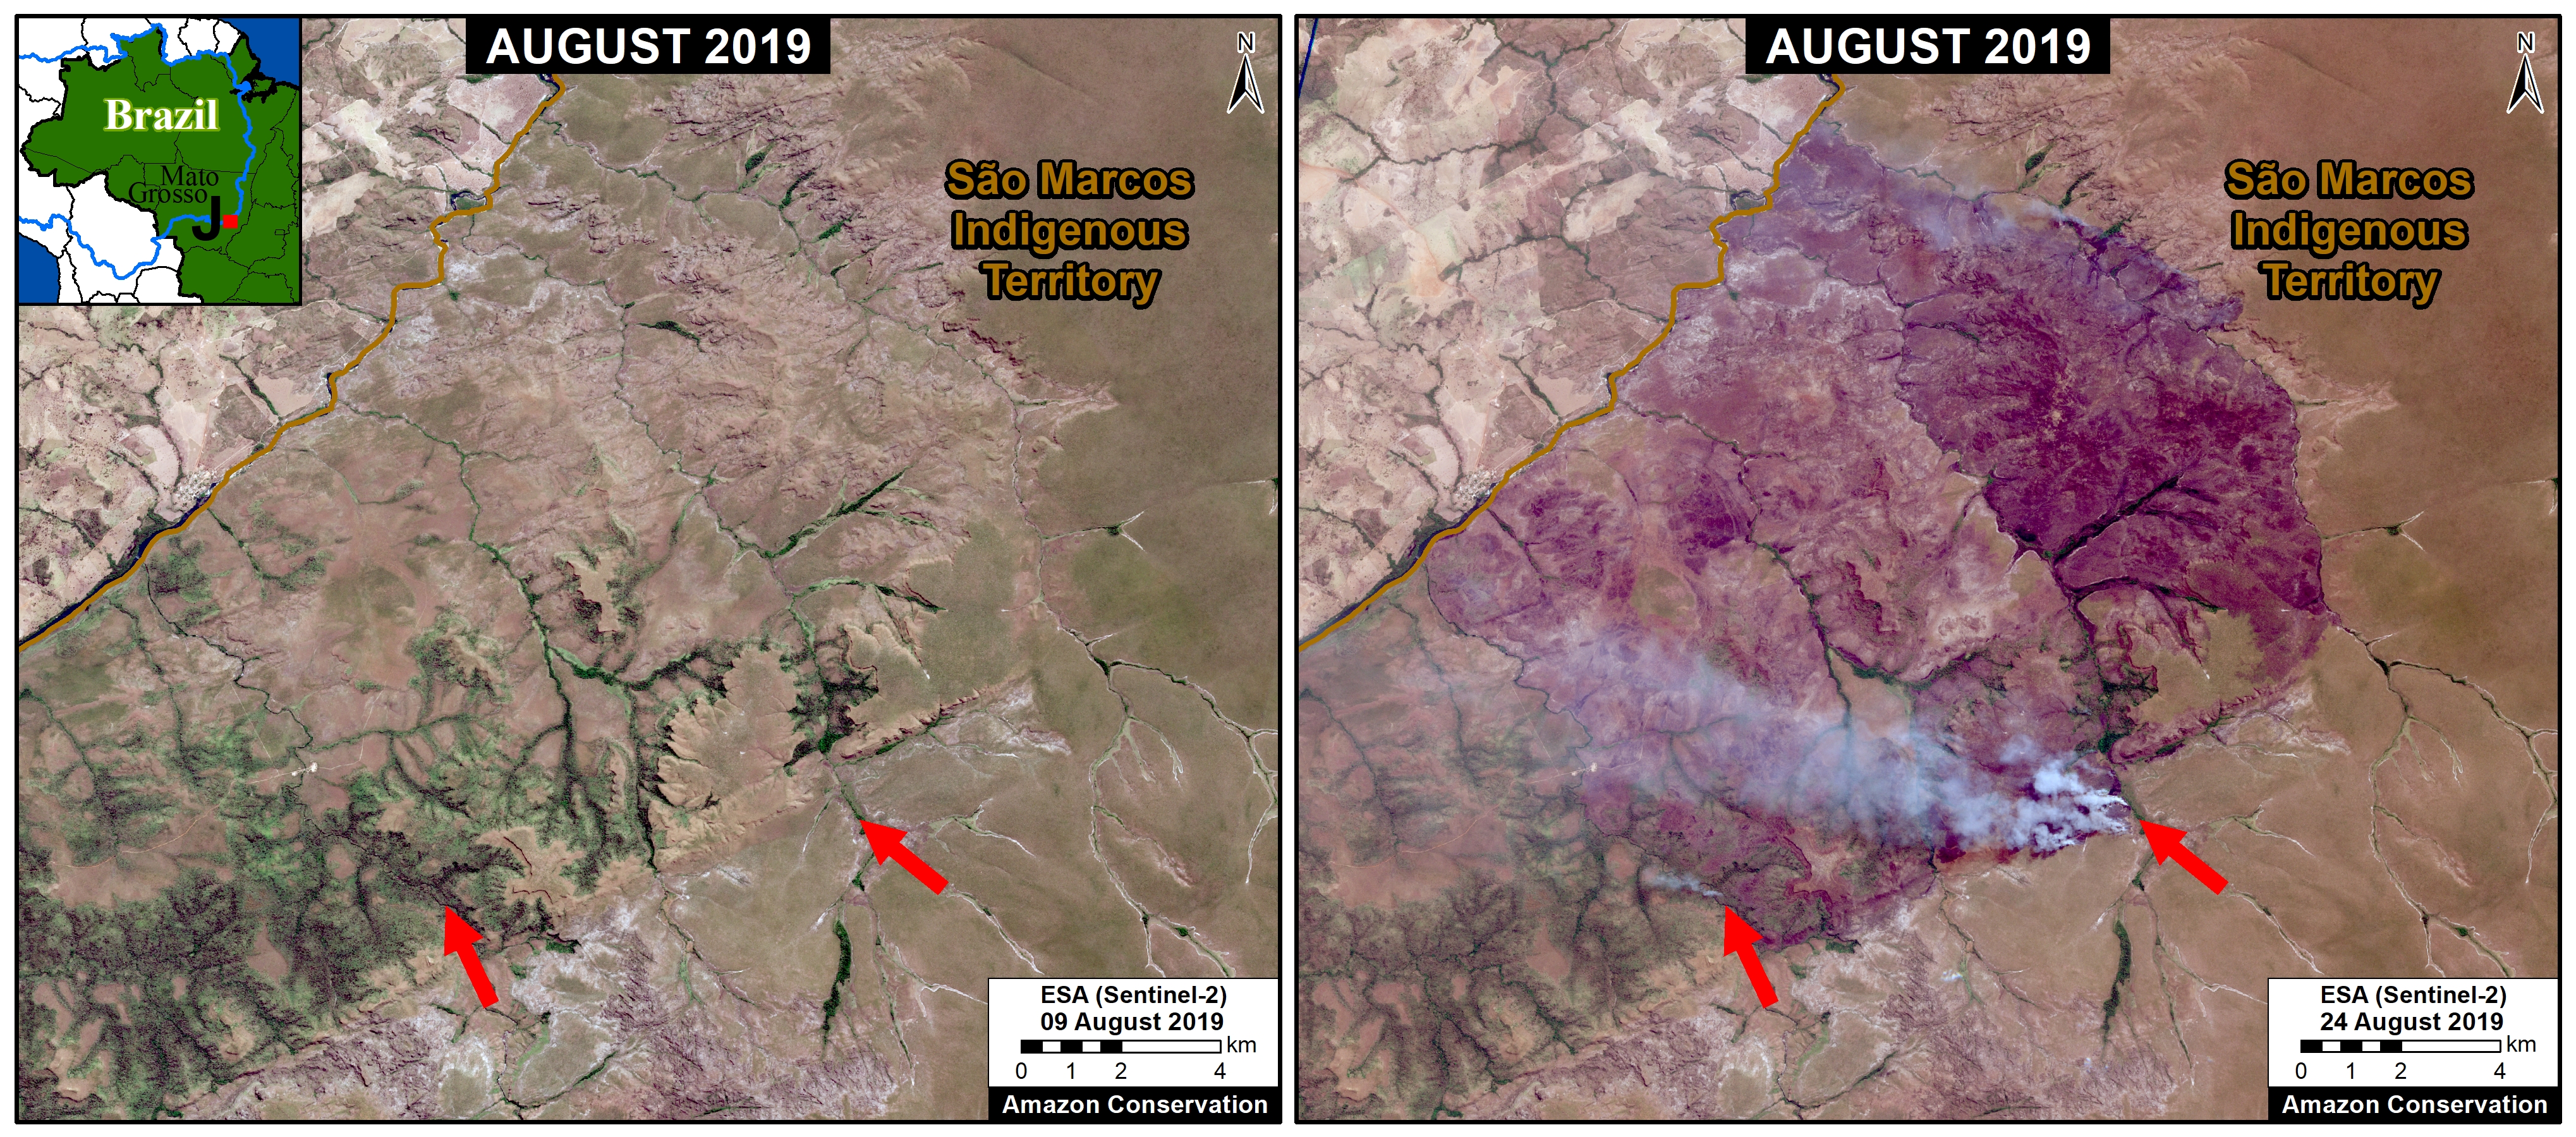
k - We have also documented a number of major fires in the natural grasslands embedded in the eastern Brazilian Amazon. Most of these fires have occurred in Indigenous Territories, such as Xingu andKayapó.
l - The Brazilian government issued a ban on unauthorized outdoor fires on June 27, thus we assume that most of the 160 major fires following that date have been illegal.
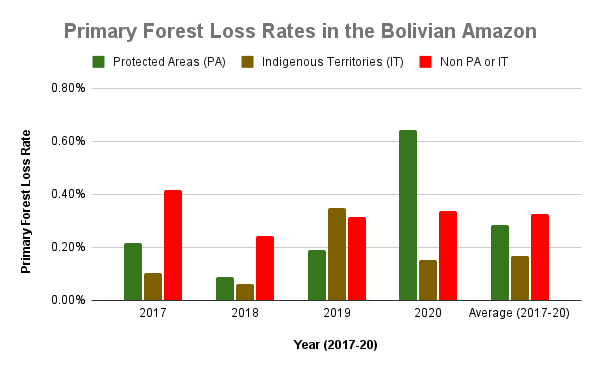
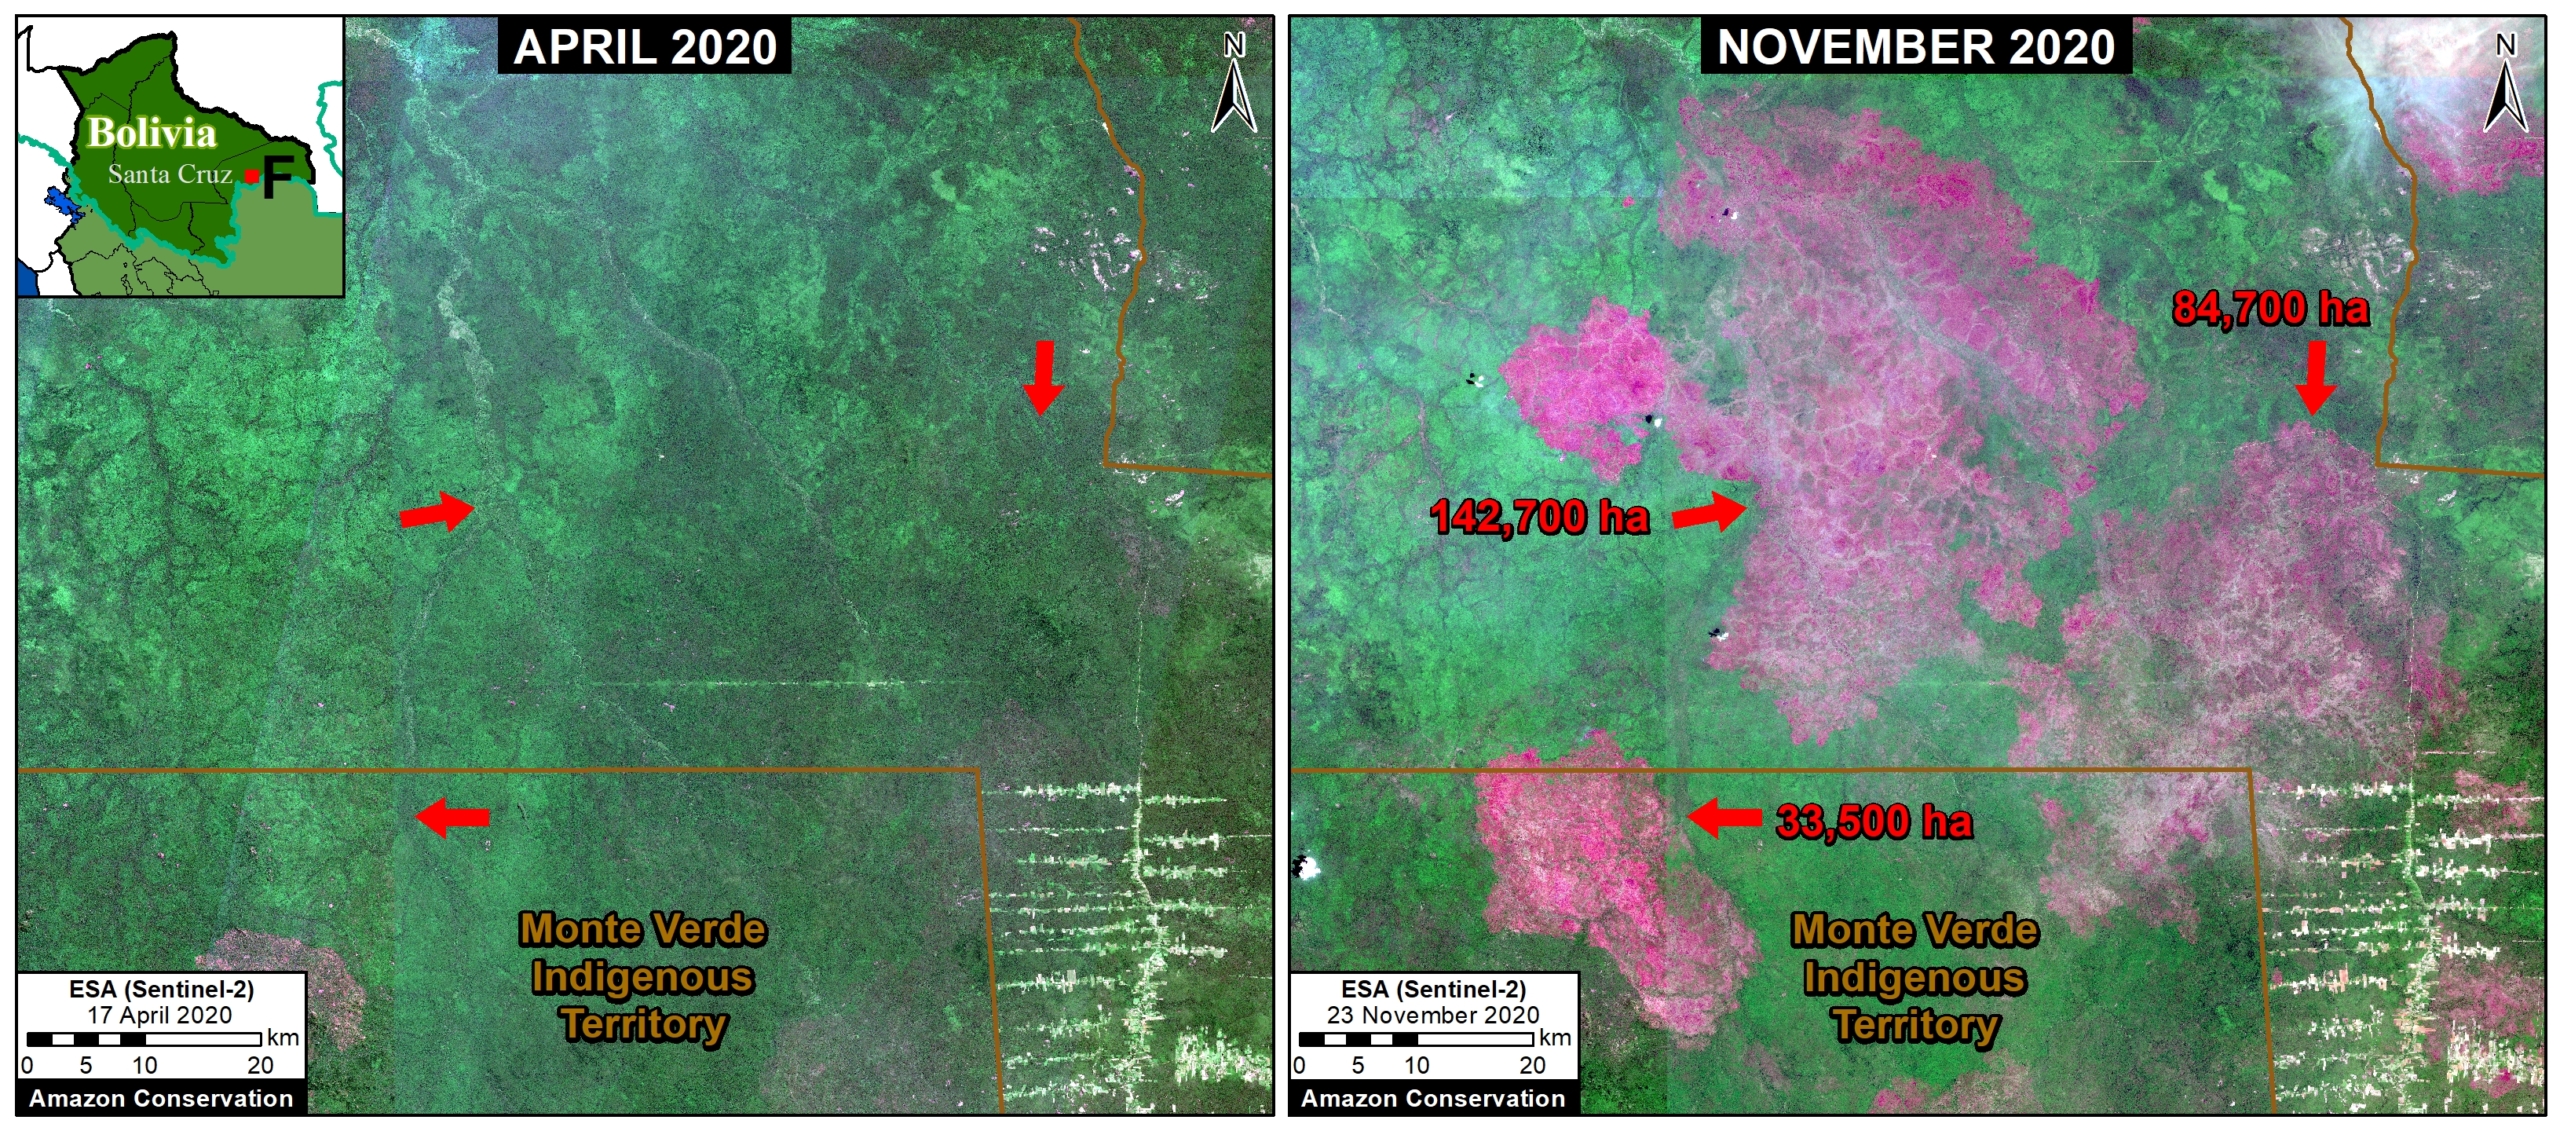
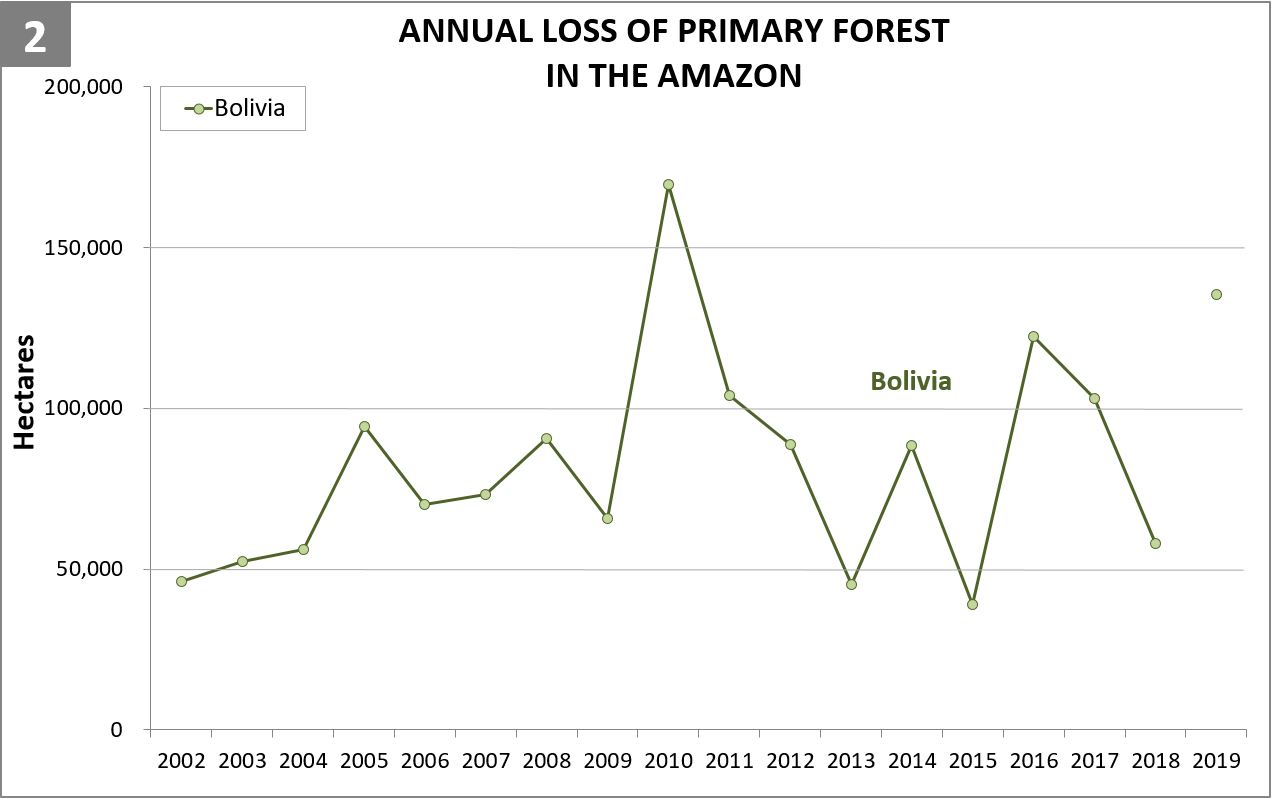
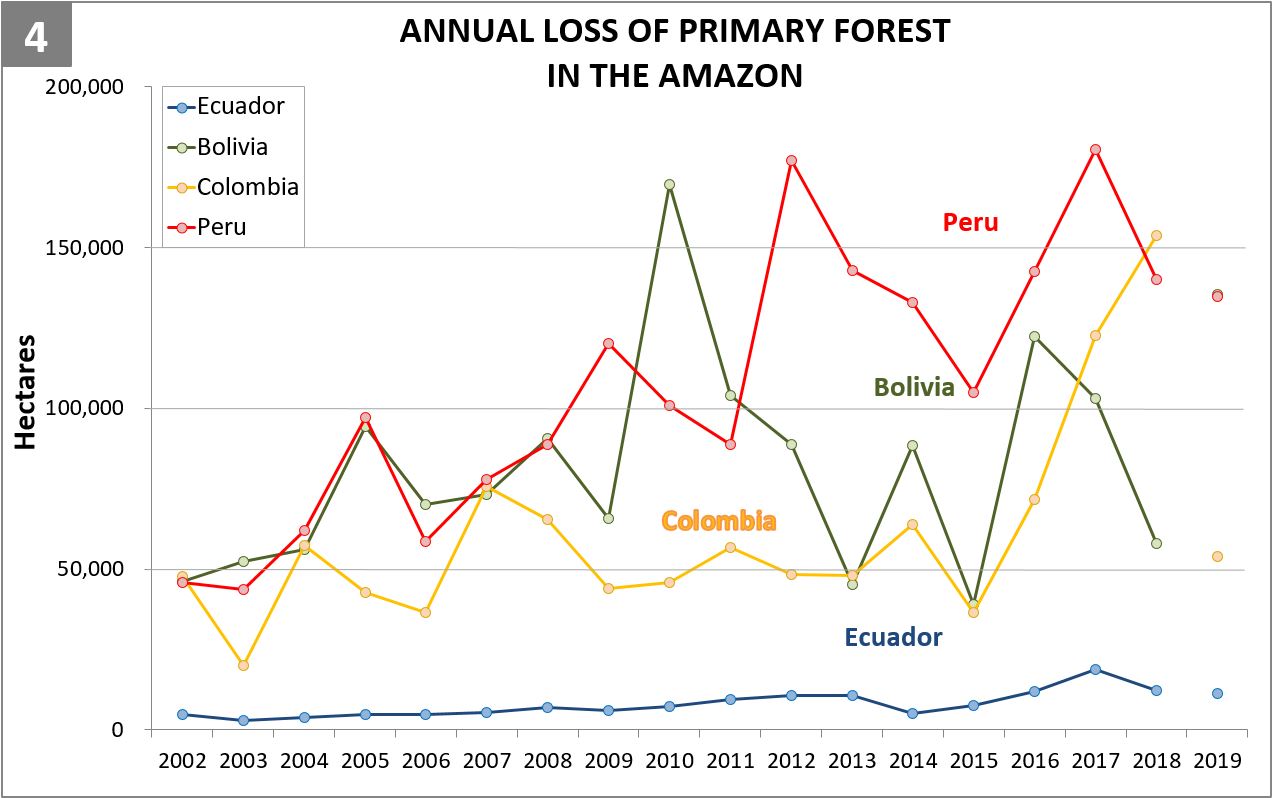
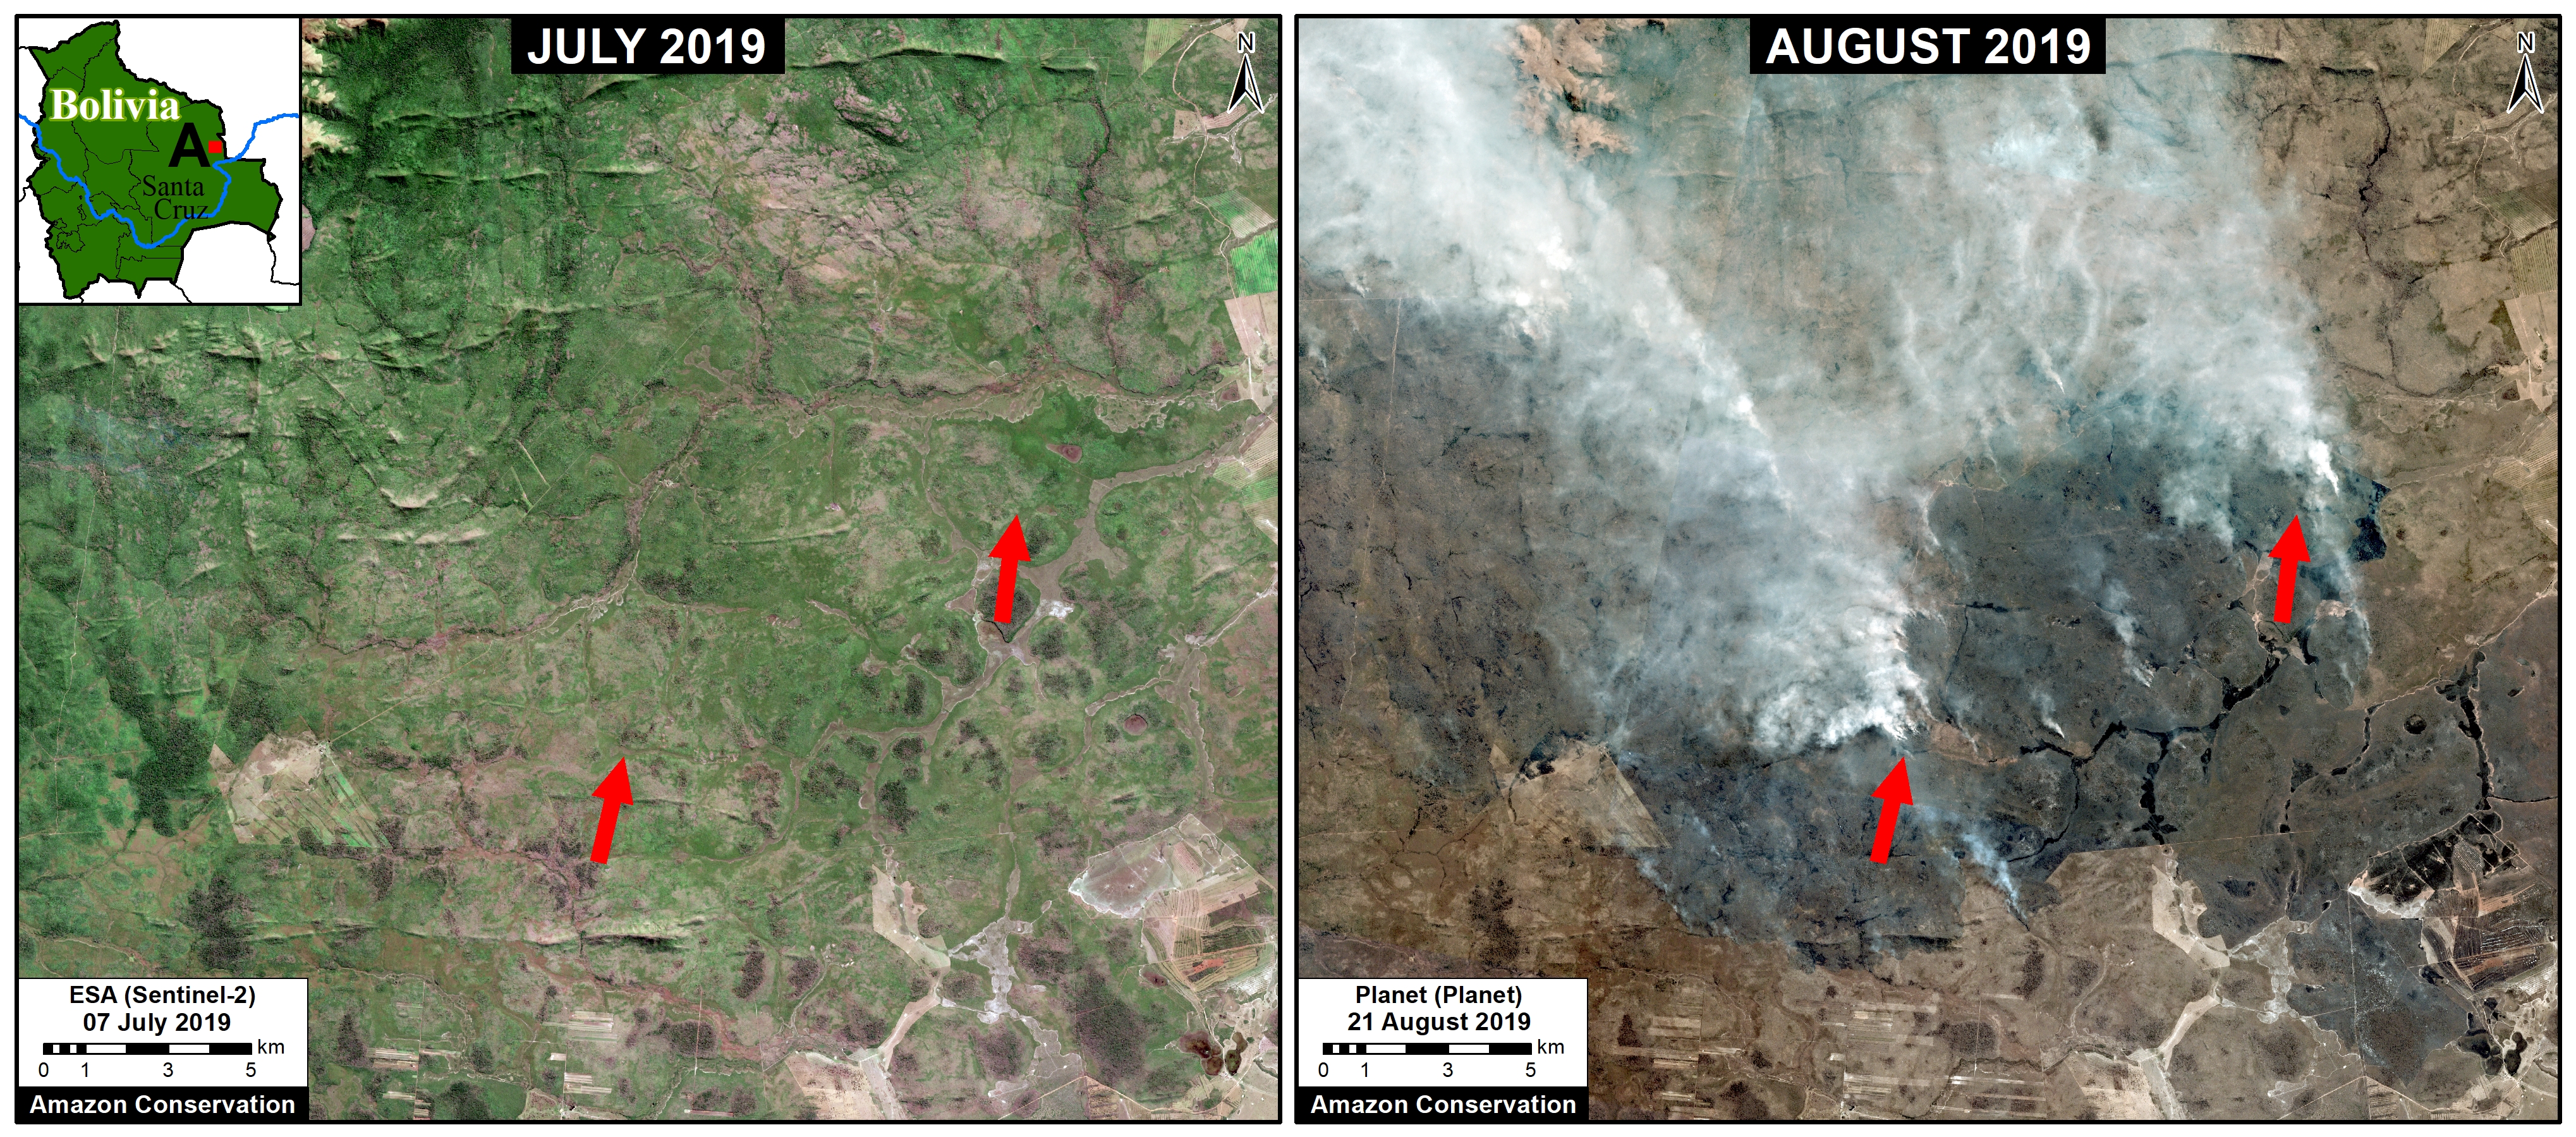
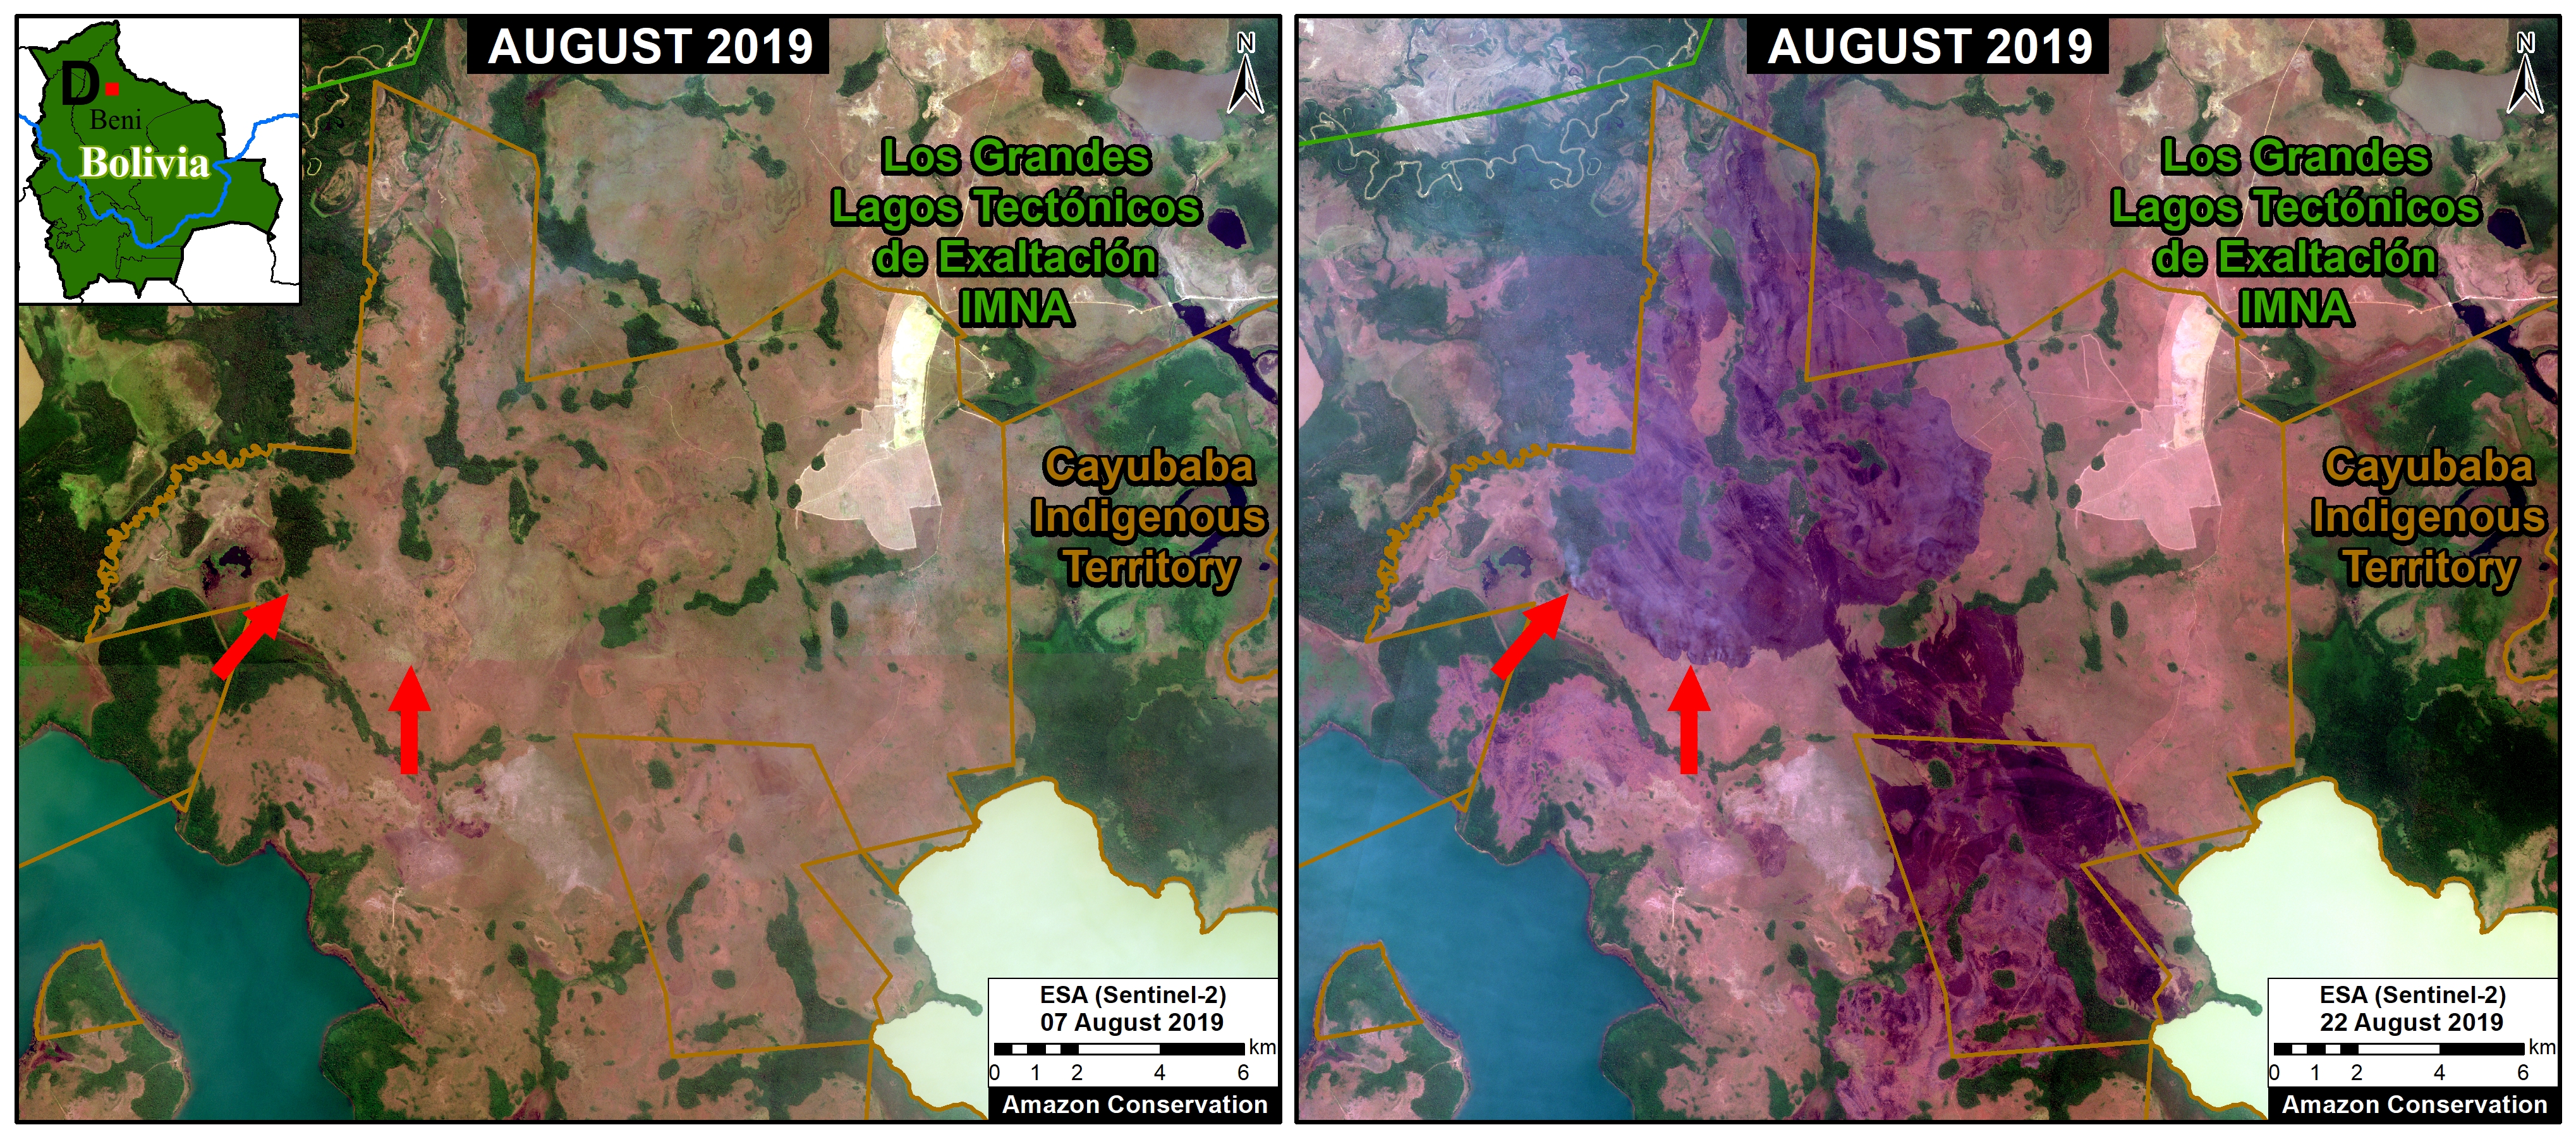
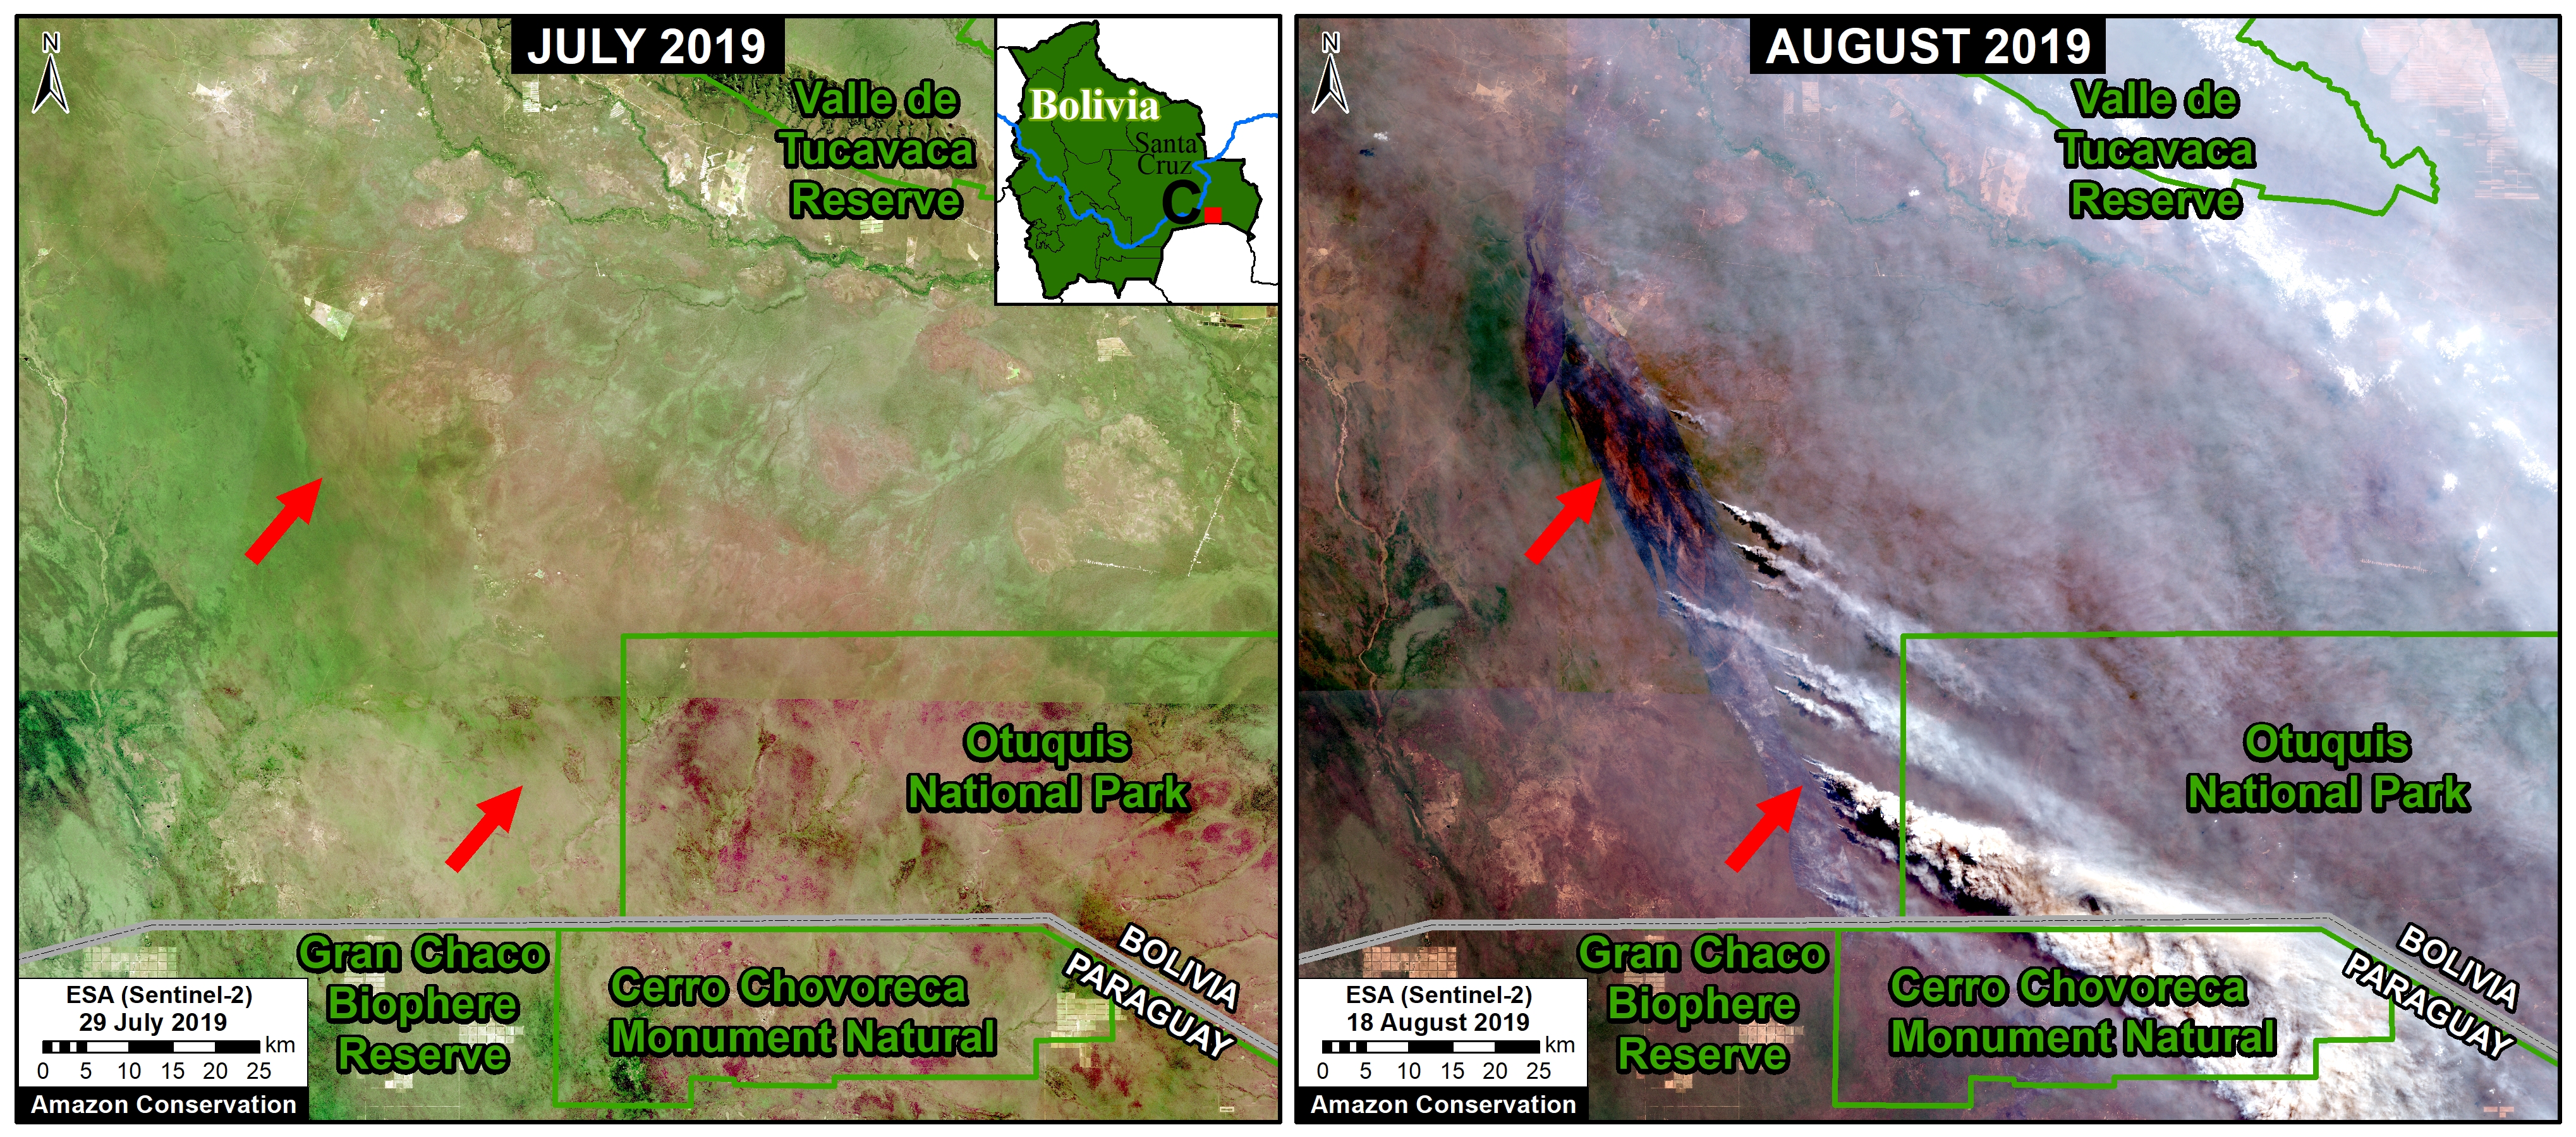
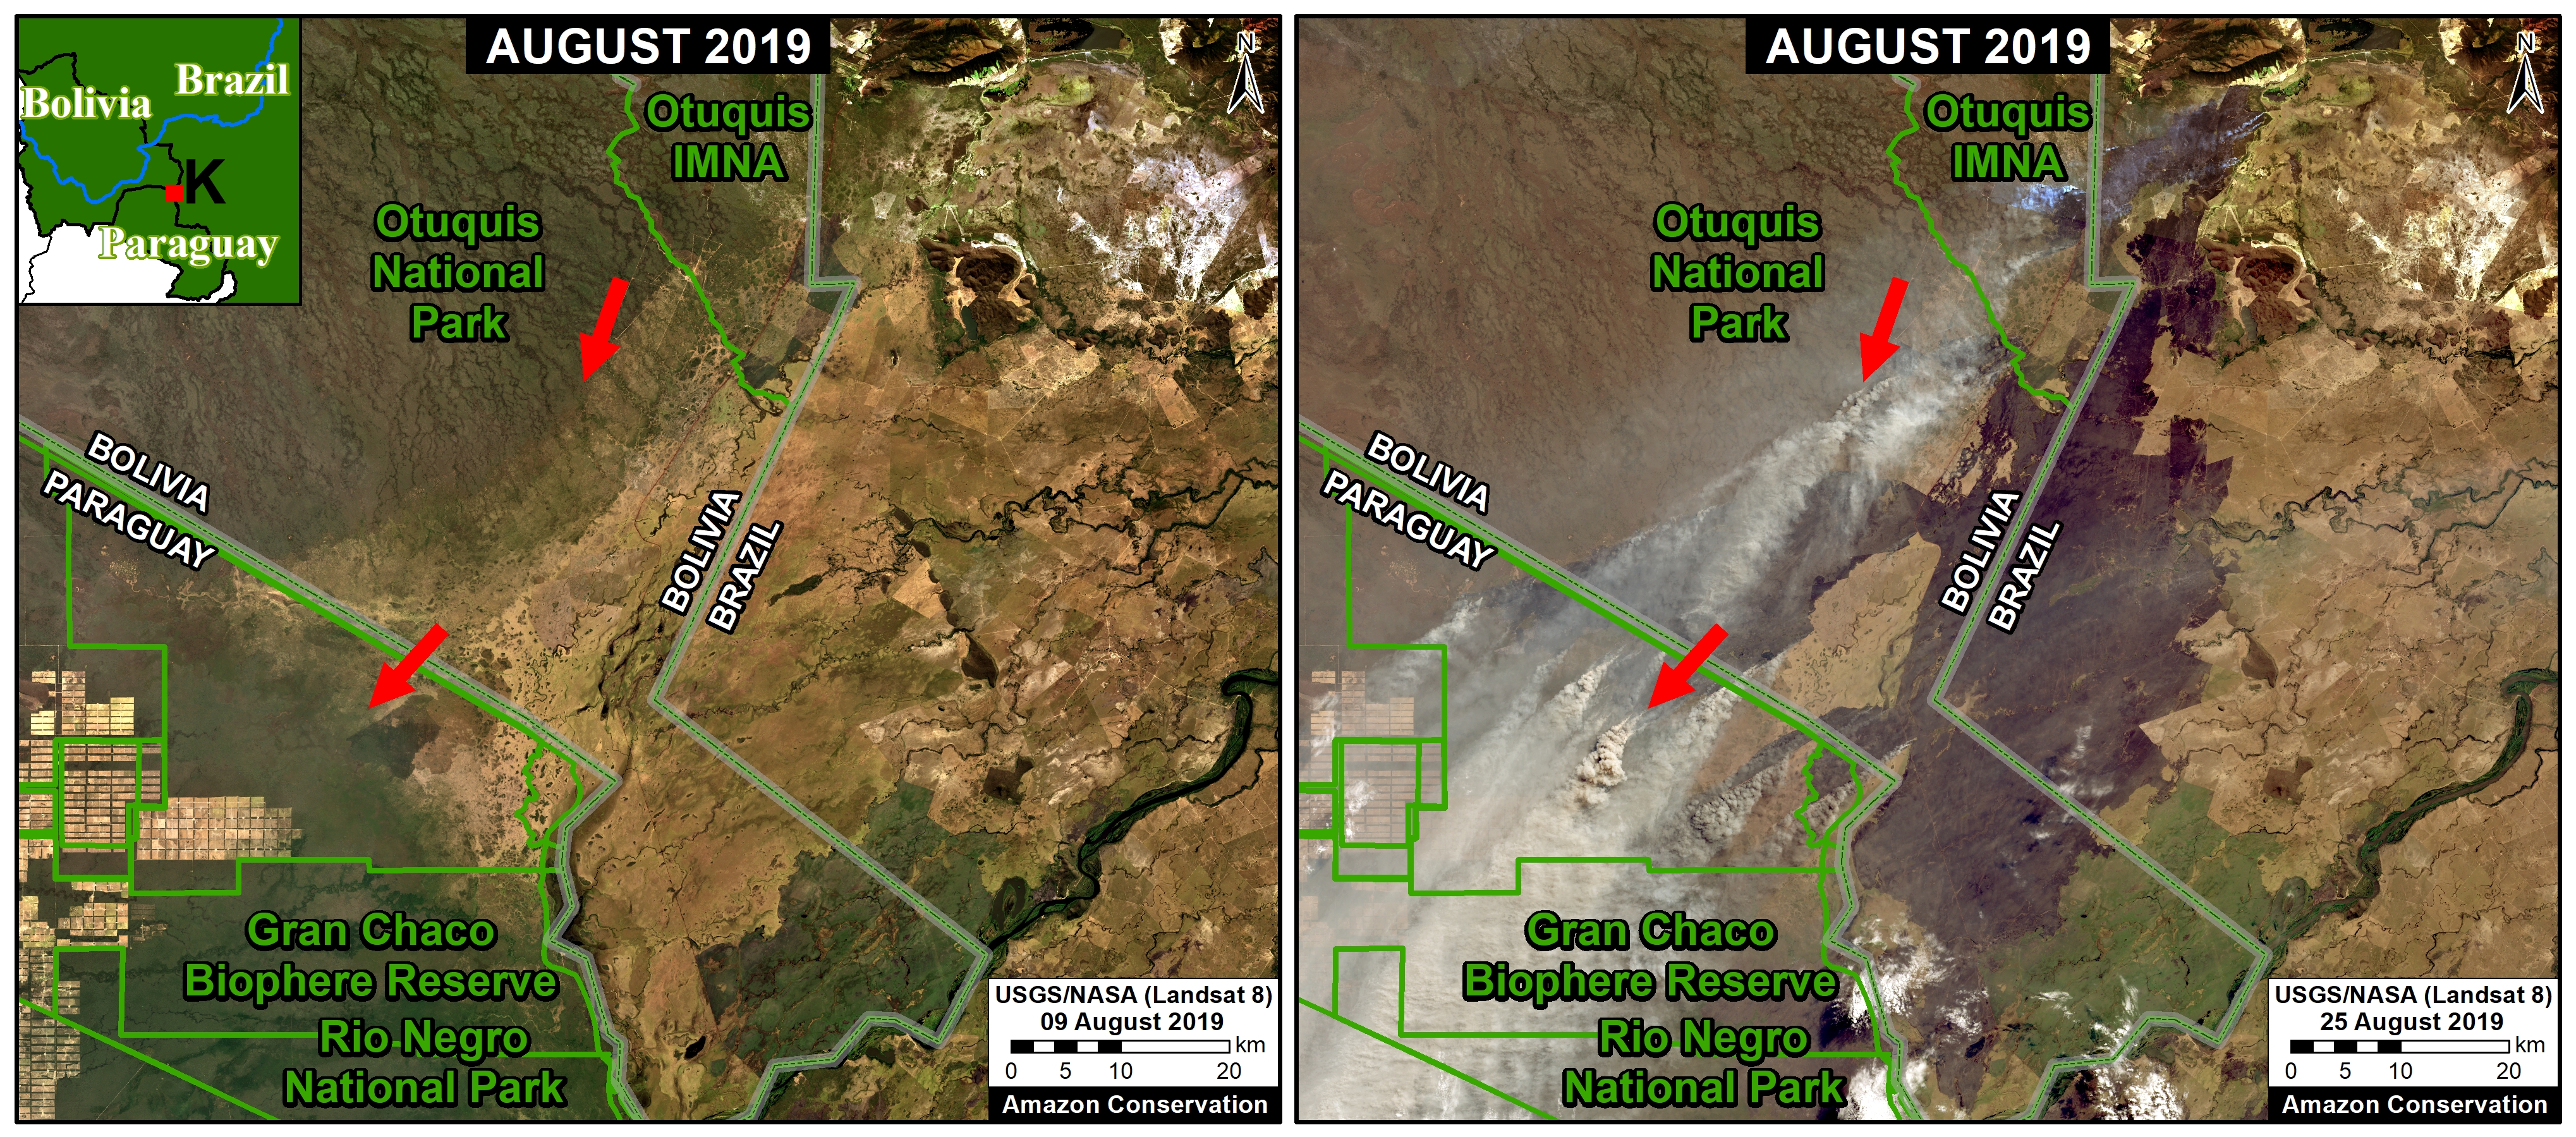
k - In the Bolivian Amazon, we have detected 35 major fires, mostly in the departments of Beni and Santa Cruz. In Beni, these fires have impacted 19,000 hectares (48,000 acres) of natural savanna ecosystems.
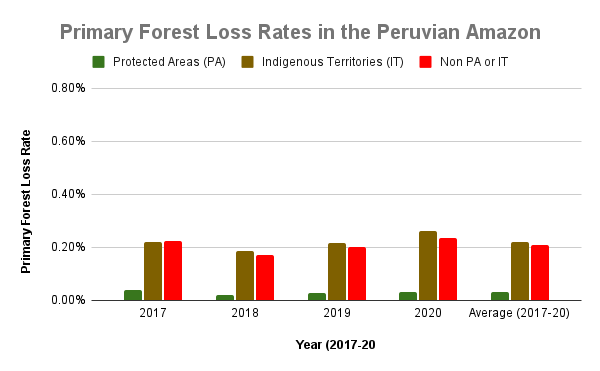
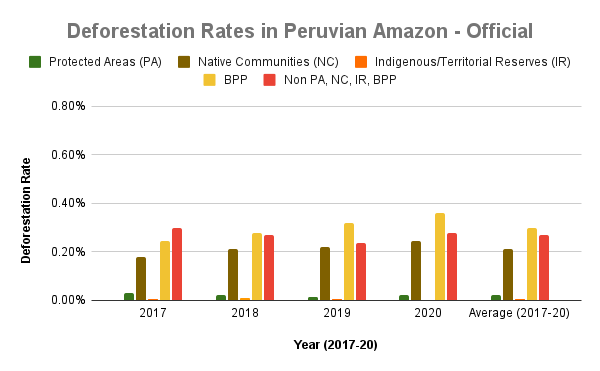
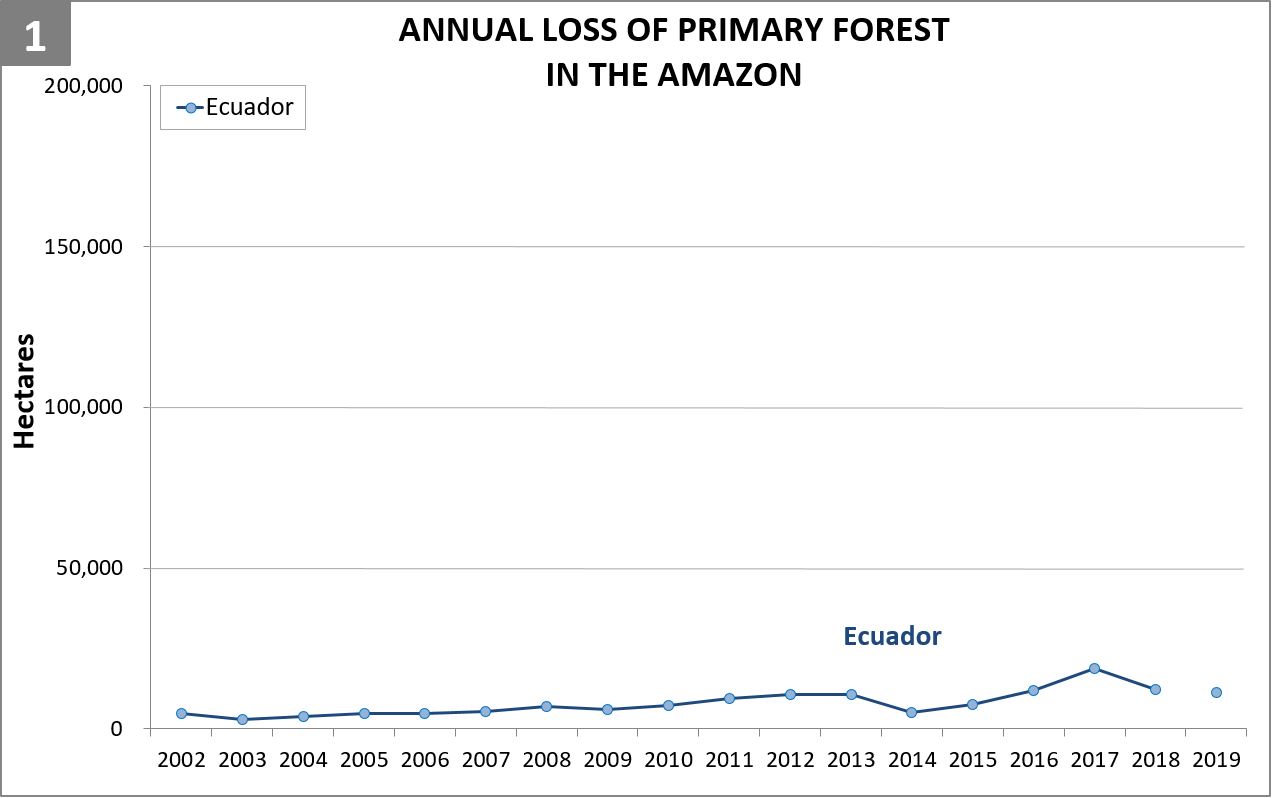
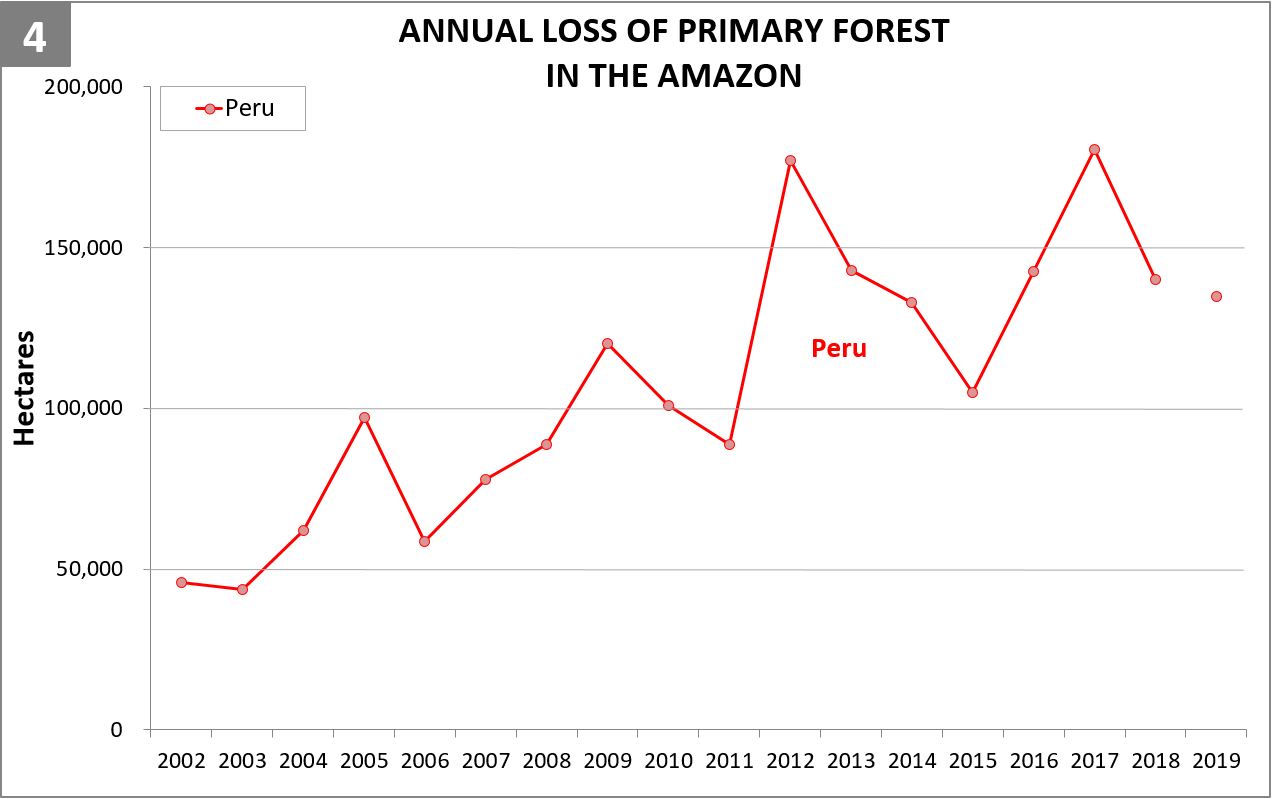
k - In the Peruvian Amazon, most of the major fires have been in the higher elevation grasslands, impacting over 2,600 hectares (6,500 acres) in the upper reaches of the watershed.
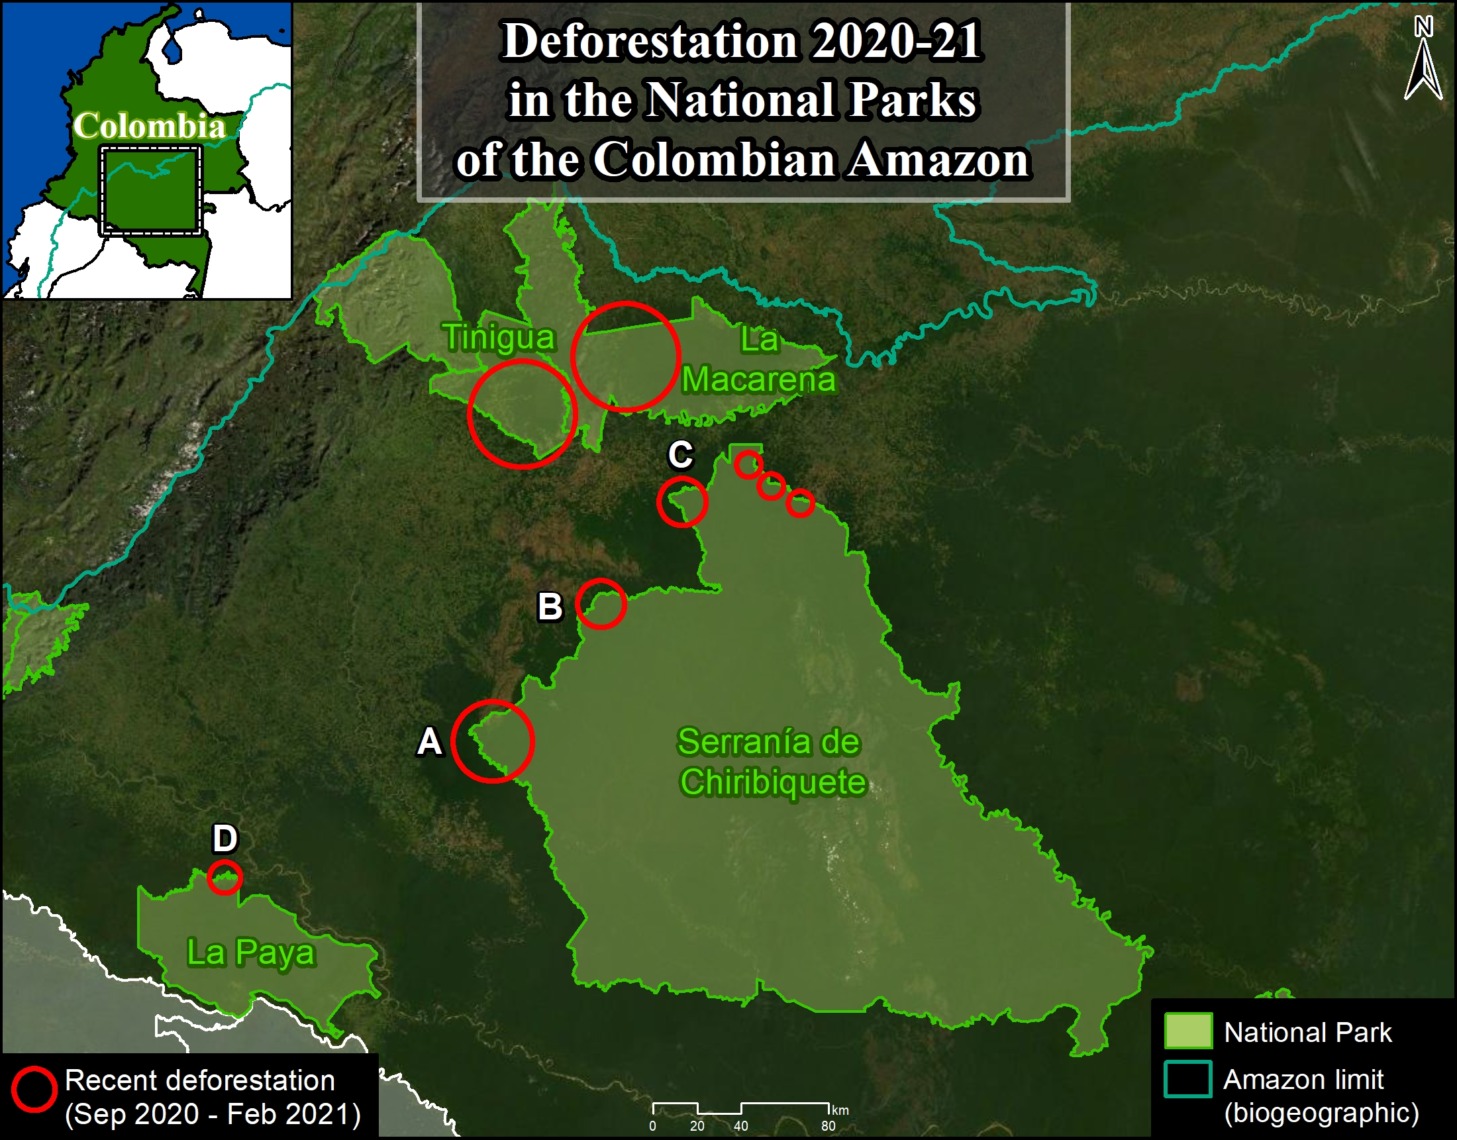
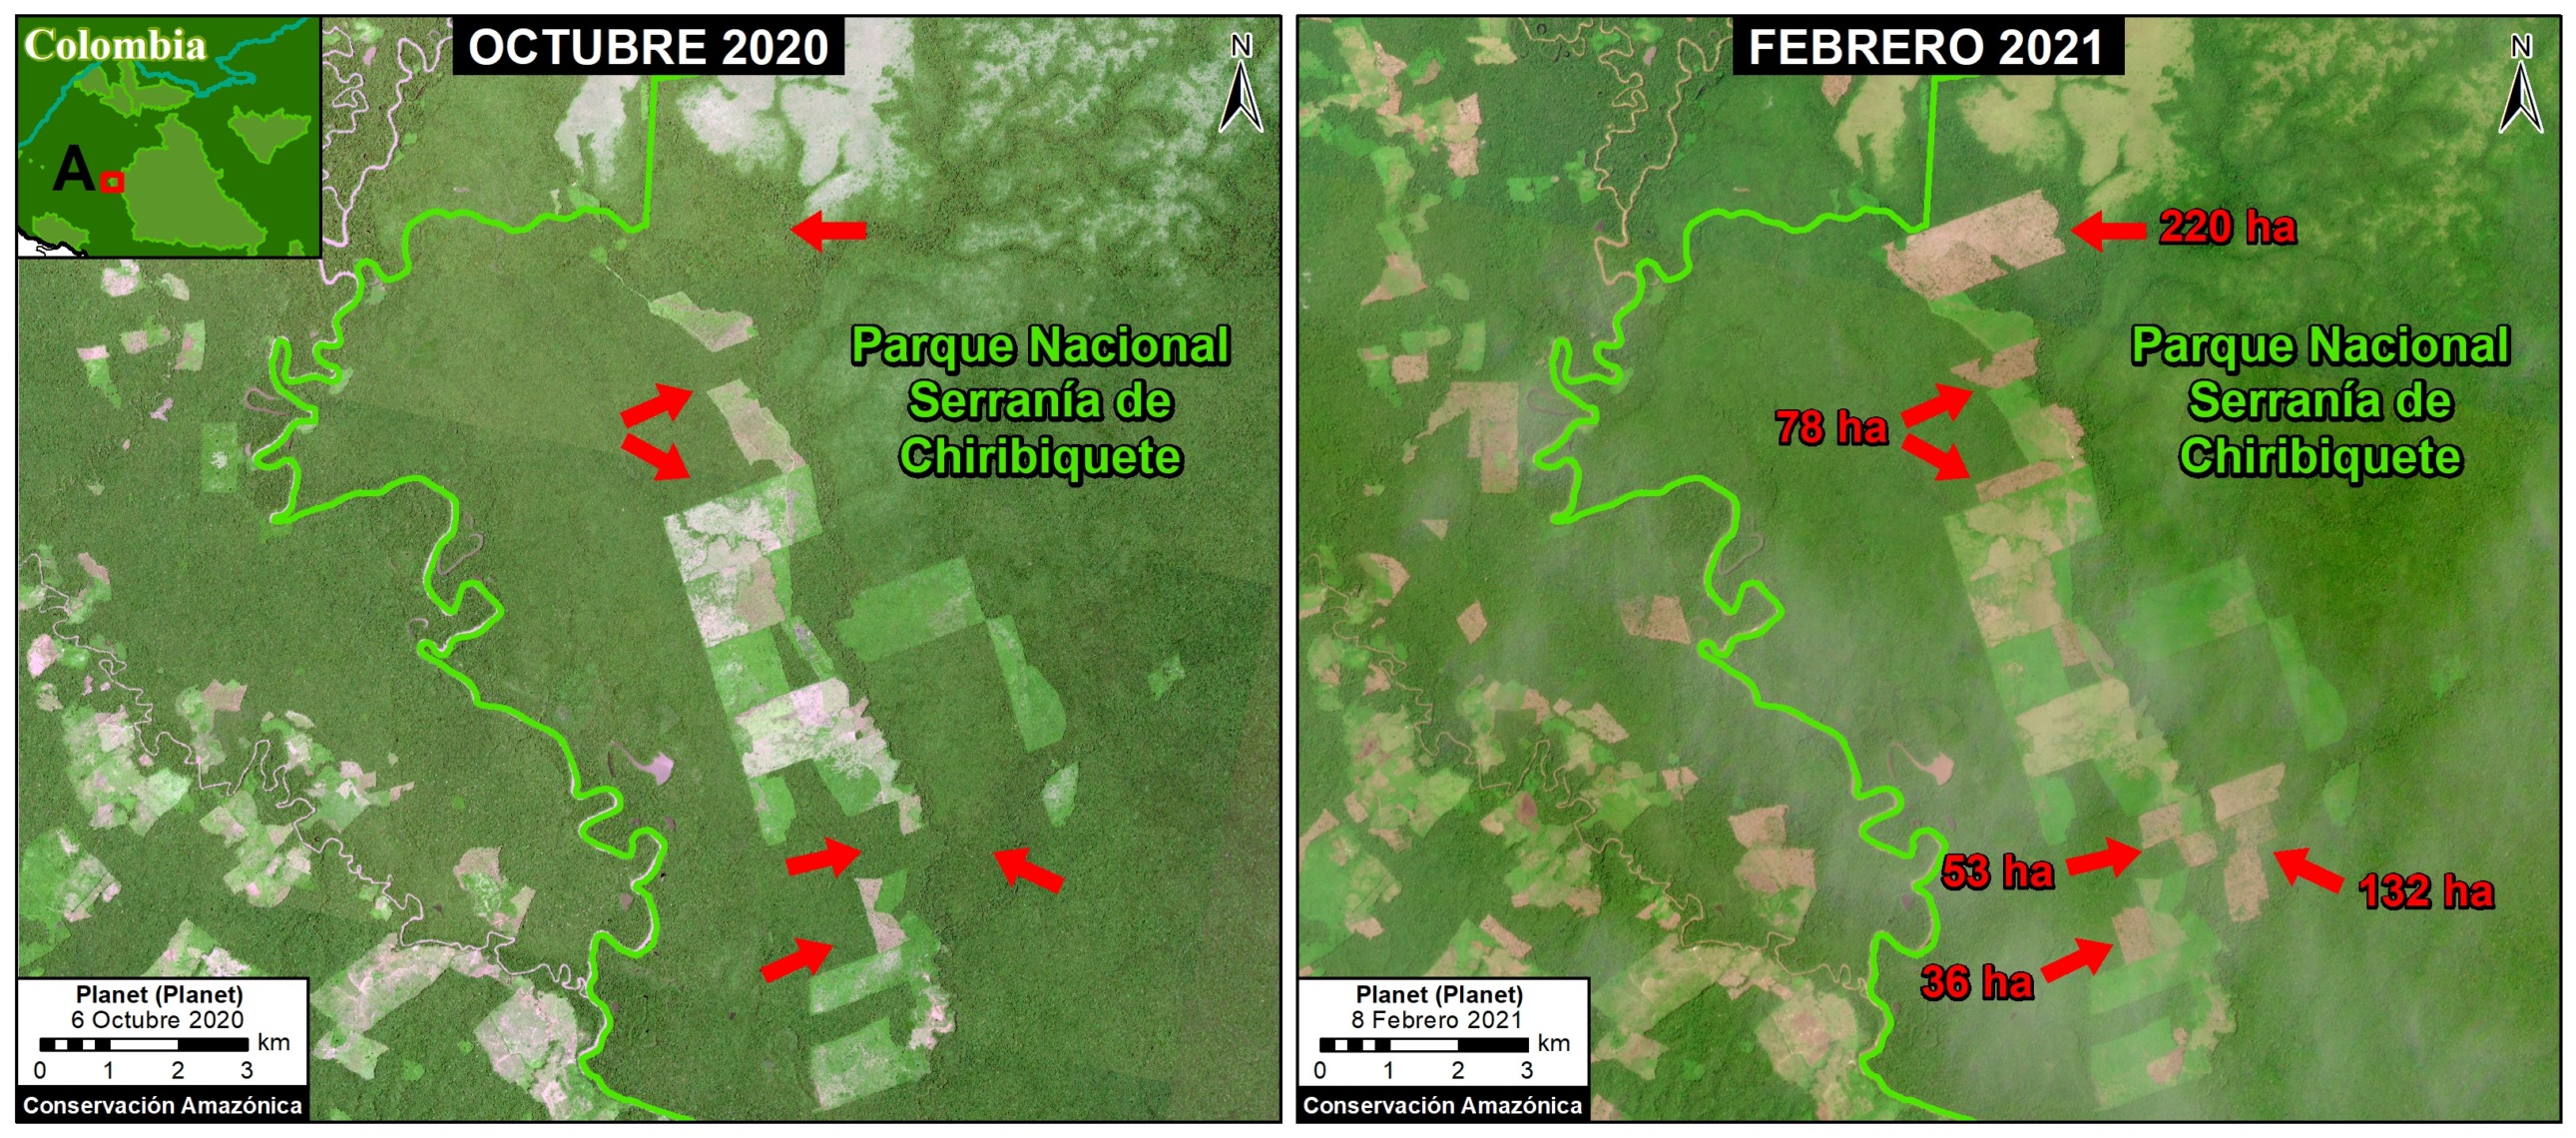
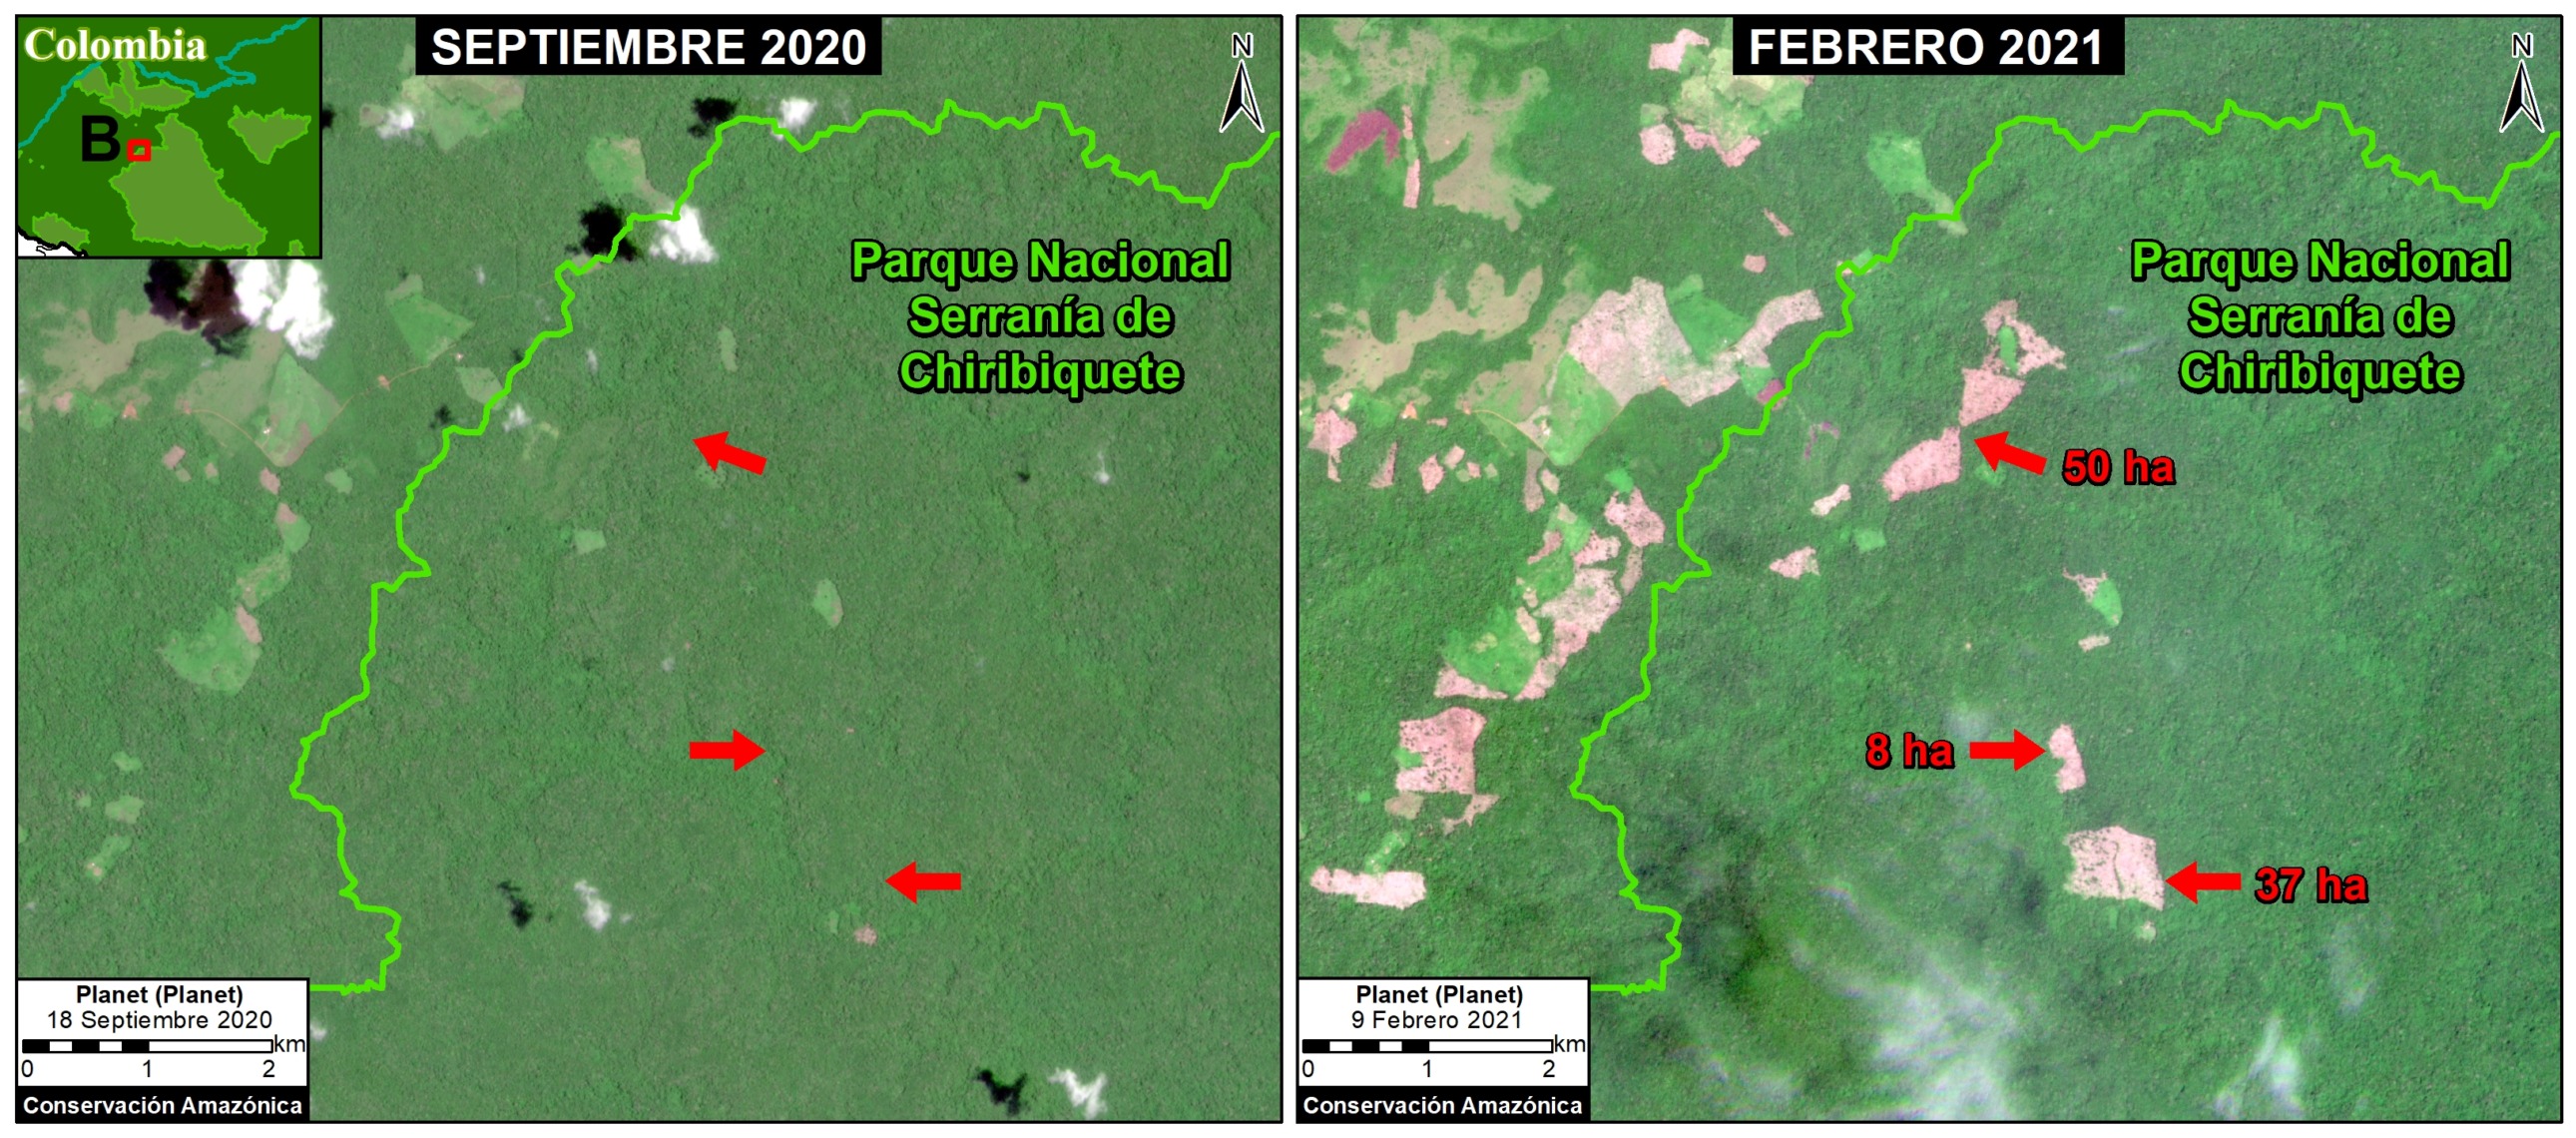
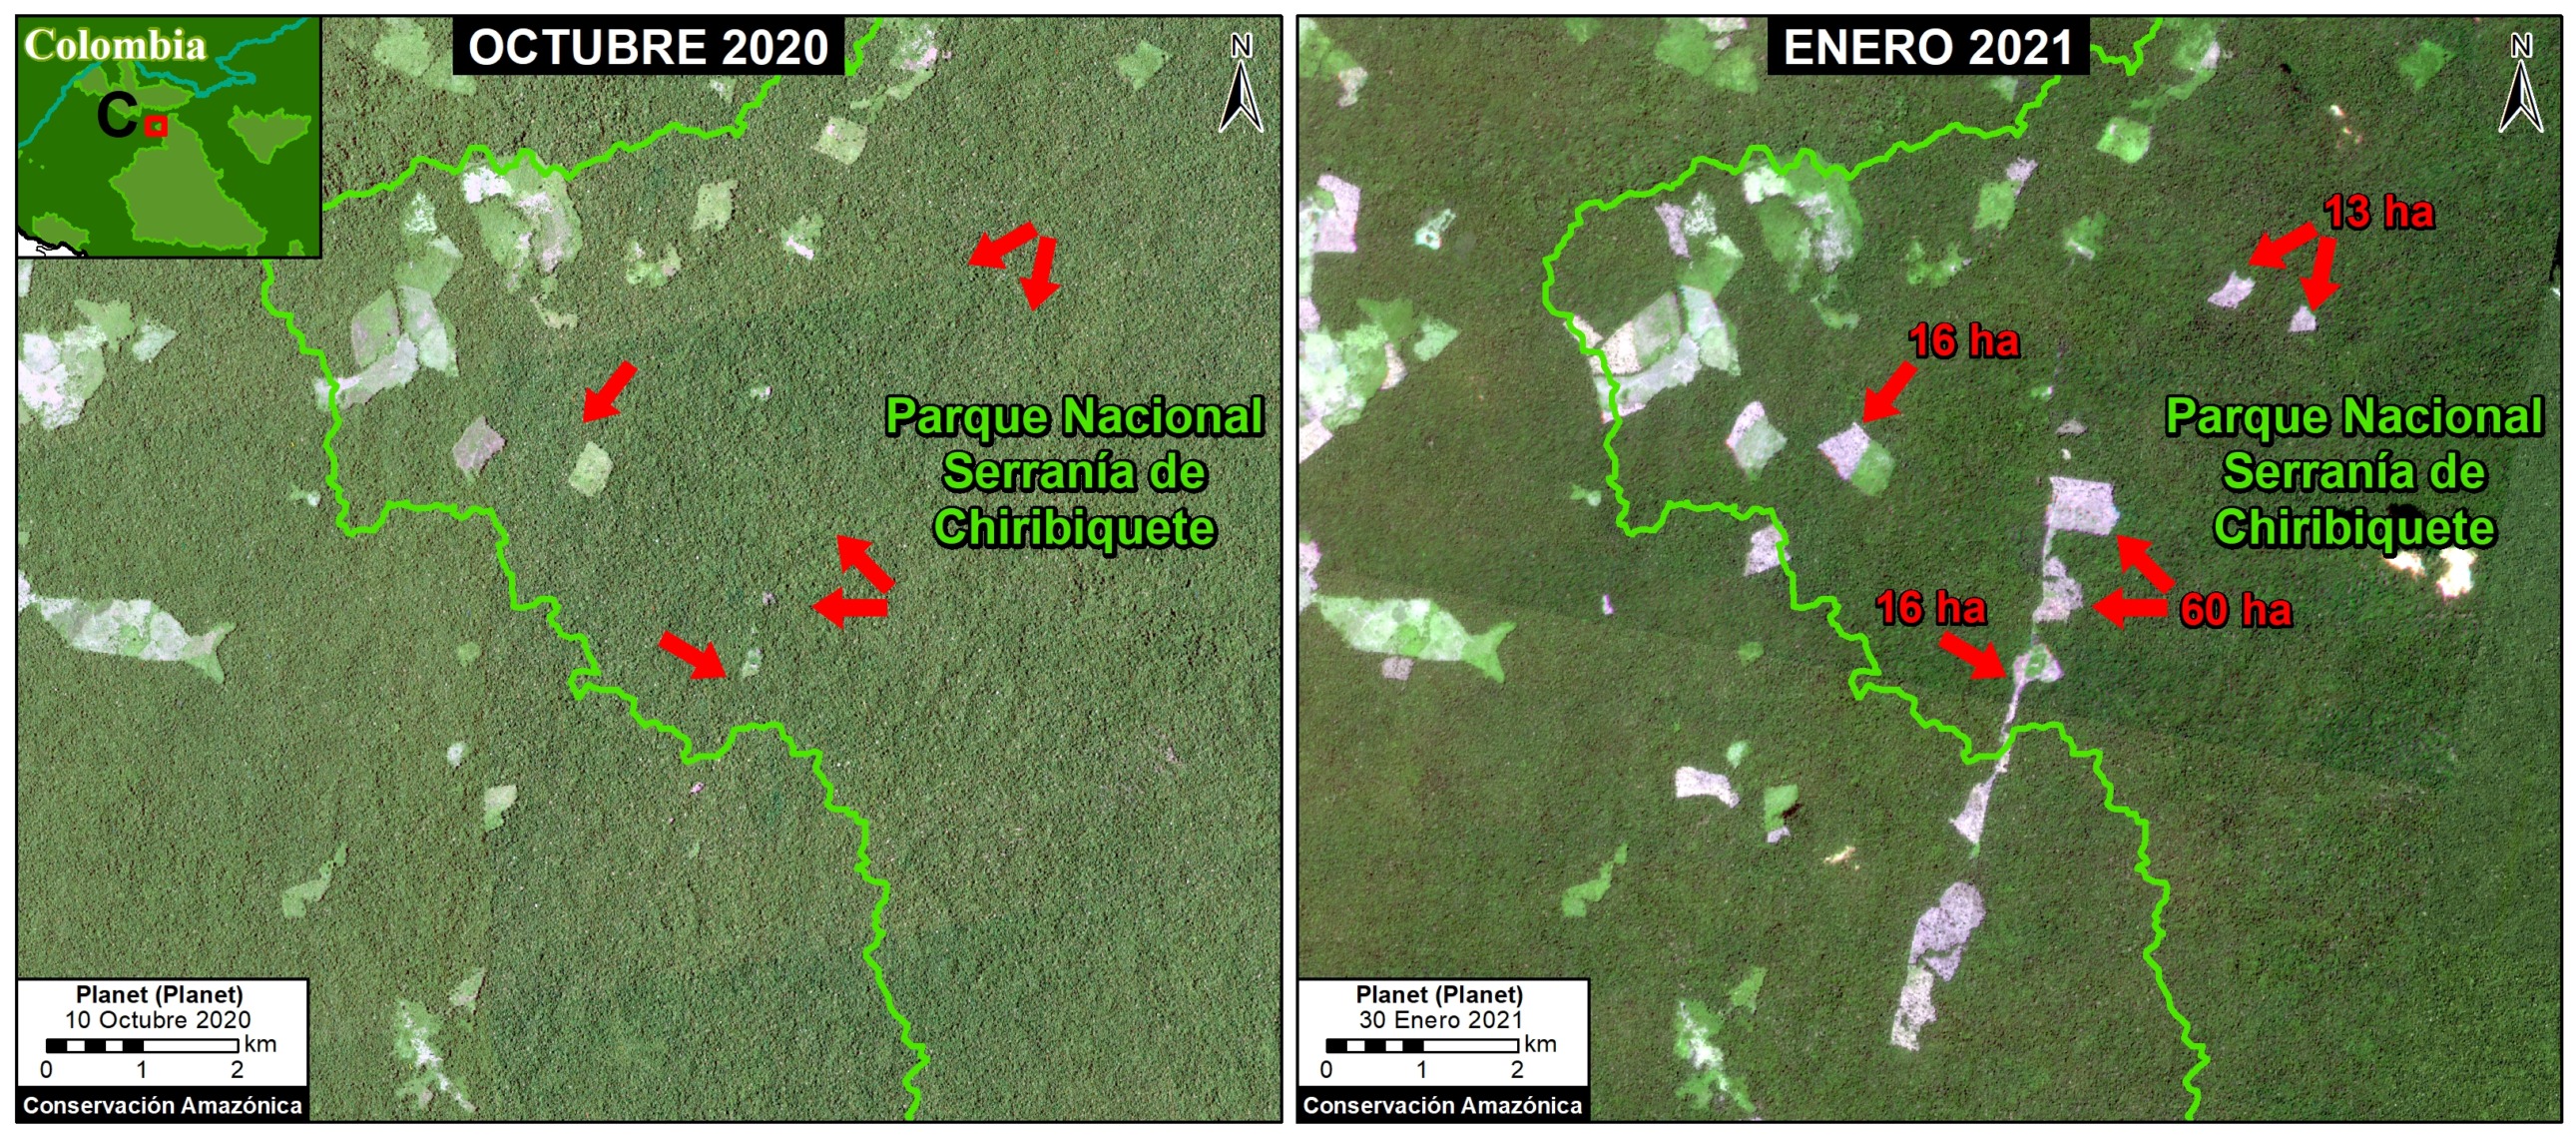
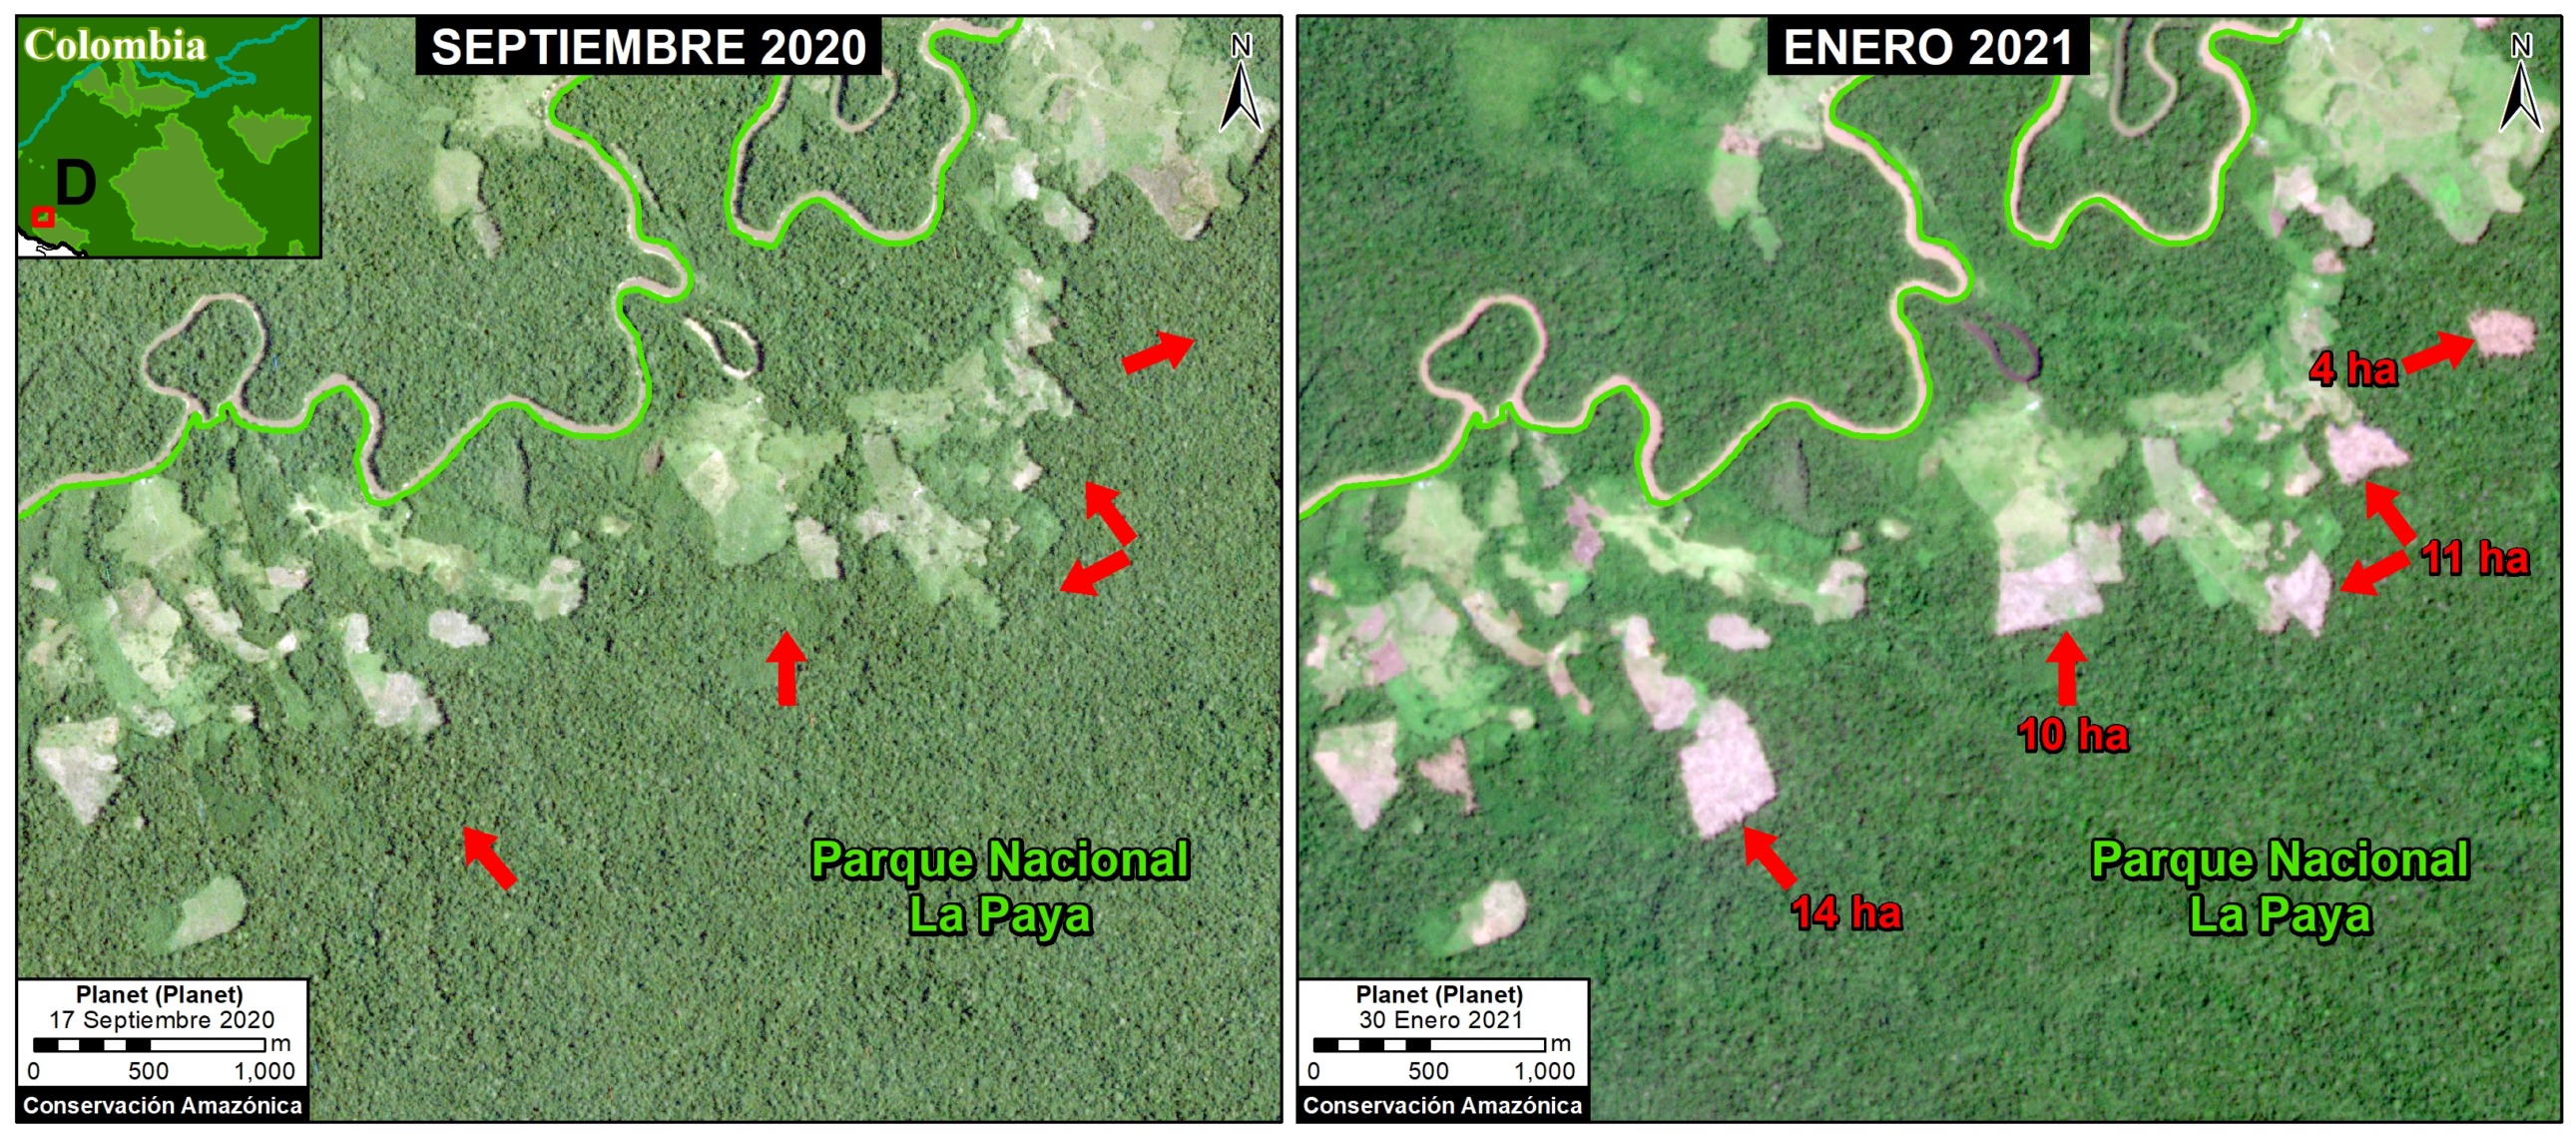
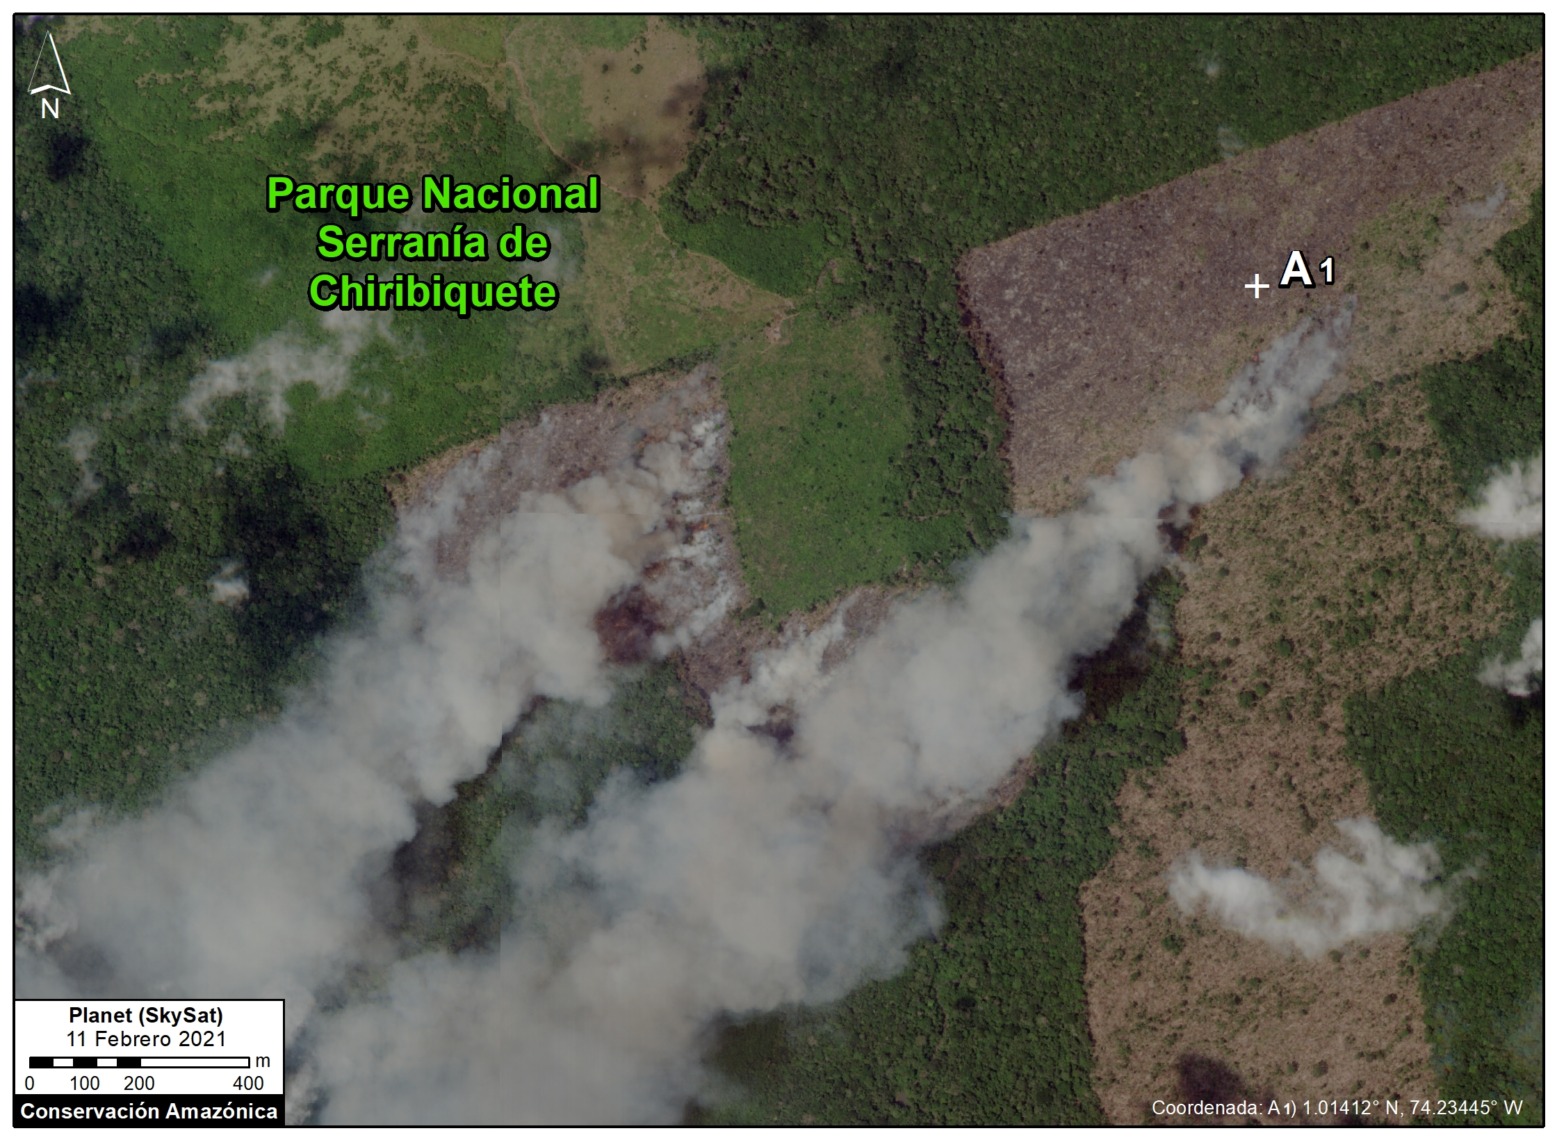
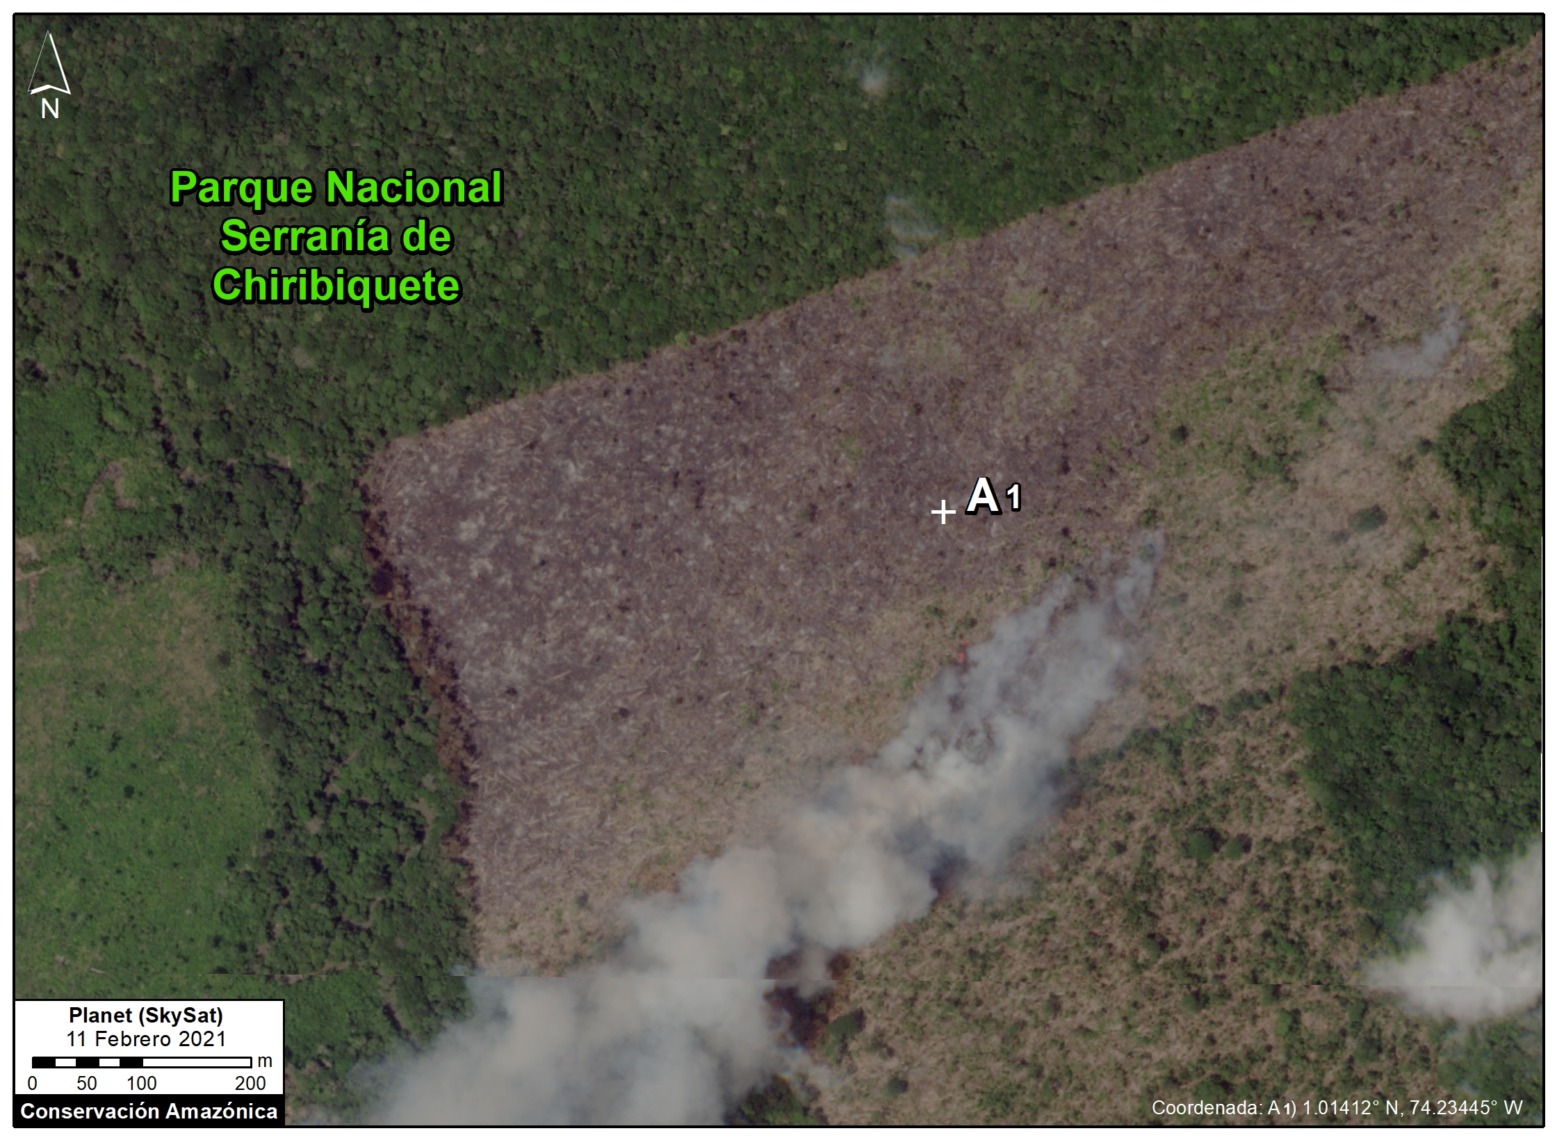
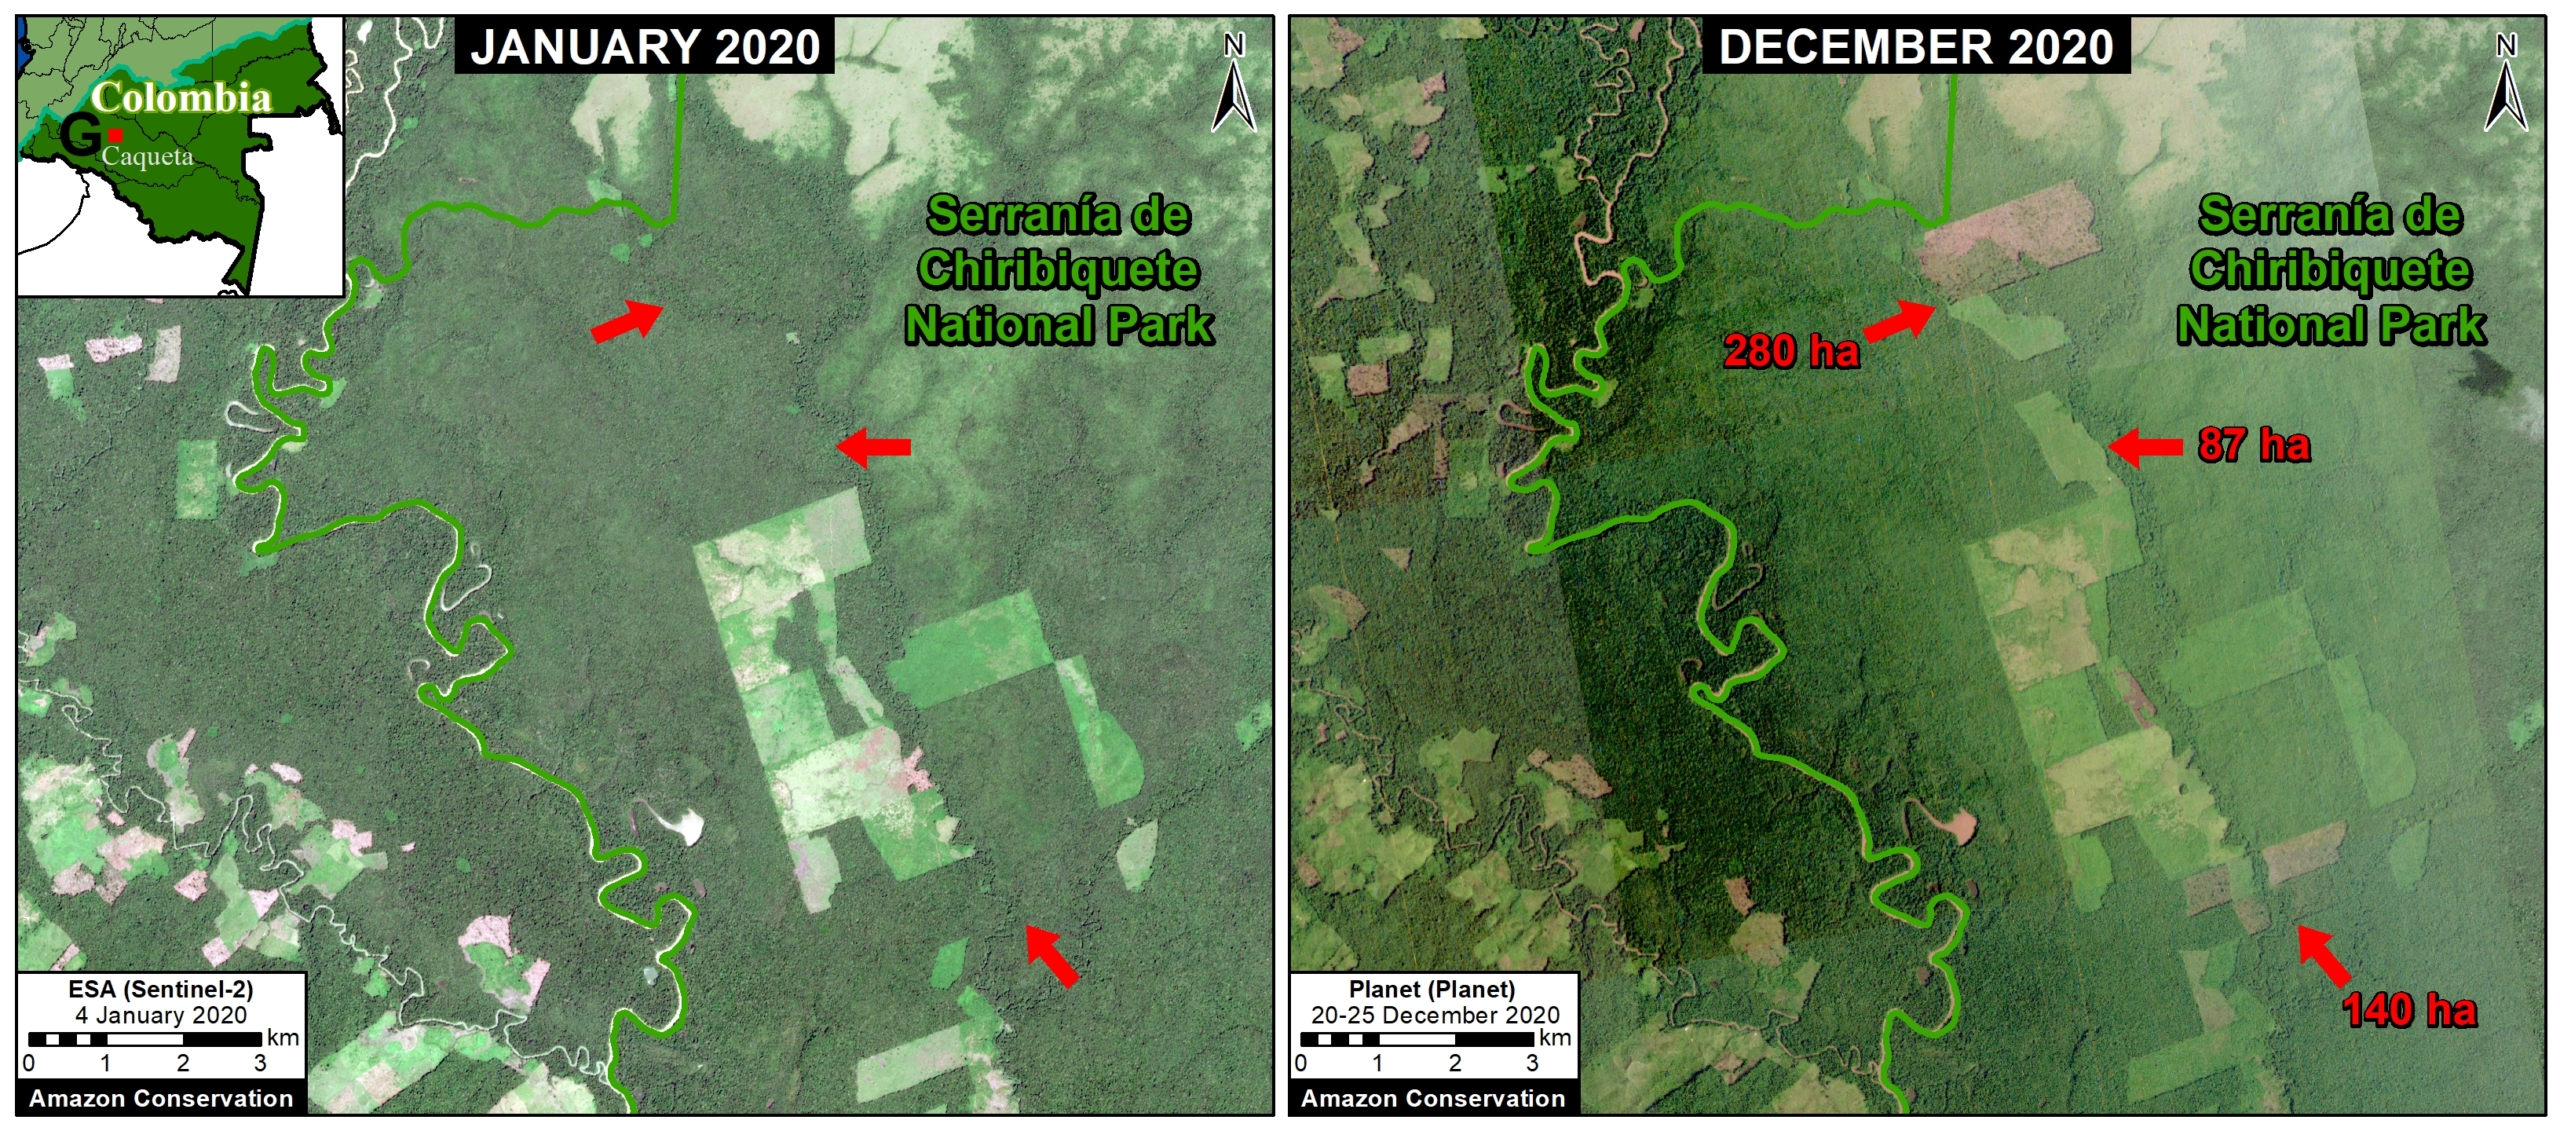
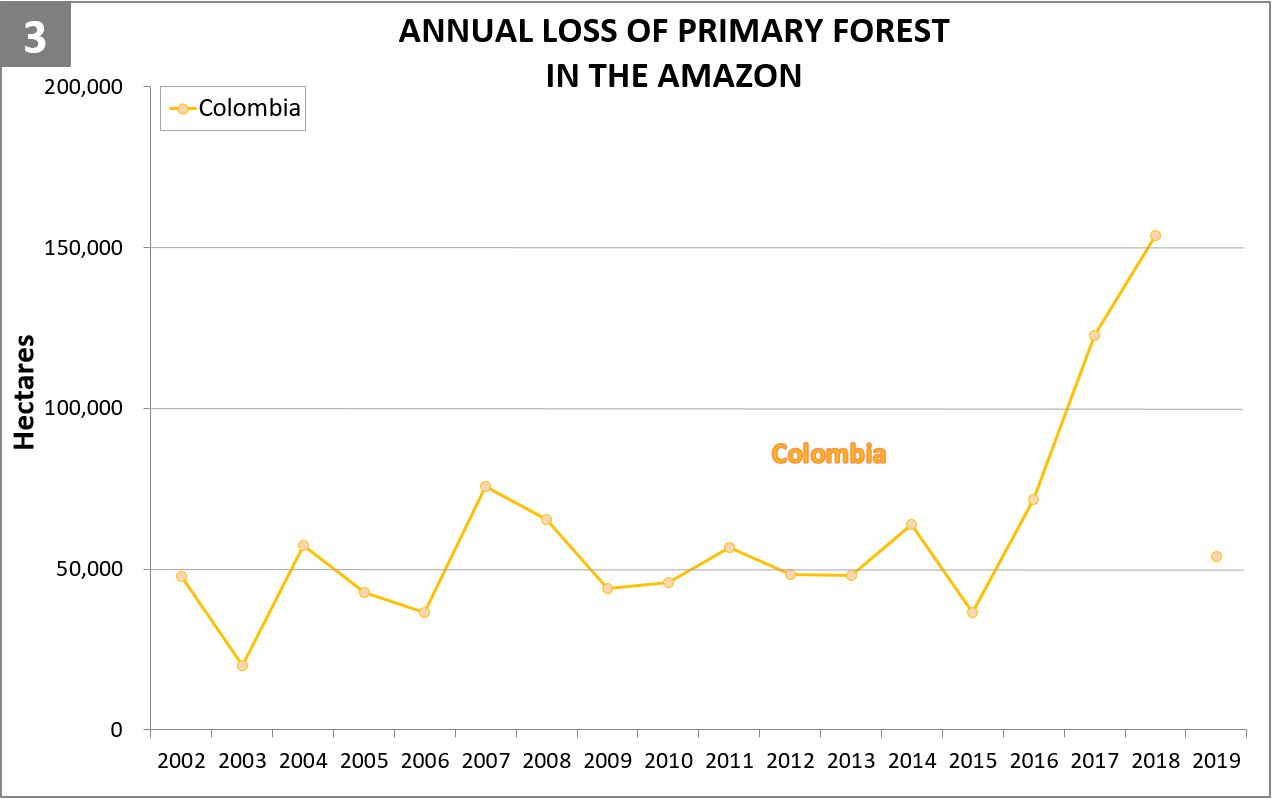
j - In the Colombian Amazon, we detected several major fires during that region’s peak season of February-March.
Below, we present our updated major Amazon fires Base Map, along with more detailed information for the Brazilian Amazon.
*In a new and unique approach, the app combines data from both the atmosphere (aerosol emissions in smoke) and the ground (heat anomaly alerts) to quickly and precisely detect major Amazon fires (see App Background below).
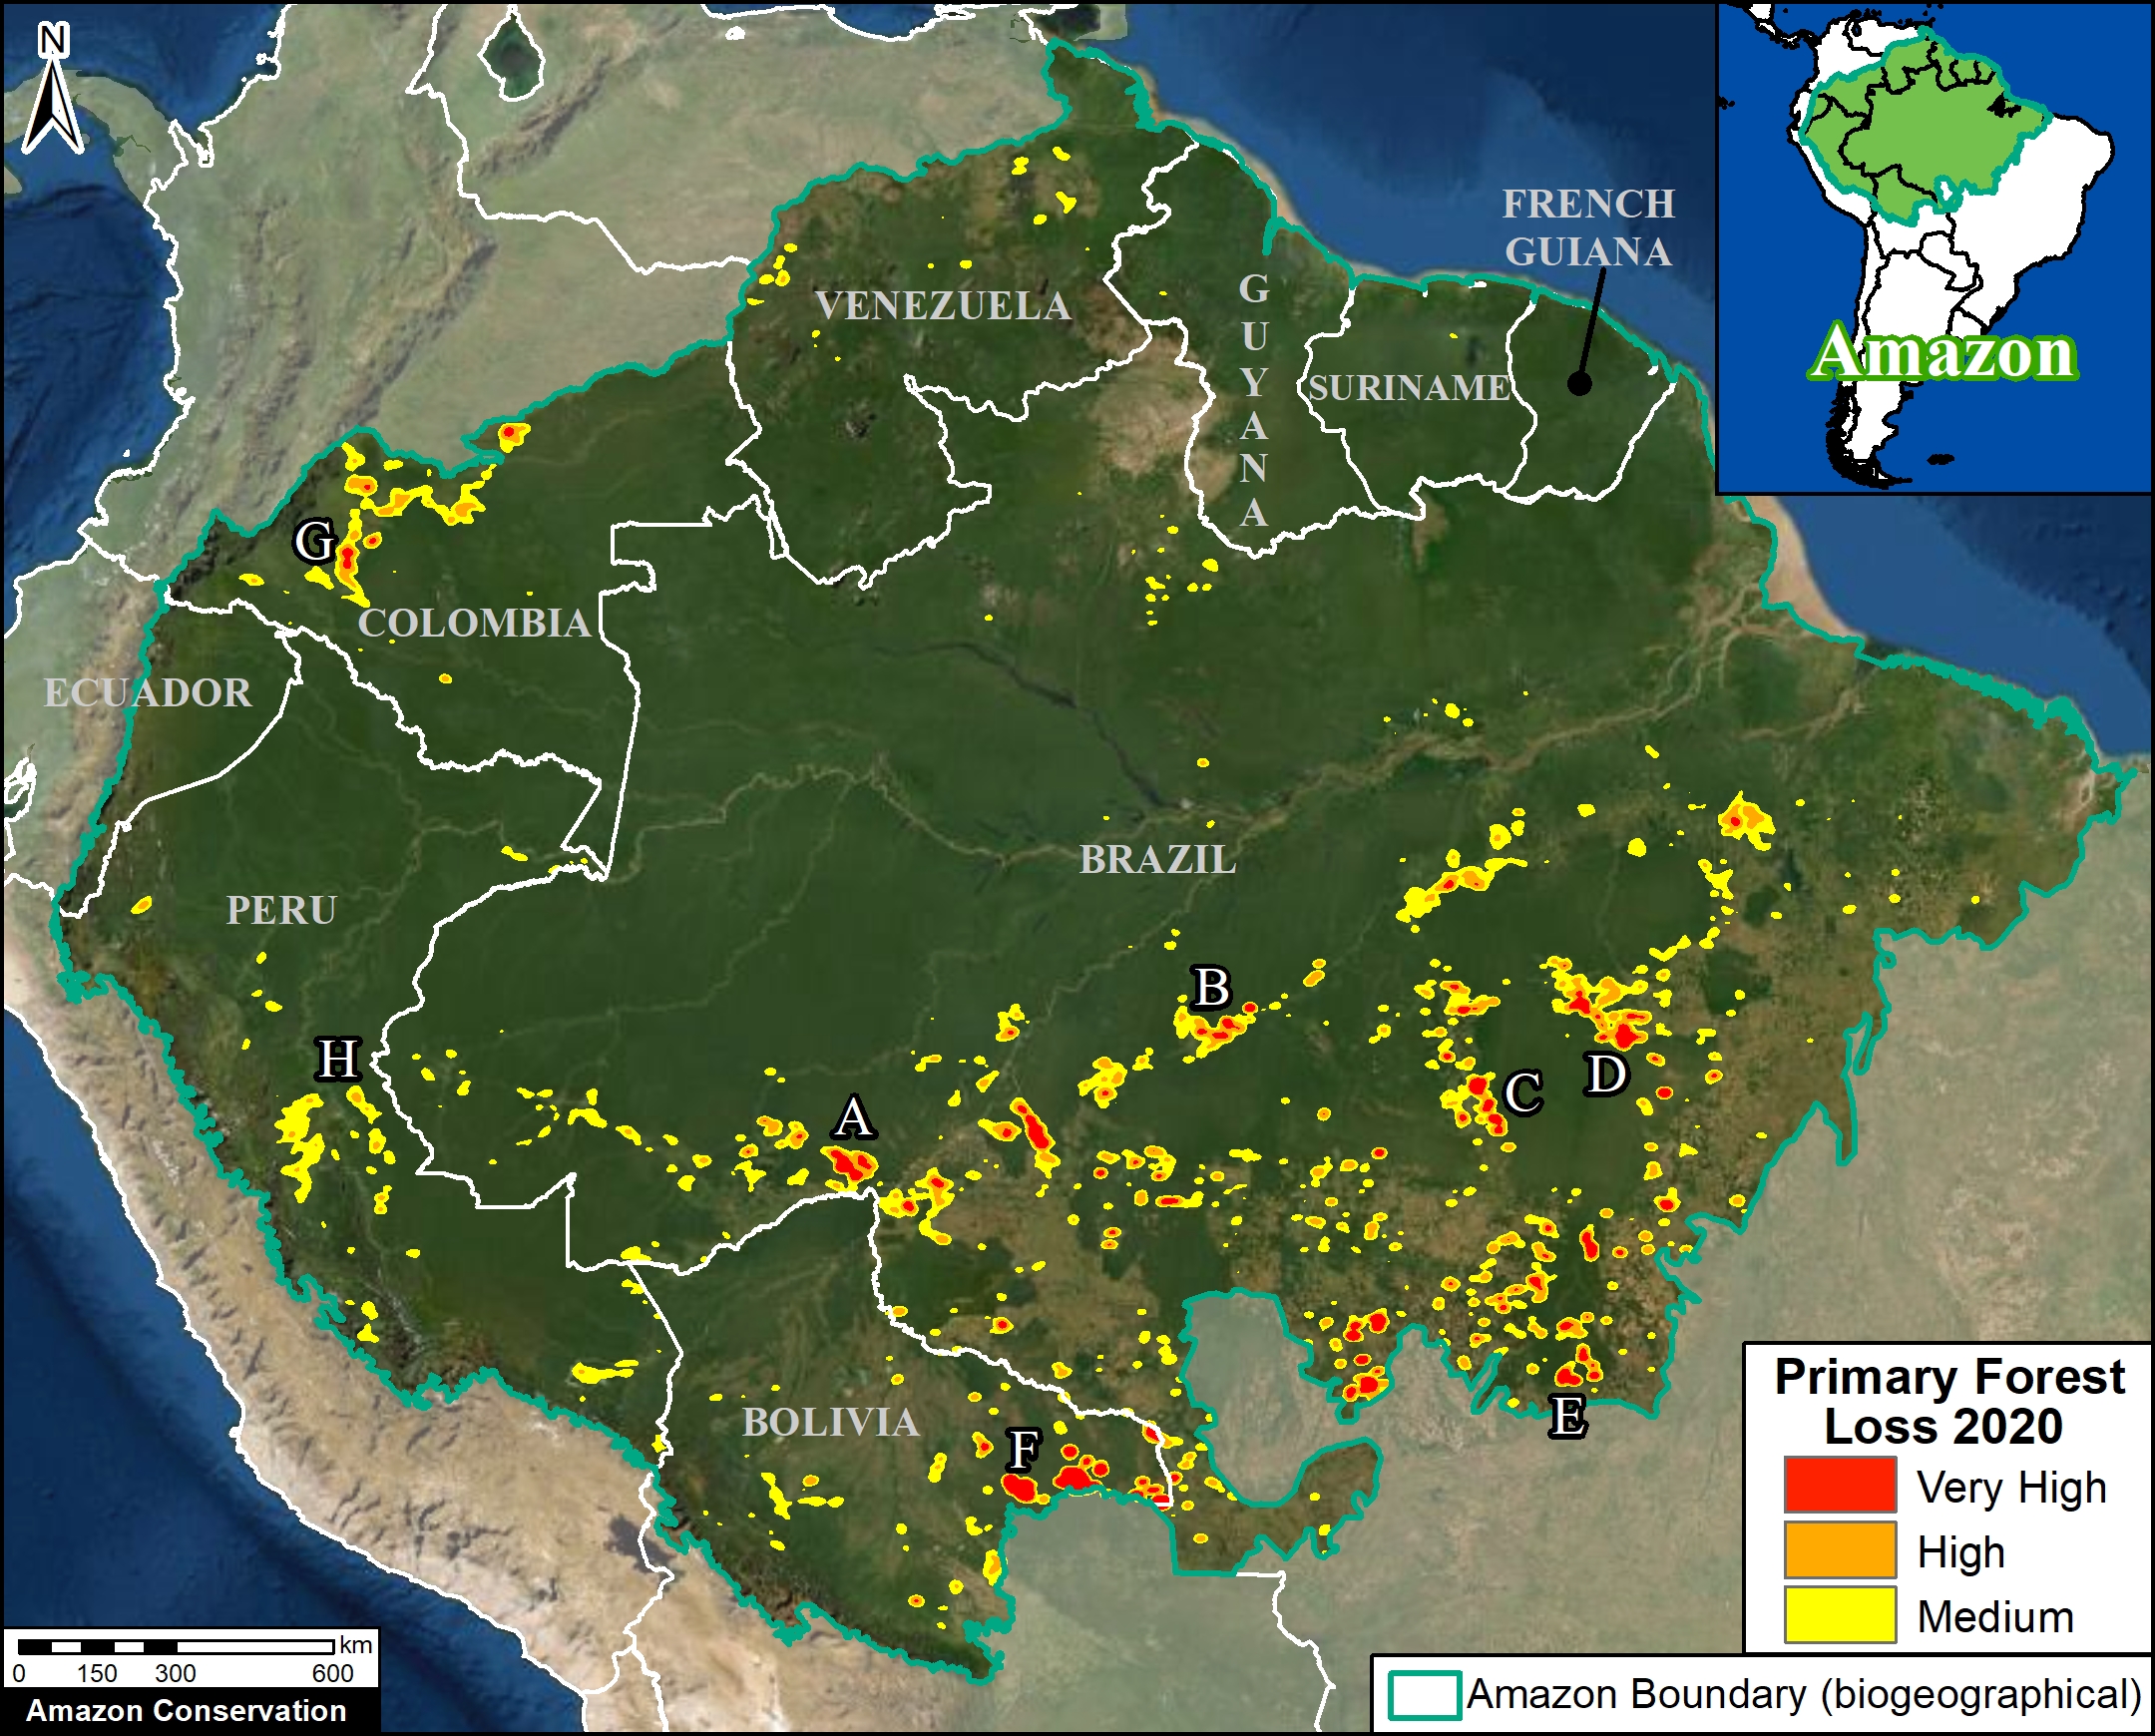
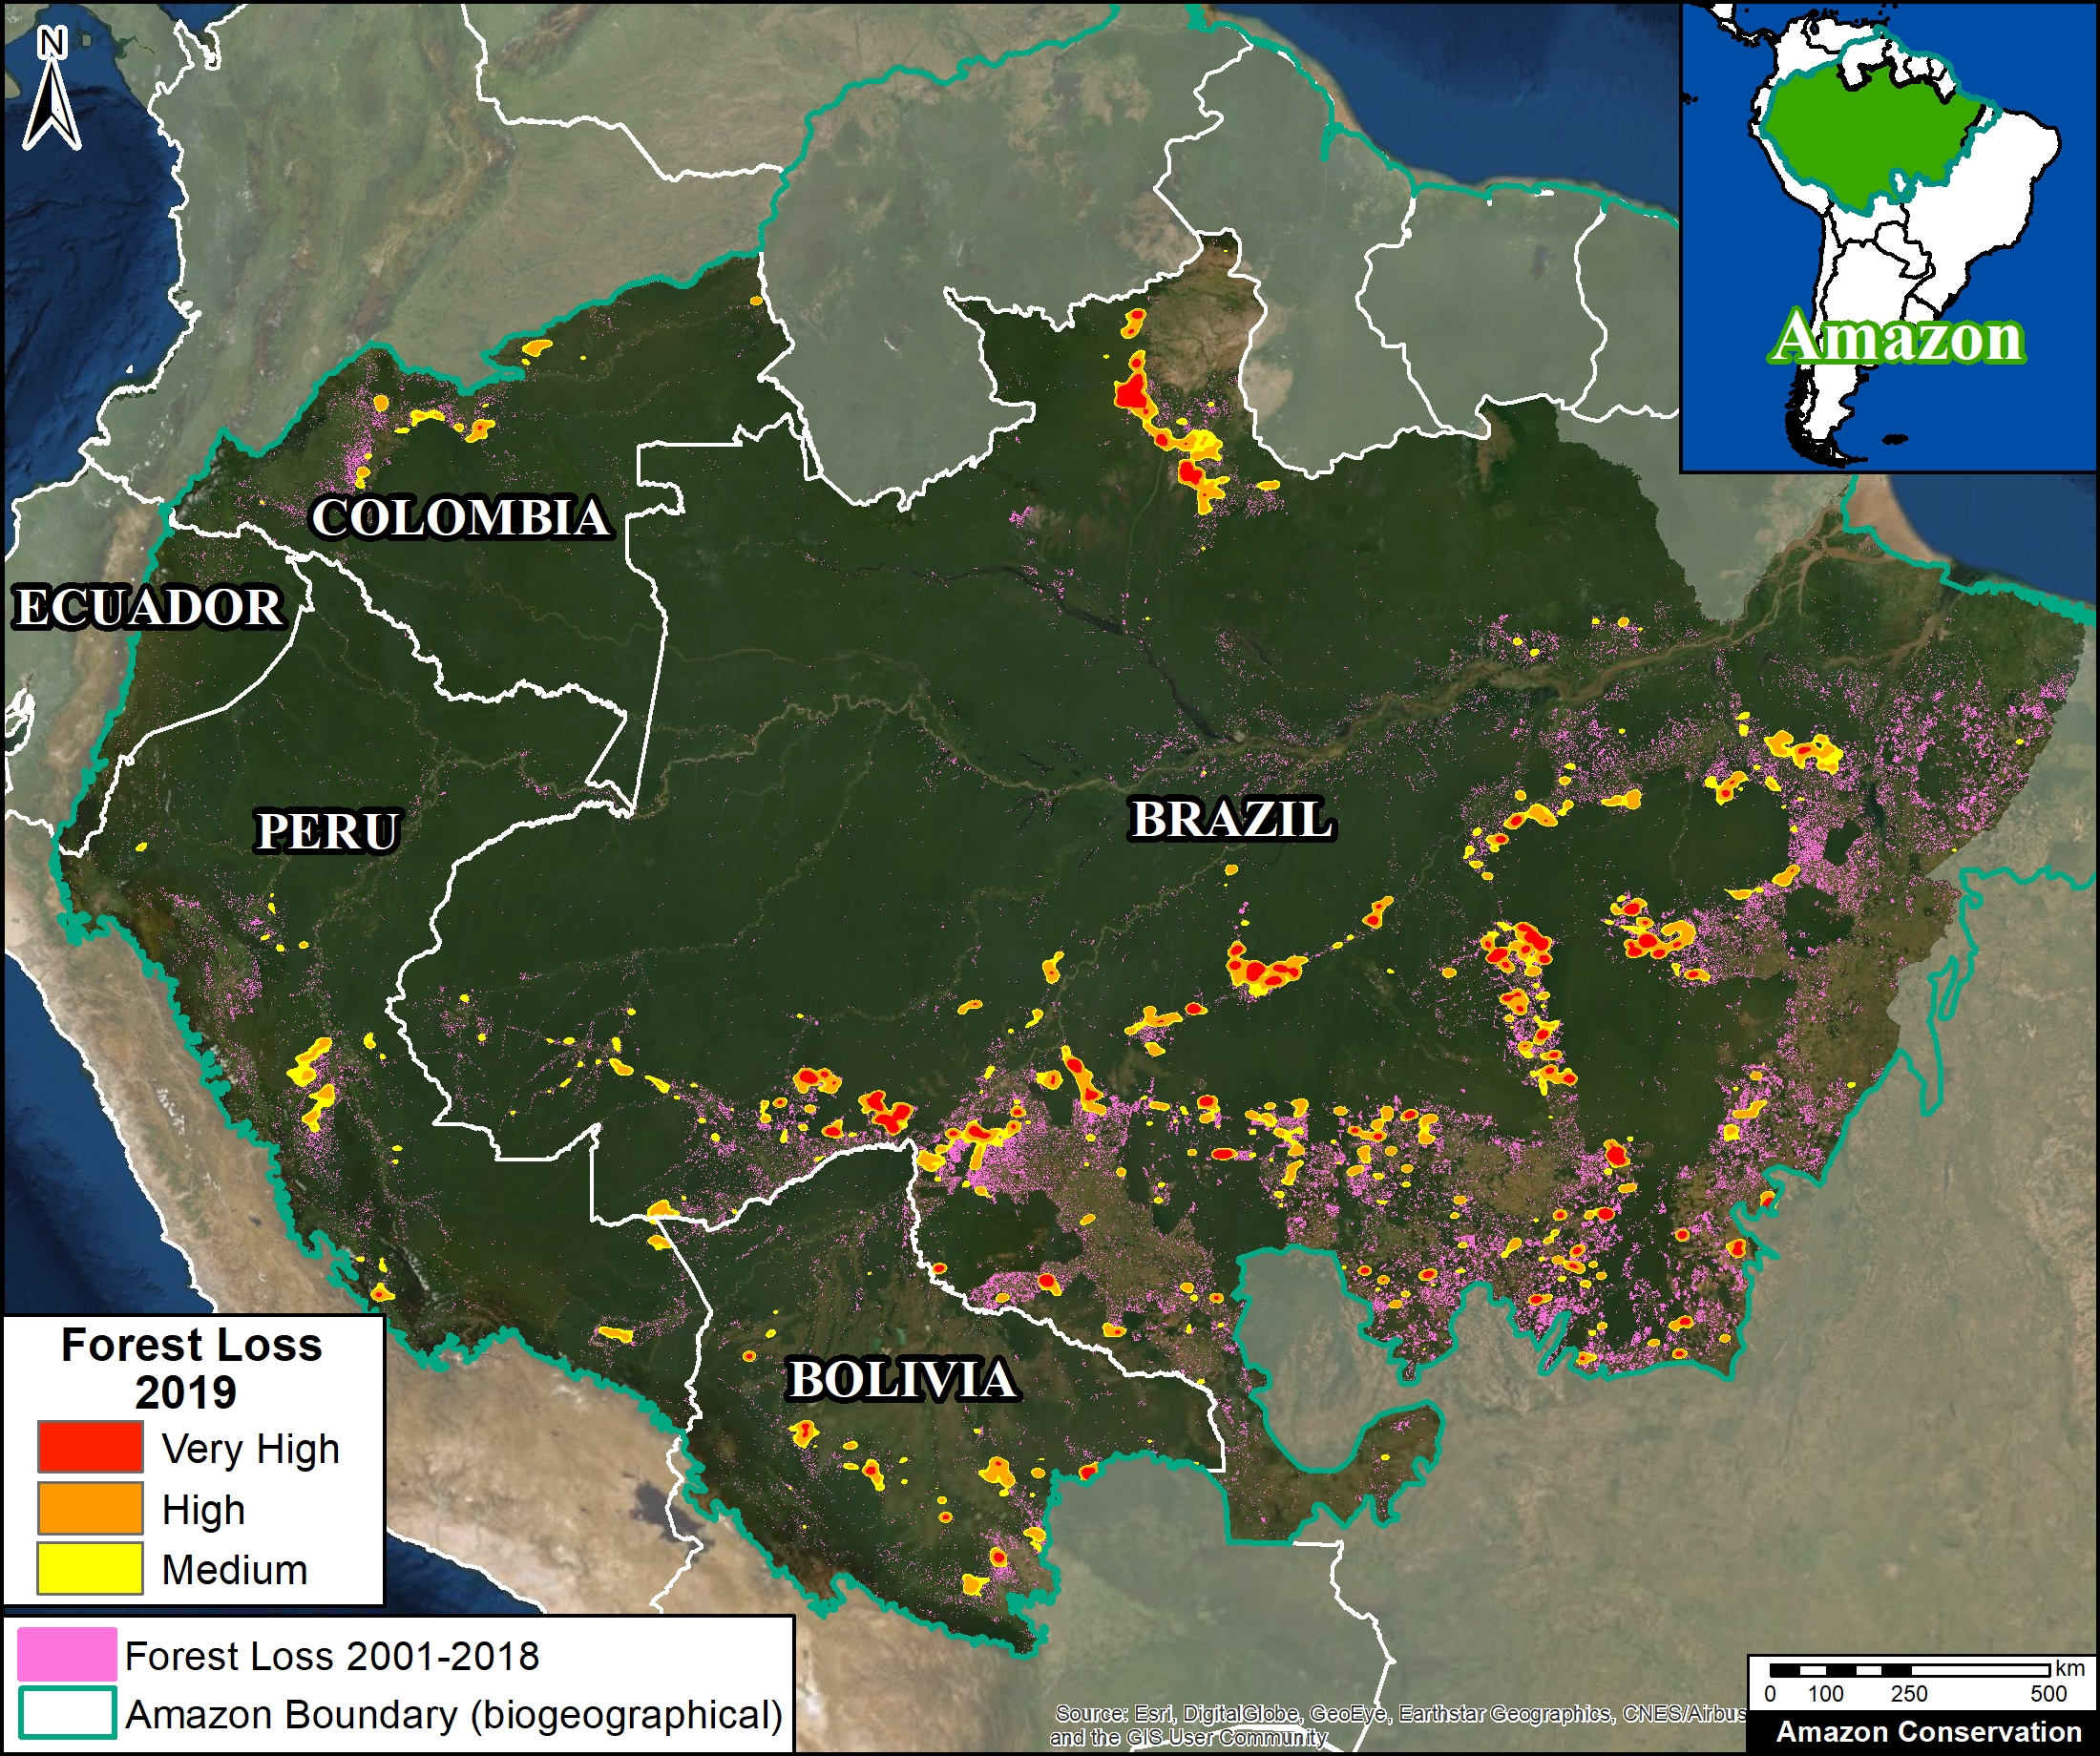
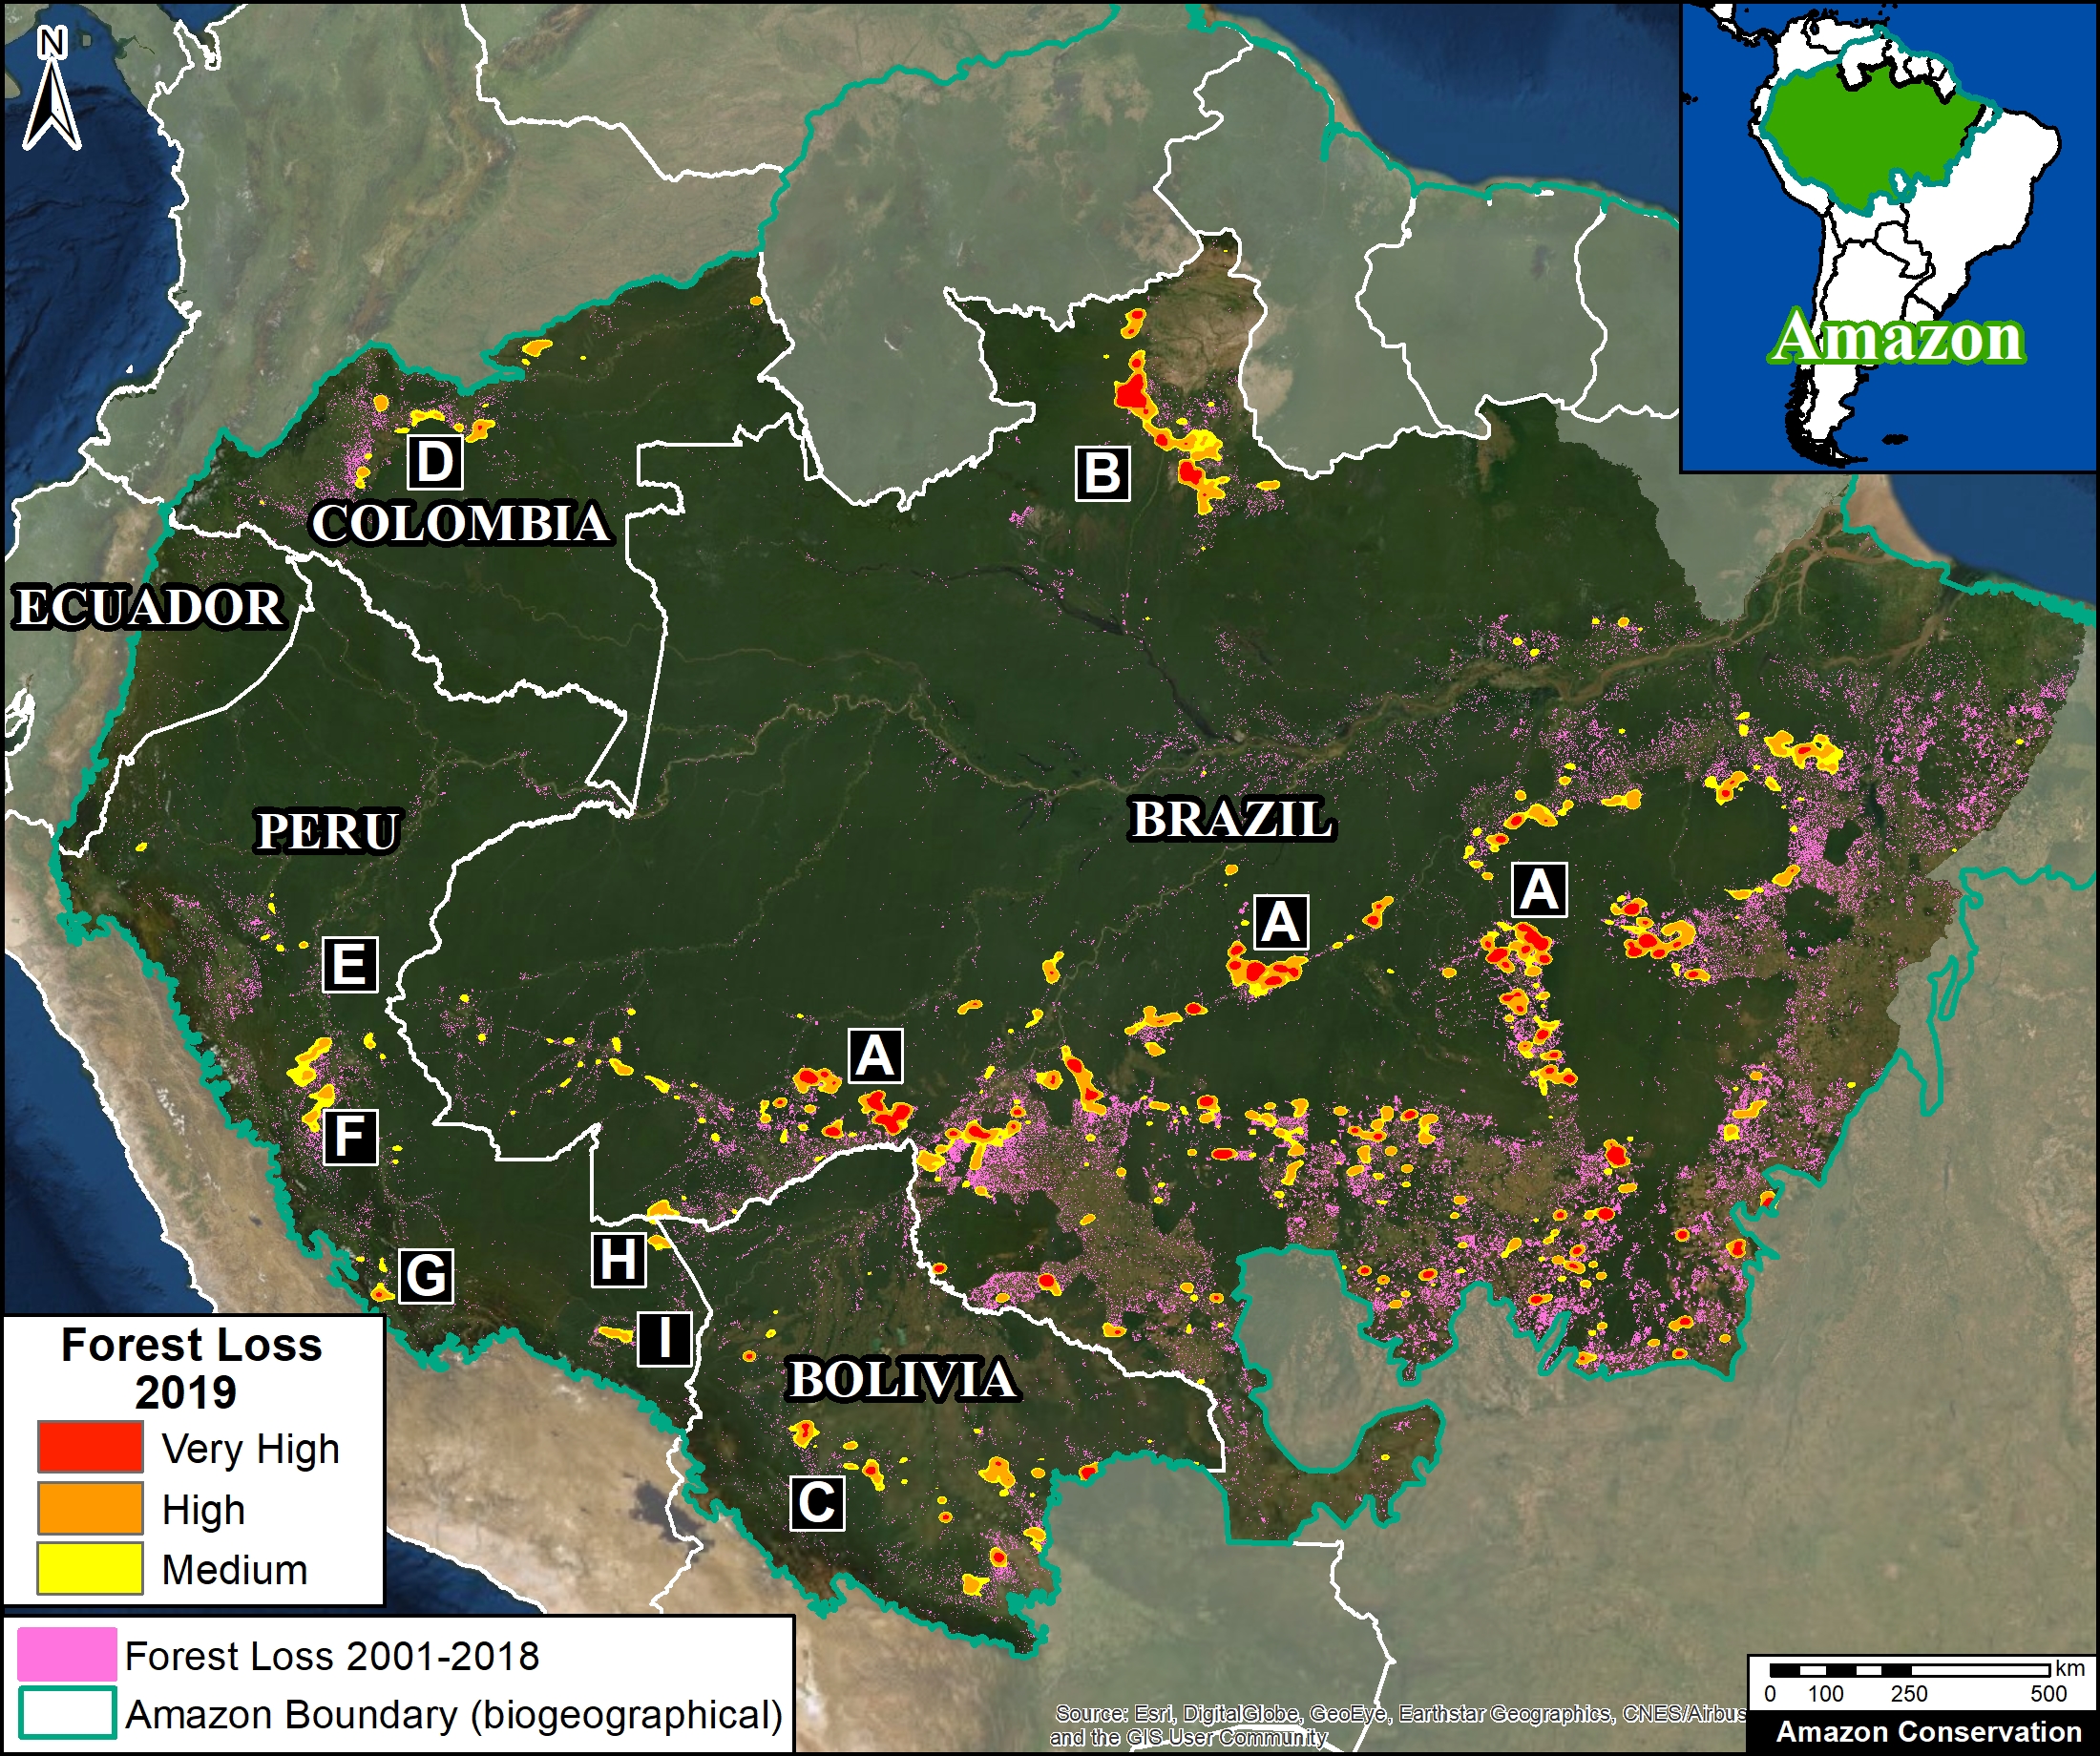
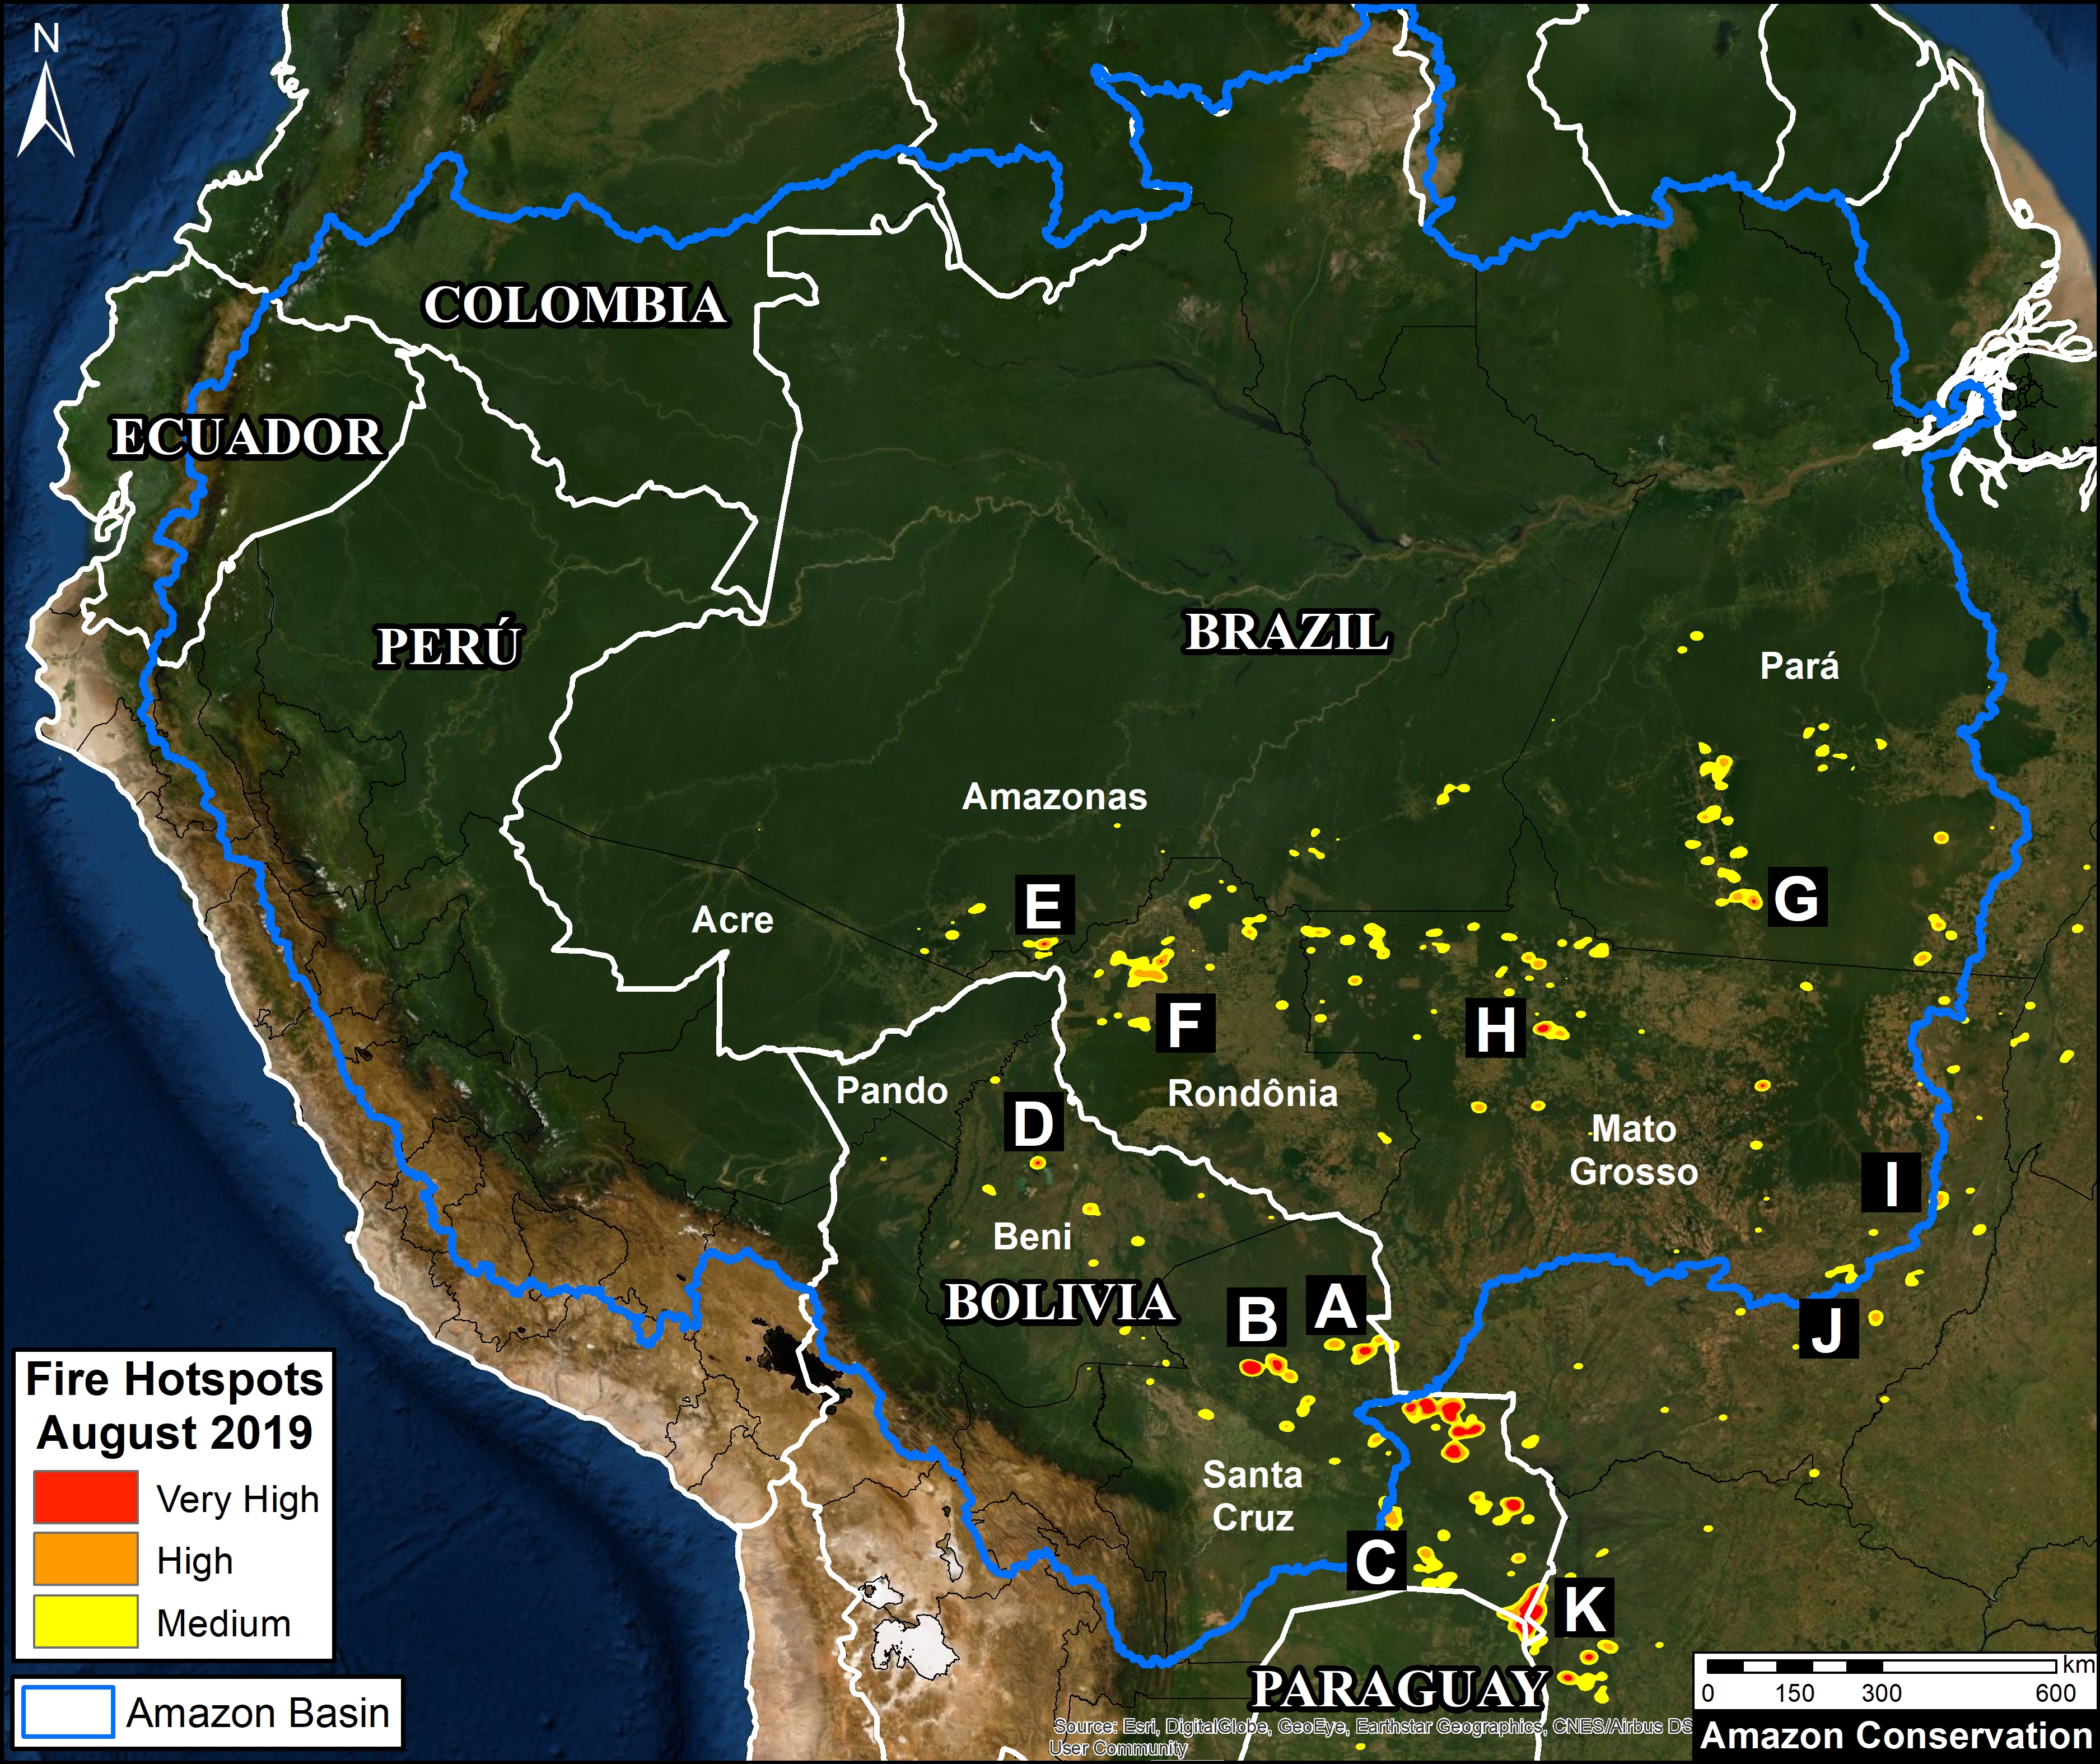
Base Map: Major Amazon Fires 2021
The Base Map shows the location of this year’s major fires (orange dots), as visualized in the app’s “Major Amazon Fires 2021” layer. Of the 209 major fires in the Amazon this year, the vast majority have been in Brazil (75%), followed by Bolivia (14%), Peru (9%), and Colombia (2%).
Fires in the Brazilian Amazon
In the Brazilian Amazon, we have documented 184 major fires thus far in 2021.
This marks an increase from the start of the intense 2020 fire season, when we had detected 87 major fires by this same date (we ultimately documented over 2,250 major fires by the end of the year).
As noted above, the majority (67%) of major fires have burned recently deforested areas (that is, areas where the forest was previously cleared between 2017 and 2021 prior to burning). These fires have burned over 44,000 hectares (109,000 acres), highlighting the current high deforestation in Brazil.
Most of the remaining fires have occurred in either natural savannah grasslands (impacting 35,000 ha) or older croplands. Many of the grassland fires have occurred in Indigenous Territories, such as Xingu and Kayapó.
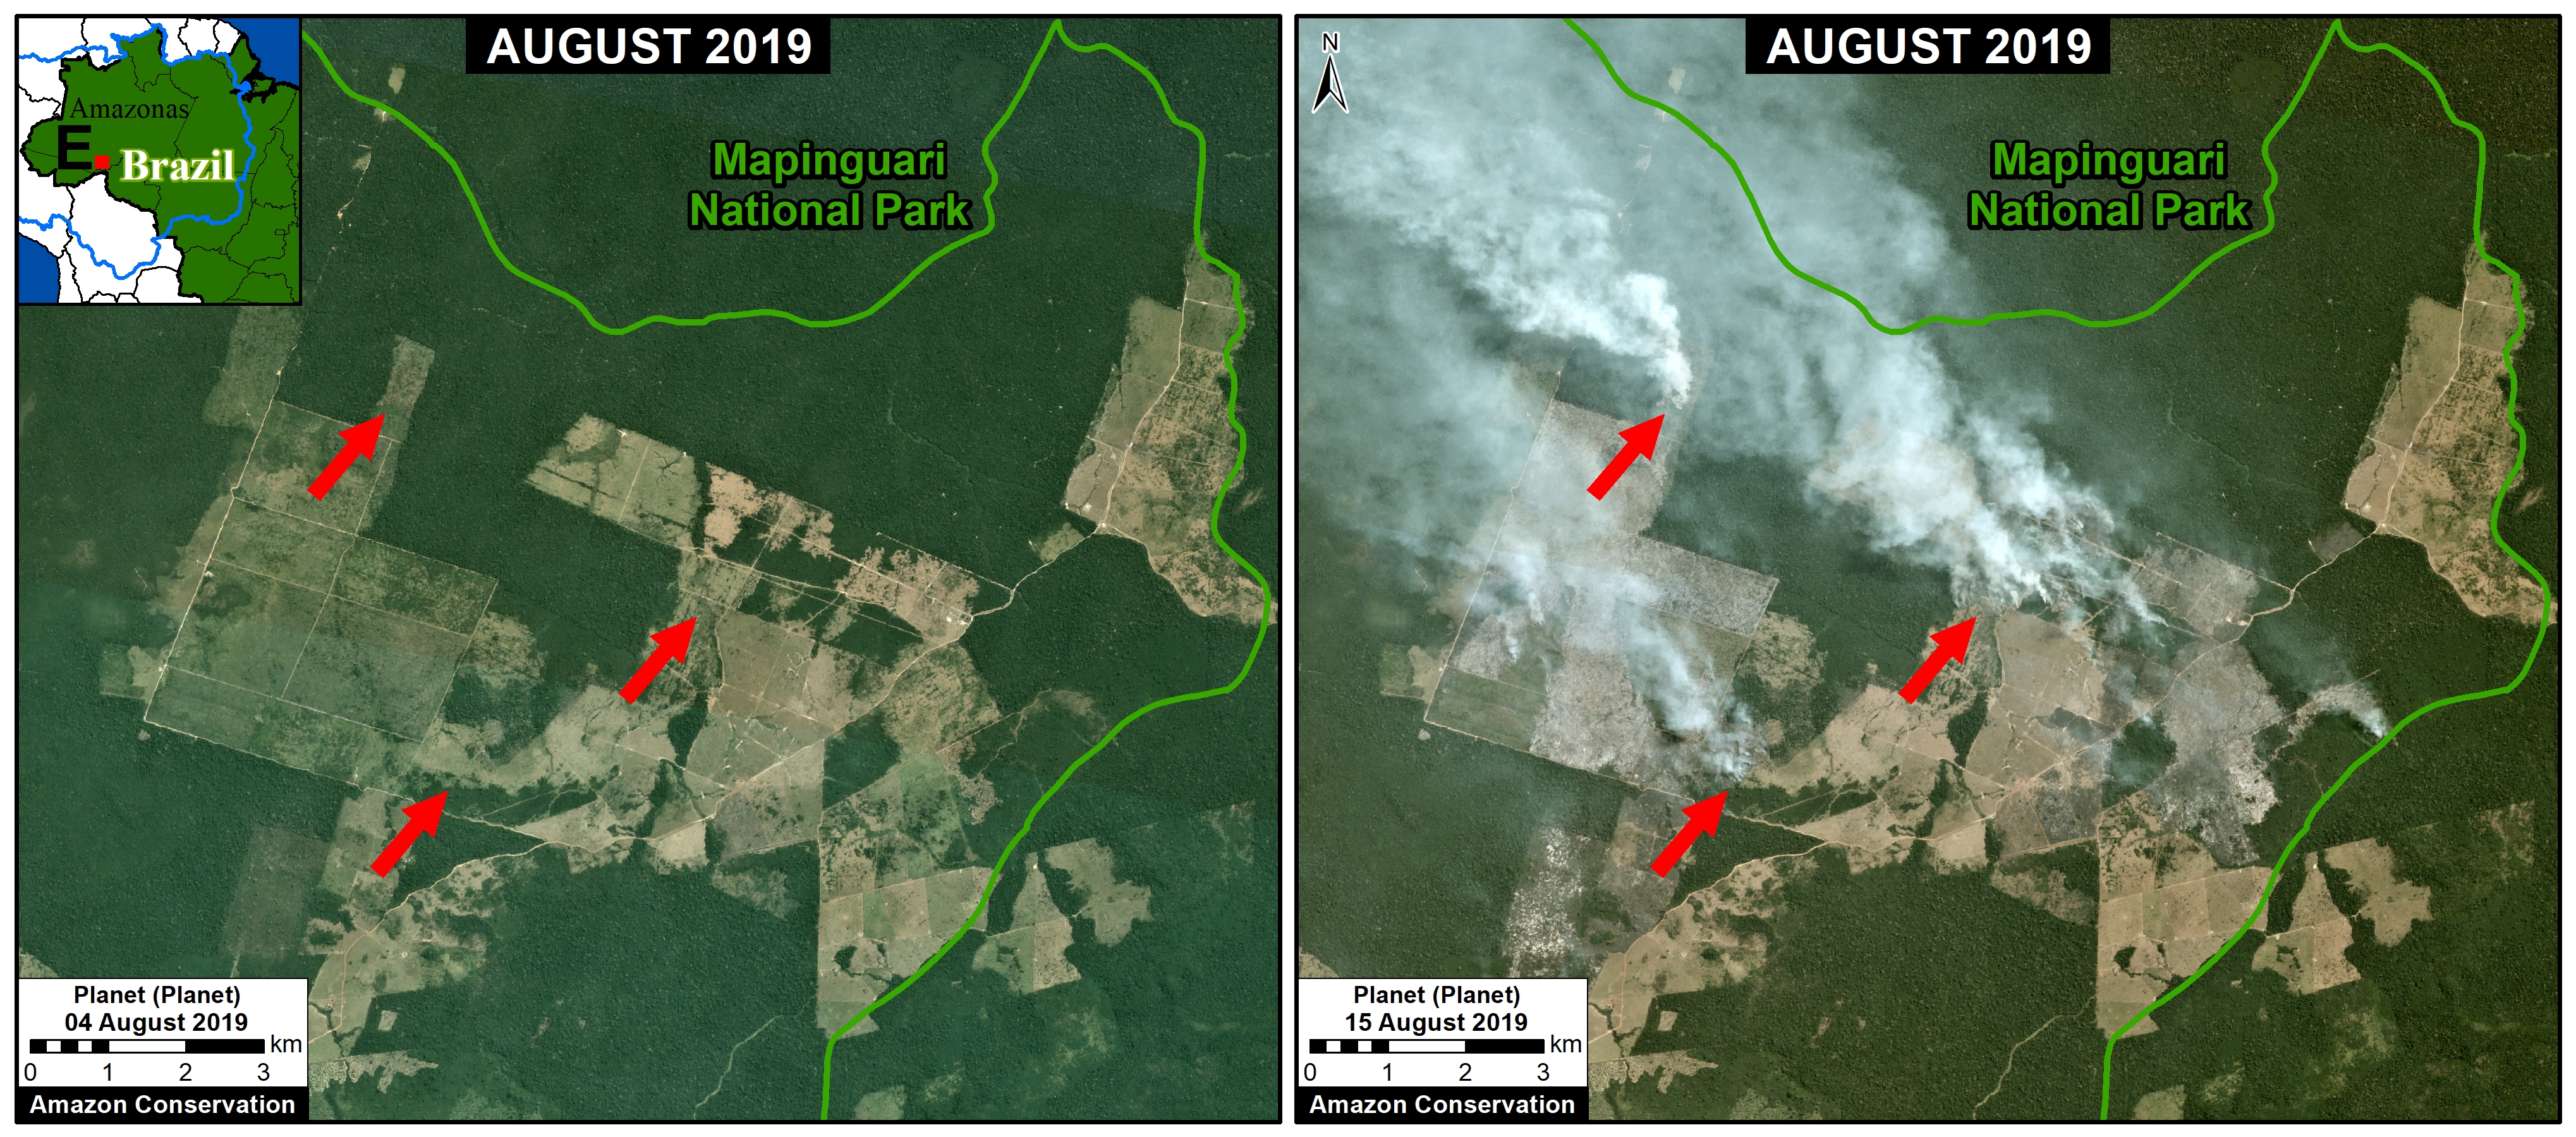
It is worth highlighting that we have also documented the first several “Forest Fires” of the season, defined here as human-caused fires in standing forest. The impact of these fires has been relatively small so far (400 hectares), but this number is expected to spike as the dry season intensifies in August and September.
The Brazilian government issued a ban on unauthorized outdoor fires on June 27, thus we assume that most of the 160 major fires following that date have been illegal.
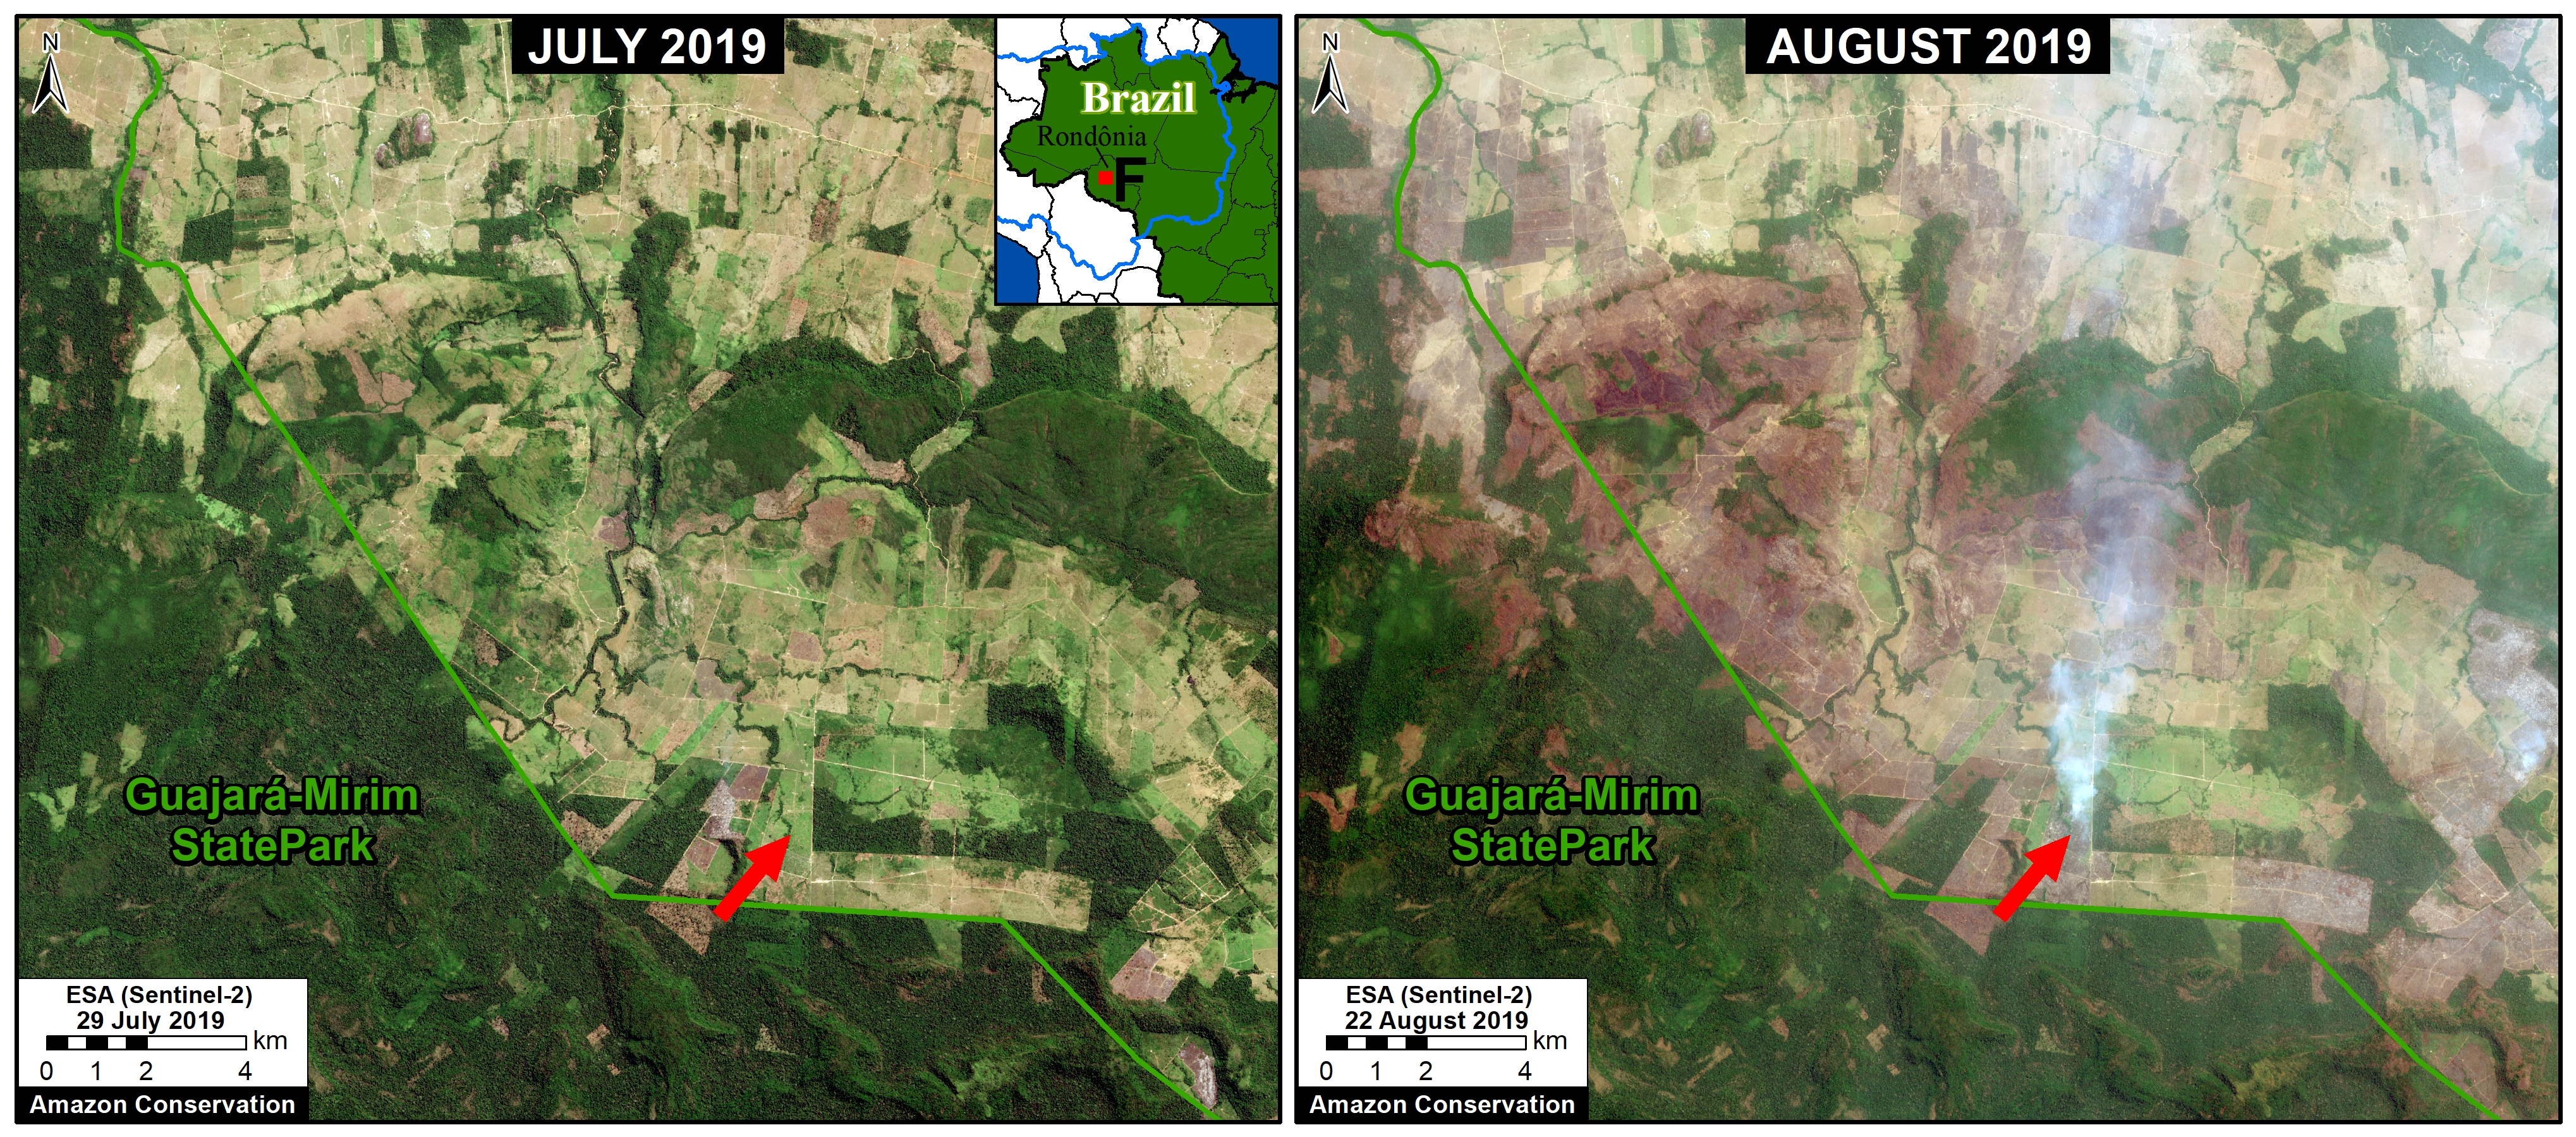
The state of Mato Grosso has had the most major fires (43%), followed by Amazonas (29%), Pará (14%), Rondônia (12%), and Acre (2%).
*App Background
We launched a new and improved version of the Amazon real-time fire monitoring app in May 2021. The app is hosted by Google Earth Engine and updated every day by the organization Conservación Amazónica, based in Peru.
The app displays aerosol emissions as detected by the European Space Agency’s Sentinel-5 satellite. Elevated aerosol levels indicate the burning of large amounts of biomass, defined here as a “major fire”. In a novel approach, the app combines data from the atmosphere (aerosol emissions in smoke) and the ground (heat anomaly alerts) to effectively detect and visualize major Amazon fires.
When fires burn, they emit gases and aerosols. A new satellite (Sentinel-5P from the European Space Agency) detects these aerosol emissions (aerosol definition: Suspension of fine solid particles or liquid droplets in air or another gas). Thus, the major feature of the app is detecting elevated aerosol emissions which in turn indicate the burning of large amounts of biomass. For example, the app distinguishes small fires clearing old fields (and burning little biomass) from larger fires burning recently deforested areas or standing forest (and burning lots of biomass). The spatial resolution of the aerosol data is 7.5 sq km. The high values in the aerosol indices (AI) may also be due to other reasons such as emissions of volcanic ash or desert dust so it is important to cross reference elevated emissions with heat data and optical imagery.
We define “major fire” as one showing elevated aerosol emission levels on the app, thus indicating the burning of elevated levels of biomass. This typically translates to an aerosol index of >1 (or cyan-green to red on the app). To identify the exact source of the elevated emissions, we reduce the intensity of aerosol data in order to see the underlying terrestrial heat-based fire alerts. Typically for major fires, there is a large cluster of alerts. The major fires are then confirmed, and burn areas estimated, using high-resolution satellite imagery from Planet Explorer.
We define burning “recently deforested areas” as any forested area cleared since 2017 and subsequently burned in 2021.
Since the data updates daily and is not impacted by clouds, real-time monitoring really is possible. Our goal is to upload each day’s new image in the late afternoon/early evening.
Acknowledgements
The app was developed and updated daily by Conservación Amazónica (ACCA). The data analysis is led by Amazon Conservation in collaboration with SERVIR Amazonia.
The Amazon Fire Tracker series is supported by NORAD (Norwegian Agency for Development Cooperation) and ICFC (International Conservation Fund of Canada).

Citation
Finer M, Costa H, Villa L (2021) Amazon Fire Tracker 2021: August Update. MAAP 2021, #3.