MAAP #157: New and Proposed Roads Across the Western Amazon

Amazon Roads Base Map 1.

Extensive deforestation, especially along the major road networks, has shockingly turned the eastern Brazilian Amazon into a net carbon source (see MAAP #144).

Fortunately, the greater Amazon across all nine countries is still a net carbon sink, largely thanks to the still intact core of the western Amazon.

The biggest long-term threat to this core Amazon is likely new roads, as they are a leading cause of opening up vast and previously remote areas to deforestation and degradation (Vilela et al 2020).

Here, we present an initial analysis of new and proposed roads across the western Amazon.

Although it’s difficult to predict what proposed projects are actually likely to eventually move forward, we do find the potential of a major road expansion across the core western Amazon (see Base Map 1).

Moreover, even by just focusing on the most advanced or actively discussed projects, we find the risk of major negative impact.

Below, we discuss our initial Amazon Roads Base Map and present a series of zooms showing the primary forest at risk if select road projects move forward.


Amazon Roads Base Map

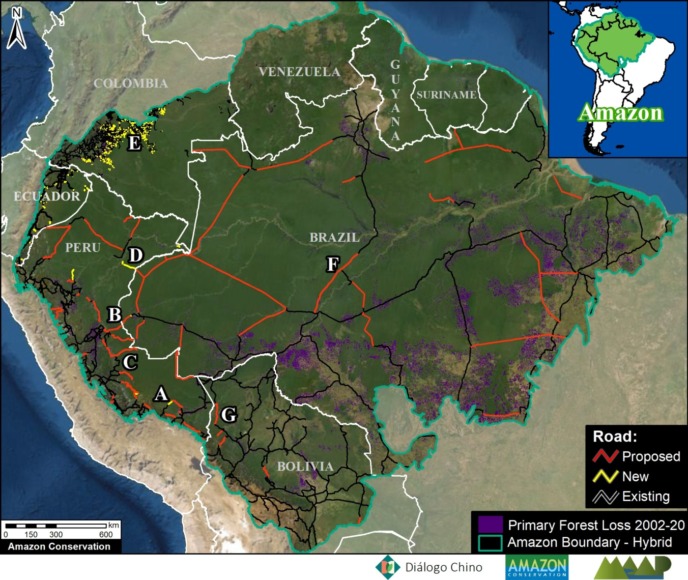
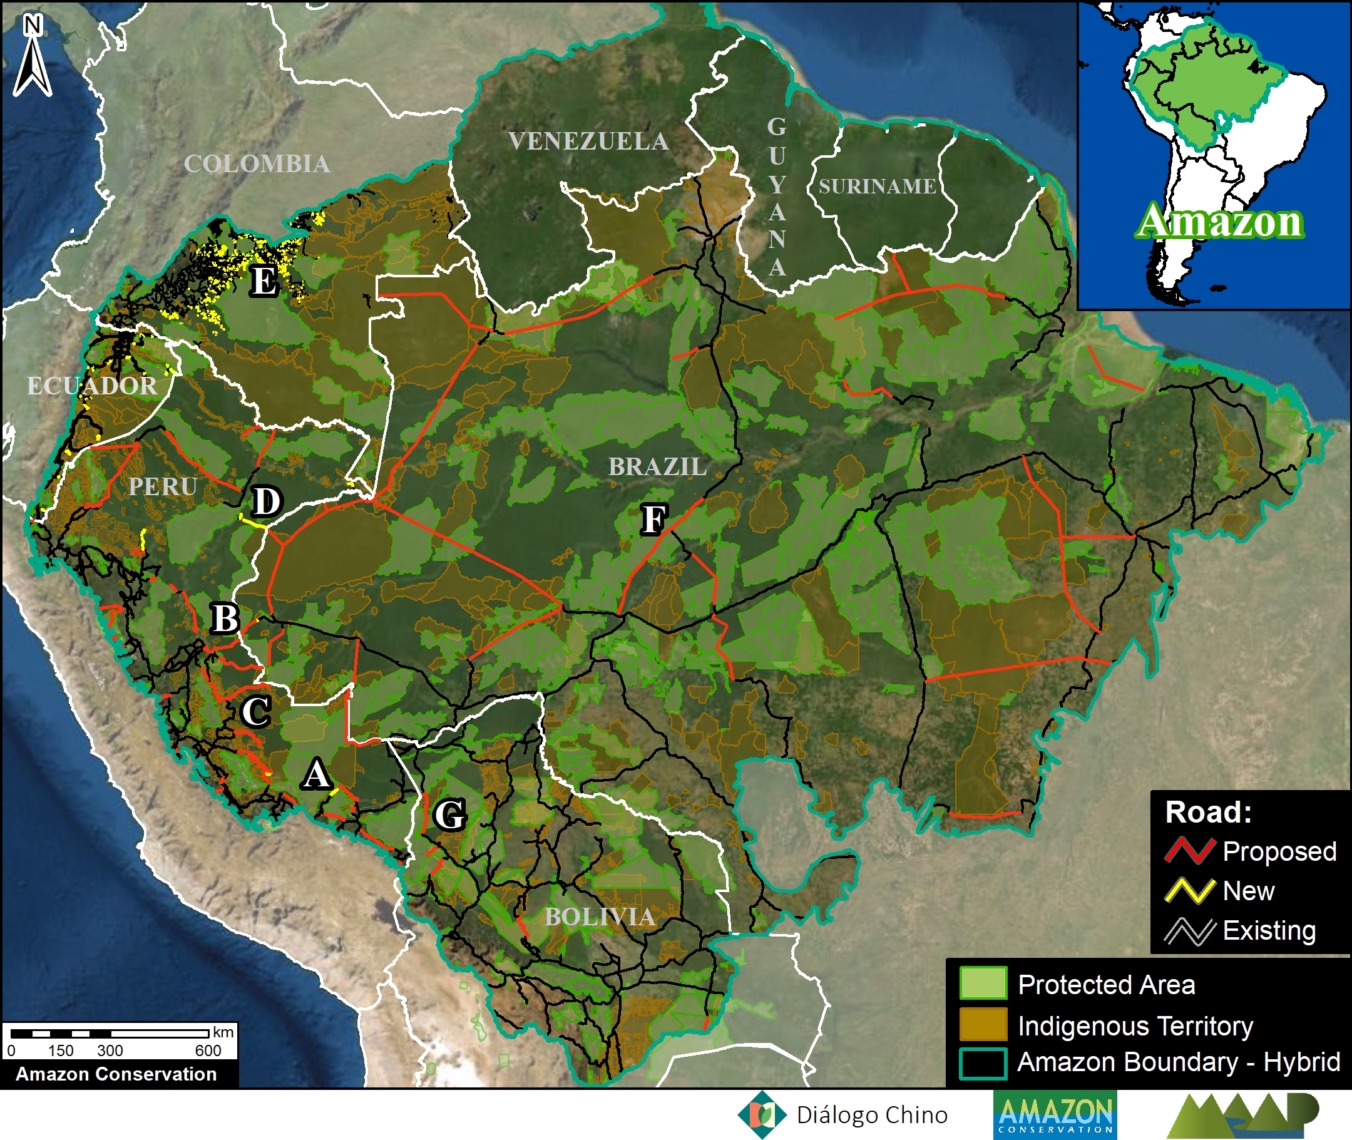
Base Map 2 highlights new, proposed, and existing roads (red, yellow, and black lines, respectively), in relation to protected areas and indigenous territories for context. We focus on the still largely intact core of the western Amazon (Bolivia, Colombia, Ecuador, Peru, and western Brazil).

Most of the new roads were constructed in the past five years and were digitized from satellite imagery. Note that for some of these new roads, just initial construction of a rough road started and there is still potential for future impacts from road improvement and paving.

Most of the proposed roads were obtained from official government data sets. As noted above, it’s difficult to predict what proposed road projects are actually likely to eventually move forward. Nonetheless, it is clear to see there is the potential to greatly divide the remaining core western Amazon with the portfolio of proposed roads.

Amazon Roads Base Map 2. Data: ACA/MAAP, MTC, MINAM, MI, ABT, GAD Napo, FCDS, EcoCiencia, Diálogo Chino, CSF, RAISG, ACCA, ACEAA.

Zooms of High-Impact New & Proposed Roads

In this section, we focus on the currently most advanced or actively discussed projects (see Letters A-F on Amazon Roads Base Map). We highlight their potential impacts to vast sections of the core western Amazon protected areas and indigenous terrritories.

A. Boca Manu Road (Peru)

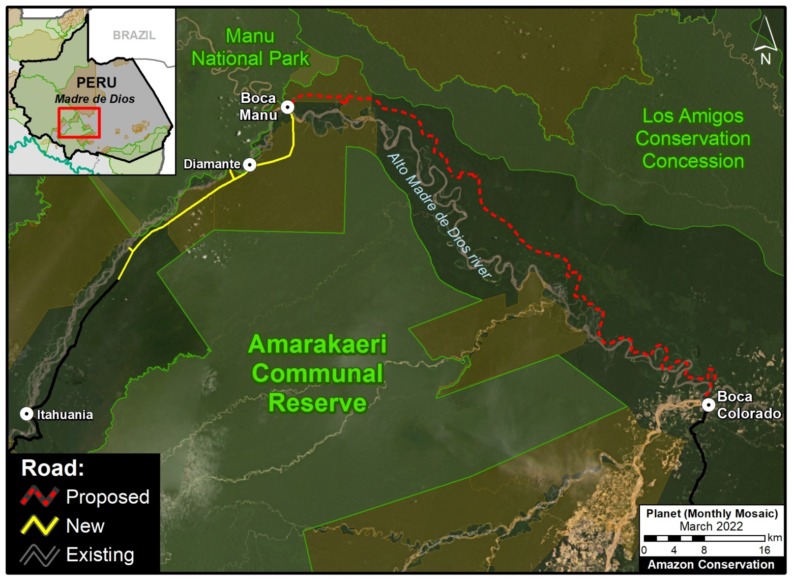
The new/proposed road that we refer to here as the Boca Manu road would serve as a new connection between Cusco and Madre de Dios regions. It is notable due its sensitive route between Manu National Park and Amarakaeri Communal Reserve to Boca Manu, and from there between Los Amigos Conservation Concession and Amarakaeri Communal Reserve to Boca Colorado. In addition to likely impacting these protected areas and the concession, the road also has the potential to impact the nearby territory of  indigenous groups in voluntary isolation. See this recent report from Diálogo Chino for more information about this road and its status and impacts.

Zoom A. Boca Manu Road. Data: MTC, MINAM, ACA, ACCA, RAISG.

B. Pucallpa – Cruzeiro do Sul Road (Peru – Brazil)

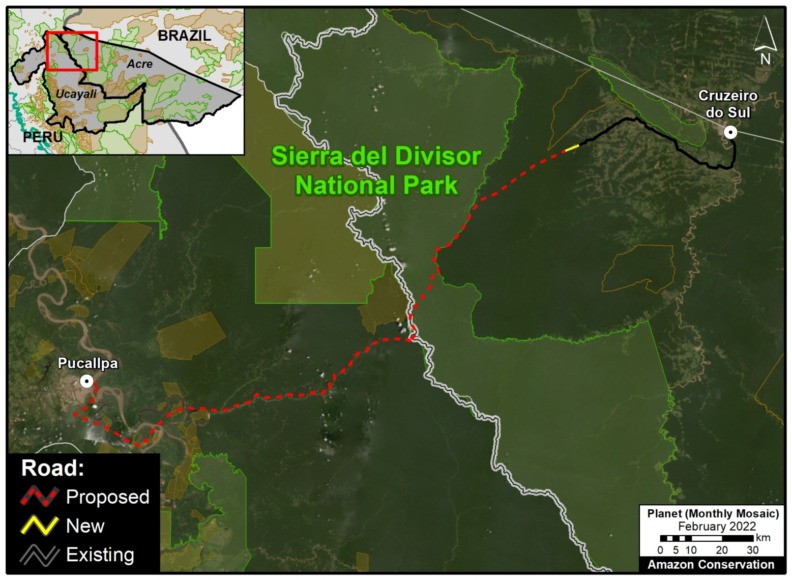
This proposed road would connect the Peruvian city of Pucallpa with the edge of the existing road network in western Brazil, near the town of Cruzeiro do Sul. Although the potential route has several options, it would sure cut through or near Sierra del Divisor National Park in Peru and the adjacent Serra do Divisor National Park in Brazil. This area is characterized by vast primary forests, thus creating a new binational route connecting the deforestation fronts in each country could obviously trigger significant impacts. See this recent report from Diálogo Chino for more information about this road and its status and impacts.

Zoom B. Pucallpa – Cruzeiro do Sul Road. Data: MTC, MINAM, ACA, CSF, Diálogo Chino, RAISG.

C. Yurua Road (Peru)

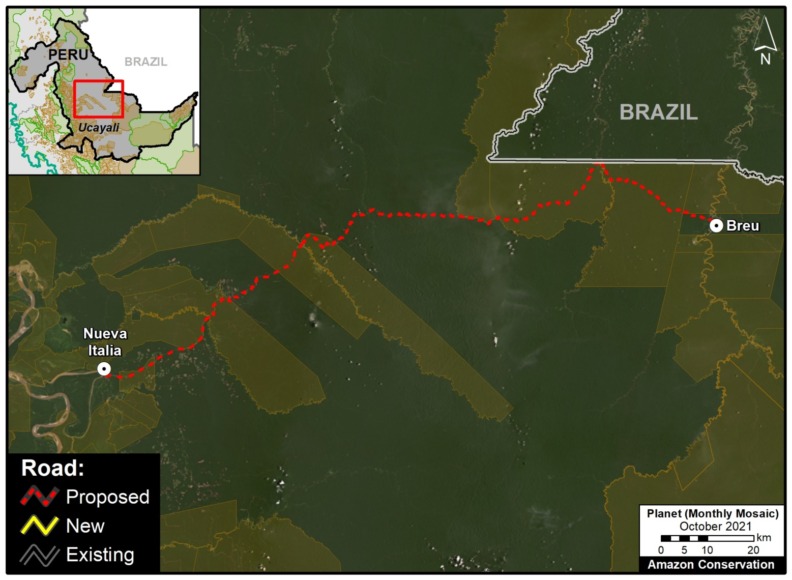
The new/proposed road that we refer to here as the Yurua road would connect the Peruvian towns of Nueva Italia on the Ucayali River and Breu on the Yurua River. This 200 km route was originally built as a logging road in the late 1980s to access remote timber areas in the central Peruvian Amazon, but had fallen into disrepair by the early 2000s. A recent MAAP analysis (see MAAP #146) found that between 2010 and 2021 much of the route had been rehabilitated, triggering elevated deforestation along the way. If this road were ever to be paved then impacts would likely continue to rise, including with native communities along the route. See MAAP #146 for more information about this road and its status and impacts.

Zoom C. Yurua Road. Data: MTC, MINAM, ACA, ACCA, RAISG.

D. Genaro Herrera – Angamos Road (Peru)

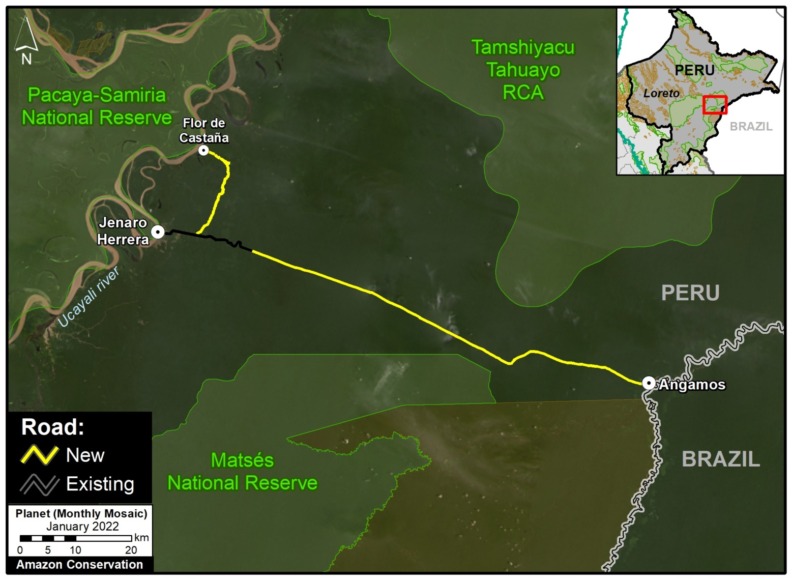
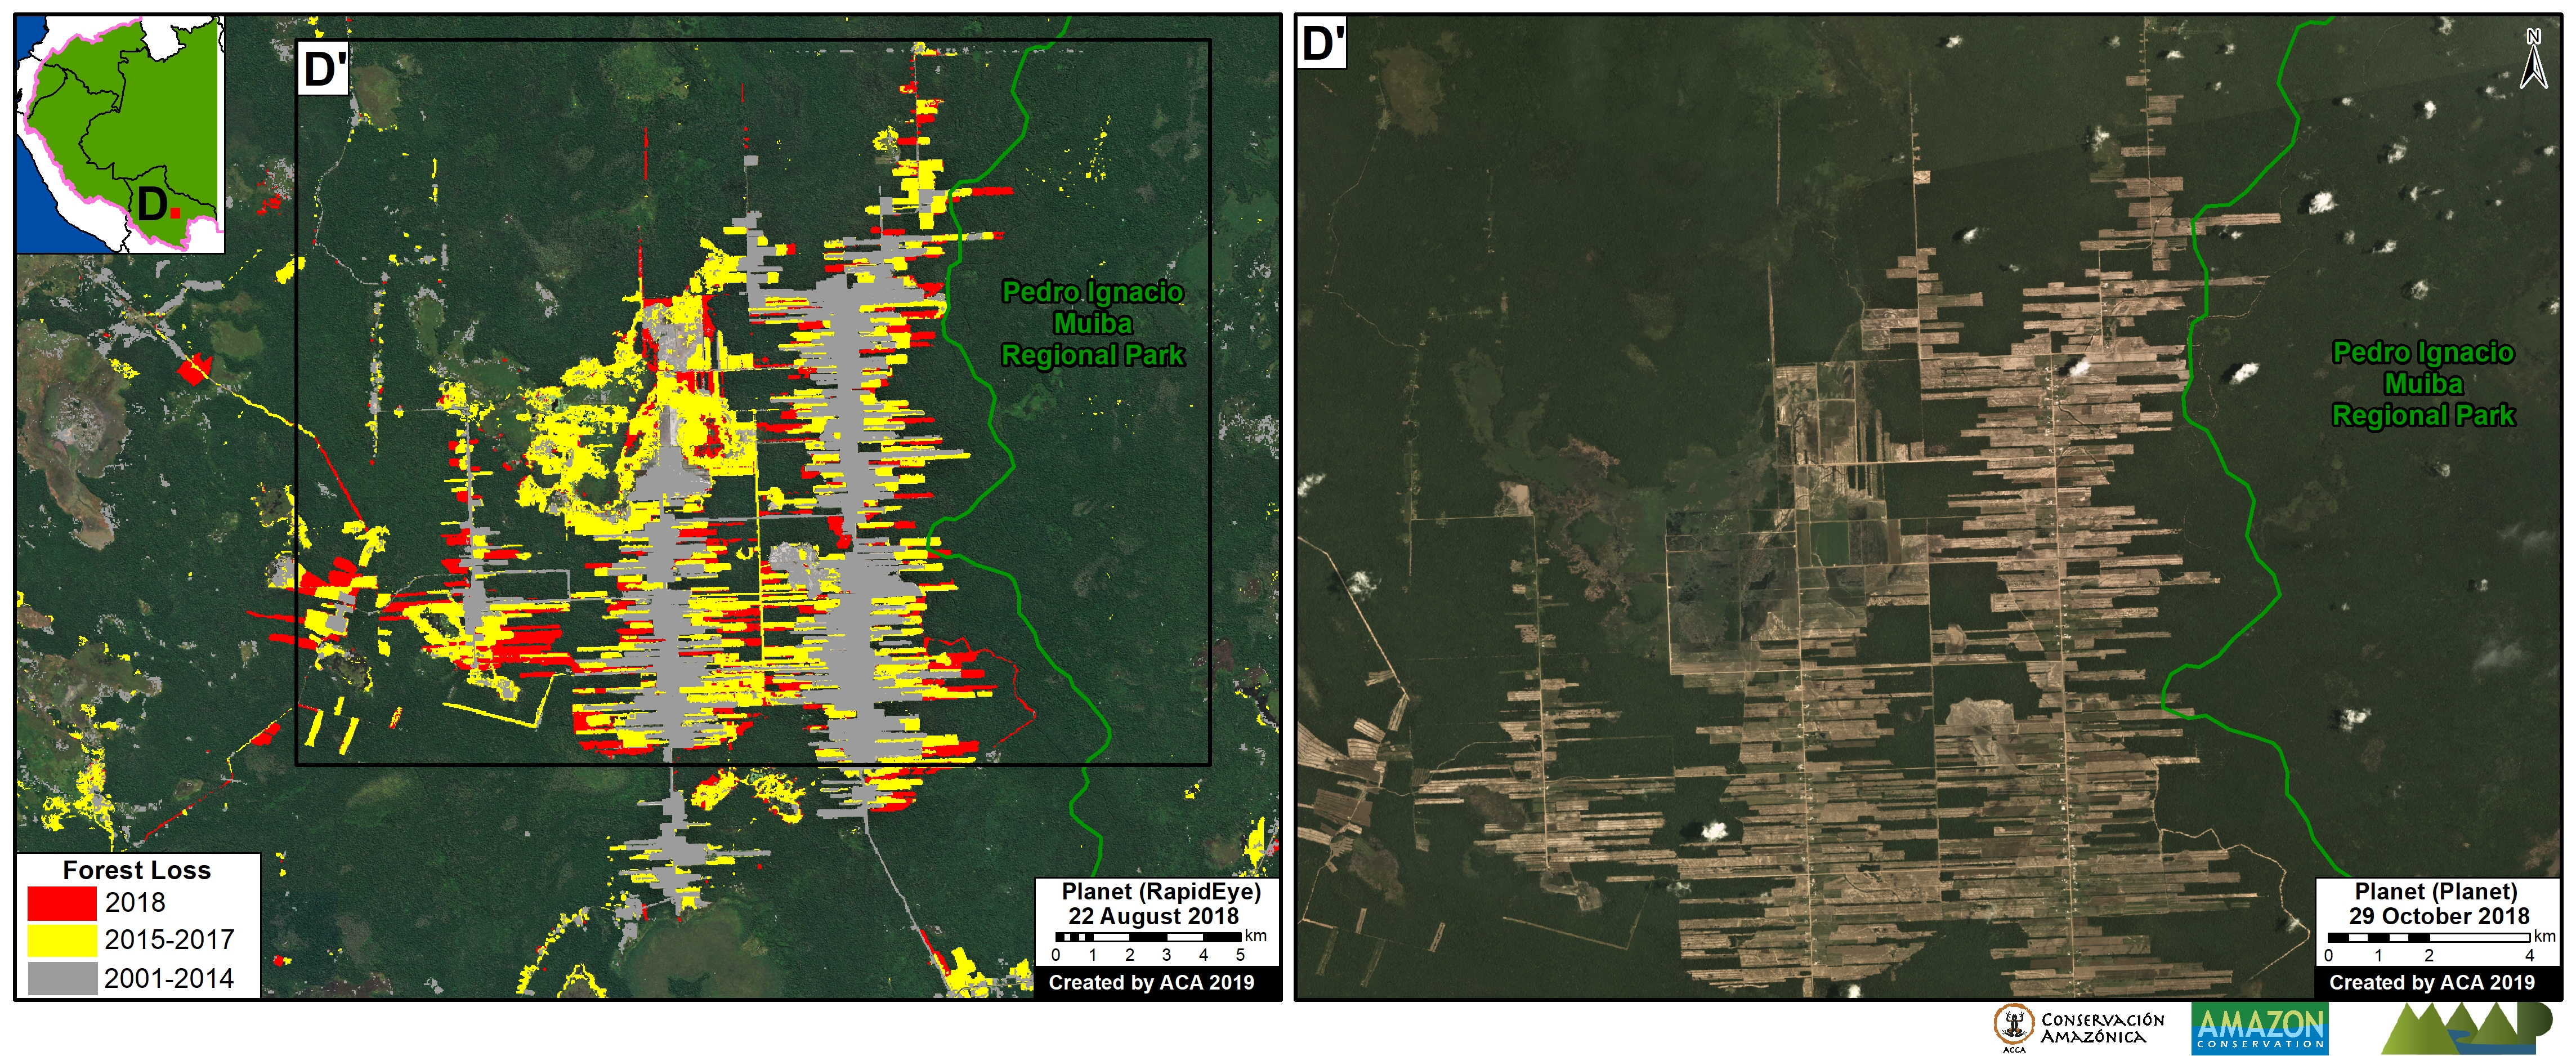
This new/proposed road would build off an old track through the vast forests connecting the northern Peruvian towns of Genaro Herrera and Angamos, in the region of Loreto. In 2021, clearing began along this route, advancing over 100 kilometers from both ends. If completed and paved, the final road project would impact protected areas on both sides (including the Matsés National Reserve to the south) and pose a major threat to indigenous people in voluntary isolation reportedly living to the north. See this recent report for more information about this road and its status and impacts.

Zoom D. Genaro Herrera – Angamos Road. Data: MTC, ACA, RAISG.

E. Cachicamo – Tunia Road (Chiribiquete National Park, Colombia)

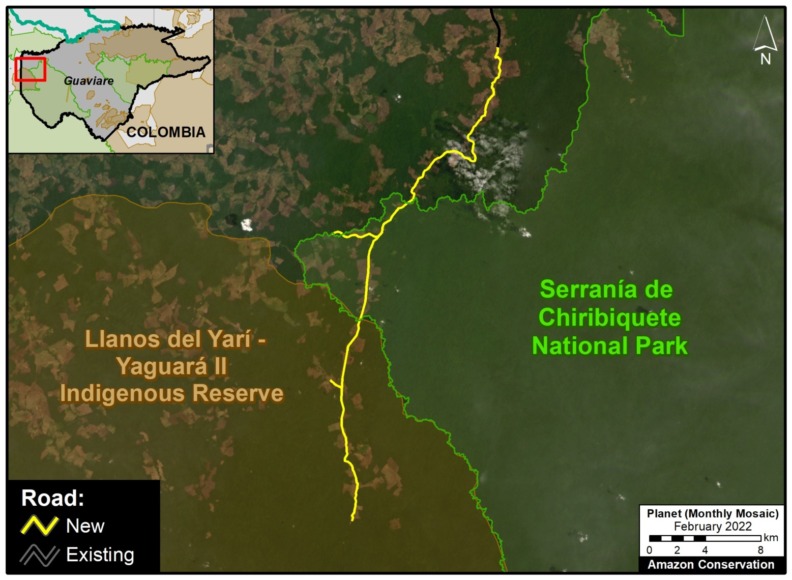
Chiribiquete National Park, located in the heart of the Colombian Amazon, has been experiencing increasing deforestation pressures, partly due to expanding road networks around and even within the park. For example, the Cachicamo-Tunia Road, constructed in 2020, has triggered a new deforestation front in the northwest section of the park. Note this road is also impacting an adjacent Indigenous Reserve.

Zoom E. Cachicamo – Tunia Road. Data: FCDS, RAISG, ACA.

F.  Manaus – Porto Velho Road (BR-319, Brazil)

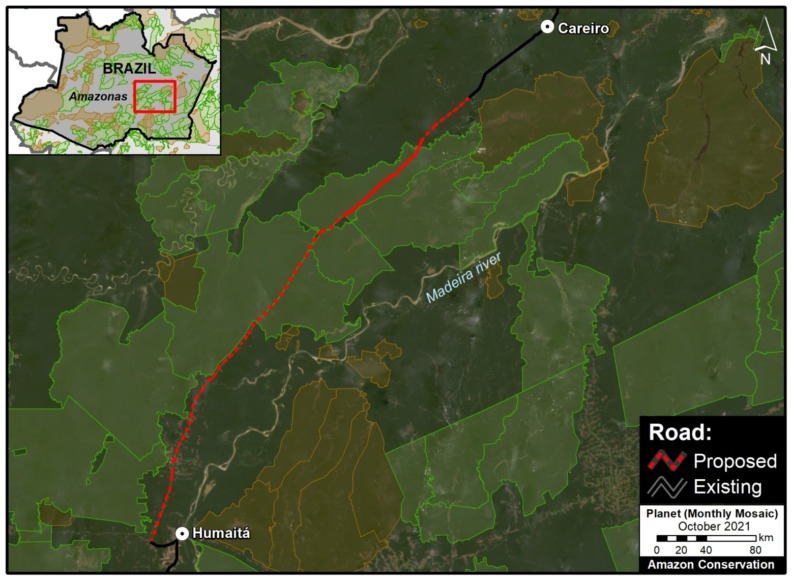
Arguably the most controversial project on the list: paving the middle section of BR-319 in the heart of the Brazilian Amazon. This nearly 900 km road connects the remote city of Manaus (otherwise only reachable by air or water) with the rest of Brazilian road network in Humaitá and Porto Velho to the south. It was built in the early 1970s but abandoned and impassable by the late 1980s, isolating Manaus once again. Since 2015, a basic maintenance program has made the road generally passable, but the main project remains: paving the 400 km middle section that passes through the core western Amazon. This paving would effectively connect Manaus with the existing highways in the south, and most likely trigger massive forest loss by extending the arc of deforestation northwards, including within and around the protected areas that surround the road. This road project has been the subject of numerous recent press reports, including investigative pieces by the Washington Post and El Pais.

Zoom F. Manaus – Porto Velho Road. Data: Ministério da Infraestrutura, ACA, RAISG.

G. Ixiamas – Chivé Road (Bolivia)

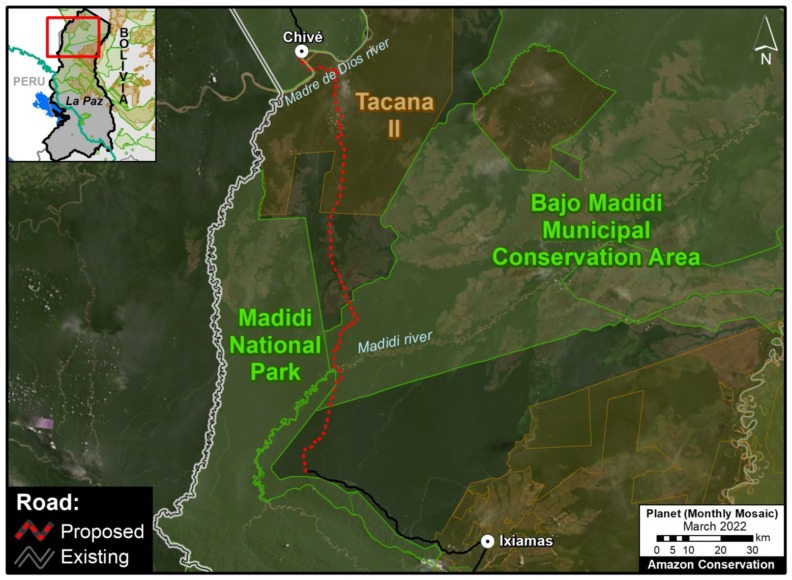
In recent years, Bolivia has been seeking financing for a 250 km road linking the current frontier town Ixiamas with the isolated town Chivé, located near the Peruvian border on the Madre de Dios river. This road would cross extensive tracts of primary Amazon forest and savannah in the north of the La Paz department, including the newly created Bajo Madidi Municipal Conservation Area and the Tacana II indigenous territory.

Zoom G. Ixiamas – Chivé Road. Data: ABT, ACEAA, ACA, RAISG.

Methodology

Our analysis and maps focus on the western Amazon (Bolivia, Colombia, Ecuador, Peru, and western Brazil).

Most of the new roads were constructed in the past five years and were digitized from satellite imagery. Note that for some of these new roads, just initial rehabilitation/improvement of a rough road started and there is still potential for future impacts from paving.

Most of the proposed roads were obtained from official government data sets (and complemented by civil society reports).

We credit the following data sources: Ministerio de Transportes y Comunicaciones (Peru), Geobosques/MINAM (Peru), Ministério da Infraestrutura (Brazil),  Autoridad de Fiscalización y Control Social de Bosques y Tierra – ABT (Bolivia), Gobierno Autonomo Descentralizado Provincial de Napo (Ecuador), Fundación para la Conservación y el Desarrollo Sostenible – FCDS (Colombia), Fundación EcoCiencia (Ecuador), Diálogo Chino, Conservation Strategy Fund, RAISG, Conservación Amazónica – ACCA (Peru), Conservación Amazónica – ACEAA (Bolivia), and Amazon Conservation (digitalization of some new and proposed roads).

Reference:
Vilela et al (2020) A better Amazon road network for people and the environment. PNAS 17 (13) 7095-7102.

Acknowledgments

We especially thank Diálogo Chino for their support of this report. We also thank E. Ortiz, S. Novoa, S. Villacis, D. Larrea, M. Terán, and D. Larrea for helpful comments on earlier drafts of the text and images.

Citation

Finer M, Mamani N (2022) New and Proposed Roads Across the Western Amazon. MAAP: 157.

MAAP #153: Amazon Deforestation Hotspots 2021

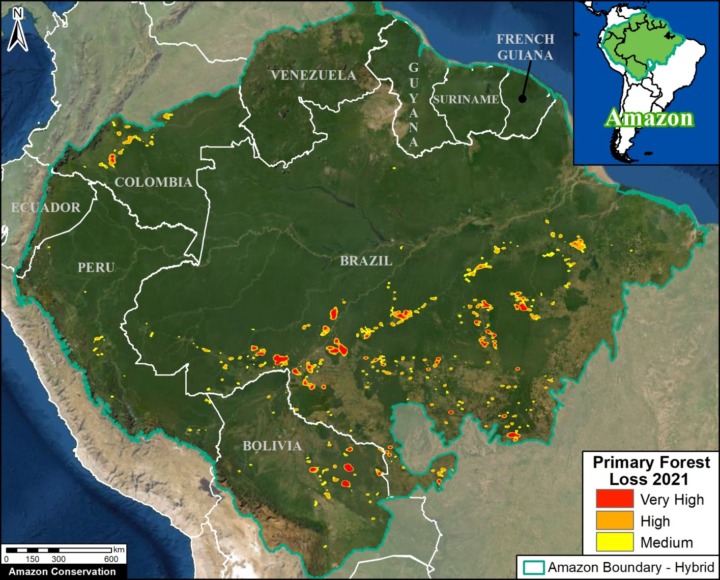
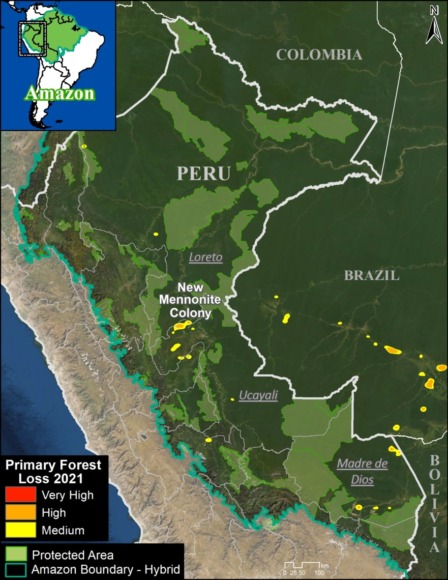
Amazon Base Map. Deforestation hotspots across the Amazon in 2021 (as of September 18). Data: UMD/GLAD, ACA/MAAP.

We present a first look at the major 2021 Amazon deforestation hotspots.*

The Amazon Base Map illustrates several key findings:p

  • We estimate the loss of over 1.9 million hectares (4.8 million acres) of primary forest loss across the nine countries of the Amazon biome in 2021.
    k
  • This matches the previous two years, bringing the total deforestation to 6 million hectares (15 million acres) since 2019, roughly the size of the state of West Virginia.
    p
  • In 2021, most of the deforestation occurred in Brazil (70%), followed by Bolivia (14%), Peru (7%), and Colombia (6%).
    p
  • In Brazil, hotspots are concentrated along the major road networks. Many of these areas were also burned following the deforestation.
    j
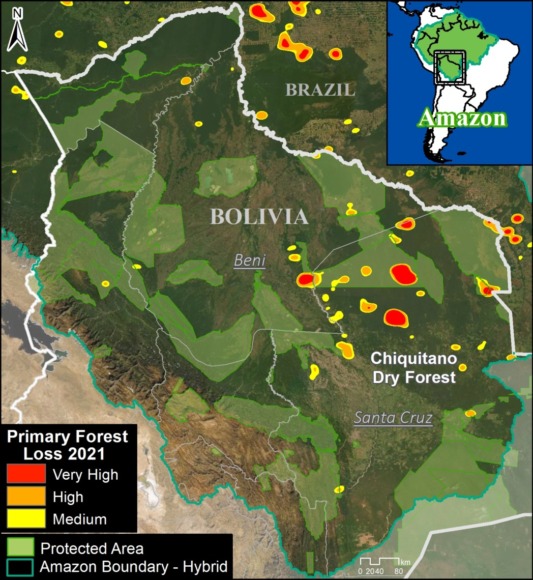
  • In Bolivia, fires once again impacted several important ecosystems, including the Chiquitano dry forests.
    p
  • In Peru, deforestation continues to impact the central region, most notably from large-scale clearing for a new Mennonite colony.
    p
  • In Colombia, there continues to be an arc of deforestation impacting numerous protected areas and indigenous territories.

Below, we zoom in on the four countries with the highest deforestation (Brazil, Bolivia, Peru, and Colombia), with additional maps and analysis.

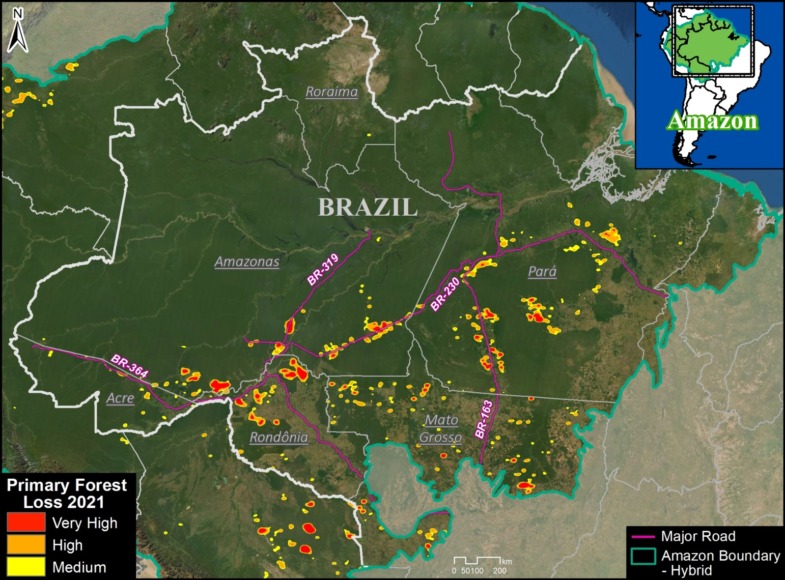
Brazil Base Map. Deforestation hotspots in Brazilian Amazon. Data: UMD/GLAD, ACA/MAAP.

Brazilian Amazon

The Brazil Base Map shows the notable concentration of deforestation hotspots along the major roads (especially roads 163, 230, 319, and 364) in the states of Acre, Amazonas, Pará, and Rondônia.


Bolivia Base Map. Deforestation hotspots in Bolivian Amazon. Data: UMD/GLAD, ACA/MAAP.

Bolivian Amazon

The Bolivia Base Map shows the concentration of hotspots due to major fires in the Chiquitano dry forest biome, largely located in the department of Santa Cruz in the southeast section of the Amazon.


Peru Base Map. Deforestation hotspots in the Peruvian Amazon. Data: UMD/GLAD, ACA/MAAP.

Peruvian Amazon

The Peru Base Map shows the concentration of deforestation in the central Amazon (Ucayali region).

We highlight the rapid deforestation (365 hectares) for a new Mennonite colony in 2021, near the town of Padre Marquez (see MAAP #149).

Also, note some additional hotspots in the south (Madre de Dios region), but these are largely from expanding agriculture instead of the historical driver of gold mining.

Indeed, gold mining deforestation has been greatly reduced due to government actions, but this illegal activity still threatens several key areas and indigenous territories (MAAP #130).


Colombia Base Map. Deforestation hotspots in northwest Colombian Amazon. Data: UMD/GLAD, ACA/MAAP.

Colombian Amazon

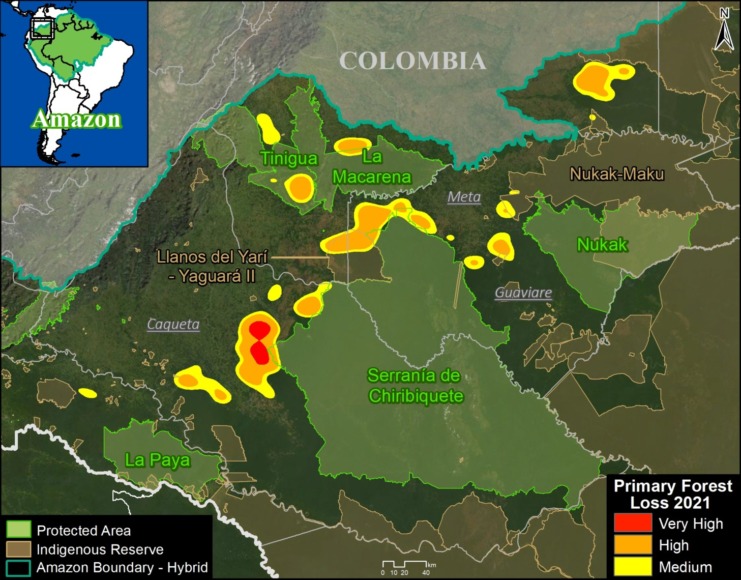
As described in previous reports (see MAAP #120), the Colombia Base Map shows there continues to be an “arc of deforestation” in the northwest Colombian Amazon (Caqueta, Meta, and Guaviare departments).

This arc impacts numerous Protected Areas (particularly Tinigua and Chiribiquete National Parks) and Indigenous Reserves (particularly Yari-Yaguara II and Nukak Maku).


*Notes and Methodology

The analysis was based on 10-meter resolution primary forest loss alerts (GLAD+) produced by the University of Maryland and also presented by Global Forest Watch. These alerts are derived from the Sentinel-2 satellite operated by the European Space Agency.

We emphasize that this data represents a preliminary estimate and more definitive annual data will come later in the year.

We also note that this data does include forest loss caused by natural forces and burned areas.

Our geographic range for the Amazon is a hybrid between both the biogeographic boundary (as defined by RAISG) and watershed boundary, designed for maximum inclusion.

To identify the deforestation hotspots, we conducted a kernel density estimate. This type of analysis calculates the magnitude per unit area of a particular phenomenon, in this case, forest cover loss. We conducted this analysis using the Kernel Density tool from the Spatial Analyst Tool Box of ArcGIS. We used the following parameters:

Search Radius: 15000 layer units (meters)
Kernel Density Function: Quartic kernel function
Cell Size in the map: 200 x 200 meters (4 hectares)
Everything else was left to the default setting.

For the Base Map, we used the following concentration percentages: Medium: 5-7%; High: 7-14%; Very High: >14%.

Acknowledgements

This work was supported by NORAD (Norwegian Agency for Development Cooperation) and ICFC (International Conservation Fund of Canada).

Citation

Finer M, Mamani N, Spore J (2022) Amazon Deforestation Hotspots 2021. MAAP: 153.

MAAP #144: The Amazon & Climate Change: Carbon Sink vs Carbon Source

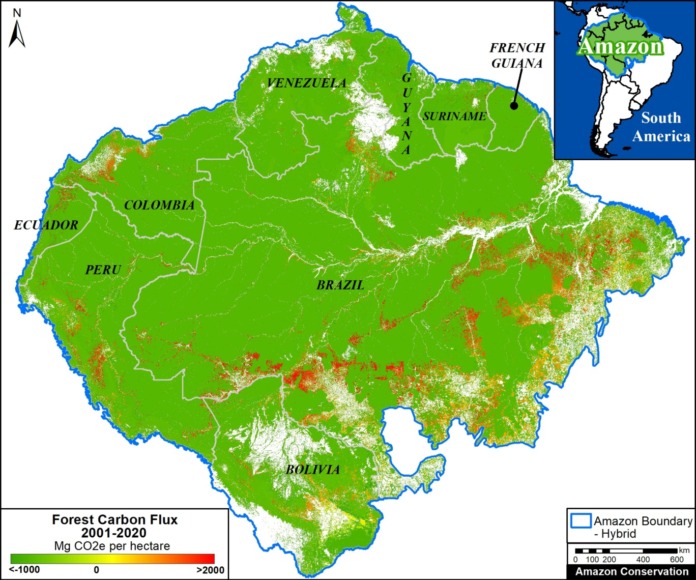
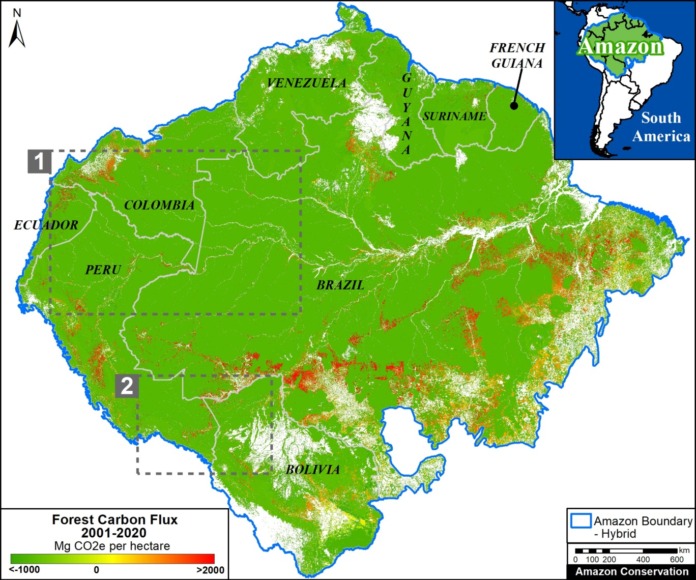
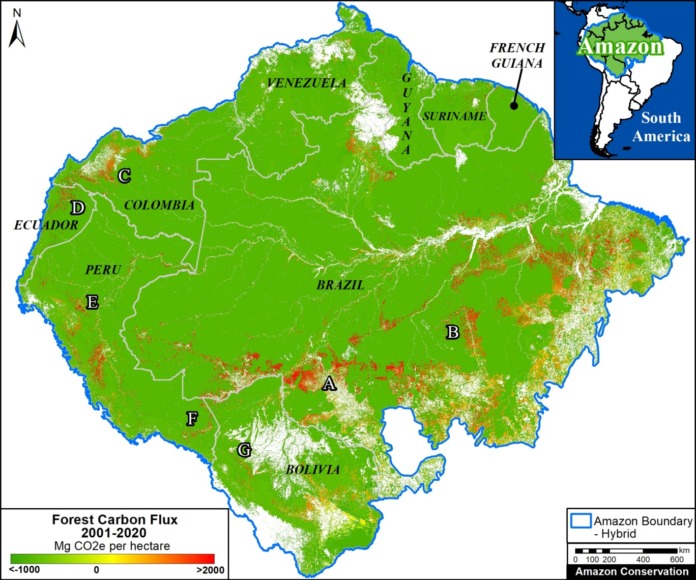
Base Map. Forest Carbon Flux across the Amazon, 2001-2020. Data: Harris et al 2021. Analysis: Amazon Conservation/MAAP.

A pair of recent scientific studies revealed that parts of the Amazon now emit more carbon into the atmosphere than they absorb (Gatti et al 2021, Harris et al 2021).

Here, we dig deeper and highlight the key finding: the Brazilian Amazon has become a net carbon source over the past 20 years, whereas the total Amazon is still a net carbon sink.

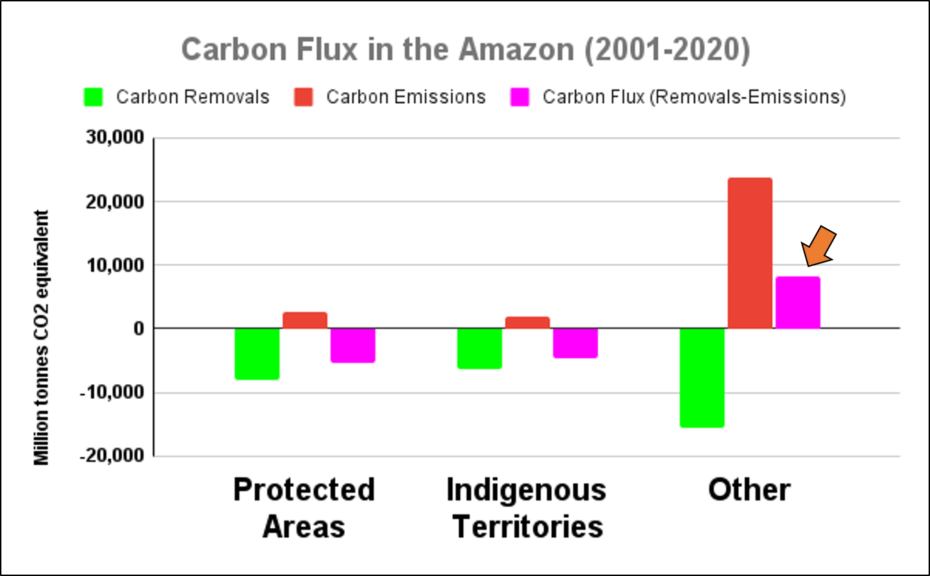
We also show that protected areas and indigenous territories are crucial carbon sinks, showing once again their importance and effectiveness for overall conservation across the Amazon (MAAP #141).

One of the noted studies (Harris et al 2021) presented a new global monitoring system for forest carbon flux based on satellite data.

Here, we independently analyze this data with a focus on the Amazon.*

The flux is the crucial difference between forest carbon emissions (such as deforestation) and removals from the atmosphere (such as intact forests and regrowth).

A negative flux indicates that removals exceed emissions and the area is a carbon sink, thus buffering climate change. The Base Map illustrates these sinks in green.

A positive flux indicates that emissions exceed removals and the area has become a carbon source, thus exacerbating climate change. The Base Map illustrates these sources in red.

Below, we illustrate the carbon flux results and then zoom in on some of the key carbon sinks (such as protected areas and indigenous territories) and carbon sources (high deforestation areas) across the Amazon.

Amazon Carbon Flux

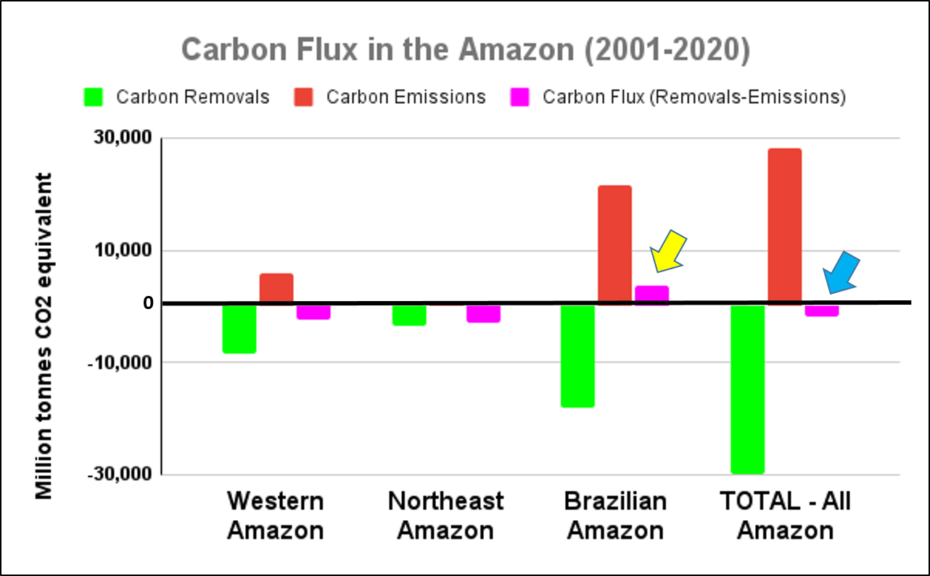
The two graphs below show levels of carbon removals in green and carbon emissions in red across the western Amazon (Bolivia, Colombia, Ecuador, and Peru), northeastern Amazon (French Guiana, Guyana, Suriname, and Venezuela), Brazilian Amazon, and total Amazon. The resulting carbon flux is highlighted in pink.

The arrows highlight three critical results:

  • The Brazilian Amazon has become a net carbon source (positive flux indicated by yellow arrow in Graph 1). That is, emissions now exceed removals (3,600 million tonnes of carbon dioxide equivalent over the past 20 years), exacerbating climate change.
    l
  • The total Amazon is still a net carbon sink (negative flux indicated by blue arrow in Graph 1). That is, removals still exceed emissions (-1,700 million tonnes of carbon dioxide equivalent over the past 20 years), helping mitigate climate change, mainly thanks to the role of the western and northeastern Amazon.
    j
  • Protected areas and indigenous territories are effective carbon sinks, while other areas outside these key designations are the major carbon source (positive flux indicated by orange arrow in Graph 2).
Graph 1. Carbon Flux in the Amazon, 2001-20. Data: Harris et al 2021. Analysis: Amazon Conservation/MAAP.
Graph 2. Carbon Flux in the Amazon, 2001-20. Data: Harris et al 2021. Analysis: Amazon Conservation/MAAP.

Key Amazon Carbon Sinks: Protected Areas & Indigenous Territories

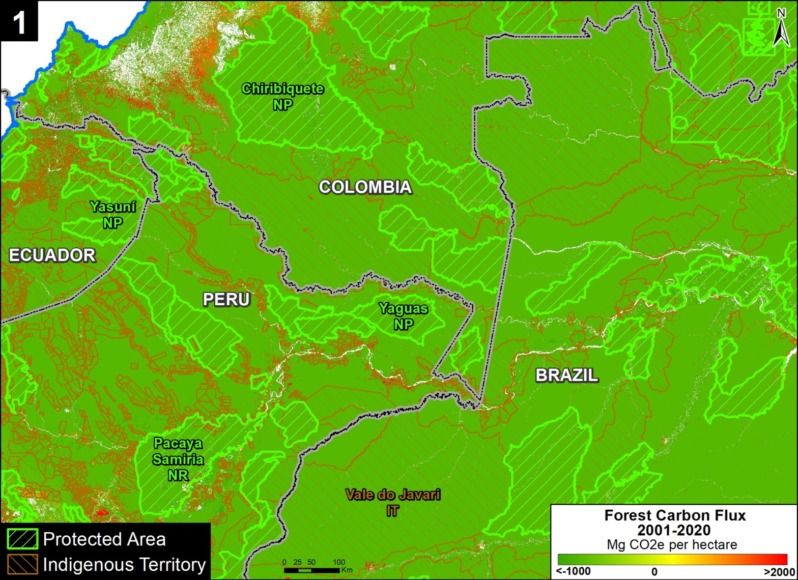
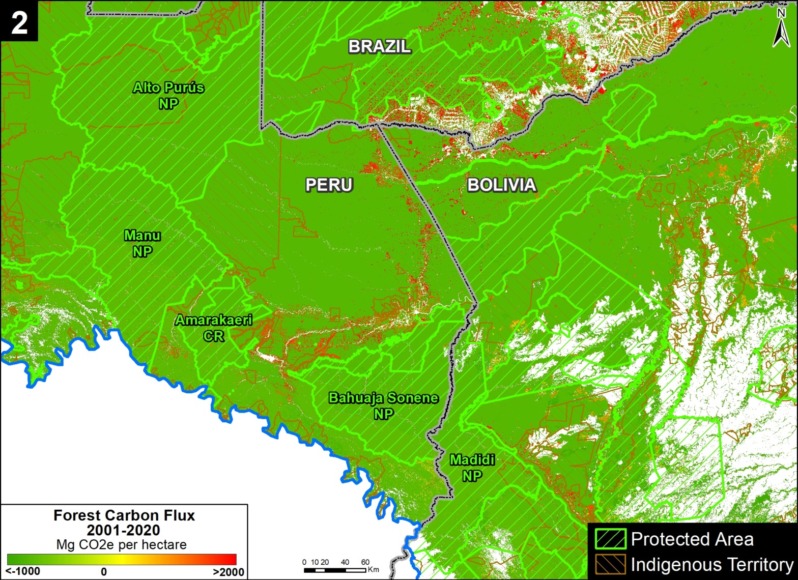
Zooms 1 and 2 show two major carbon sinks in the western Amazon.

Zoom 1 focuses in on the northwestern Amazon, stretching across four countries (Brazil, Peru, Colombia, and Ecuador). This region includes large protected areas (such as Yasuni National Park in Ecuador, Chiribiquete National Park in Colombia, and Yaguas National Park in Peru) and indigenous territories (such as Vale do Javari in Brazil).

Zoom 2 focuses in on the southwestern Amazon, stretching across three countries (Brazil, Peru, and Bolivia). This region also includes large protected areas (such as Alto Purus, Manu, and Bahuaja Sonene National Parks in Peru and Madidi National Park in Bolivia).

Base Map: Amazon carbon sinks, indicated by insets 1 and 2. Data: Harris et al 2021.


Key Amazon Carbon Sources: High Deforestation Areas

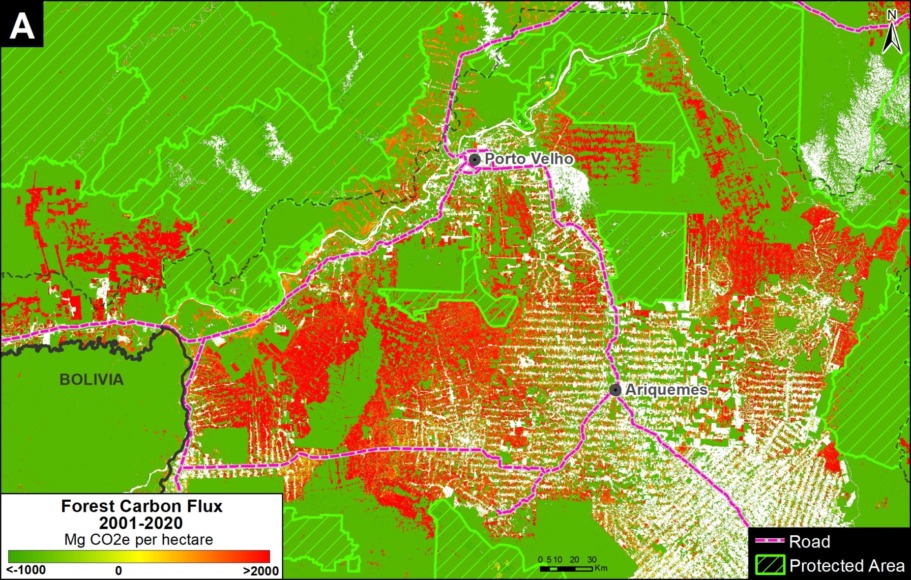
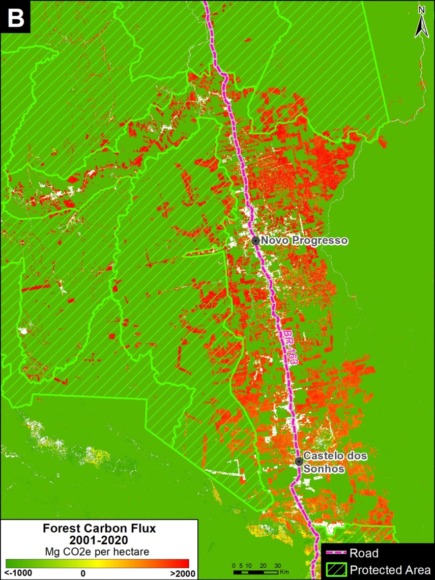
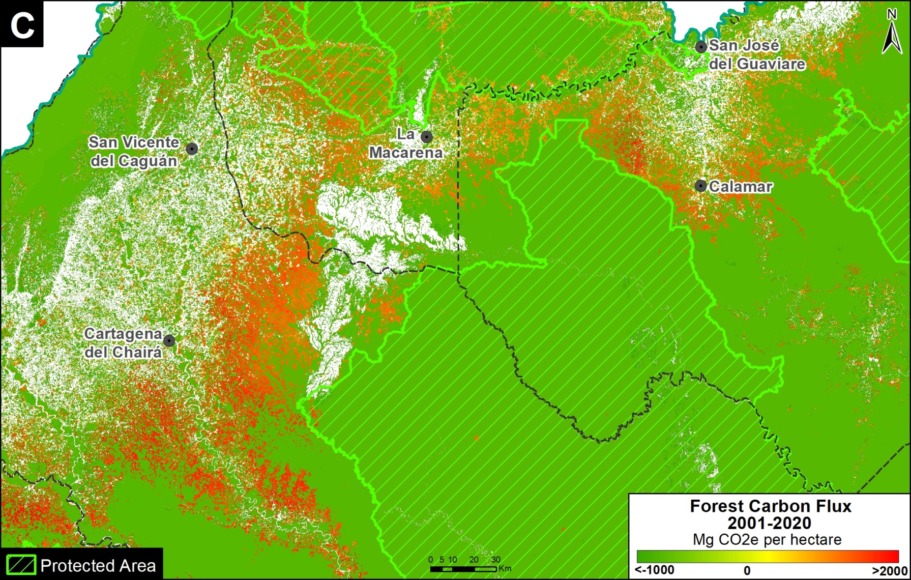
Zooms A-H show eight major carbon sources in the western Amazon.

Zooms A and B show two of the major deforestation fronts in the Brazilian Amazon. Zoom A shows the massive deforestation around the city of Porto Velho, in the state of Rondônia and near the border with the state of Amazonas. Zoom B shows the massive deforestation along the BR-163 highway in the state of Pará.

Base Map: Amazon carbon sources, indicated by letters A-G. Data: Harris et al 2021.

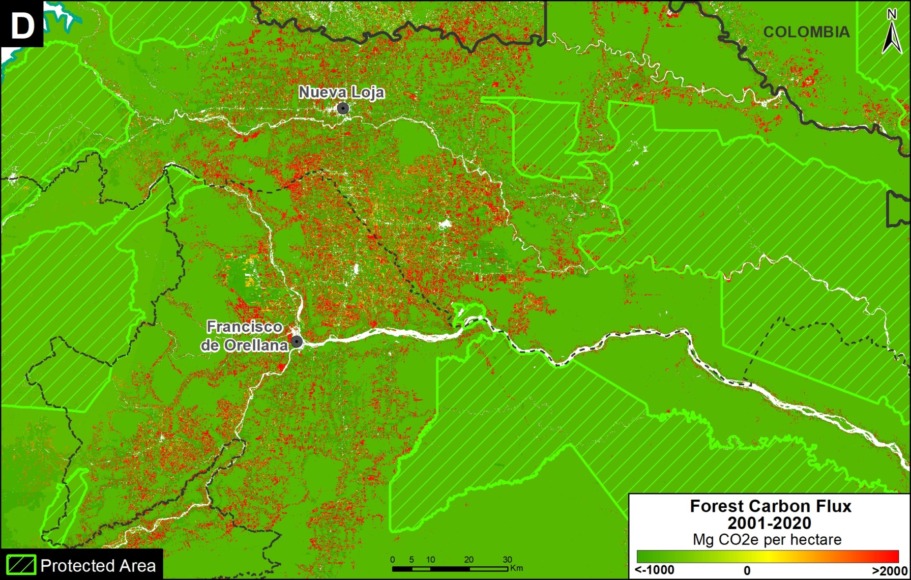
Moving to the western Amazon, Zoom C shows the arc of deforestation in the northwestern Colombian Amazon and Zoom D shows the major deforestation front in the northern Ecuadorian Amazon.

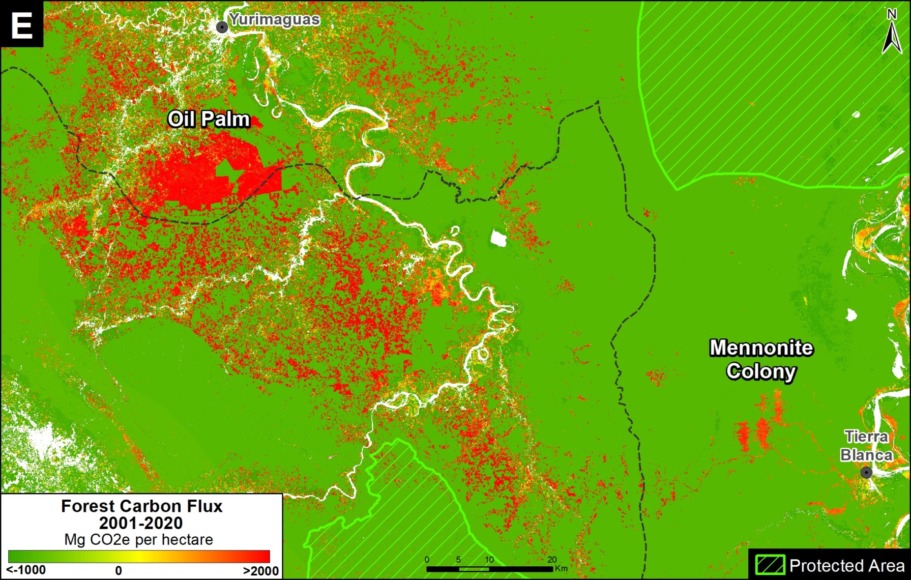
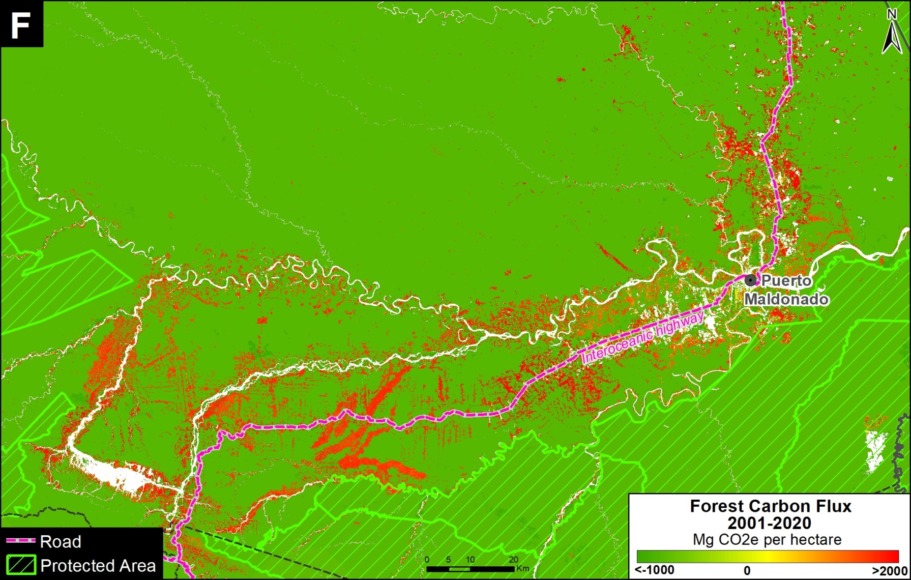
Zooms E and F show two of the major deforestation fronts in the Peruvian Amazon. Zoom E shows large-scale deforestation from oil palm plantations and a new Mennonite colony in the north. Zoom F shows the major deforestation front in the south, along the Interoceanic Highway, surrounded by gold mining and small-scale agriculture.


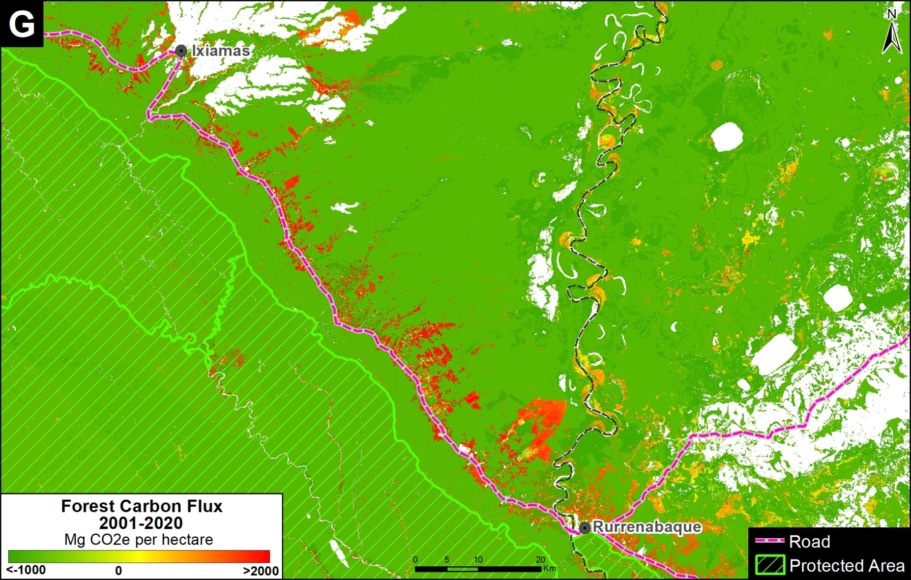
Finally, Zoom G shows the deforestation along the road connecting Rurrenabaque and Ixiamas, including the new large-scale sugar cane plantation.


*Methodology & Notes

Base Map, Figure 1, and Zoom maps are based on 30-meter, satellite-based data obtained from Harris et al (2021). Our geographic range included nine countries and consists of a combination of the Amazon biogeographic limit (as defined by RAISG) plus the Amazon watershed limit in Bolivia. See Base Map above for delineation of this hybrid Amazon limit, designed for maximum inclusion.

References

Gatti, LV et al (2021) Amazonia as a carbon source linked to deforestation and climate change. Nature 595, 388–393.

Harris NL et al (2021) Global maps of twenty-first century forest carbon fluxes. Nature Climate Change 11, 234-240.

Acknowledgements

We thank M. Silman (Wake Forest University), D. Gibbs (WRI), M.E. Gutierrez (ACCA), D. Larrea (ACEAA), J. Beavers (ACA), and A. Folhadella (ACA) for their helpful comments on this report.

This work was supported by the Norwegian Agency for Development Cooperation (NORAD), and International Conservation Fund of Canada (ICFC).

Citation

Finer M, Mamani N (2021) The Amazon & Climate Change: Carbon Sink vs Carbon Source. MAAP: 144.

MAAP Synthesis: 2019 Amazon Deforestation Trends and Hotspots

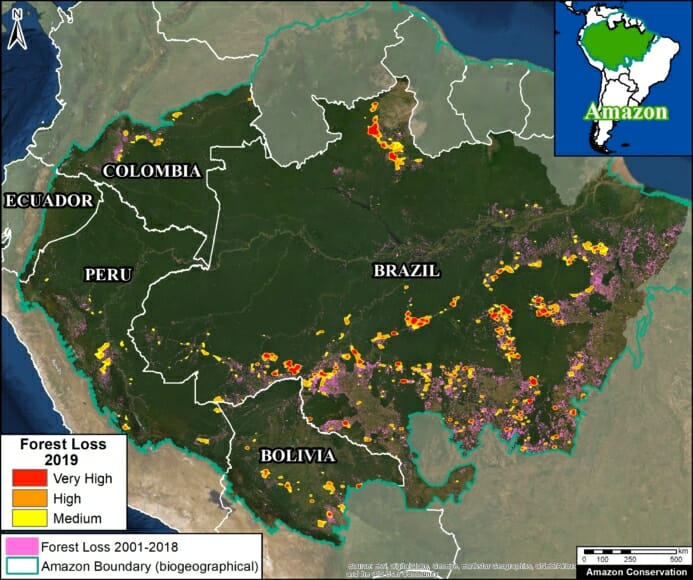
Base Map. Amazon Deforestation, 2001-2019. Data: UMD/GLAD, Hansen/UMD/Google/USGS/NASA, MAAP. Click to see image in high resolution.

MAAP, an initiative of Amazon Conservation, specializes in satellite-based, real-time deforestation monitoring of the Amazon. Our geographic focus covers five countries: Bolivia, Brazil, Colombia, Ecuador, and Peru (see Base Map).

We found that, since 2001, this vast area lost 65.8 million acres (26.6 million hectares) of primary forest, an area equivalent to the size of the United Kingdom (or the U.S. state of Colorado).

In 2019, we published 18 high-impact reports on the most urgent cases of deforestation. 2019 highlights include:

  • Fires in the Brazilian Amazon actually burned freshly deforested areas (MAAP #113);
  • Effective illegal gold mining crackdown in the Peruvian Amazon as a result of the government’s Operation Mercury (MAAP #104);
  • Illegal invasion of protected areas in the Colombian Amazon (MAAP #106);
  • Construction of oil-drilling platforms in the mega-diverse Yasuni National Park of the Ecuadorian Amazon (MAAP #114).

Here, in our annual Synthesis Report, we go beyond these emblematic cases and look at the bigger picture for 2019, describing the most important deforestation trends and hotspots across the Amazon.

*Note: to download a PDF, click the “Print” button below the title.

Synthesis Key Findings

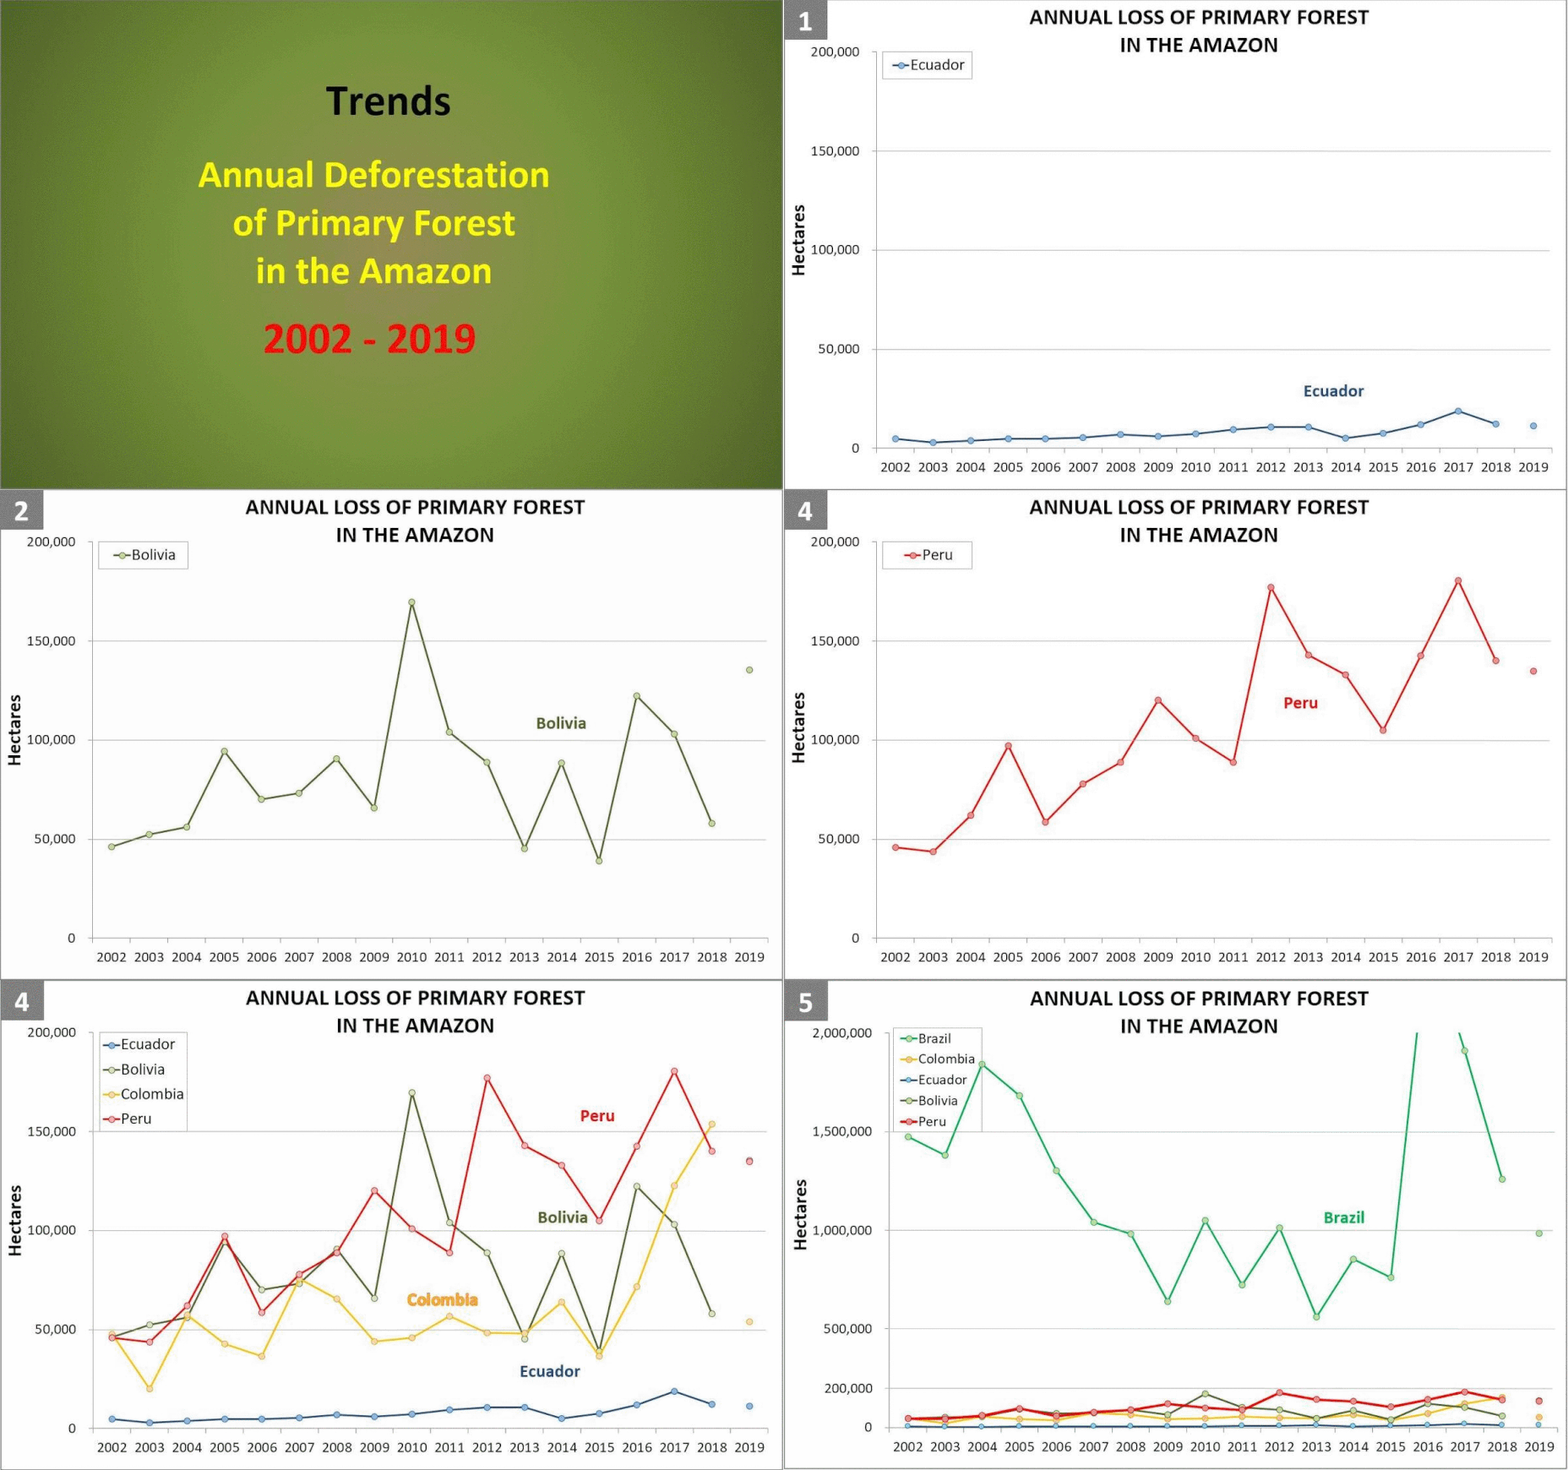
Trends: We present a GIF comparing deforestation trends for each country since 2001. The preliminary 2019 estimates have several important headlines:
  • Possible major deforestation decrease in the Colombian Amazon following a dramatic increase over the previous three years;
  • Likely major deforestation increase in the Bolivian Amazon due to forest fires;
  • Downward deforestation trend continues in the Peruvian Amazon, but still historically high;
  • Deforestation of 2.4 million acres in the Brazilian Amazon, but the trend depends on the data source.
Hotspots: We present a Base Map highlighting the major deforestation hotspots in 2019. Results emphasize the deforestation and fires in the Brazilian Amazon, along with several key areas in Colombia, Peru, and Bolivia.
.

Deforestation Trends 2001-2019

The following GIF shows deforestation trends for each country between 2001 and 2019 (see descriptive notes below). Click here for static versions of each graph.

Three important points about the data: First, as a baseline, we use annual forest loss from the University of Maryland to have a consistent source across all five countries (thus it may differ from official national data). Second, we applied a filter to only include loss of primary forest (see Methodology). Third, the 2019 data represents a preliminary estimate based on early warning alerts.

  1. Deforestation in the Ecuadorian Amazon is relatively low, reaching a maximum of 18,800 hectares (46,500 acres) in 2017. The estimate for 2019 is 11,400 hectares (28,000 acres).
    .
  2. In the Bolivian Amazon, deforestation decreased in 2018 to 58,000 hectares (143,000 acres) after a peak in 2016 of 122,000 hectares (302,000 acres). However, with the recent widespread forest fires, deforestation increased again in 2019, to 135,400 hectares (334,465 acres).
    .
  3. The Colombian Amazon experienced a deforestation boom starting in 2016 (coinciding with the FARC peace accords), reaching an historical high of 153,800 hectares (380,000 acres) in 2018. However, the deforestation estimate for 2019 is back to pre-boom levels at 53,800 hectares (133,000 acres).
    .
  4. Deforestation in the Peruvian Amazon declined in 2018 (compared to 2017) to 140,000 hectares (346,325 acres), but remained relatively high compared to historical data. The official deforestation data from the Peruvian government for 2018 is slightly higher at 154,700 hectares (382,272 acres), but also represents an important reduction compared to 2017. The deforestation estimate for 2019 indicates the continued downward trend to 134,600 hectares (332,670 acres).
    .
  5. Deforestation in the Brazilian Amazon is on another level compared to the other four countries. The 2019 deforestation estimate of 985,000 hectares (2.4 million acres) is consistent with the official data of the Brazilian government. The trend, however, is quite different; we show a decrease in deforestation compared to the previous three years, but the official data indicates an increase. To better understand the differences between data sources (including spatial resolution, inclusion of burned areas, and timeframe), consult this blog by Global Forest Watch.

Deforestation Hotspots 2019

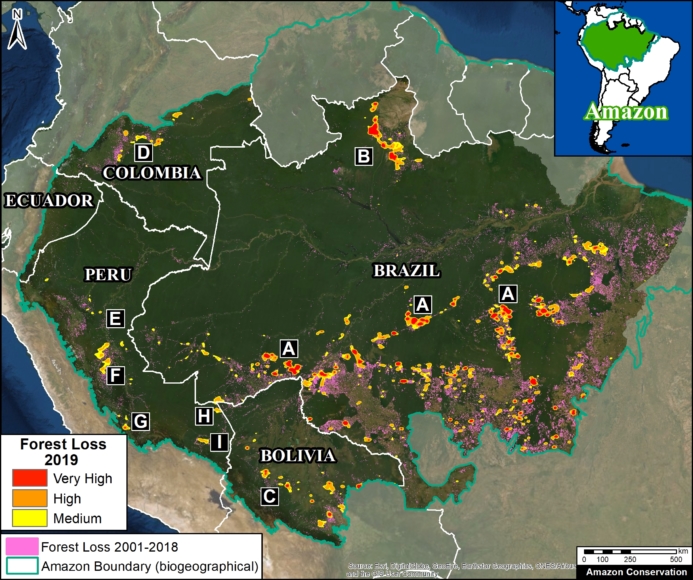
Base Map. Deforestation Hotspots 2019. Data: MAAP, UMD/GLAD, Hansen/UMD/Google/USGS/NASA. Click to see image in high resolution.

The Base Map shows the most intense deforestation hotspots during 2019.

Many of the major deforestation hotspots were in Brazil. The letters A indicate areas deforested between March and July, and then burned starting in August, covering over 735,000 acres in the states of Rondônia, Amazonas, Mato Grosso, Acre, and Pará (MAAP #113). They also indicate areas where fire escaped into the surrounding primary forest, impacting an additional 395,000 acres. There is a concentration of these hotspots along the Trans-Amazonian Highway. The letter B indicates uncontrolled forest fires earlier in the year (March) in the state of Roraima (MAAP #109).

Bolivia also had an intense 2019 fire season. Letter C indicates the area where fires in Amazonian savanna ecosystems escaped to the surrounding forests.

In Colombia, the letter D indicates an area of high deforestation surrounding and within four protected areas: Tinigua, Chiribiquete, and Macarena National Parks, and the Nukak National Reserve (MAAP #106).

In Peru, there are several key areas to highlight. Letter E indicates a new Mennonite colony that has caused the deforestation of 2,500 acres in 2019, near the town of Tierra Blanca in the Loreto region (MAAP #112). Letter F indicates an area of high concentration of small-scale deforestation in the central Amazon (Ucayali and Huánuco regions), with cattle ranching as one of the main causes (MAAP #37). Letter G indicates an area of high concentration of deforestation along the Ene River (Junín and Ayacucho regions). In the south (Madre de Dios region), letter H indicates expanding agricultural activity around the town of Iberia (MAAP #98) and letter I indicates deforestation caused by a combination of gold mining and agricultural activity.

Methodology

As noted above, there are three important considerations about the data in our analysis: First, as a baseline, we use annual forest loss from the University of Maryland to have a consistent source across all five countries. Thus, the values may differ from official national data. Second, we applied a filter to only include loss of primary forest in order to better approximate the official methodology and data. Third, the 2019 data represents a preliminary estimate based on early warning alerts.

The baseline forest loss data presented in this report were generated by the Global Land Analysis and Discovery (GLAD) laboratory at the University of Maryland (Hansen et al 2013) and presented by Global Forest Watch. Our study area is strictly what is highlighted in the Base Map.

Specifically, for our estimate of forest cover loss, we multiplied the annual “forest cover loss” data by the density percentage of the “tree cover” from the year 2001 (values >30%).

For our estimate of primary forest loss, we intersected the forest cover loss data with the additional dataset “primary humid tropical forests” as of 2001 (Turubanova et al 2018). For more details on this part of the methodology, see the Technical Blog from Global Forest Watch (Goldman and Weisse 2019).

All data were processed under the geographical coordinate system WGS 1984. To calculate the areas in metric units the UTM (Universal Transversal Mercator) projection was used: Peru and Ecuador 18 South, Colombia 18 North, Western Brazil 19 South and Bolivia 20 South.

Lastly, to identify the deforestation hotspots, we conducted a kernel density estimate. This type of analysis calculates the magnitude per unit area of a particular phenomenon, in this case forest cover loss. We conducted this analysis using the Kernel Density tool from Spatial Analyst Tool Box of ArcGIS. We used the following parameters:

Search Radius: 15000 layer units (meters)
Kernel Density Function: Quartic kernel function
Cell Size in the map: 200 x 200 meters (4 hectares)
Everything else was left to the default setting.

For the Base Map, we used the following concentration percentages: Medium: 10%-20%; High: 21%-35%; Very High: >35%.

References

Goldman L, Weisse M (2019) Explicación de la Actualización de Datos de 2018 de Global Forest Watch. https://blog.globalforestwatch.org/data-and-research/blog-tecnico-explicacion-de-la-actualizacion-de-datos-de-2018-de-global-forest-watch

Hansen, M. C., P. V. Potapov, R. Moore, M. Hancher, S. A. Turubanova, A. Tyukavina, D. Thau, S. V. Stehman, S. J. Goetz, T. R. Loveland, A. Kommareddy, A. Egorov, L. Chini, C. O. Justice, and J. R. G. Townshend. 2013. “High-Resolution Global Maps of 21st-Century Forest Cover Change.” Science 342 (15 November): 850–53. Data available on-line from: http://earthenginepartners.appspot.com/science-2013-global-forest.

Planet Team (2017). Planet Application Program Interface: In Space for Life on Earth. San Francisco, CA. https://api.planet.com

Turubanova S., Potapov P., Tyukavina, A., and Hansen M. (2018) Ongoing primary forest loss in Brazil, Democratic Republic of the Congo, and Indonesia. Environmental Research Letters  https://doi.org/10.1088/1748-9326/aacd1c 

Acknowledgements

Agradecemos a S. Novoa (ACCA), R. Botero (FCDS), A. Condor (ACCA) y G. Palacios por sus útiles comentarios a este reporte.

Acknowledgements

We thank S. Novoa (ACCA), R. Botero (FCDS), A. Condor (ACCA), A. Folhadella (Amazon Conservation), M. Cohen, and G. Palacios for helpful comments to earlier versions of this report.

This work was supported by the following major funders: NASA/USAID (SERVIR), Norwegian Agency for Development Cooperation (NORAD), Gordon and Betty Moore Foundation, International Conservation Fund of Canada (ICFC), Metabolic Studio, Erol Foundation, MacArthur Foundation, and Global Forest Watch Small Grants Fund (WRI).

Citation

Finer M, Mamani N (2020) MAAP Synthesis: 2019 Amazon Deforestation Trends and Hotspots. MAAP Synthesis #4.

MAAP #113: Satellites Reveal what Fueled Brazilian Amazon Fires

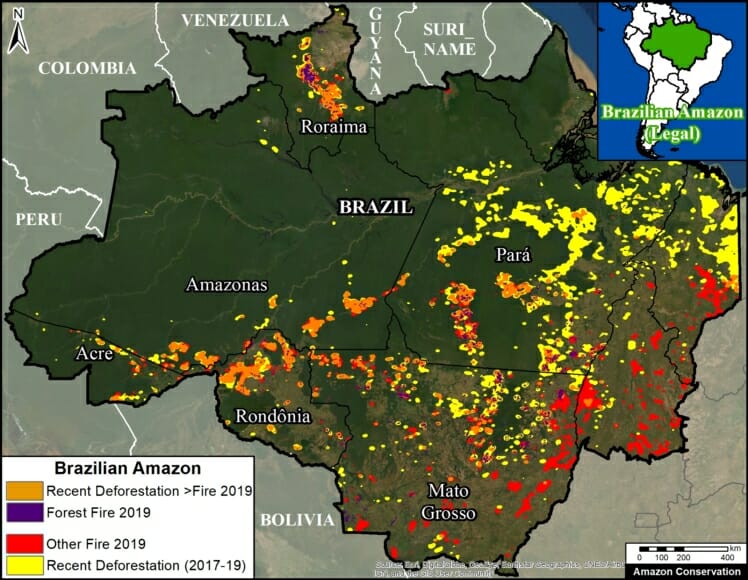
Base Map. Brazilian Amazon 2019. Data: UMD/GLAD, NASA (MODIS), DETER, Hansen/UMD/Google/USGS/NASA.

As part of our ongoing coverage, we present two key new findings about the Brazilian Amazon fires that captured the world’s attention in August (see our novel satellite-based methodology below).

First, we found that many of the fires, covering over 450,000 hectares, burned areas recently deforested since 2017 (orange in Base Map). That is a massive area equivalent to over a million acres (or 830,000 American football fields), mostly in the states Amazonas, Rondônia, and Pará.

Importantly, 65% (298,000 hectares) of this area was both deforested and burned this year, 2019.

Second, we found 160,400 hectares of primary forest burned in 2019 (purple in Base Map).* Most of these areas surround deforested lands in the states of Mato Grosso and Pará, and were likely pasture or agricultural fires that escaped into the forest.

As far as we know, these are the first precise estimates based on detailed analysis of satellite imagery. Other estimates based solely on fire alerts tend to greatly overestimate burned areas due to their large spatial resolution.

Below we present a series of satellite time-lapse videos showing examples of the different types of fires we documented.

Policy Implications

The policy implications of these findings are critically important: national and international focus needs to be on minimizing new deforestation, in addition to fire prevention and management.

That is, we need to recognize that many of the fires are in fact a lagging indicator of previous deforestation, thus to minimize fires we need to minimize deforestation.

For example, one of the leading deforestation drivers in the Brazilian Amazon is cattle ranching (1, 2, 3). What measures can be taken to prevent the further expansion of the ranching frontier?

Satellite Time-lapse Videos

Deforestation Followed by Fire

Video A shows the deforestation of 1,760 hectares (4,350 acres) in Mato Grosso state in 2019 (May to July), followed by fires in August. Planet link.

Video B shows the deforestation of 650 hectares (1,600 acres) in Rondônia state in 2019 (April to July), followed by fire in August. Planet link.

Deforestation Caused by Fire

Videos C-D show 2019 fires burning primary or secondary forest surrounding recently or previously cleared areas.

*Notes

In addition to the finding of 160,400 hectares of primary forest burned in 2019, we also found: 25,800 hectares of secondary forest burned in 2019;
35,640 hectares of primary forest burned in the northern state of Roraima in March 2019 (plus an additional 16,500 hectares of secondary forest.

Methodology

Deforestation Fires

We created two “hotspots” layers, one for deforestation and the other for fires, by conducting a kernel density analysis. This type of analysis calculates the magnitude per unit area of a particular phenomenon, in this case forest loss alerts (proxy for deforestation) and temperature anomaly alerts (proxy for fires)

Specifically, we used the following data three sets:

2019 GLAD alert forest loss data (30 meter resolution) from the University of Maryland and available on Global Forest Watch.

2017 and 2018 forest loss data (30 meter resolution) from the University of Maryland and available on Global Forest Watch (4).

NASA’s Fire Information for Resource Management System (FIRMS) MODIS-based fire alert data (1 km resolution).

We conducted the analysis using the Kernel Density tool from Spatial Analyst Tool Box of ArcGIS, using the following parameters:

Search Radius: 15000 layer units (meters)
Kernel Density Function: Quartic kernel function
Cell Size in the map: 200 x 200 meters (4 hectares)
Everything else was left to the default setting.

For the Base Map, we used the following concentration percentages: Medium: 10%-25%; High: 26%-50%; Very High: >50%. We then combined all three categories into one color (yellow for deforestation and red for fire). Orange indicates areas where both layers overlap. As background layer, we also included pre-2019 deforestation data from Brazil’s PRODES system.

We prioritized the orange overalp areas for further analysis. For the major orange areas in Rondônia, Amazonas, Mato Grosso, Acre, and Pará, we conducted a visual analysis using the satellite company Planet’s online portal, which includes an extensive archive of Planet, RapidEye, Sentinel-2, and Landsat data. Using the archive, we identified areas that we visually confirmed a) were deforested in 2017-19 and b) were later burned in 2019 between July and September. We then used the area measure tool to estimate the size of these areas, which ranged from large plantations ( ~1,000 hectares) to many smaller areas scattered across the focal landscape.

Forest Fires:

To estimate forests burned in 2019 we combined analysis of several datasets. First, we started with 30 meter resolution ‘burn scar’ data produced by INPE (National Institute for Space Research) DETER alerts, updated through October 2019. In order to avoid overlapping areas, we eliminated alerts previously reported from 2016 to 2018, and alerts from other land use categories (selective logging, deforestation, degradation and mining, and other). Second, we eliminated previously reported 2001-18 forest loss from University of Maryland and INPE (PRODES). Third, to distinguish burning of primary and secondary forest, we incorporated primary forest data from the University of Maryland (5).

References

  1. Krauss C, Yaffe-Bellany D, Simões M (2019) Why Amazon Fires Keep Raging 10 Years After a Deal to End Them. New York Times. https://www.nytimes.com/2019/10/10/world/americas/amazon-fires-brazil-cattle.html
  2. Kelly M, Cahlan S (2019) The Brazilian Amazon is still burning. Who is responsible? Washington Post. https://www.washingtonpost.com/politics/2019/10/07/brazilian-amazon-is-still-burning-who-is-responsible/#click=https://t.co/q2XkSQWQ77
  3. Al Jazeera (2019) See How Beef Is Destroying The Amazon. https://www.youtube.com/watch?v=9o2M_KL8X6g&feature=youtu.be
  4. Hansen, M. C., P. V. Potapov, R. Moore, M. Hancher, S. A. Turubanova, A. Tyukavina, D. Thau, S. V. Stehman, S. J. Goetz, T. R. Loveland, A. Kommareddy, A. Egorov, L. Chini, C. O. Justice, and J. R. G. Townshend. 2013. “High-Resolution Global Maps of 21st-Century Forest Cover Change.” Science 342 (15 November): 850–53.
  5. Turubanova S., Potapov P., Tyukavina, A., and Hansen M. (2018) Ongoing primary forest loss in Brazil, Democratic Republic of the Congo, and Indonesia. Environmental Research Letters https://doi.org/10.1088/1748-9326/aacd1c 

Acknowledgements

This work was supported by the following major funders: MacArthur Foundation, International Conservation Fund of Canada (ICFC), Norwegian Agency for Development Cooperation (NORAD), Metabolic Studio, and Global Forest Watch Small Grants Fund (WRI).

Citation

Finer M, Mamani N (2019) Satellites Reveal what Fueled Brazilian Amazon Fires. MAAP: 113.

MAAP #100: Western Amazon – Deforestation Hotspots 2018 (a regional perspective)

Base Map. Deforestation Hotspots in the western Amazon. Data: Hansen/UMD/Google/USGS/NASA, GFW, SERNANP, SNAP, SINAP, SERNAP, RAISG

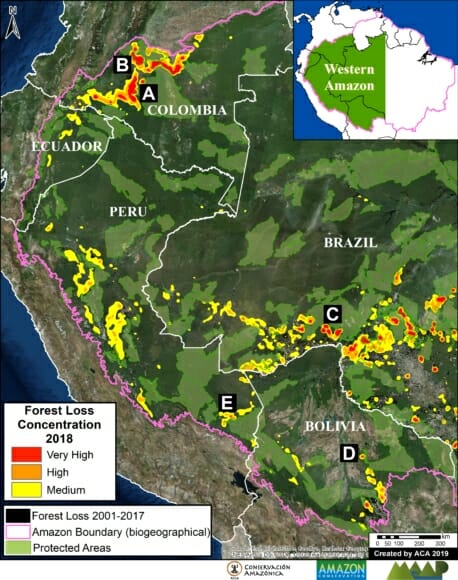
For the 100th MAAP report, we present our first large-scale western Amazon analysis: Colombia, Peru, Ecuador, Bolivia, and western Brazil (see Base Map).

We use the new 2018 data for forest cover loss, generated by the  University of Maryland (Hansen et al 2013) and presented by Global Forest Watch.

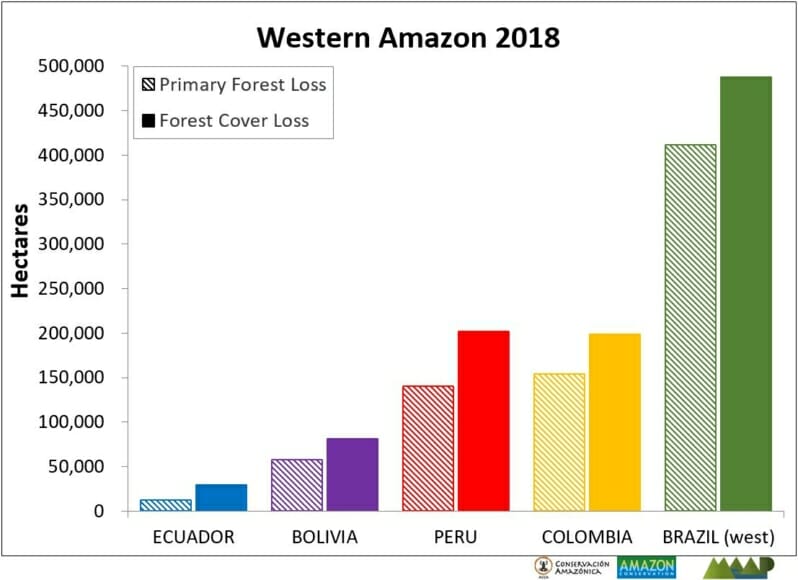
These data indicate 2.5 million acres of forest cover loss in the western Amazon in 2018.*

We conducted an additional analysis that indicates, of this total, 1.9 million acres were primary forest.*

To identify deforestation hotspots consistently across this vast landscape, we conducted a kernel density analysis (see Methodology).

The Base Map shows the hotspots in yellow, orange and red, indicating areas with medium, high, and very high forest loss concentrations, respectively.

Next, we focus on five zones of interest (Zooms A-E) in Colombia, Brazil, Bolivia, and Peru. For all images, please click to enlarge.

*Forest Cover Loss: 5 acres per minute. Almost half (49%) occurred in Brazil, followed by Peru (20%), Colombia (20%), Bolivia (8%), and Ecuador (3%). see Annex.

**Primary Forest Loss: 3.5 acres per minute. Over half (53%) occurred in Brazil, followed by Peru (20%), Colombia (18%), Bolivia (7%), and Ecuador (2%). see Annex.

Colombia

The largest concentration of 2018 forest loss is in the northeast Colombian Amazon (494,000 acres). Out of this total, 11% (56,800 acres) occurred in national parks. National experts indicate that land grabbing has emerged as a leading direct driver of deforestation (Arenas 2018). See MAAP #97 for more information.

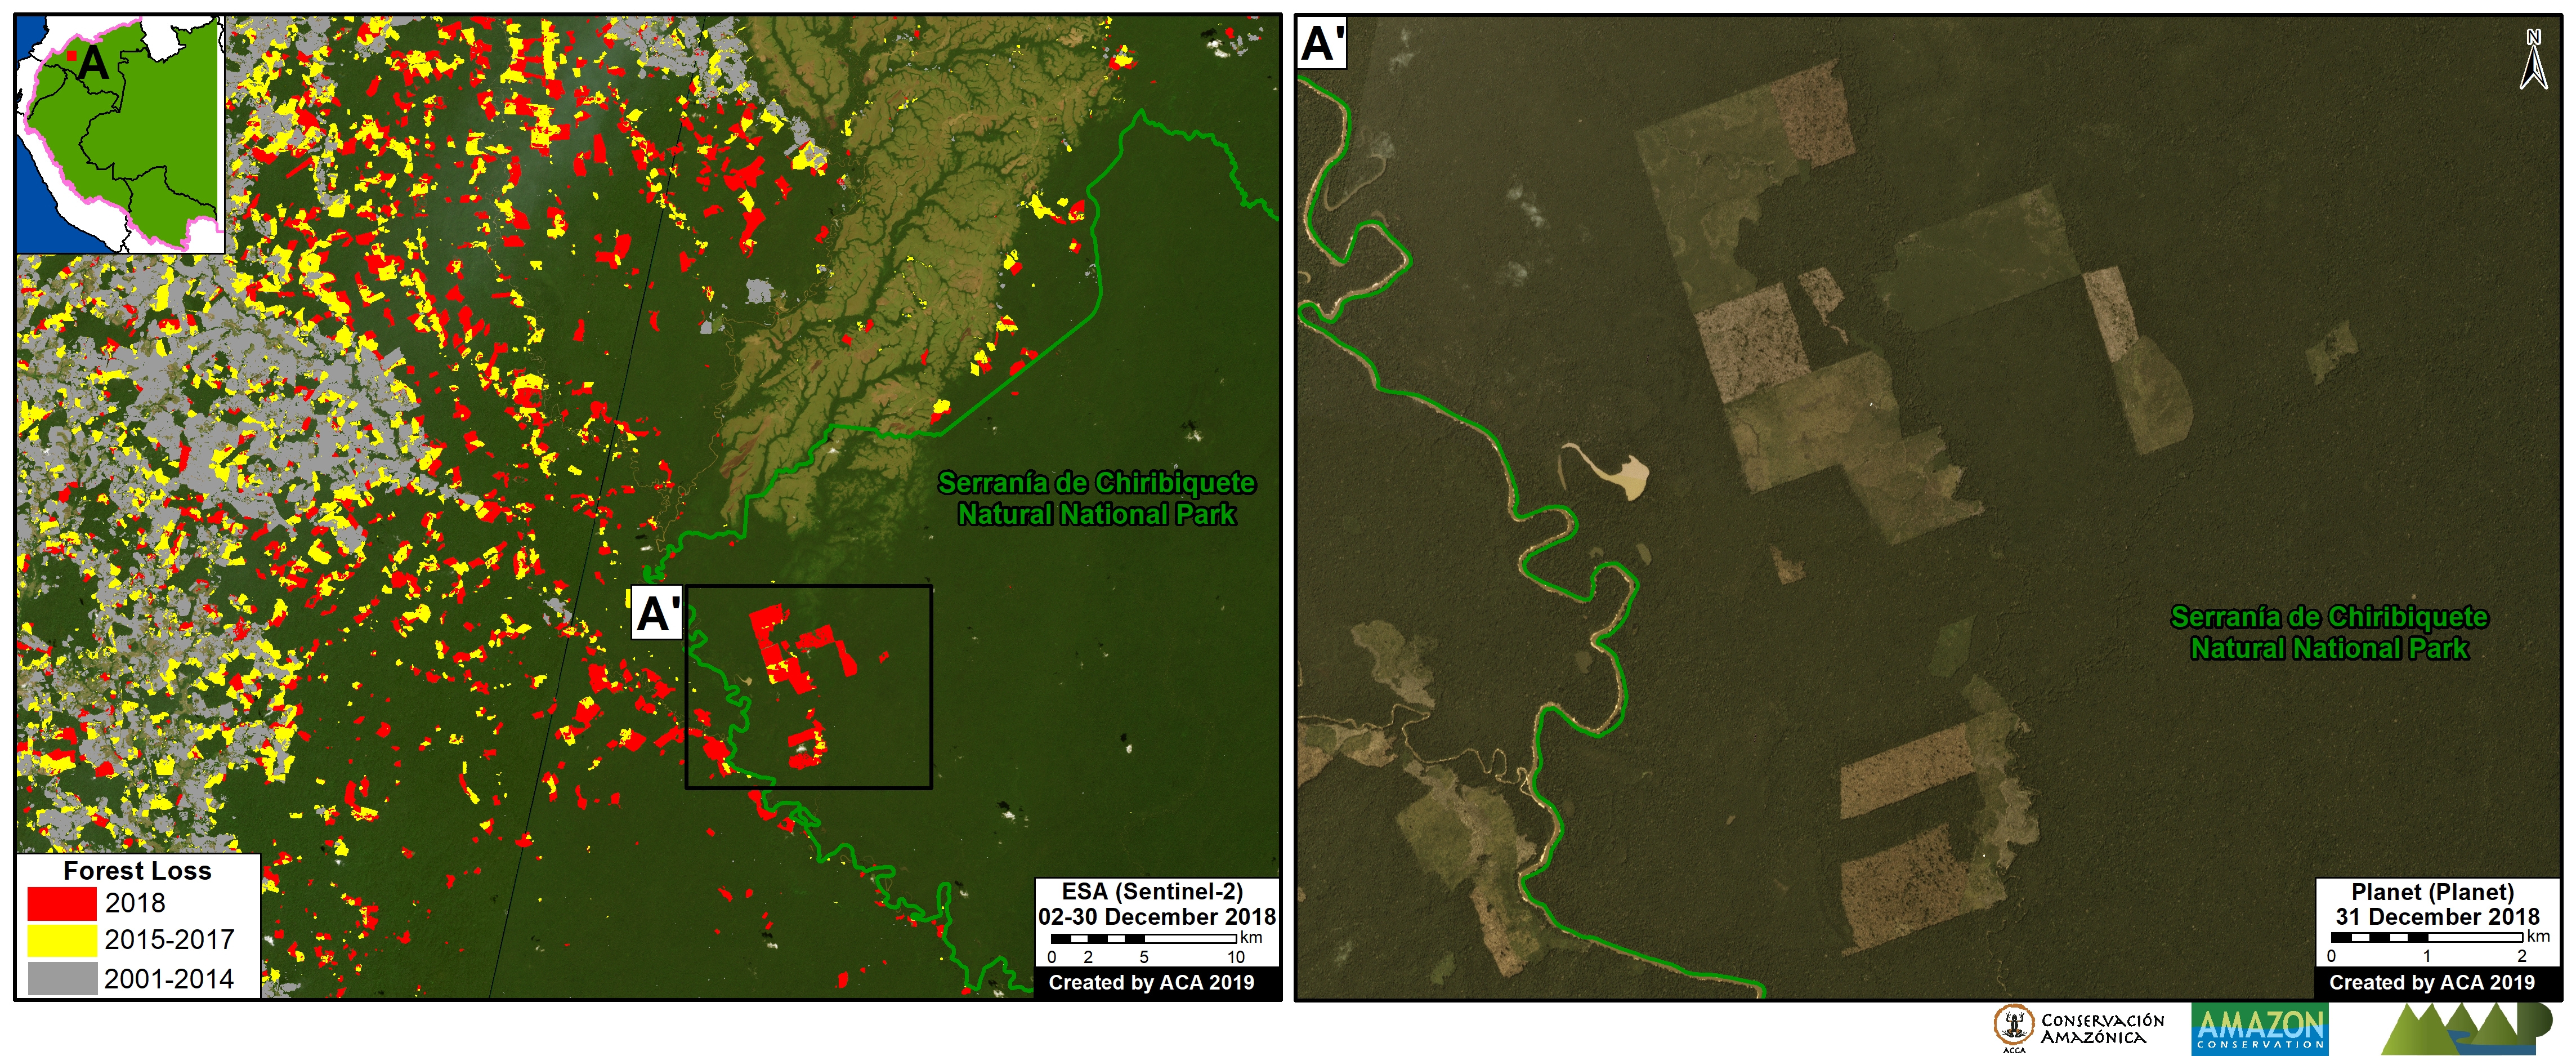
Zoom A shows the forest loss expanding towards western Chiribiquete National Park, including distinct deforestation in this protected area during 2018.

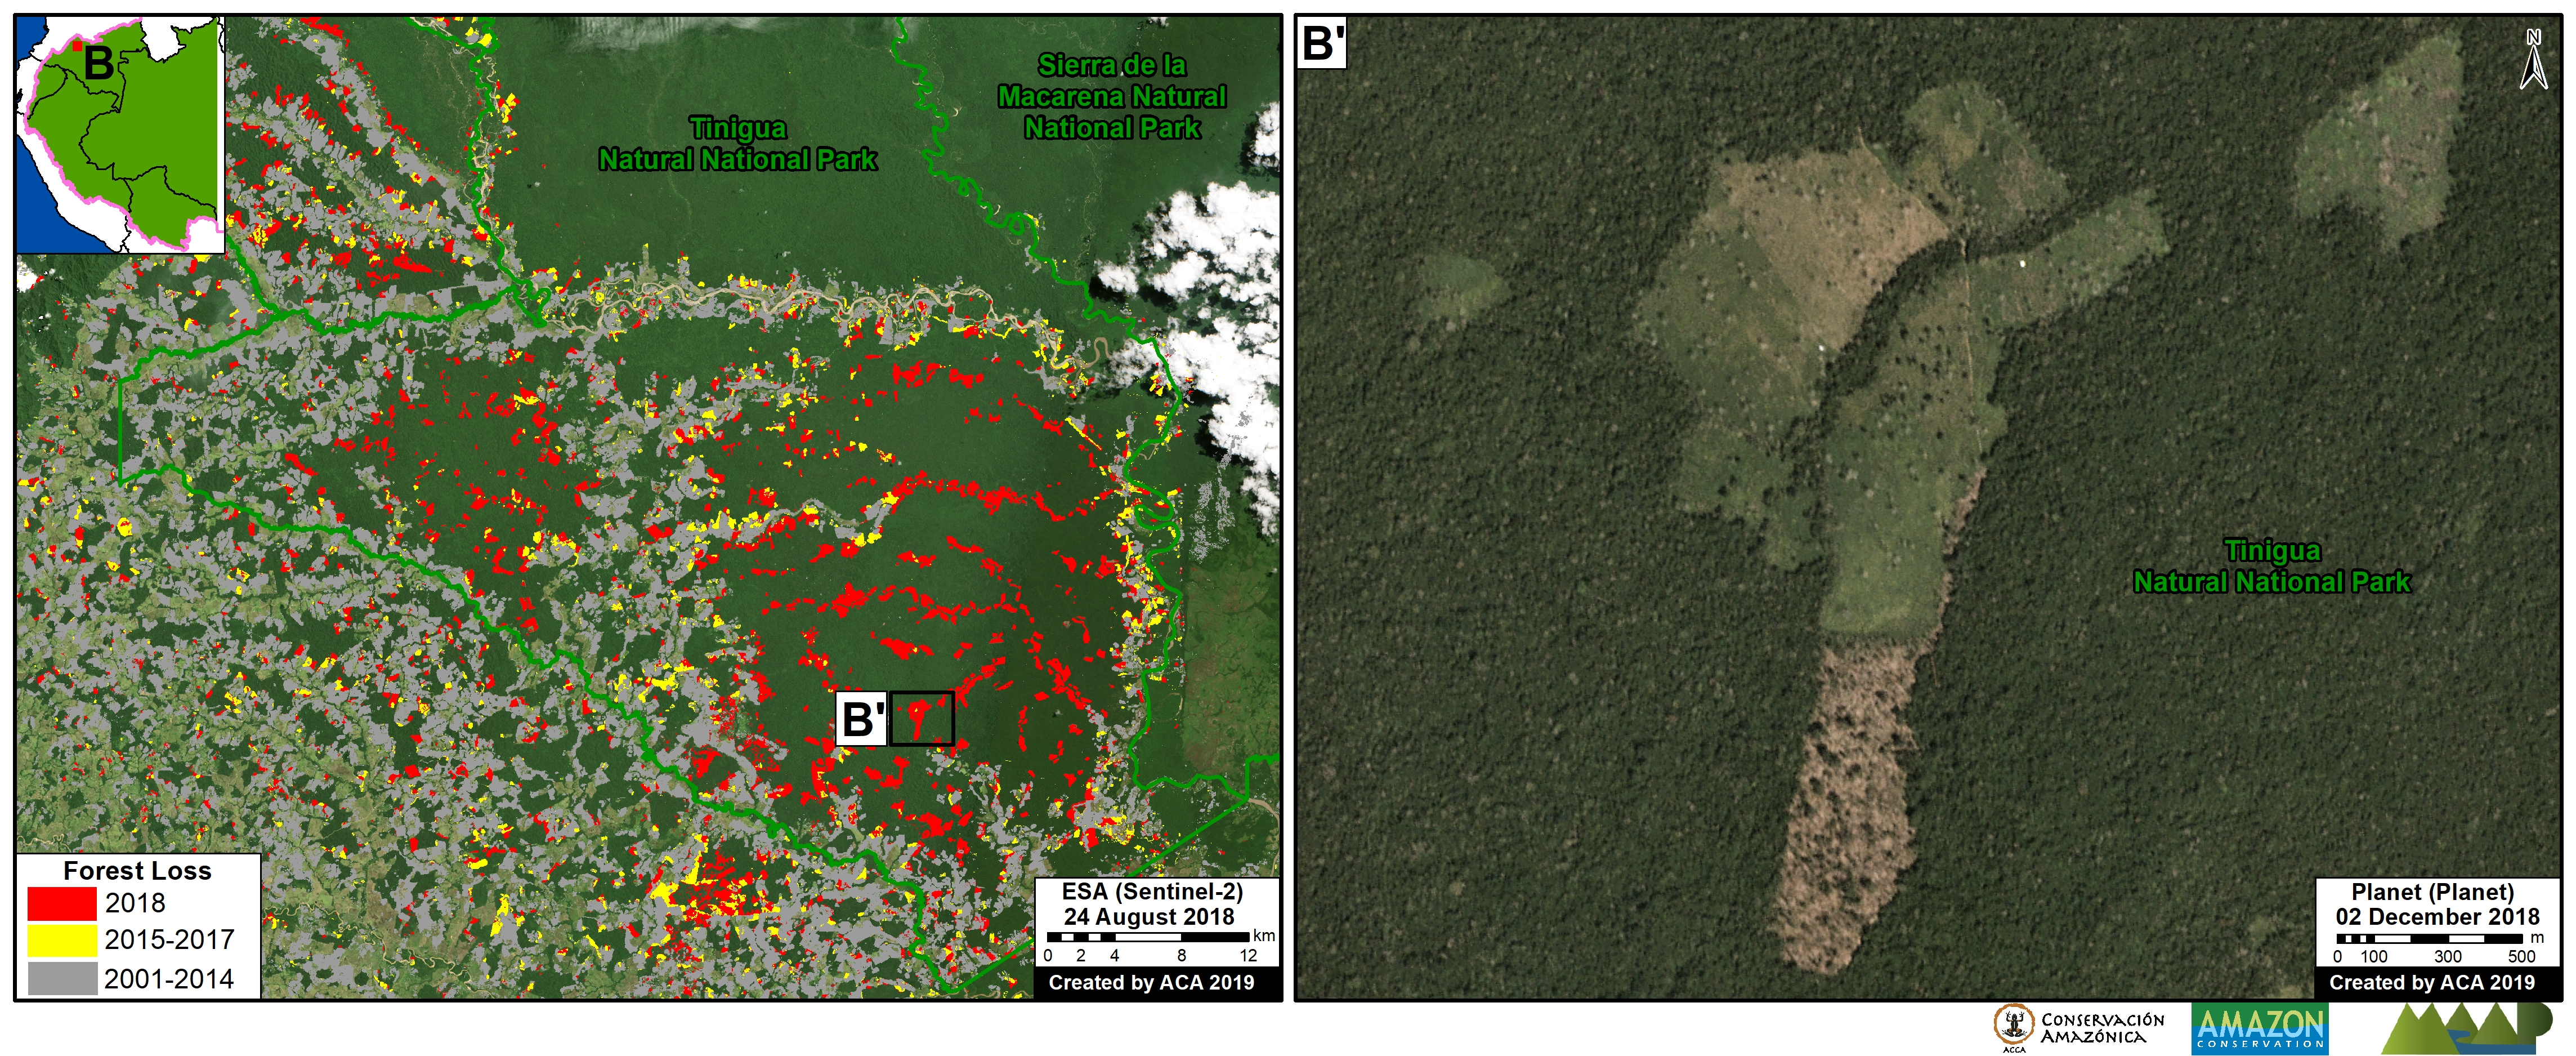
Zoom B shows the extensive 2018 deforestation (30,000 acres) within Tinigua National Park. A recent news report indicates that cattle ranching is one of the factors related to this deforestation.

Zoom A. Colombia-Chiribiquete. Data: Hansen/UMD/Google/USGS/NASA, SINAP, Planet, ESA
Zoom B. Colombia – Tinigua. Data: Hansen/UMD/Google/USGS/NASA, SINAP, Planet, ESA

Brazil (border with Bolivia)

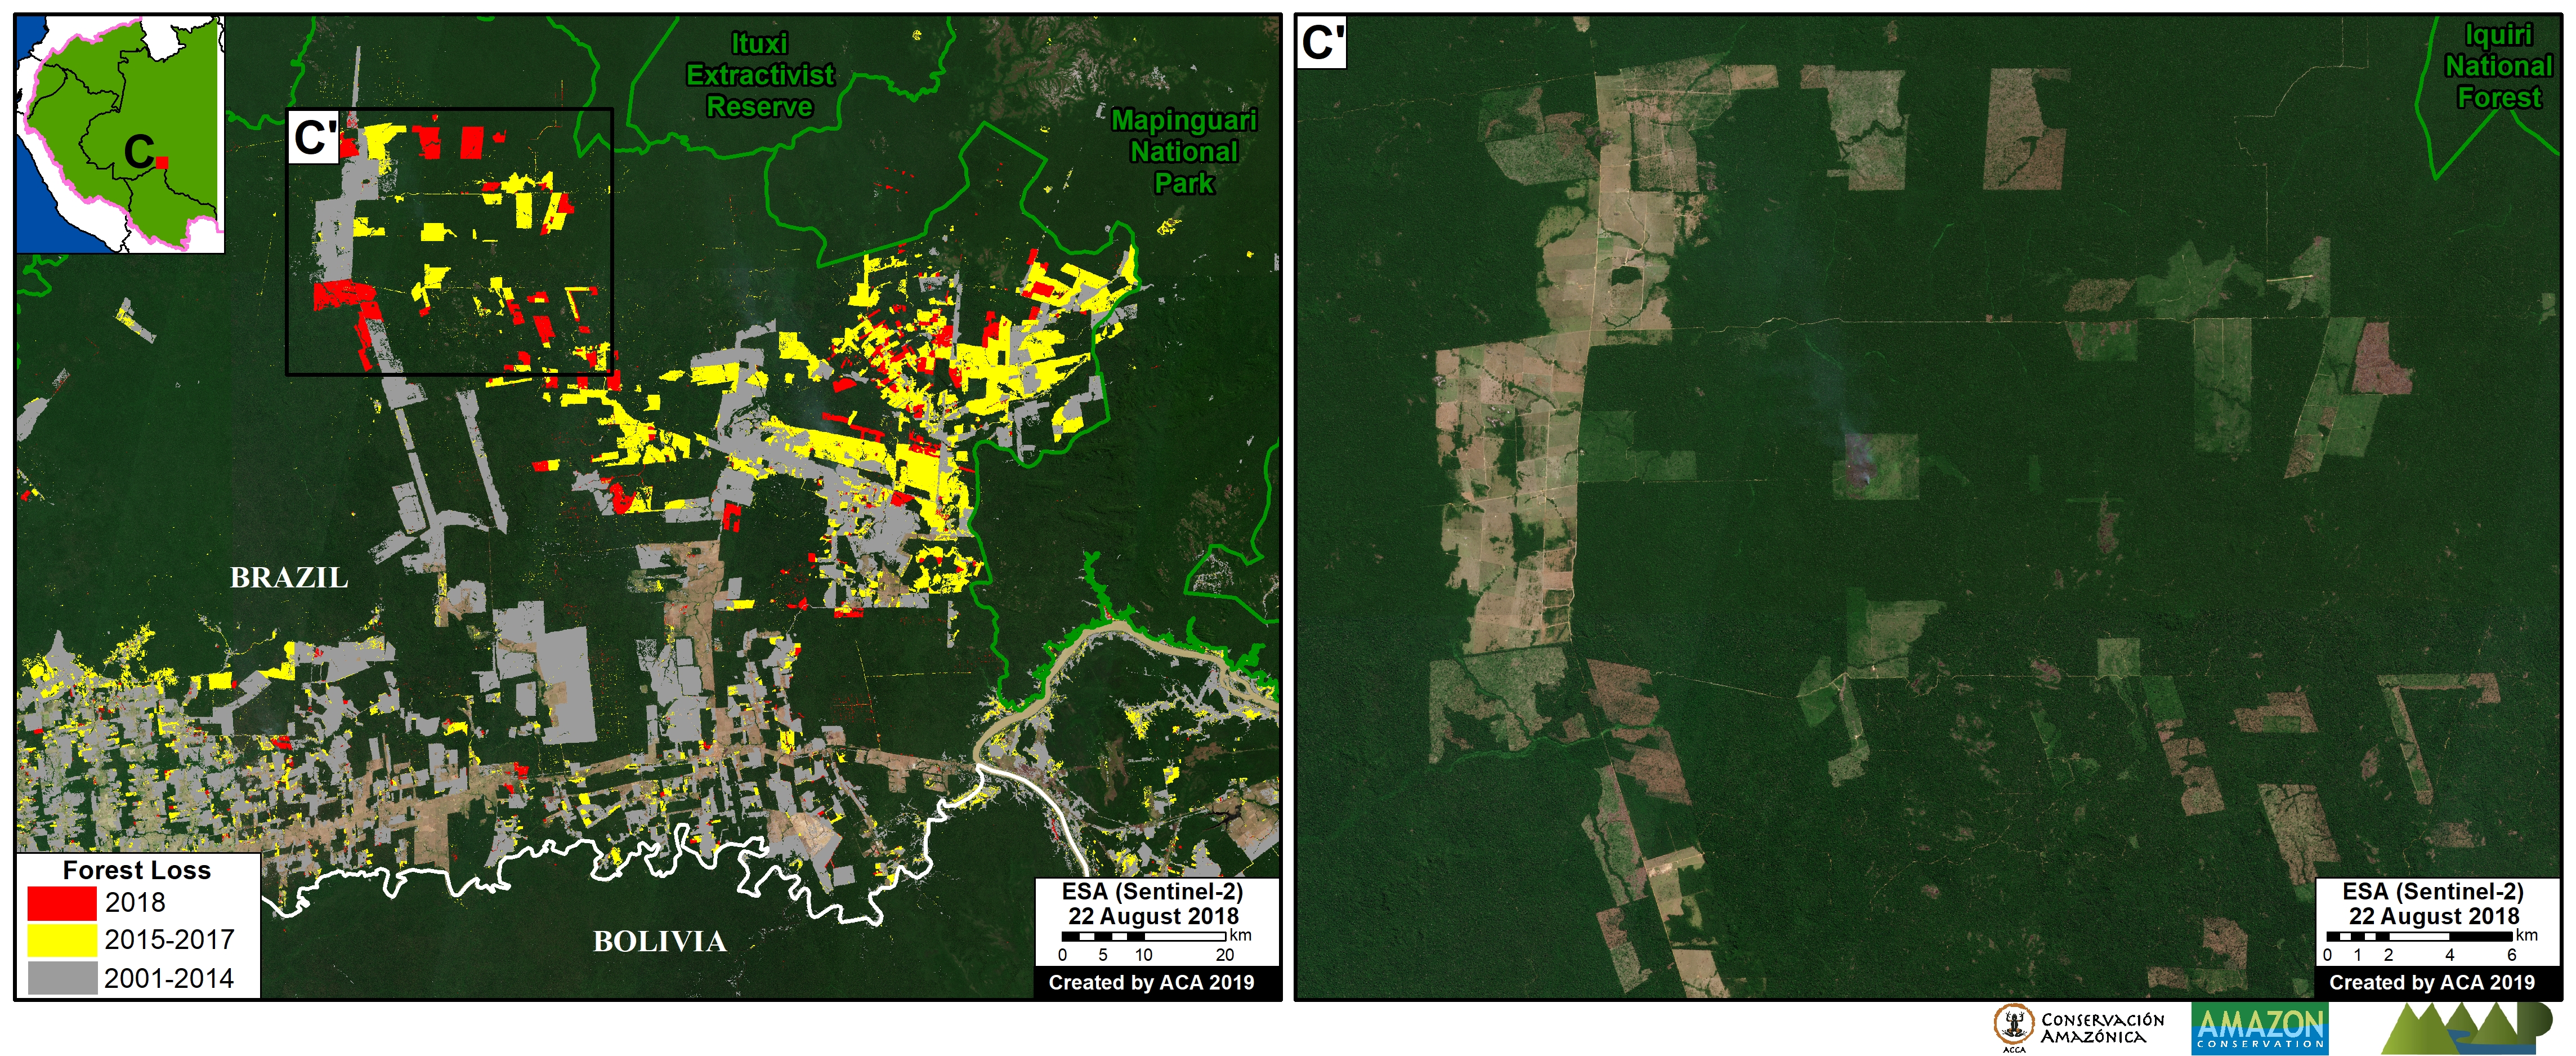
Another important result is the contrast between northern Bolivia (Pando department) and adjacent side Brazil (states of Acre, Amazonas, and Rondônia). Zoom C shows several deforestation hotspots on the Brazilian side, while the Bolivian side is much more intact.

Zoom C. Brazil, Bolivia border. Data: Hansen/UMD/Google/USGS/NASA, ESA, RAISG

Bolivia

In Bolivia, the major forest loss hotspots are further south. Zoom D shows the recent deforestation (5,000 acres in 2018) due to agricultural activity associated with one of the first major Mennonite settlements in Beni department (Kopp 2015). The other Mennonite settlements are located further south.

Zoom D. Bolivia, Black River Mennonite settlement. Data: Hansen/UMD/Google/USGS/NASA, SERNAP, Planet

Peru

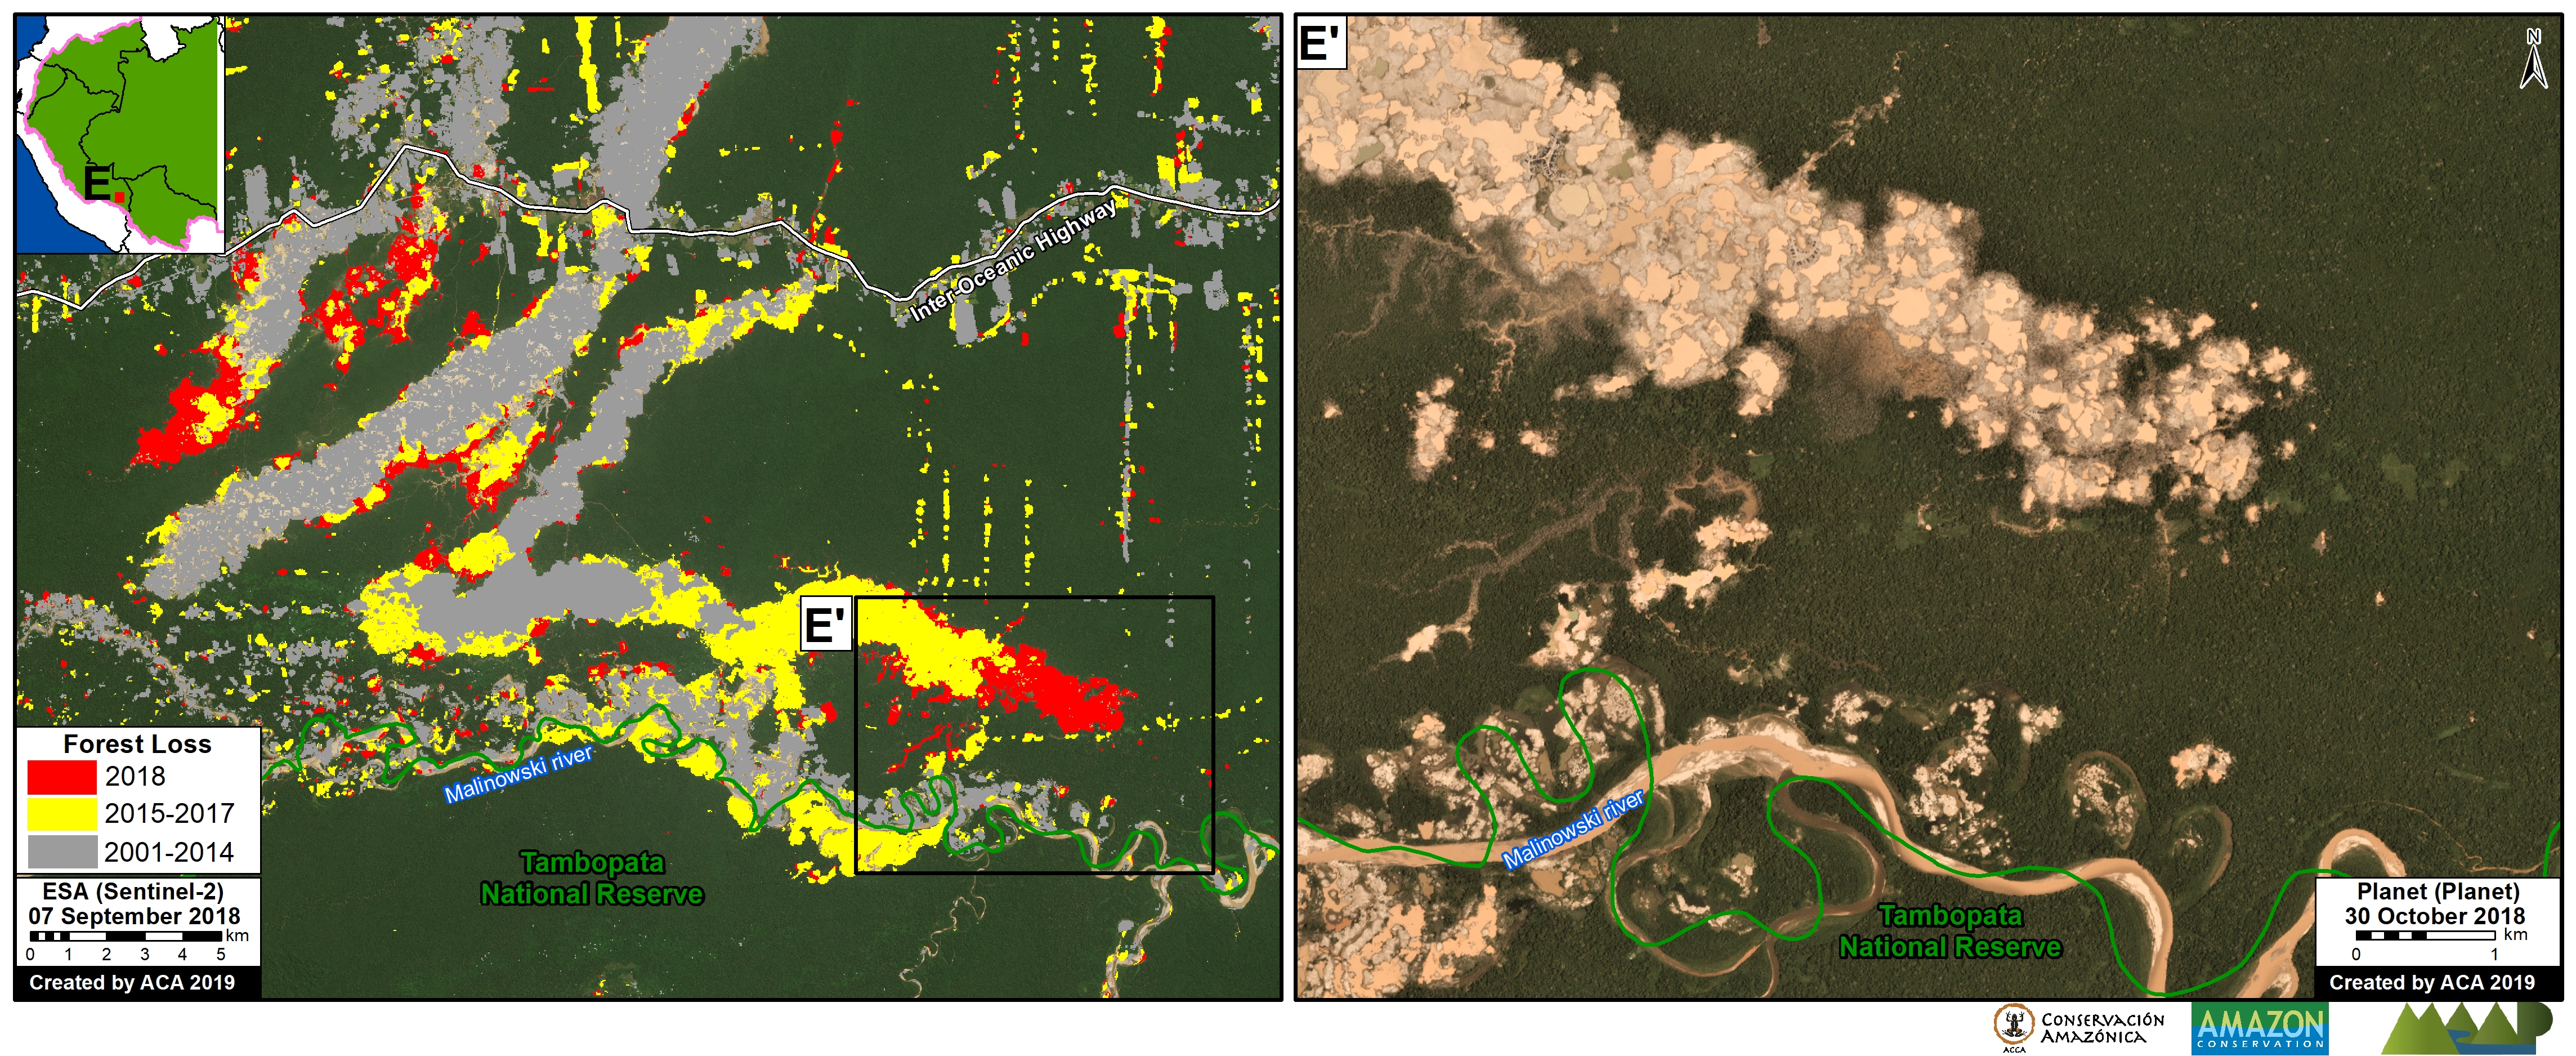
The Hansen data indicates over 200,000 acres of forest loss during 2018 in the Peruvian Amazon. One of the most important deforestation drivers, especially in southern Peru, is gold mining. We estimate 23,000 acres of gold mining deforestation during 2018 in the southern Peruvian Amazon (see MAAP #96).

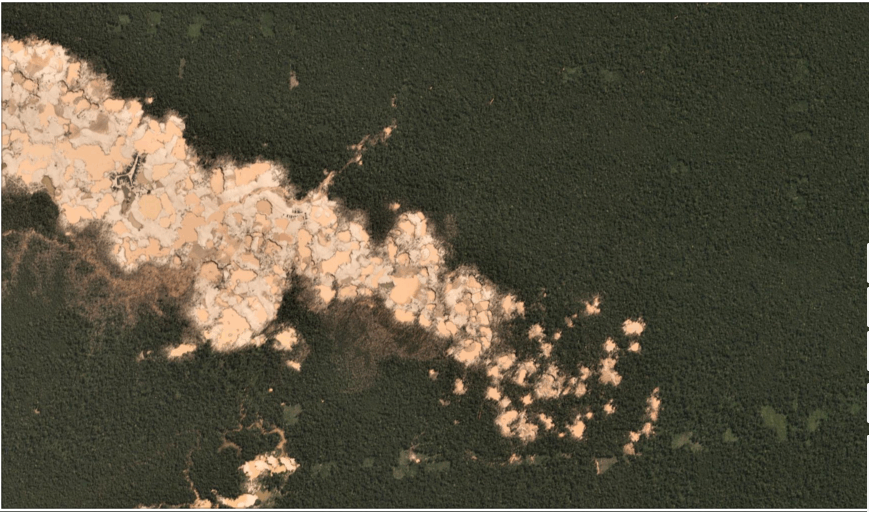
Zoom E shows the most emblematic case of gold mining deforestation: the area known as La Pampa.

It is important to emphasize, however, that in February 2019 the Peruvian government launched “Operation Mercury 2019” (Operación Mercurio 2019), a multi-sectoral and comprehensive mega-operation aimed at eradicating illegal mining and associated crime in La Pampa, as well as promote development in the region.

Zoom D. Peru – La Pampa. Data: Hansen/UMD/Google/USGS/NASA, SERNAP, Planet

Annex

Annex. Forest cover and primary forest loss in the western Amazon.  Data: Hansen/UMD/Google/USGS/NASA, Global Forest Watch.

Methods

The 2018 forest loss data presented in this report were generated by the Global Land Analysis and Discovery (GLAD) laboratory at the University of Maryland (Hansen et al 2013) and presented by Global Forest Watch. Our study area is strictly what is presented in the Base Map: the areas within the Amazonian biogeographic boundary of the western Amazon.

Specifically, for our estimate of forest cover loss, we multiplied the annual “forest cover loss” data by the density percentage of the “tree cover” from the year 2000 (values >30%).

For our estimate of primary forest loss, we intersected the forest cover loss data with the additional dataset “primary humid tropical forests” as of 2001 (Turubanova et al 2018). For more details on this part of the methodology, see the Technical Blog from Global Forest Watch (Goldman and Weisse 2019).

All data were processed under the geographical coordinate system WGS 1984. To calculate the areas in metric units the UTM (Universal Transversal Mercator) projection was used: Peru and Ecuador 18 South, Colombia 18 North, Western Brazil 19 South and Bolivia 20 South.

Lastly, to identify the deforestation hotspots, we conducted a kernel density estimate. This type of analysis calculates the magnitude per unit area of a particular phenomenon, in this case forest cover loss. We conducted this analysis using the Kernel Density tool from Spatial Analyst Tool Box of ArcGIS. We used the following parameters:

Search Radius: 15000 layer units (meters)
Kernel Density Function: Quartic kernel function
Cell Size in the map: 200 x 200 meters (4 hectares)
Everything else was left to the default setting.

For the Base Map, we used the following concentration percentages: Medium: 10%-20%; High: 21%-35%; Very High: >35%.

References

Arenas M (2018) Acaparamiento de tierras: la herencia que recibe el nuevo gobierno de Colombia. Mongabay, 2 AGOSTO 2018. https://es.mongabay.com/2018/08/acaparamiento-de-tierras-colombia-estrategias-gobierno/

Goldman L, Weisse M (2019) Technical Blog: Global Forest Watch’s 2018 Data Update Explained. https://blog.globalforestwatch.org/data-and-research/blog-tecnico-explicacion-de-la-actualizacion-de-datos-de-2018-de-global-forest-watch

Hansen, M. C., P. V. Potapov, R. Moore, M. Hancher, S. A. Turubanova, A. Tyukavina, D. Thau, S. V. Stehman, S. J. Goetz, T. R. Loveland, A. Kommareddy, A. Egorov, L. Chini, C. O. Justice, and J. R. G. Townshend. 2013. “High-Resolution Global Maps of 21st-Century Forest Cover Change.” Science 342 (15 November): 850–53. Data available on-line from: http://earthenginepartners.appspot.com/science-2013-global-forest.

Kopp Ad (2015) Las colonias menonitas en Bolivia. Tierra. http://www.ftierra.org/index.php/publicacion/libro/147-las-colonias-menonitas-en-bolivia

Planet Team (2017). Planet Application Program Interface: In Space for Life on Earth. San Francisco, CA. https://api.planet.com

Turubanova S., Potapov P., Tyukavina, A., and Hansen M. (2018) Ongoing primary forest loss in Brazil, Democratic Republic of the Congo, and Indonesia. Environmental Research Letters  https://doi.org/10.1088/1748-9326/aacd1c 

Acknowledgements

We thank M. Terán (ACEAA), M. Weisse (GFW/WRI), A. Thieme (UMD), R. Catpo (ACCA) and A. Cóndor (ACCA) for helpful comments to this report.

Citation

Finer M, Mamani N (2019) Western Amazon – Deforestation Hotspots 2018 (a regional perspective). MAAP: 100.

MAAP Synthesis #3: Deforestation in the Andean Amazon (Trends, Hotspots, Drivers)

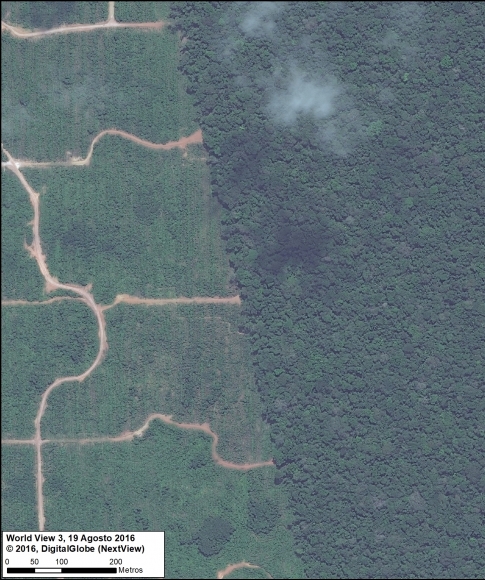
Satellite image of the deforestation produced by United Cacao. Source: DigitalGlobe (Nextview)

MAAP, an initiative of the organization Amazon Conservation, uses cutting-edge satellite technology to monitor deforestation in near real-time in the megadiverse Andean Amazon (Peru, Colombia, Ecuador, and Bolivia).

The monitoring is based on 5 satellite systems: Landsat (NASA/USGS), Sentinel (European Space Agency), PeruSAT-1, and the companies Planet and DigitalGlobe. For more information about our innovative methodology, see this recent paper in Science Magazine.

Launched in 2015, MAAP has published nearly 100 high-impact reports on the major Amazonian deforestation issues of the day.

Here, we present our third annual synthesis report with the objective to concisely describe the bigger picture: Deforestation trends, patterns, hotspots and drivers across the Andean Amazon.

Our principal findings include:

Trends: Deforestation across the Andean Amazon has reached 4.2 million hectares (10.4 million acres) since 2001. Annual deforestation has been increasing in recent years, with a peak in 2017 (426,000 hectares). Peru has had the highest annual deforestation, followed by surging Colombia (in fact, Colombia surpassed Peru in 2017). The vast majority of the deforestation events are small-scale (‹5 hectares).

Hotspots: We present the first regional-scale deforestation hotspots map for the Andean Amazon, allowing for spatial comparisons between Peru, Colombia, and Ecuador.  We discuss six of the most important hotspots.

Drivers: We present MAAP Interactive, a dynamic map with detailed information on the major deforestation drivers: gold mining, agriculture (oil palm and cacao), cattle ranching, logging, and dams. Agriculture and ranching cause the most widespread impact across the region, while gold mining is most intense southern Peru.

Climate Change. We estimated the loss of 59 million metric tons of carbon in the Peruvian Amazon during the last five years (2013-17) due to forest loss. In contrast, we also show that protected areas and indigenous lands have safeguarded 3.17 billion metric tons of carbon.

I. Deforestation Trends

Image 1 shows forest loss trends in the Andean Amazon between 2001 and 2017.*  The left graph shows data by country, while the right graph shows data by forest loss event size.
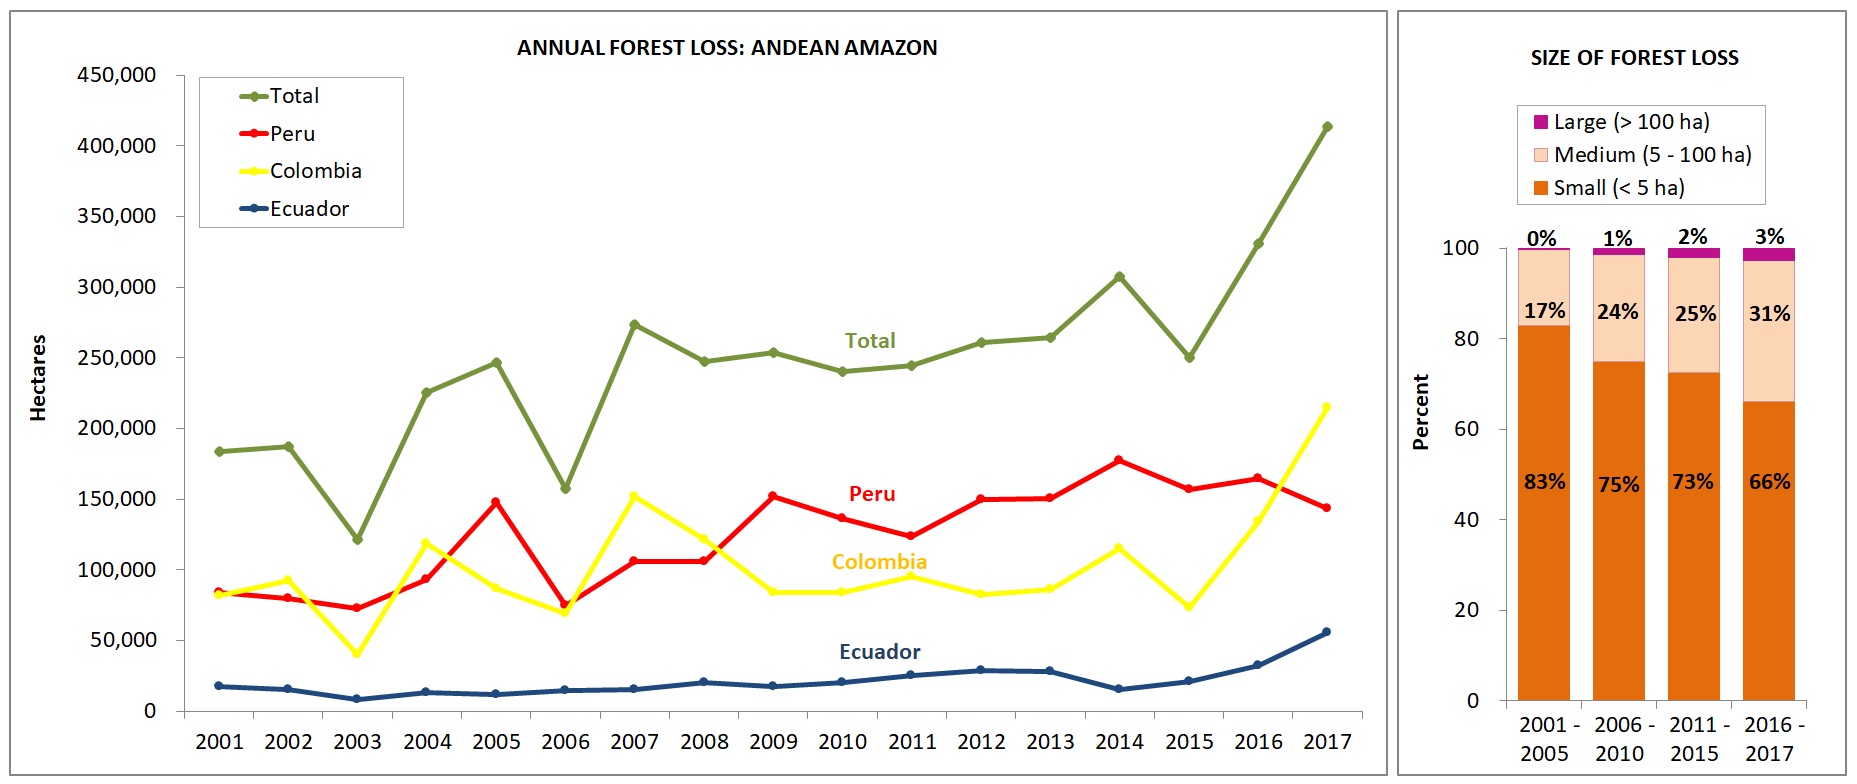
Image 1. Annual forest loss by country and size. Data: Hansen/UMD/Google/USGS/NASA, UMD/GLAD, Global Forest Watch, MINAM/PNCB, RAISG.

Trends by Country

Over the past 17 years (2001-2017), deforestation has surpassed 4.2 million hectares (10.4 million acres) in the Andean Amazon (see green line). Of this total, 50% is Peru (2.1 million hectares/5.2 million acres), 41% Colombia (1.7 million hectares/4.27 million acres), and 9% Ecuador (887,000 acres/359,000 hectares). This analysis did not include Bolivia.

Since 2007, there has been an increasing deforestation trend, peaking during the past two years (2016-17). In fact, 2017 has the highest annual forest loss on record with 426,000 hectares (over one million acres), more than double the total forest loss in 2006.

Peru had the highest average annual Amazonian deforestation between 2009 and 2016. The past four years have the highest annual deforestation totals on record in the country, with peaks in 2014 (177,566 hectares/439,000 acres) and 2016 (164,662 hectares/406,888 acres). According to new data from the Peruvian Environment Ministry, there was an important decline in 2017 (155,914 hectares/385,272 acres), but it is still the fourth highest annual total on record.

There has been a surge of deforestation in Colombia during the past two years. Note that in 2017, Colombia surpassed Peru with a record high of 214,700 hectares (530,400 acres) deforested.

Deforestation is also increasing in Ecuador, with highs of 32,000 hectares (79,000 acres) in 2016 and 55,500 hectares (137,000) acres in 2017.

For context, Brazil has had an average deforestation loss rate of 639,403 hectares (1.58 million acres) over the past several years.

* Data: Colombia & Ecuador: Hansen/UMD/Google/USGS/NASA; Peru: MINAM/PNCB, UMD/GLAD. While this information includes natural forest loss events, it serves as our best estimate of deforestation resulting from anthropogenic causes.  It is estimated that the non-anthropic loss comprises approximately 3.5% of the total loss. Note that the analysis does not include Bolivia.

Trends by Size

The pattern related to the size of deforestation events in the Andean Amazon remained relatively consistent over the last 17 years. Most noteworthy: the vast majority (74%) of the deforestation events are small-scale (‹5 hectares). Only 2% of deforestation events are large-scale (>100 hectares). The remaining 24% are medium-scale (5-100 hectares).

These results are important for conservation efforts.  Addressing this complex situation – in which most of the deforestation events are small-scale – requires significantly more attention and resources.  In addition, while large-scale deforestation (usually associated with agro-industrial practices) is not that common, it nonetheless represents a serious latent threat, due to the fact that only a small number of agro-industrial projects (for example, oil palm) are able to rapidly destroy thousands of acres of primary forest.

II. Deforestation Hotspots
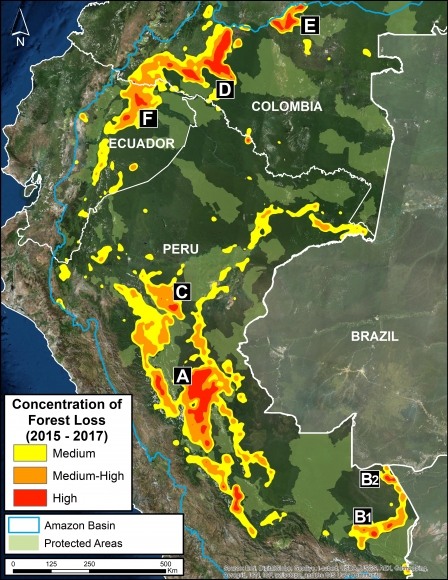
Image 2: Deforestation hotspots 2015-2017. Data: Hansen/UMD/Google/USGS/NASA.

We present the first regional-scale deforestation hotspots map across the Andean Amazon (Colombia, Ecuador, Peru).  Image 2 shows the results for the past three, 2015 – 2017.

The most critical zones (“high” deforestation density) are indicated in red. They include:

A. Central Peruvian Amazon: Over the last 10 years, this zone, located in the Ucayali and Huánuco regions, has consistently had one of the largest concentrations of deforestation in Peru (Inset A).  Its principal drivers include oil palm and cattle grazing.

B. Southern Peruvian Amazon: This zone, located in the Madre de Dios region, is impacted by gold mining (Inset B1), and increasingly by small- and medium-scale agriculture along the Interoceanic Highway (Inset B2).

C. Central Peruvian Amazon: A new oil palm plantation located in the San Martín region has been identified as a recent large-scale deforestation event in this zone (Inset C).

D. Southwestern Colombian Amazon: Cattle grazing is the principal deforestation driver documented in this zone, located in the departments of Caquetá and Putumayo (Inset D).

E. Northern Colombian Amazon: There is expanding deforestation along a new road in this zone, located in the department of Guaviare (Inset E).

F. Northern Ecuadoran Amazon: This zone is located in the Orellana province, where small- and medium-scale agriculture, including oil palm, is the principal driver of deforestation (Inset F).


III. Drivers of Deforestation     
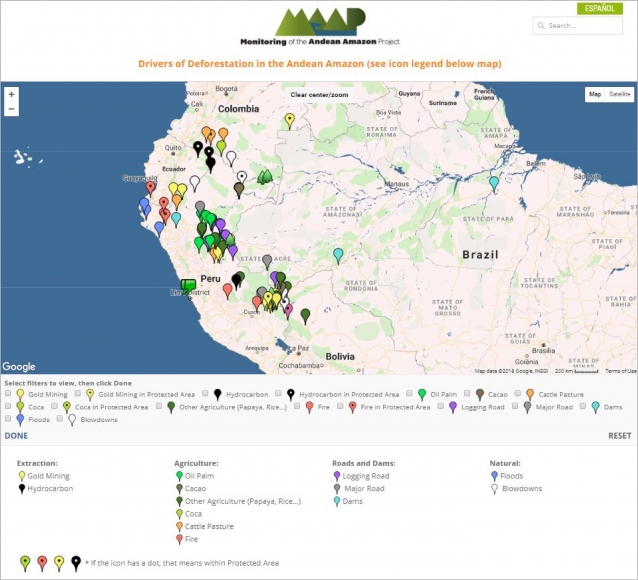
MAAP Interactive (screenshot)

One of the main objectives of MAAP is to improve the availability of precise and up-to-date information regarding the current drivers (causes) of deforestation in the Andean Amazon.  Indeed, one of our most important advances has been the use of high-resolution imagery to identify current deforestation drivers.

In order to improve the analysis and understanding of the identified drivers, we have created an Interactive Map that displays the spatial location of each driver associated with every MAAP report.  An important characteristic of this map is the ability to filter the data by driver, by selecting the boxes of interest.

Image 3 shows a screenshot of the Interactive Map.  Note that it contains detailed information on these principal drivers: gold mining, oil palm, cacao, small-scale agriculture, cattle pasture, logging roads, and dams.  It also includes natural causes such as floods, forest fires, and blowdowns.  In addition, it highlights deforestation events in protected areas.

Below, we discuss the principal drivers of deforestation and degradation in greater detail.


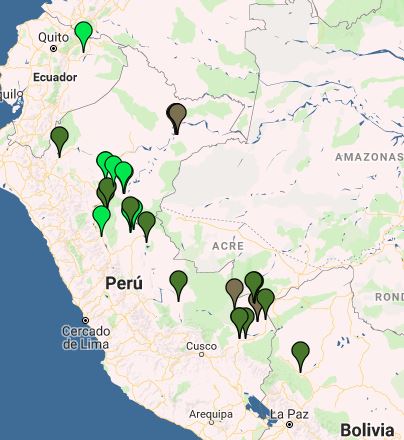
Agriculture  oil palm, cacao, and other crops

Image 4: Interactive Map, agriculture. Data: MAAP.

Image 4 shows the results of the interactive map when applying the agriculture-related filters.

Legend:
Oil palm (bright green)
Cacao (brown)
Other crops (dark green)

Agricultural activity is one of the principal causes of deforestation in the Andean Amazon.

The majority of agriculture-related deforestation is caused by small- and medium-scale plantations (‹50 hectares).

Deforestation for large-scale, agro-industrial plantations is much less common, but represents a critical latent threat.


Large-scale Agriculture

We have documented five major deforestation events produced by large-scale plantations since 2007:  four of these occurred in Peru (three of which are related to oil palm and one to cacao) and one in Bolivia (resulting from sugar cane plantations).

First, between 2007 and 2011, two large-scale oil palm plantations caused the deforestation of 7,000 hectares on the border between Loreto and San Martín (MAAP #16).  Subsequent plantations in the surrounding area caused the additional deforestation of 9,800 hectares.

It is importnat to note that the Peruvian company Grupo Palmas is now working towards a zero deforestation value chain and has a new sustainability policy (see Case C of MAAP #64).

Next, between 2012 and 2015, two other large-scale oil palm plantations deforested 12,000 hectares in Ucayali  (MAAP #4, MAAP #41).

Between 2013 and 2015, the company United Cacao deforested 2,380 hectares for cacao plantations in Loreto (MAAP #9, MAAP #13, MAAP #27, MAAP #35).

Deforestation from large-scale agriculture decreased in Peru between 2016 and 2017, but there was one notable event: an oil palm plantation of 740 hectares in San Martín (MAAP #78).

Another notable case of deforestation related to large-scale agriculture has been occurring in Bolivia, where a new sugarcane plantation has caused the deforestation of more than 2,500 hectares in the department of La Paz.

Additionally, we found three new zones in Peru characterized by the deforestation pattern produced by the construction of organized access roads which have the potential of becoming large-scale agriculture areas (MAAP #69).

Small and Medium-scale Agriculture

Deforestation caused by small- and medium-scale agriculture is much more widespread, but it is often difficult to identify the driver from satellite imagery.

We have identified some specific cases of oil palm in Huánuco, Ucayali, Loreto, and San Martín (MAAP #48, MAAP #26, MAAP #16).

Cacao and papaya are emerging drivers in Madre de Dios.  We have documented cacao deforestation along the Las Piedras River (MAAP #23, MAAP #40) and papaya along the Interoceanic Highway (MAAP #42).

Corn and rice cultivation appear to be turning the area around the town of Iberia into a deforestation hotspot (MAAP #28).  In other cases, we have documented deforestation resulting from small- and medium-scale agriculture, though it has not been possible to identify the type of crop (MAAP #75, MAAP #78).

Additionally, small-scale agriculture is possibly a determining factor in the forest fires that degrade the Amazon during the dry season (MAAP #45, MAAP #47).

The cultivation of illicit coca is a cause of deforestation in some areas of Peru and Colombia.  For example, in southern Peru, the cultivation of coca is generating deforestation within the Bahuaja Sonene National Park and its surrounding areas.

Cattle Ranching
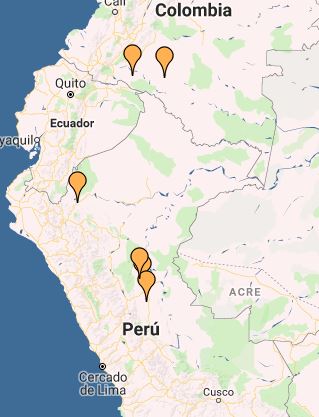
Image 5: Interactive Map, cattle ranching. Data: MAAP.

By analyzing high-resolution satellite imagery, we have developed a methodology for identifying areas deforestated by cattle ranching.*

Image 5 shows the results of the Interactive Map when applying the “Cattle pasture” filter, indicating the documented examples in Peru and Colombia.

Legend:
Cattle ranching (orange)

Cattle ranching is the principal driver of deforestation in the central Peruvian Amazon (MAAP #26, MAAP #37, MAAP #45, MAAP #78). We also identified recent deforestation from cattle ranching in northeastern Peru (MAAP #78).

In the Colombian Amazon, cattle ranching is one the primary direct drivers in the country’s most intense deforestation hotspots (MAAP #63, MAAP #77).

* Immediately following a major deforestation event, the landscape of felled trees is similar for both agriculture and cattle pasture.  However, by studying an archive of images and going back in time to analyze older deforestation cases, it is possible to distinguish between the drivers.  For example, after one or two years, agriculture and cattle pasture appear very different in the images. Ther former tends to have organized rows of new plantings, while the latter is mostly grassland.


Gold Mining
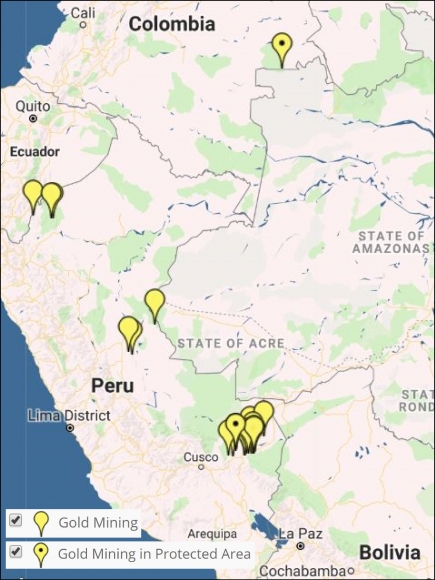
Image 6: Interactive Map, gold mining. Data: MAAP.

Image 6 shows the results of the Interactive Map when applying the “Gold mining” filter.

Legend:
Gold Mining (yellow)
*With dot indicates within protected area

The area that has been most impacted by gold mining is clearly the southern Peruvian Amazon, where we estimate the total deforestation of more than 63,800 hectares. Of this, at least 7,000 hectares have been lost since 2013.  The two most critical zones are La Pampa and Alto Malinowski in Madre de Dios (MAAP #87, MAAP #75, MAAP #79).  Another critical area exists in Cusco in the buffer zone of the Amarakaeri Communal Reserve, where mining deforestation is now less than one kilometer from the boundary of the protected area (MAAP #71).

It is important to highlight two important cases in which the Peruvian government has taken effective actions to halt illegal mining within protected areas (MAAP #64).  In September 2015, illegal miners invaded Tambopata National Reserve and deforested 550 hectares over the course of a two-year period.  At the end of 2016, the government intensified its interventions and the invasion was halted in 2017. In regards to Amarakaeri Communal Reserve, in June 2015 we revealed the mining invasion deforestation of 11 hectares.  Over the course of the following weeks, SERNANP and ECA Amarakaeri implemented measures and rapidly halted the illegal activity.

Other small gold-mining fronts are emerging in the northern and central Peruvian Amazon (MAAP #45, MAAP #49).

In addition, we have also documented deforestation linked to illegal gold-mining activities in the Puinawai National Park in the Colombian Amazon.

Logging
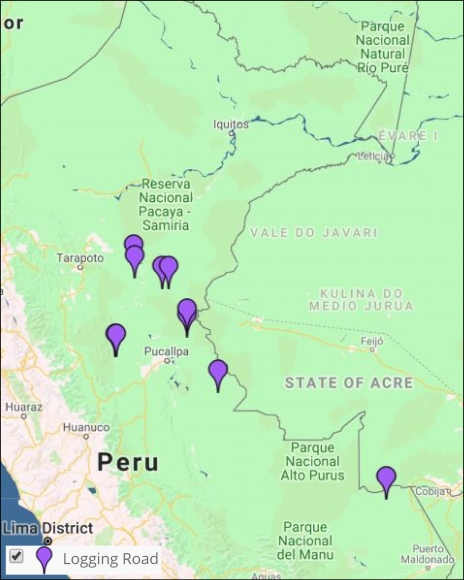
Image 7: Interactive Map, logging roads. Data: MAAP.

In MAAP #85 we proposed a new tool to address illegal logging in the Peruvian Amazon: utilize satellite imagery to monitor construction of logging roads in near real-time.

Image 7 shows the results of the Interactive Map when applying the “Logging roads” filter.

Legend:
Logging Road (purple)

We estimate that 2,200 kilometers of forest roads have been constructed in the Peruvian Amazon during the last three years (2015-2017).  The roads are concentrated in southern Loreto, Ucayali, and northwestern Madre de Dios.


Roads
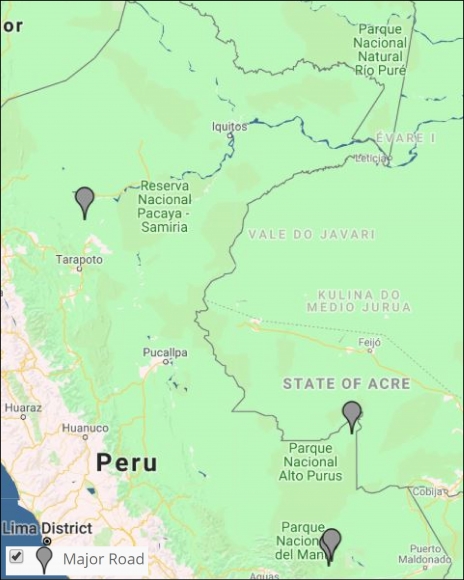
Image 8: Interactive map, roads. Data: MAAP.

It has been well-documented that roads are one of the most important drivers of deforestation in the Amazon, particularly due to the fact that they facilitate human access and activities related to agriculture, cattle ranching, mining, and logging.

Image 8 shows the results of the Interactive Map when applying the “Roads” filter.

Legend:
Road (gray)

We have analyzed two controversial proposed roads in Madre de Dios, Peru.

The Nuevo Edén – Boca Manu – Boca Colorado road would traverse the buffer zone of two protected areas: Amarakaeri Communal Reserve and Manu National Park (MAAP #29).

The other, the Puerto Esperanza-Iñapari road, would traverse the Purús National Park and threaten the territory of the indigenous peoples in voluntary isolation who live in this remote area (MAAP #76).


Hydroelectric dams

Image 9 shows the results of the Interactive Map when applying the “Dams” filter.

Legend:
Hydroelectric Dam (light blue)
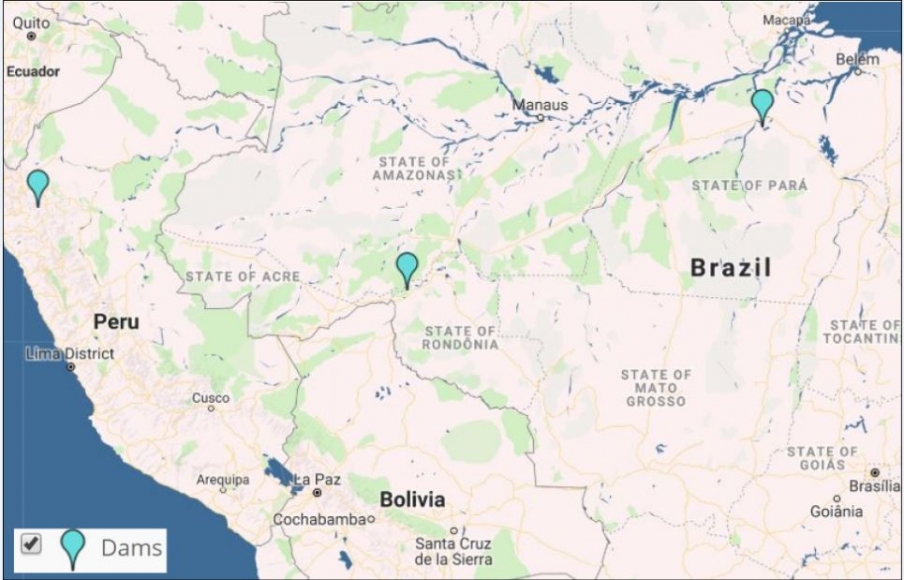
To date, we have analyzed three hydroelectric dams located in Brazil.  We have documented the loss of 36,100 hectares of forest associated with flooding produced by two dams (San Antonio and Jirau) on the Madeira River near the border with Bolivia (MAAP #34).  We also analyzed the controversial Belo Monte hydroelectrical complex located on the Xingú River, adn estimate that 19,880 hectares of land have been flooded. According to the imagery, this land is a combination of forested areas and agricultural areas (MAAP #66).

Additionally, we show a very high-resolution image of the exact location of the proposed Chadín-2 hydroelectric dam on the Marañón River in Peru (MAAP #80).

Hydrocarbon (oil and gas)
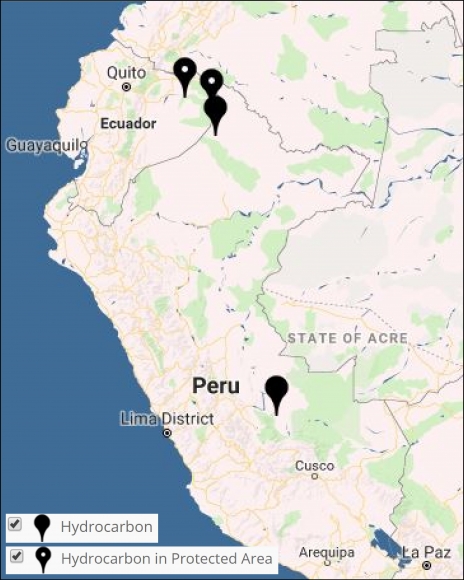
Image 10: Interactive map, hidrocarbon. Data: MAAP.

Image 10 shows the results of the Interactive Map when applying the “Hydrocarbon filter.

Legend:
Hydrocarbon (black)

Our first report on this sector focused on Yasuní National Park in the Ecuadorian Amazon.  We documented the direct and indirect deforestation amounts of 417 hectares (MAAP #82).

We also show the location of recent deforestation in two hydrocarbon block in Peru: Block 67 in the north and Blocks 57 in the south.


Climate Change

Tropical forests, especially the Amazon, sequester huge amounts of carbon, one of the main greenhouse gases driving climate change.

In MAAP #81, we estimated the loss of 59 million metric tons of carbon in the Peruian Amazon during the last five years (2013-17) due to forest loss, especially deforestation from mining and agricultural activities. This finding reveals that forest loss represents nearly half (47%) of Peru’s annual carbon emissions, including from burning fossil fuels.

In contrast, in MAAP #83 we show that protected areas and indigenous lands have safeguarded 3.17 billion metric tons of carbon, as of 2017. That is the equivalent to 2.5 years of carbon emissions from the United States.

The breakdown of results are:
1.85 billion tons safeguarded in the Peruvian national protected areas system;
1.15 billion tons safeguarded in titled native community lands; and
309.7 million tons safeguarded in Territorial Reserves for indigenous peoples in voluntary isolation.

Citation

Finer M, Mamani N (2018) Deforestation in the Andean Amazon (Trends, Hotspots, Drivers). MAAP Synthesis #3.
Science Magazine_Combating Deforestation: From Satellite to Intervention

**************************************************************************************************

Science Magazine: Combating deforestation: From satellite to intervention
Full text
Reprint (PDF)
:

*Note: The article can only be viewed for free via this author page.
************************************************************************************************

A new policy article entitled “Combating deforestation: From satellite to intervention” was just published in Science, one of the leading journals in the world.

The authors include members of Amazon Conservation, World Resources Institute (Global Forest Watch), and Planet.

We first describe how rapidly improving satellite technology has created an unprecedented moment for near real-time monitoring.

We then outline a five-step protocol for near real-time tropical deforestation monitoring, with the goal of bridging the gap between technology and policy.

Satellite image of expanding gold mining deforestation in Peru. Image: Planet.

MAAP #81: Carbon loss from deforestation in the Peruvian Amazon

Base Map. Data: MINAM/PNCB, Asner et al 2014

When tropical forests are cleared, the enormous amount of carbon stored in the trees is released to the atmosphere, making it a major source of global greenhouse gas emissions (CO2) that drive climate change.

In fact, a recent study revealed that deforestation and degradation are turning tropical forests into a new net carbon source for the atmosphere, exacerbating climate change.1

The Amazon is the world’s largest tropical forest, and Peru is a key piece of that. Researchers (led by Greg Asner at the Carnegie Institution for Science) recently published the first high-resolution estimate of aboveground carbon in the Peruvian Amazon, documenting 6.83 billion metric tons.2

Here, we analyze this same dataset to estimate the total carbon emissions from deforestation in the Peruvian Amazon between 2013 and 2017. We estimate the loss of 59 million metric tons of carbon during these last five years, the equivalent of around 4% of annual United States fossil fuel emissions.3

We present a series of zoom images to show how carbon loss happened in several key areas impacted by the major deforestation drivers: gold mining, large-scale oil palm and cacao plantations, and smaller-scale agriculture. The labels A-G correspond to the zooms below.

We also show how protected areas are protecting hundreds of millions of metric tons of carbon in some of the most important areas in the country.

On the positive side, having this detailed information may provide added incentives to slow deforestation and degradation as part of critical climate change strategies.


Major Findings

Data: Asner et al 2014

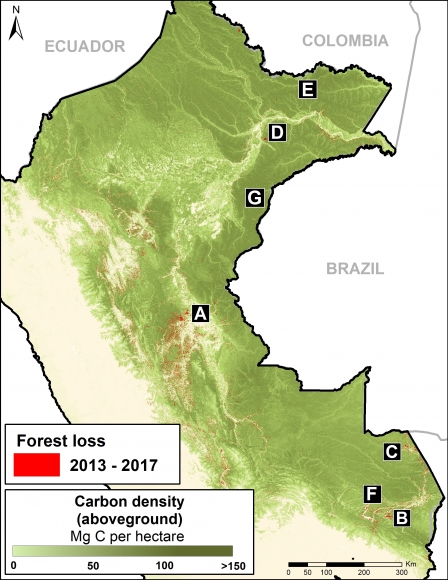
The base map (see above) shows, in shades of green, carbon densities across Peru. It also shows, in red, the forest loss layer from 2013 to 2017.

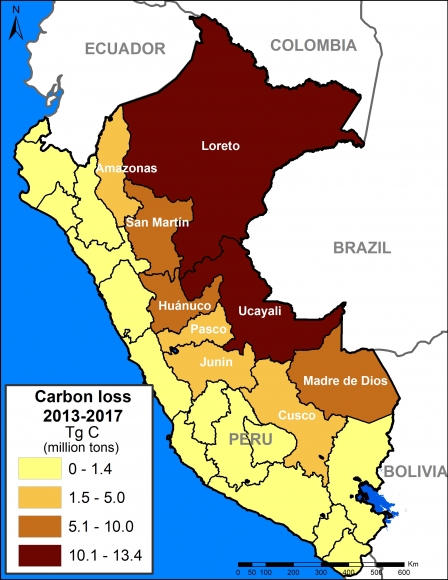
We calculated the estimated amount of carbon emissions from forest loss during these five years: 59.029 teragrams, or 59 million metric tons.

The regions with the most carbon loss are 1) Loreto (13.4 million metric tons), 2) Ucayali (13.2 million), 3) Huánuco (7.3 million), 4) Madre de Dios (7 million), and 5) San Martin (6.9 million).

These values include some natural forest loss. Overall, however, they should be considered underestimates because they do not include forest degradation (for example, selective logging).

A recent study revealed that degradation may account for 70% of emissions, thus total carbon emissions from forests in the Peruvian Amazon may be closer to 200 million metric tons.

Next, we show a series of zoom images to show how carbon loss happened in several key areas. We also show how protected areas and conservation concessions are protecting the most important carbon reserves.


Zoom A: Central Peruvian Amazon

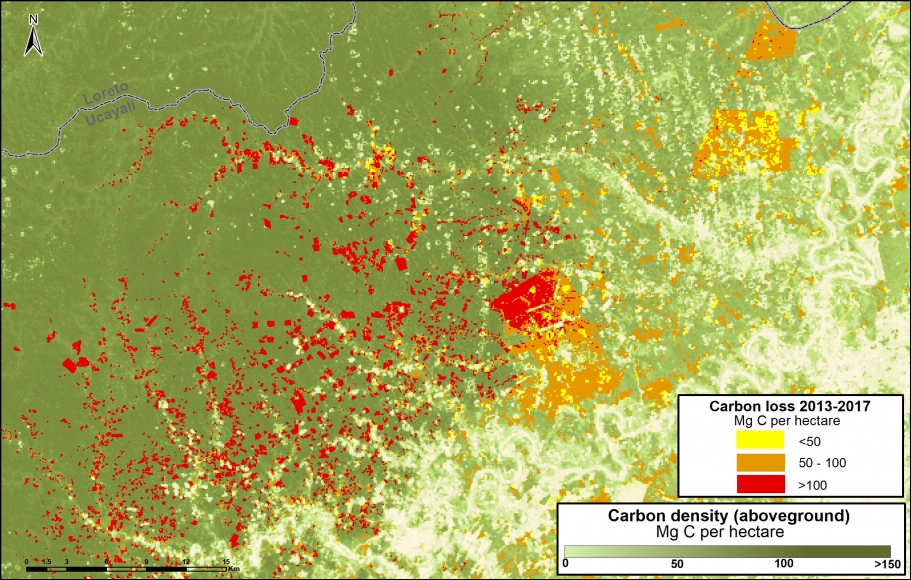
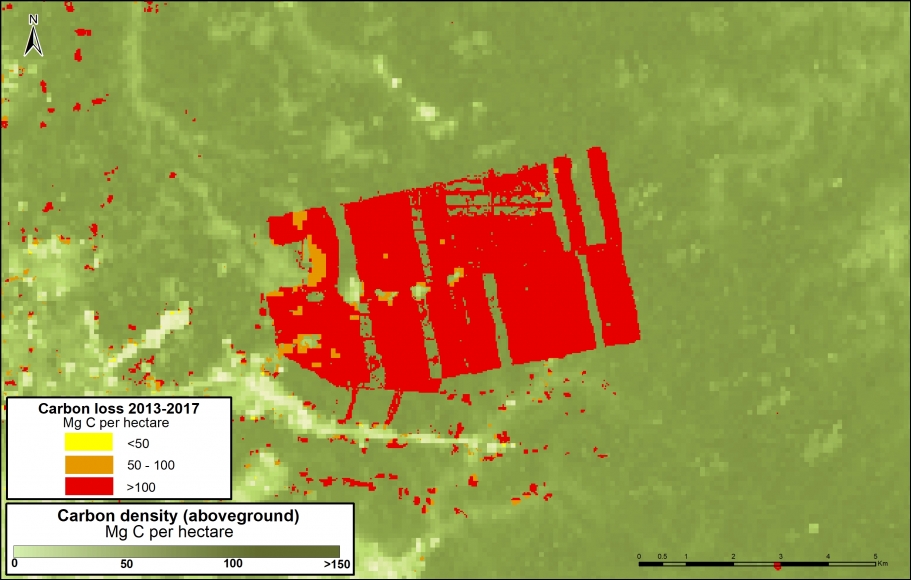
Image A shows the loss of 2.8 million metric tons of carbon in a section of the central Peruvian Amazon (Ucayali region). On the east side of image, note the loss due to two large-scale oil palm plantations (649,000 metric tons); on the west side, note small-scale agriculture penetrating deeper into high carbon density forest.

Image A. Central Peruvian Amazon. Data: Asner et al 2014, MINAM/PNCB

Zoom B: Southern Peruvian Amazon (gold mining) 

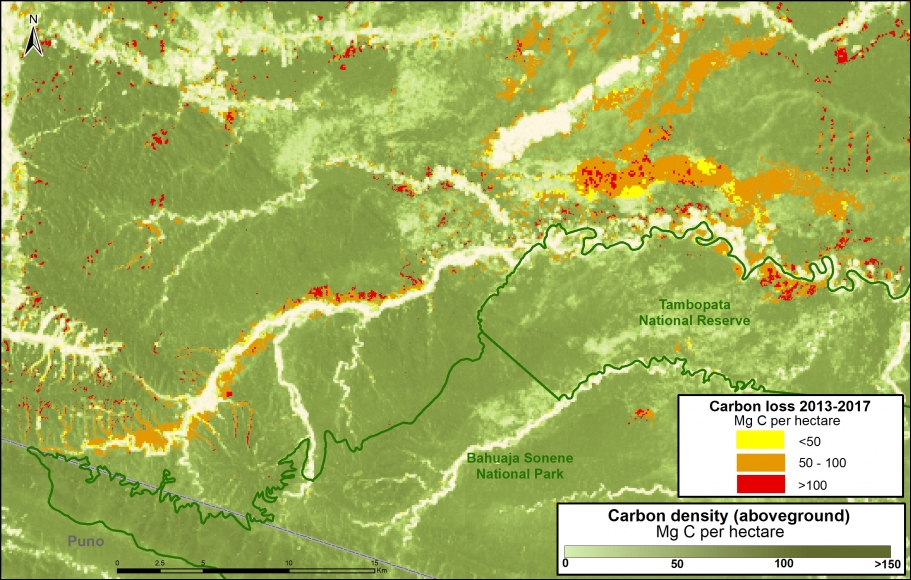
Image B shows the loss of 756 thousand metric tons of carbon due to gold mining in the southern Peruvian Amazon (Madre de Dios region). On the east side of image is the sector known as La Pampa; west side is Upper Malinowski.

Image B. Gold mining. Data: Asner et al 2014, MINAM/PNCB

Zoom C: Southern Peruvian Amazon (agriculture)

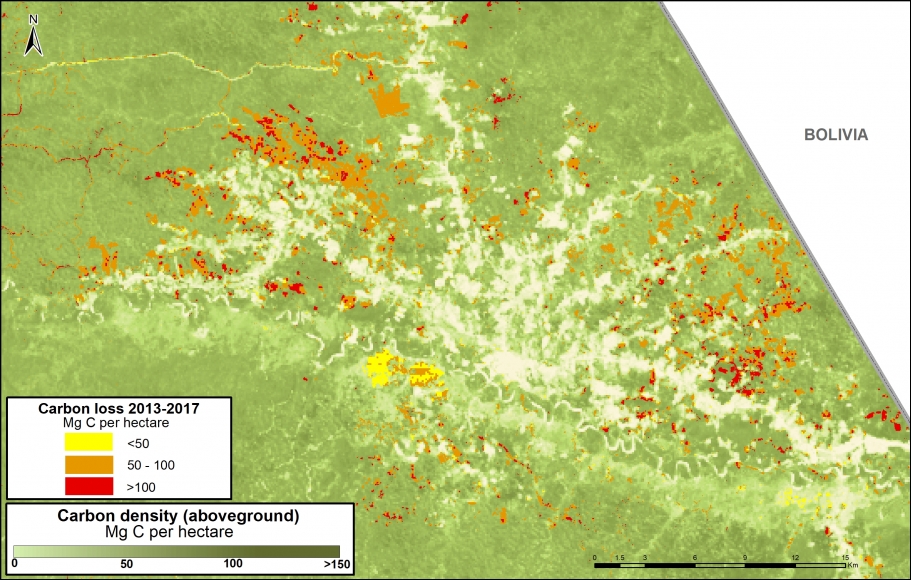
Image C shows the loss of 876 thousand metric tons of carbon in the southern Peruvian Amazon around the town of Iberia (Madre de Dios region). Note the expanding carbon loss along both sides of the Interoceanic Highway that crosses the image.

Image C. Iberia. Data: Asner et al 2014, MINAM/PNCB

Zoom D: United Cacao

Image D shows the loss of 291 thousand metric tons of carbon for a large-scale cacao project (United Cacao) in the northern Peruvian Amazon (Loreto region). Note that nearly all the forest clearing occurred in high carbon density forest. This is another line of evidence that the company cleared primary forest, contrary to their claims that the area was already degraded.

Image D. United Cacao. Data: Asner et al 2014, MINAM/PNCB

Zoom E: Yaguas National Park

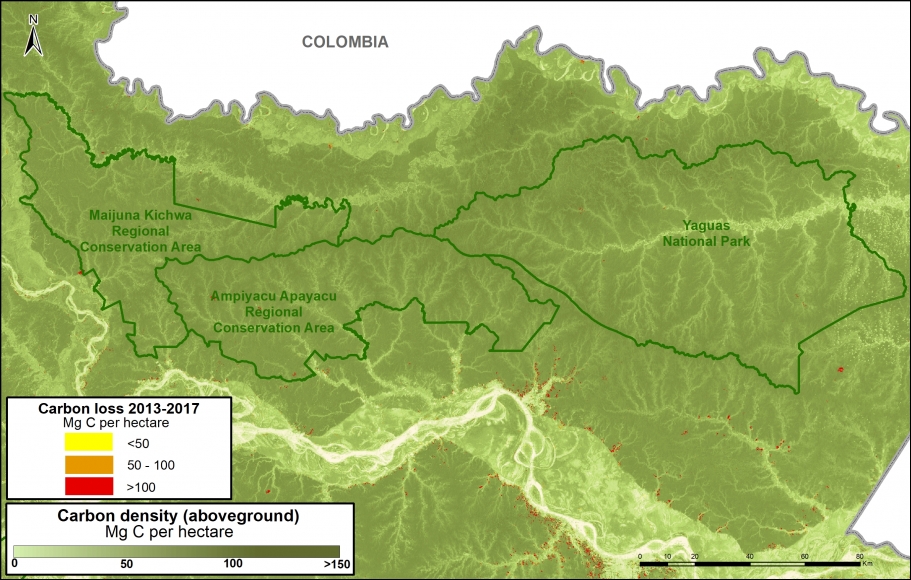
Image E shows how three protected areas, including the new Yaguas National Park, are effectively safeguarding 202 million metric tons of carbon in the northeastern Peruvian Amazon. This area is home to some of the highest carbon densities in the country.

Image E. Yaguas. Data: Asner et al 2014, MINAM/PNCB

Zoom F: Los Amigos Conservation Concession

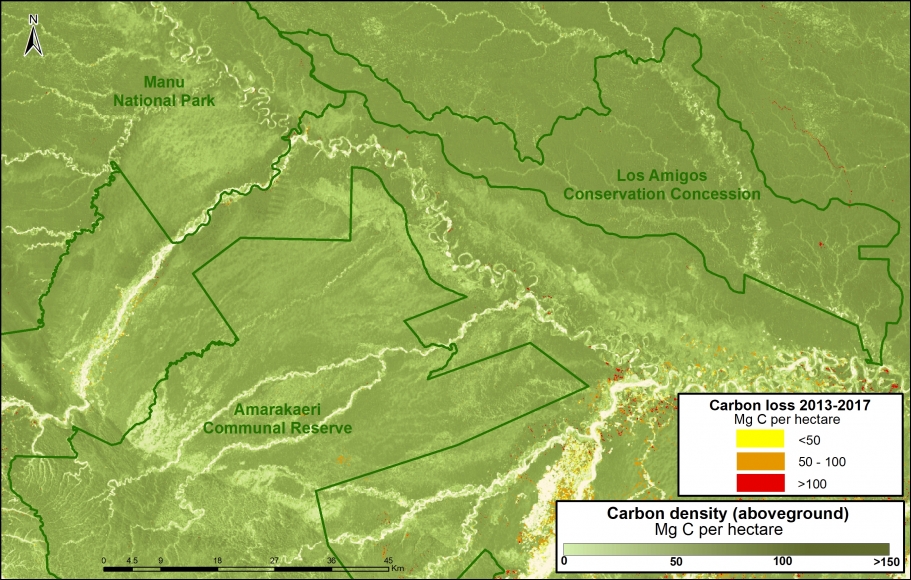
Image F shows how Los Amigos, the world’s first conservation concession, is effectively safeguarding 15 million metric tons of carbon in the southern Peruvian Amazon. Two surrounding protected areas, Manu National Park and Amarakaeri Communal Reserve, safeguard an additional 194 million metric tons. This area is home to some of the highest carbon densities in the country.

Image F. Los Amigos. Data: Asner et al 2014, MINAM/PNCB

Zoom G: Sierra del Divisor National Park

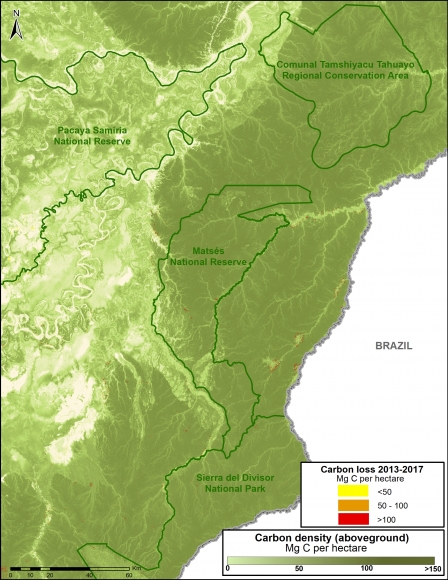
Image G. Data: Asner et al 2014, MINAM/PNCB

Image G shows how three protected areas, including the new Sierra del Divisor National Park, are effectively safeguarding 270 million metric tons of carbon in the eastern Peruvian Amazon.

This area is home to some of the highest carbon densities in the country.


Methodology

Para el análisis se utilizó los datos de carbono sobre el suelo  generados por Asner et al 2014, y los datos de pérdida de bosques identificados por el Programa Nacional de Conservación de Bosques (PNBC-MINAM) de los años 2013 al 2016 así como las alertas tempranas del año 2017. Primero uniformizamos los datos de pérdida de bosque 2013-2016 con las alertas tempranas del año 2017 para evitar superposición y tener un solo dato 2013-2017. Posteriormente, extraemos los datos de carbono de las áreas de pérdida de bosque del 2013-2017, este proceso permitió obtener la densidad de carbono (por hectárea) en relación al área de la pérdida de bosque para finalmente estimar el total de stocks de carbono perdido entre el año 2013 al 2017.

References

Baccini A, Walker W, Carvalho L, Farina M, Sulla-Menashe D, Houghton RA (2017) Tropical forests are a net carbon source based on aboveground measurements of gain and loss. Science. 13;358(6360):230-4.

Asner GP et al (2014). The High-Resolution Carbon Geography of Perú. Carnegie Institution for Science.

Boden TA, Andres RJ, Marland G (2017) National CO2 Emissions from Fossil-Fuel Burning, Cement Manufacture, and Gas Flaring: 1751-2014. DOI 10.3334/CDIAC/00001_V2017

Citation

Finer M, Mamani N (2017). Carbon loss from deforestation in the Peruvian Amazon. MAAP: 81.

Acknowledgments

This report was made possible by the generous support of the Norwegian Agency for Development Cooperation (NORAD).


MAAP Interactive: Deforestation Drivers in the Andean Amazon

Since its launch in April 2015, MAAP has published over 70 reports related to deforestation (and natural forest loss) in the Andean Amazon. We have thus far focused on Peru, with several reports in Colombia and Brazil as well.

These reports are meant to be case studies of the most important and urgent deforestation events. We often use forest loss alerts (known as GLAD) to guide us, and satellite imagery (from Planet and DigitalGlobe) to identify the deforestation driver.

Here we present an interactive map highlighting the drivers identified in all published MAAP reports. These drivers include gold mining, agriculture (e.g. oil palm and cacao), cattle pasture, roads, and dams (see icon legend below map). We also include natural causes such as floods and blowdowns (fire included under agriculture since most human caused). Furthermore, we highlight deforestation events within protected areas. Note that you can filter by driver by checking boxes of interest.

We hope the result is one of the most detailed and up-todate resources on patterns and drivers of deforestation in the Andean Amazon. Over the coming year we will continue to focus on Peru and Colombia, and begin to include Ecuador and Bolivia as well.

To view the interactive map, please visit:

MAAP Interactive: Deforestation Drivers in the Andean Amazon
https://www.maapprogram.org/interactive/

For more information on patterns and drivers of deforestation in the Peruvian Amazon, see our latest Synthesis report