In the previous MAAP #40, we emphasized the power of combining early warning forest loss GLAD alerts with analysis of high-resolution satellite imagery as part of a comprehensive near real-time deforestation monitoring system for the Peruvian Amazon.
In the current MAAP, we present 3 new examples of this system across different regions of Peru. Click on the images below to enlarge.
Example 1: Illegal Gold Mining in buffer zone of Bahuaja Sonene National Park (Madre de Dios)
Example 2: Logging Road in buffer zone of Cordillera Azul National Park (Ucayali/Loreto)
Example 3: Deforestation in Permanent Production Forest (Ucayali)
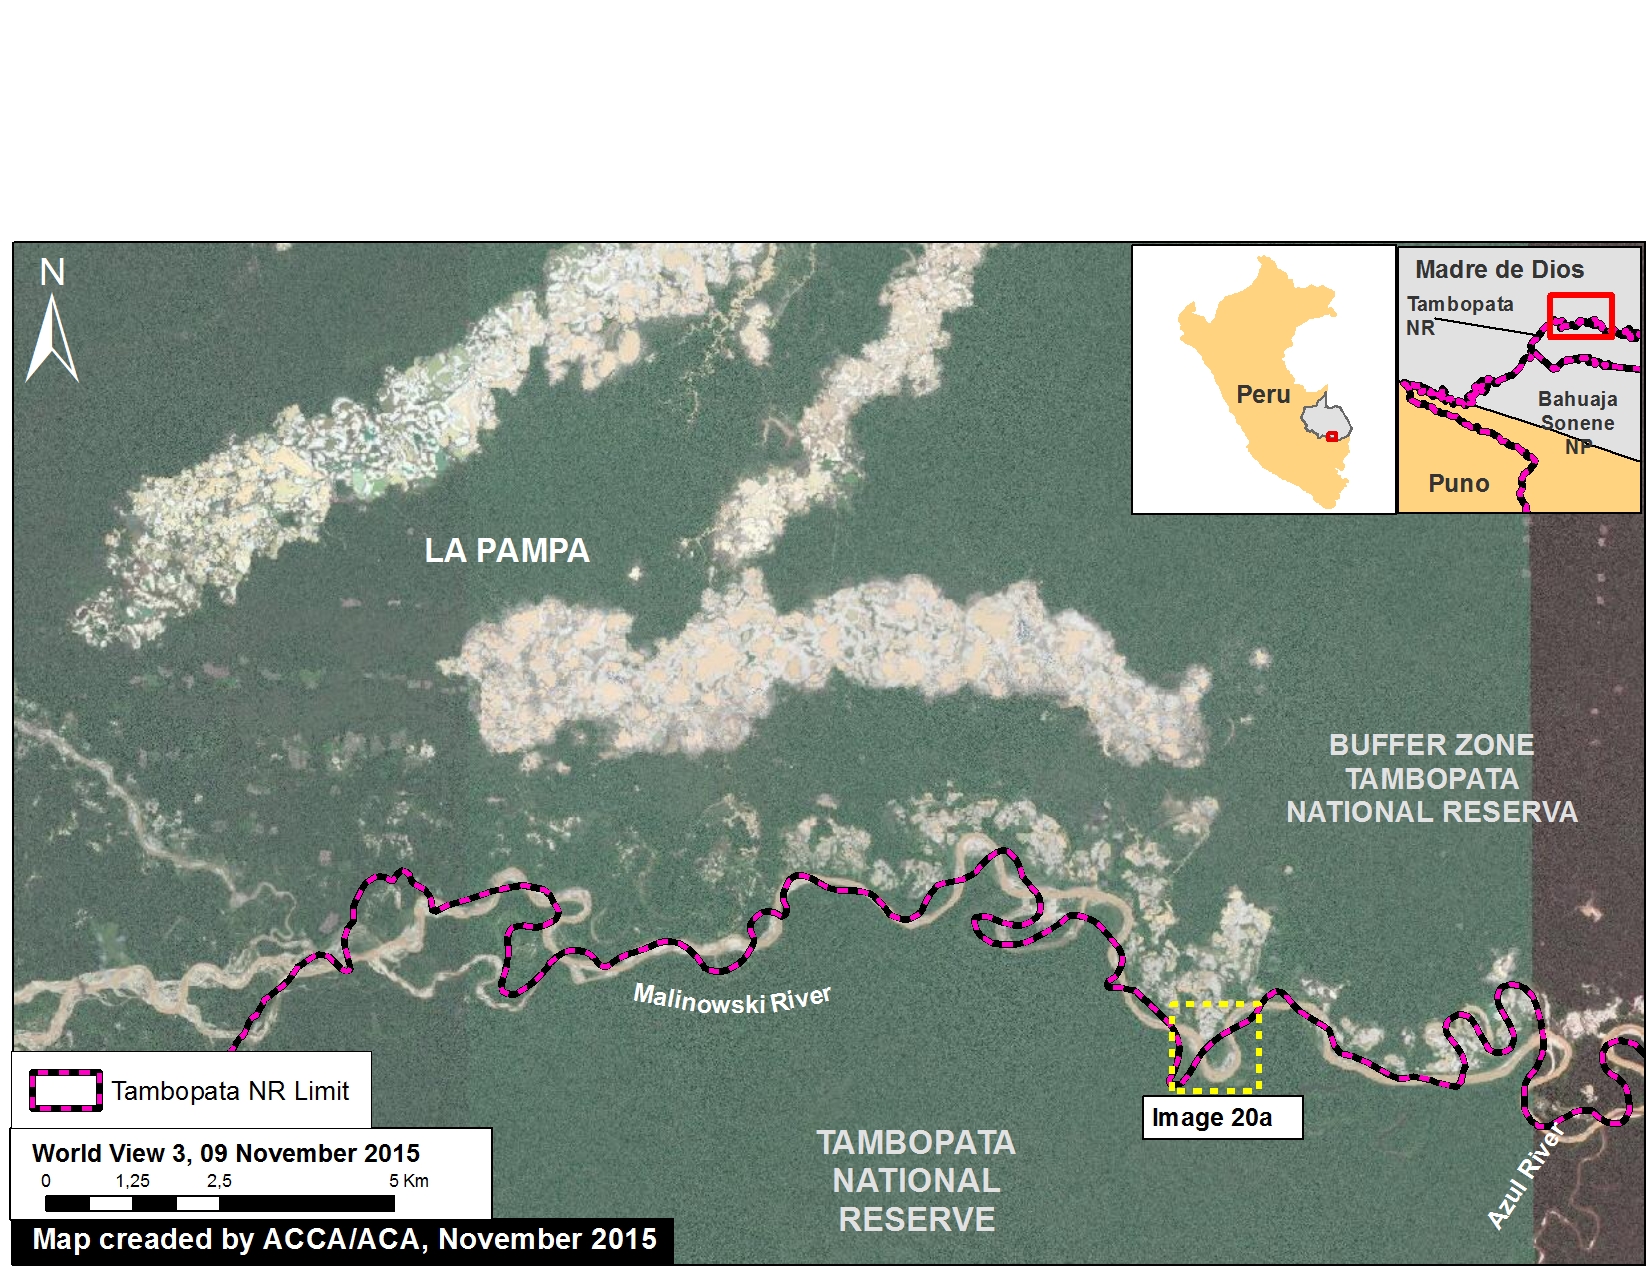
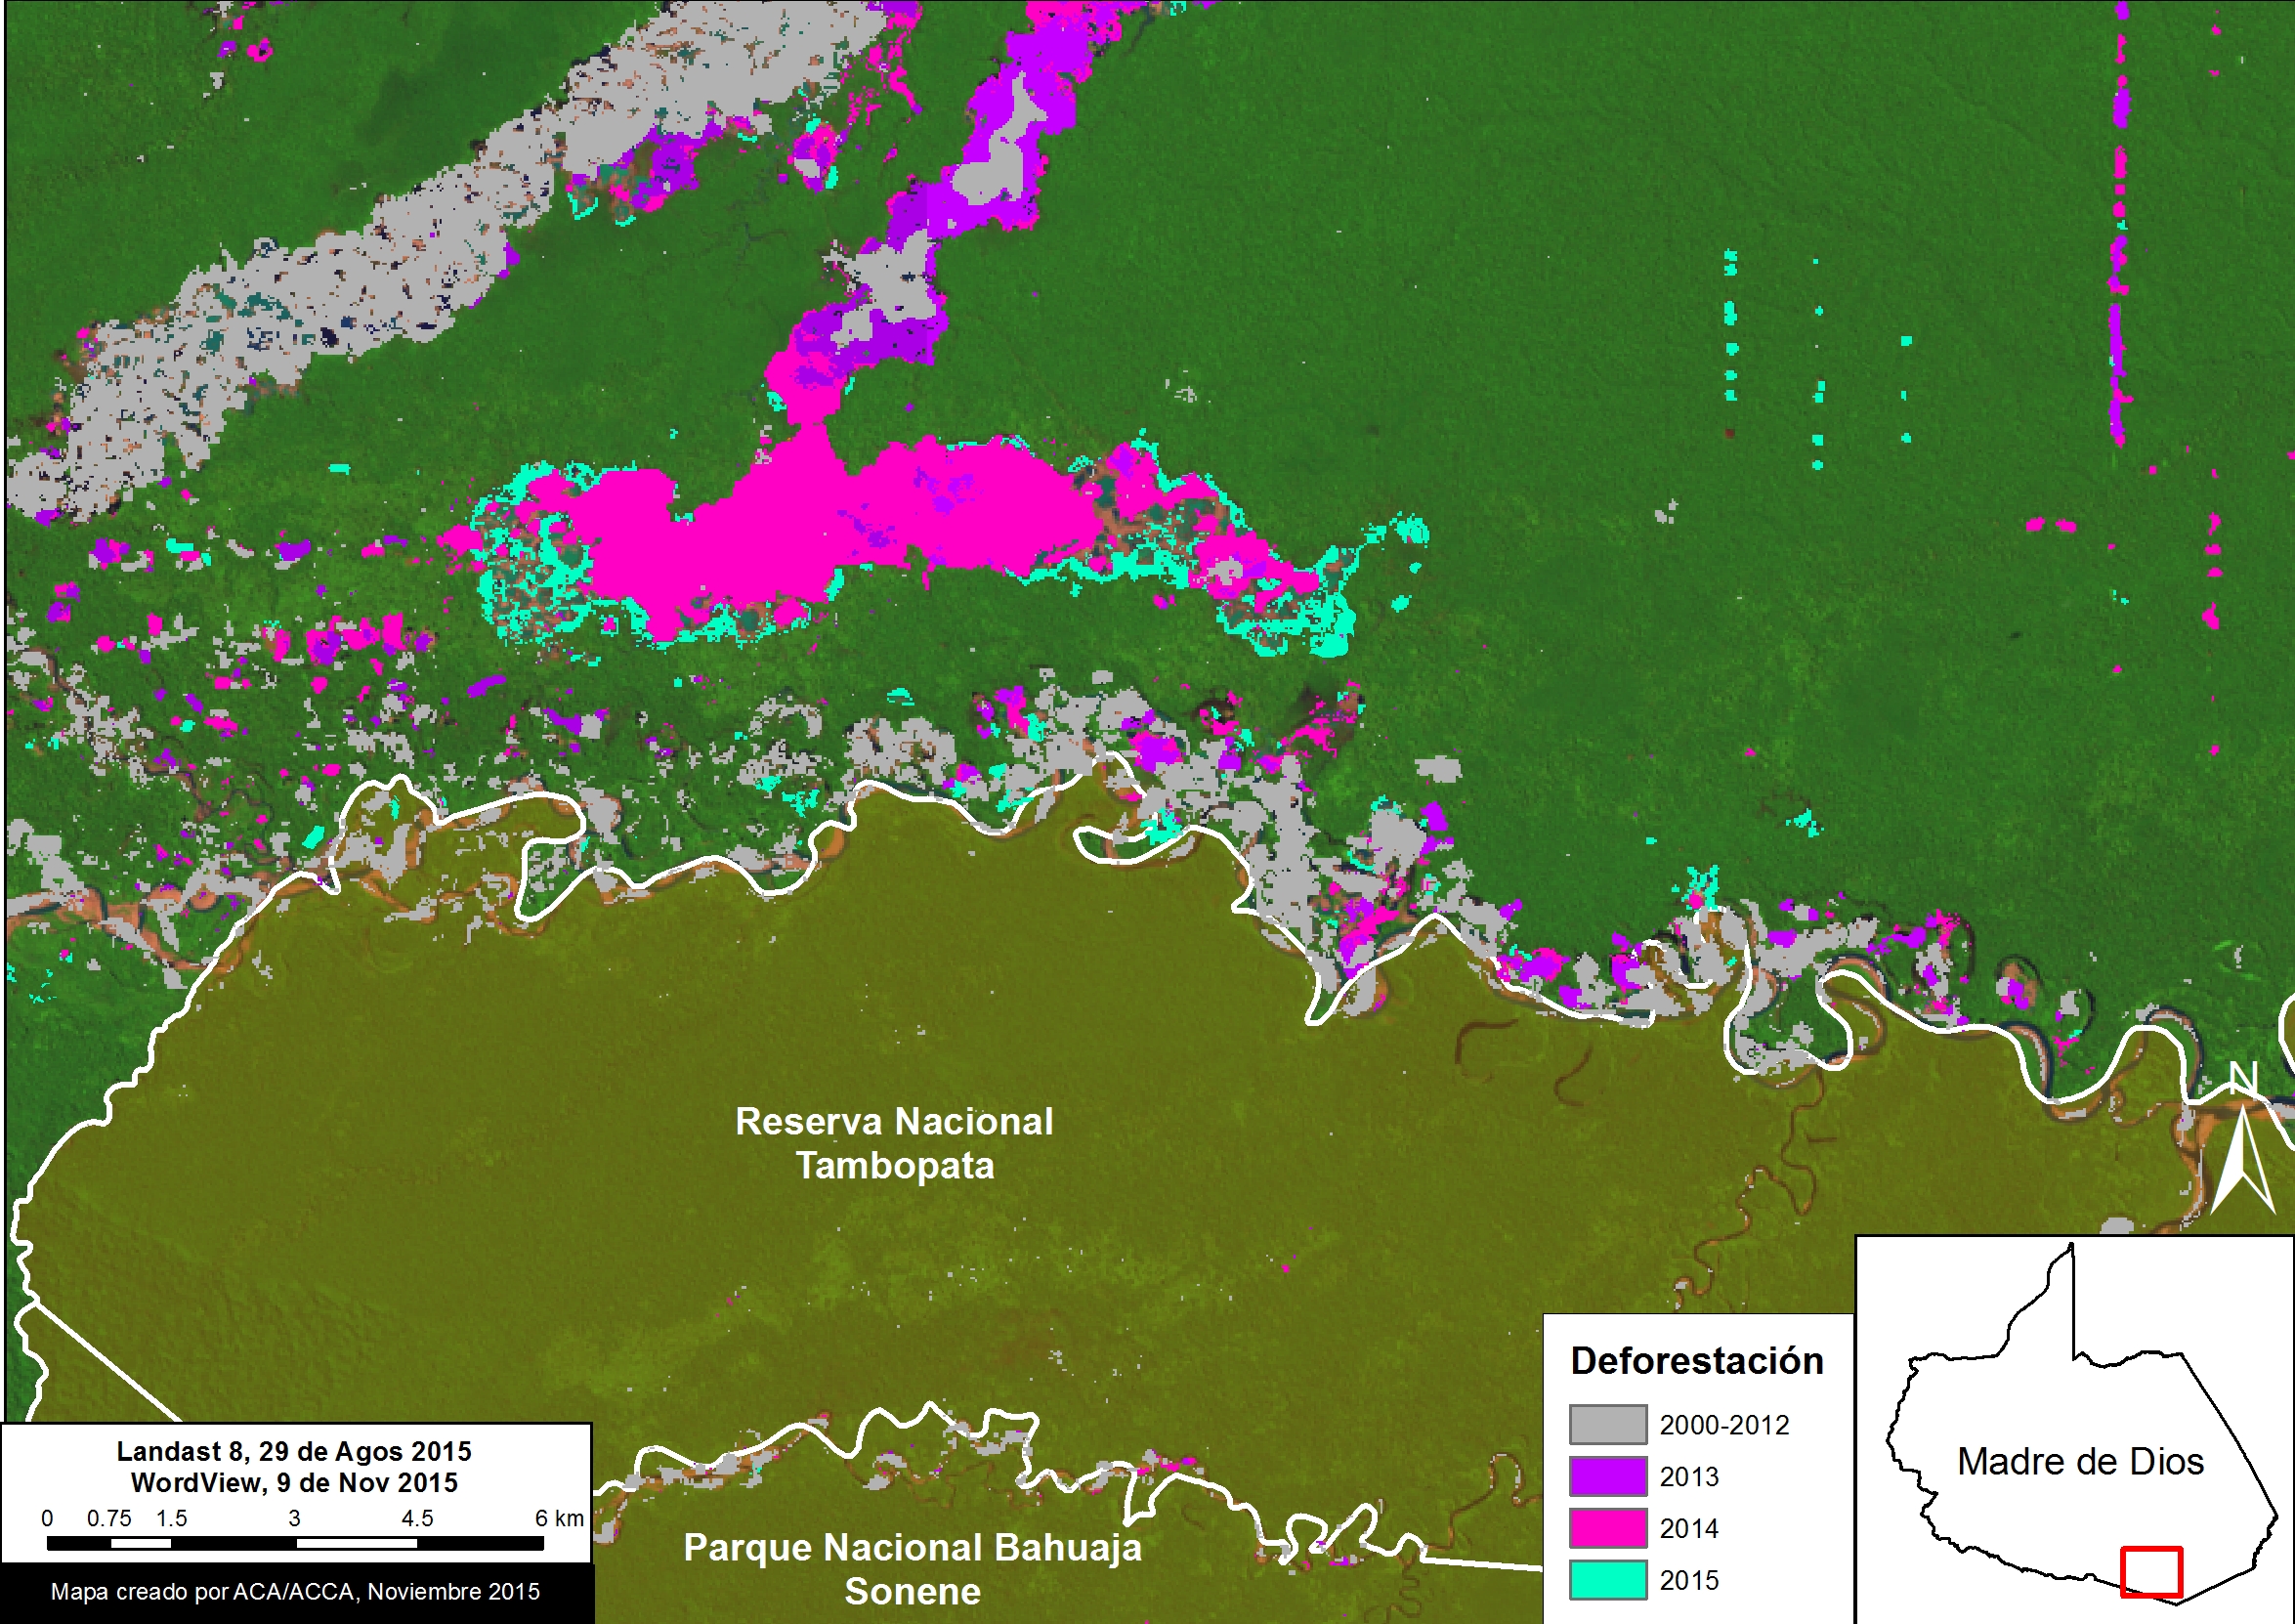
Example 1: Illegal Gold Mining in buffer zone of Bahuaja Sonene National Park (Madre de Dios)
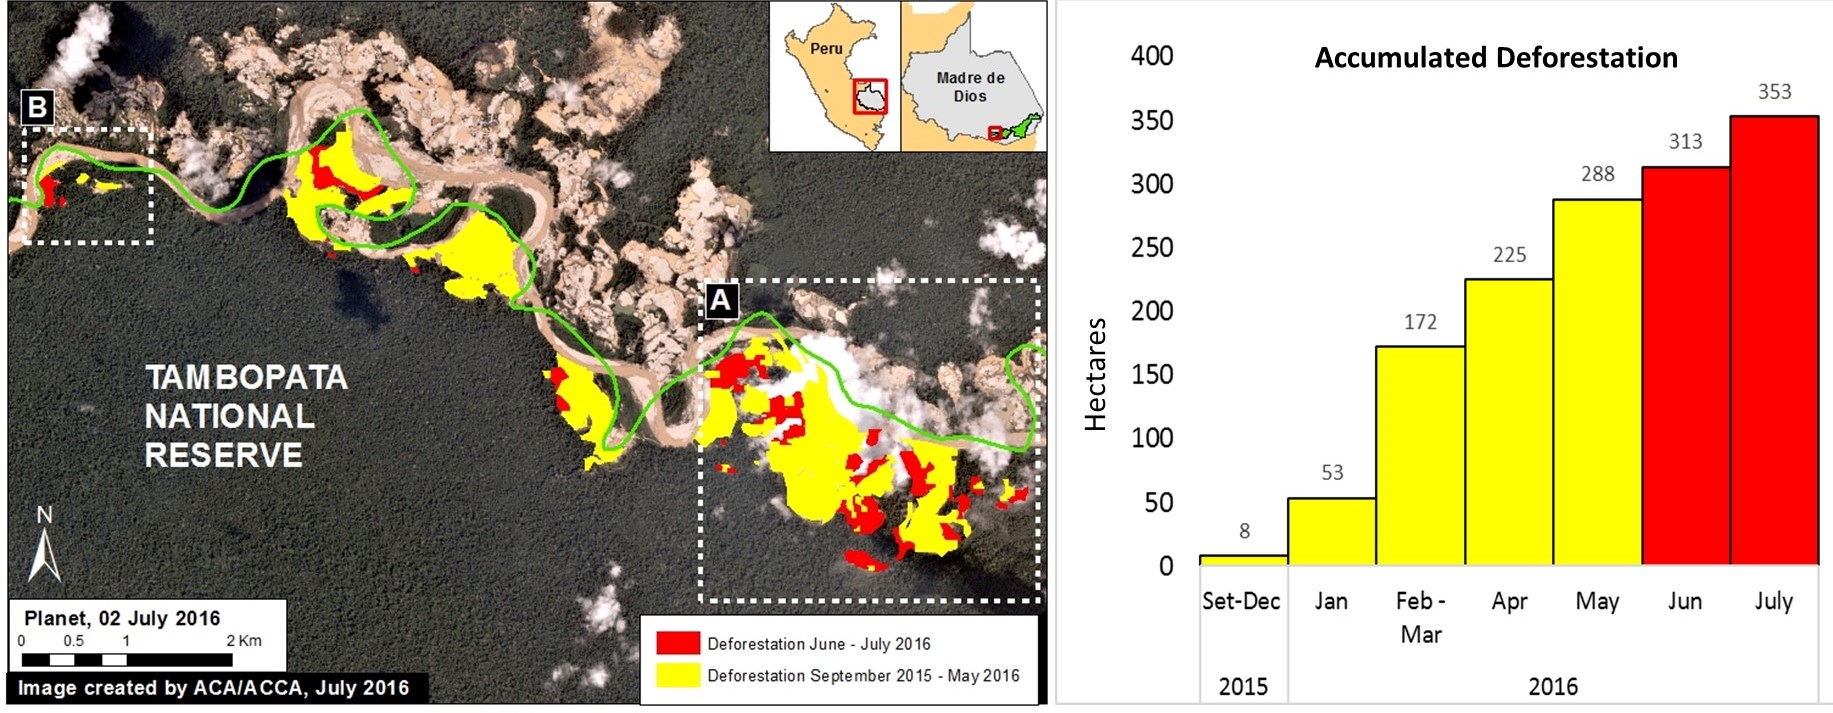
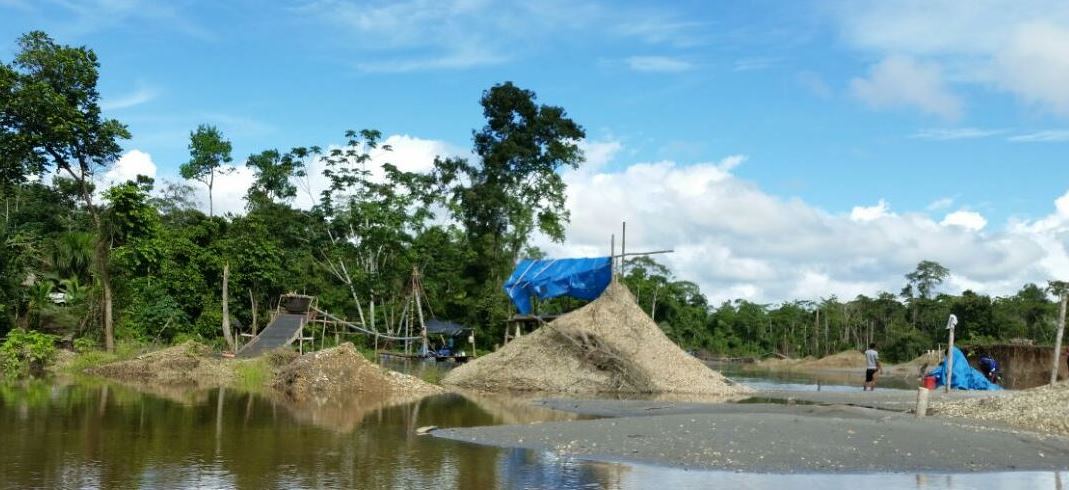
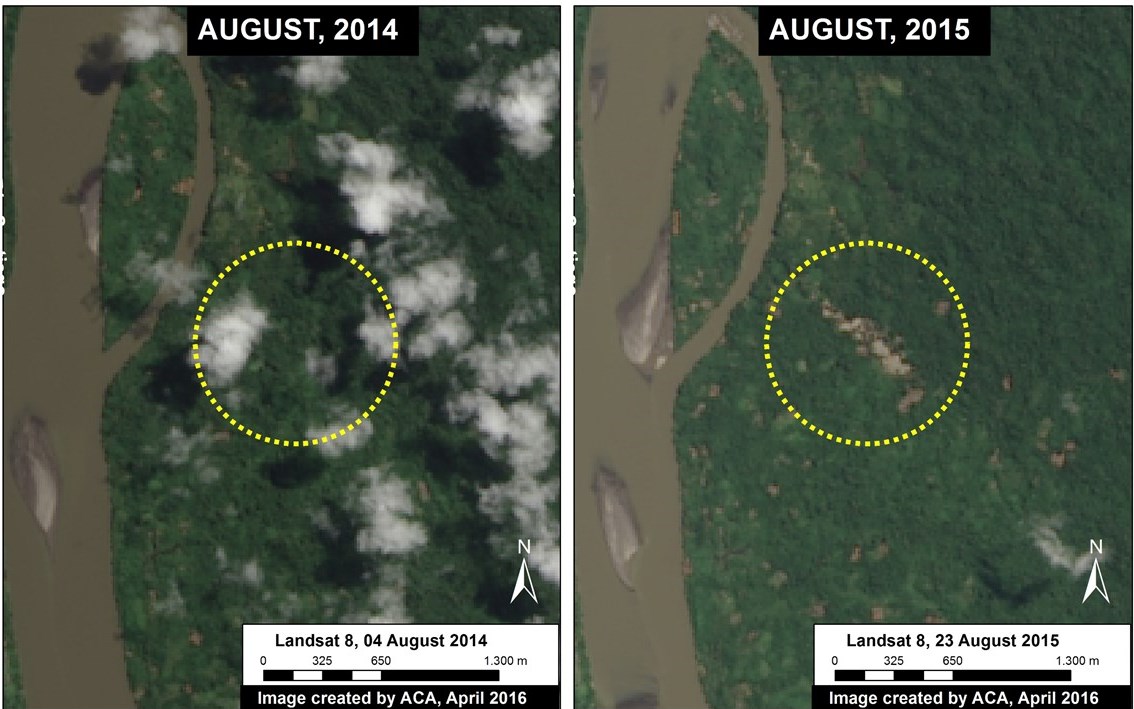
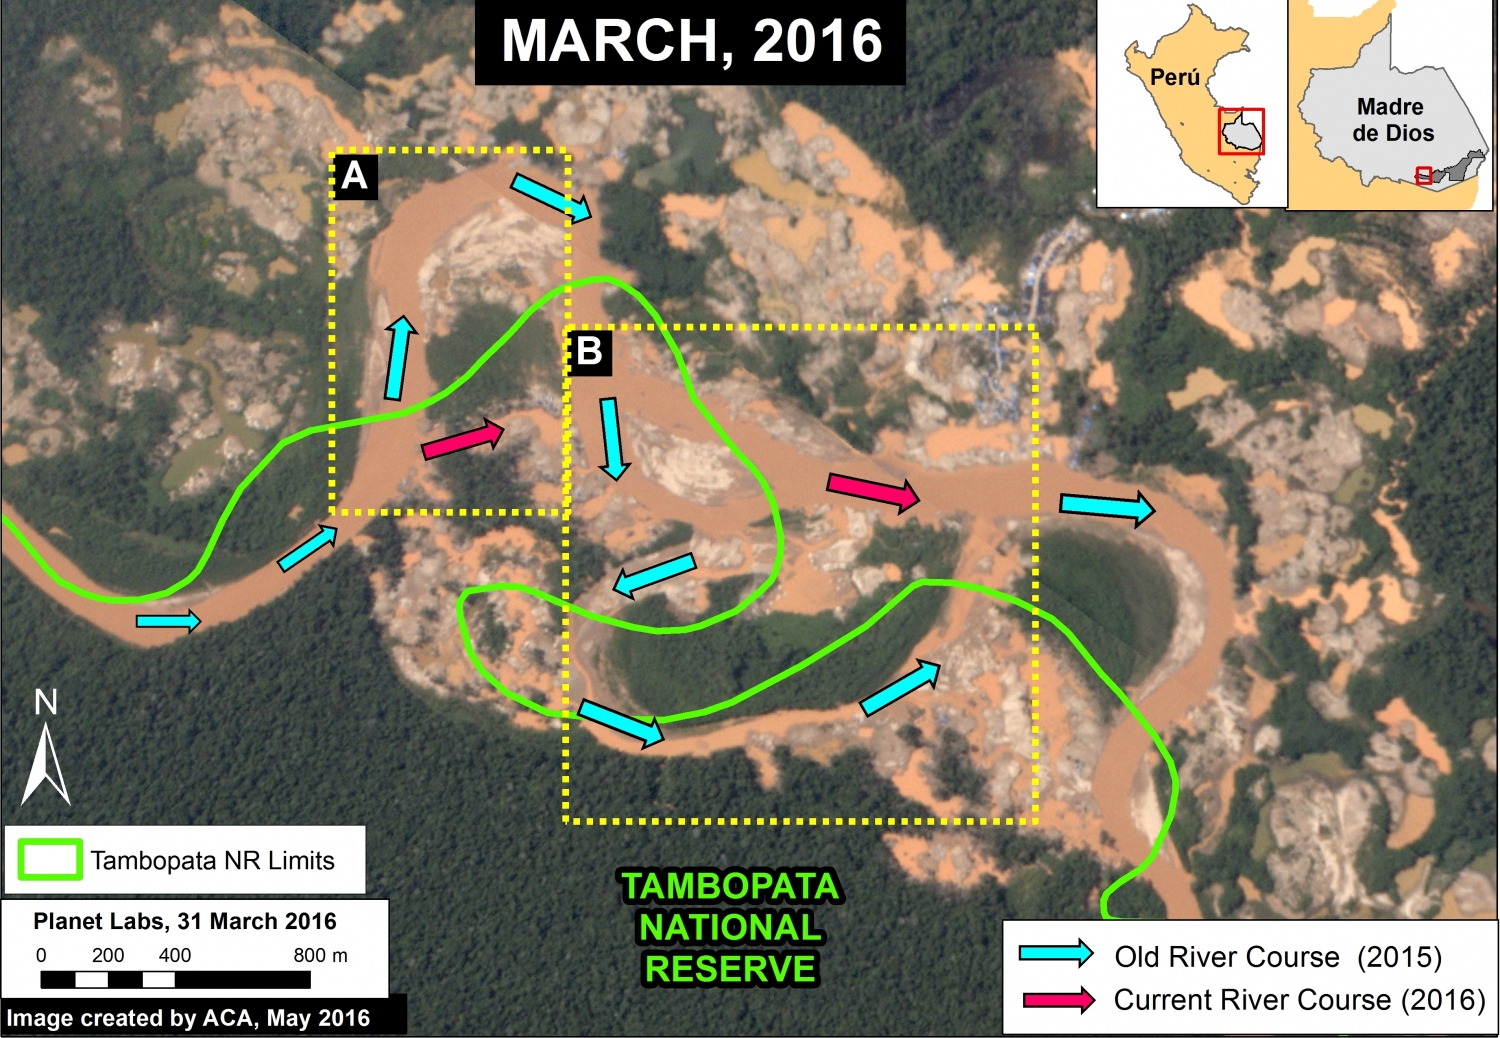
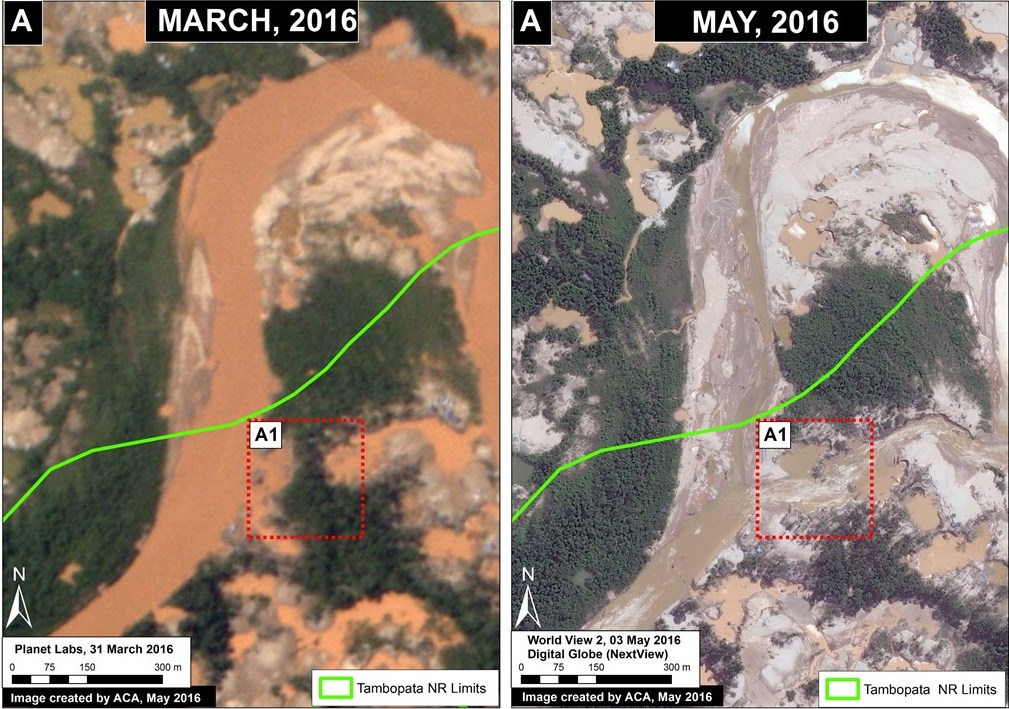
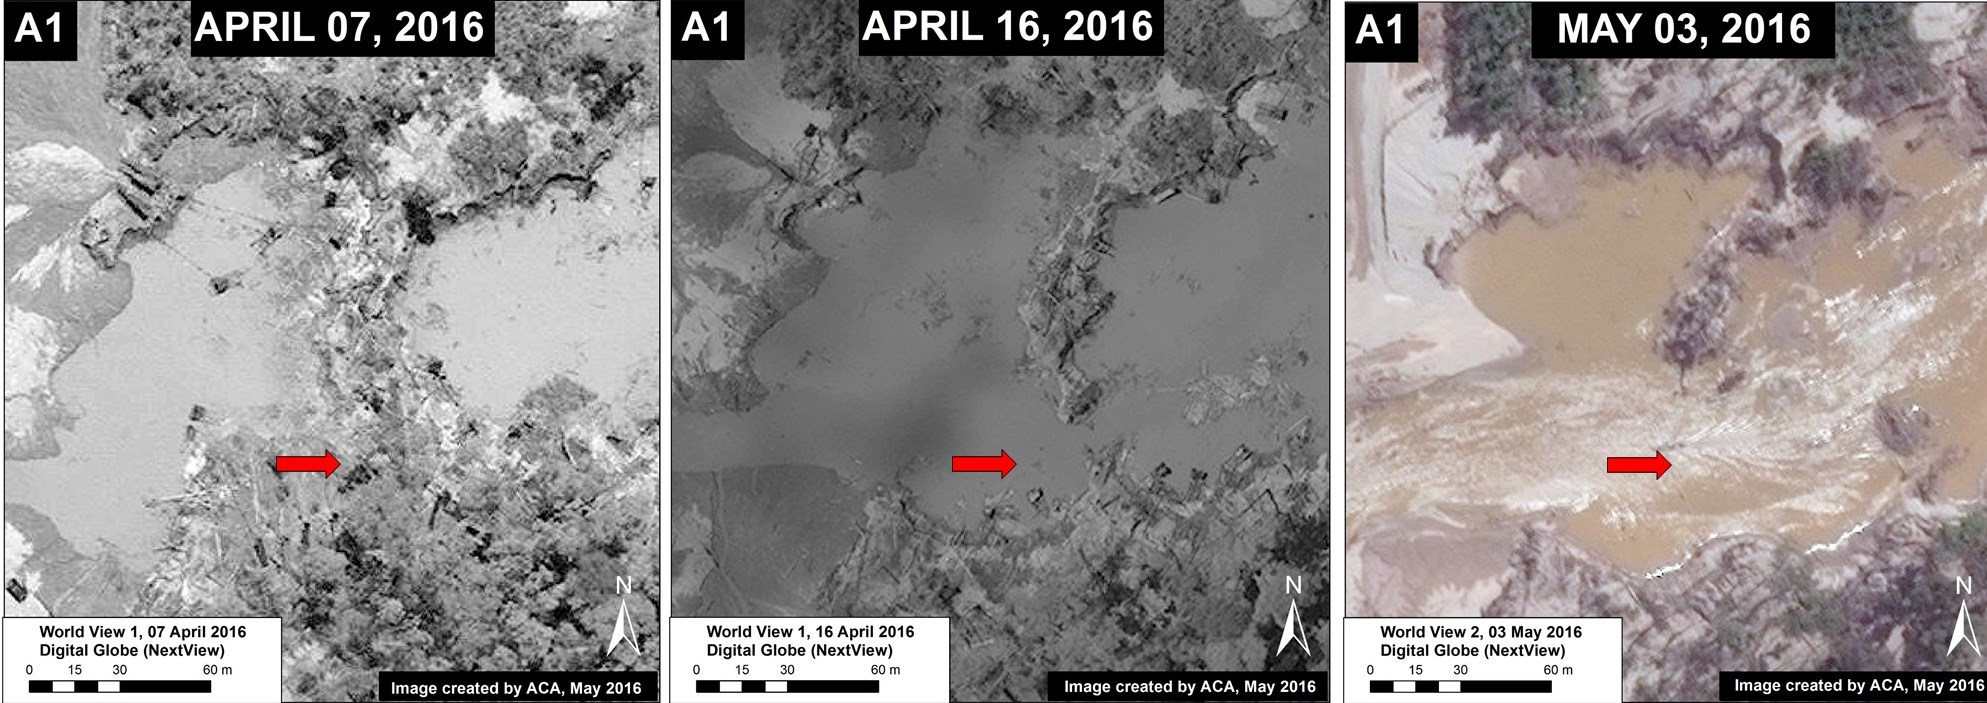
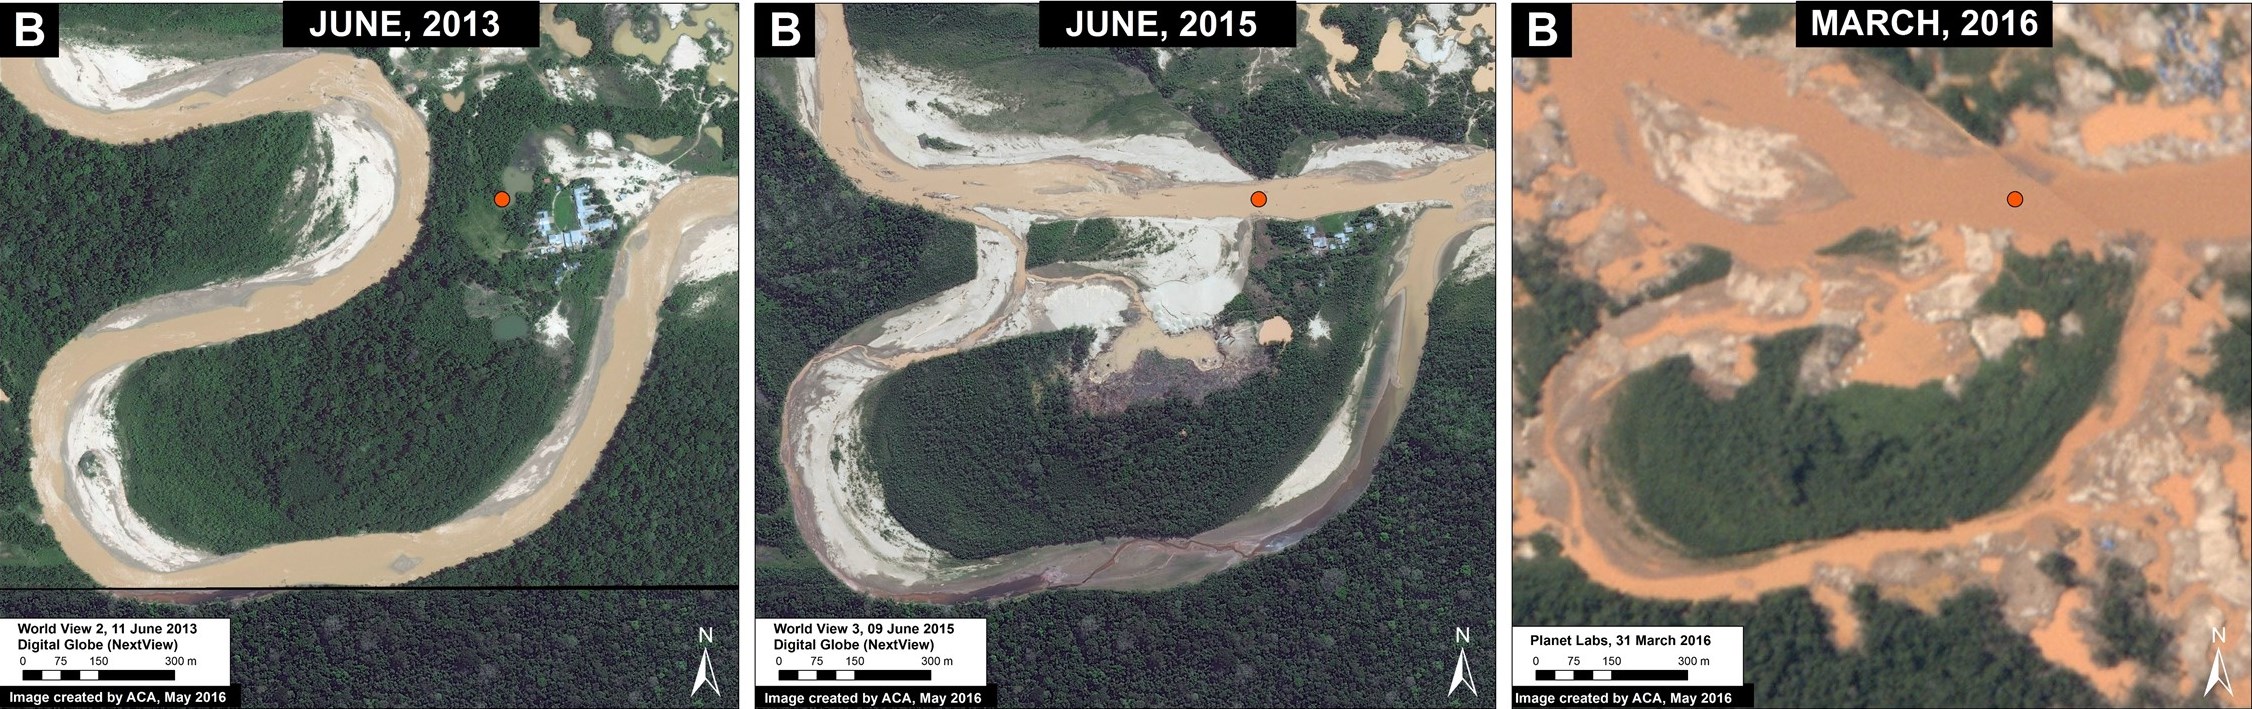
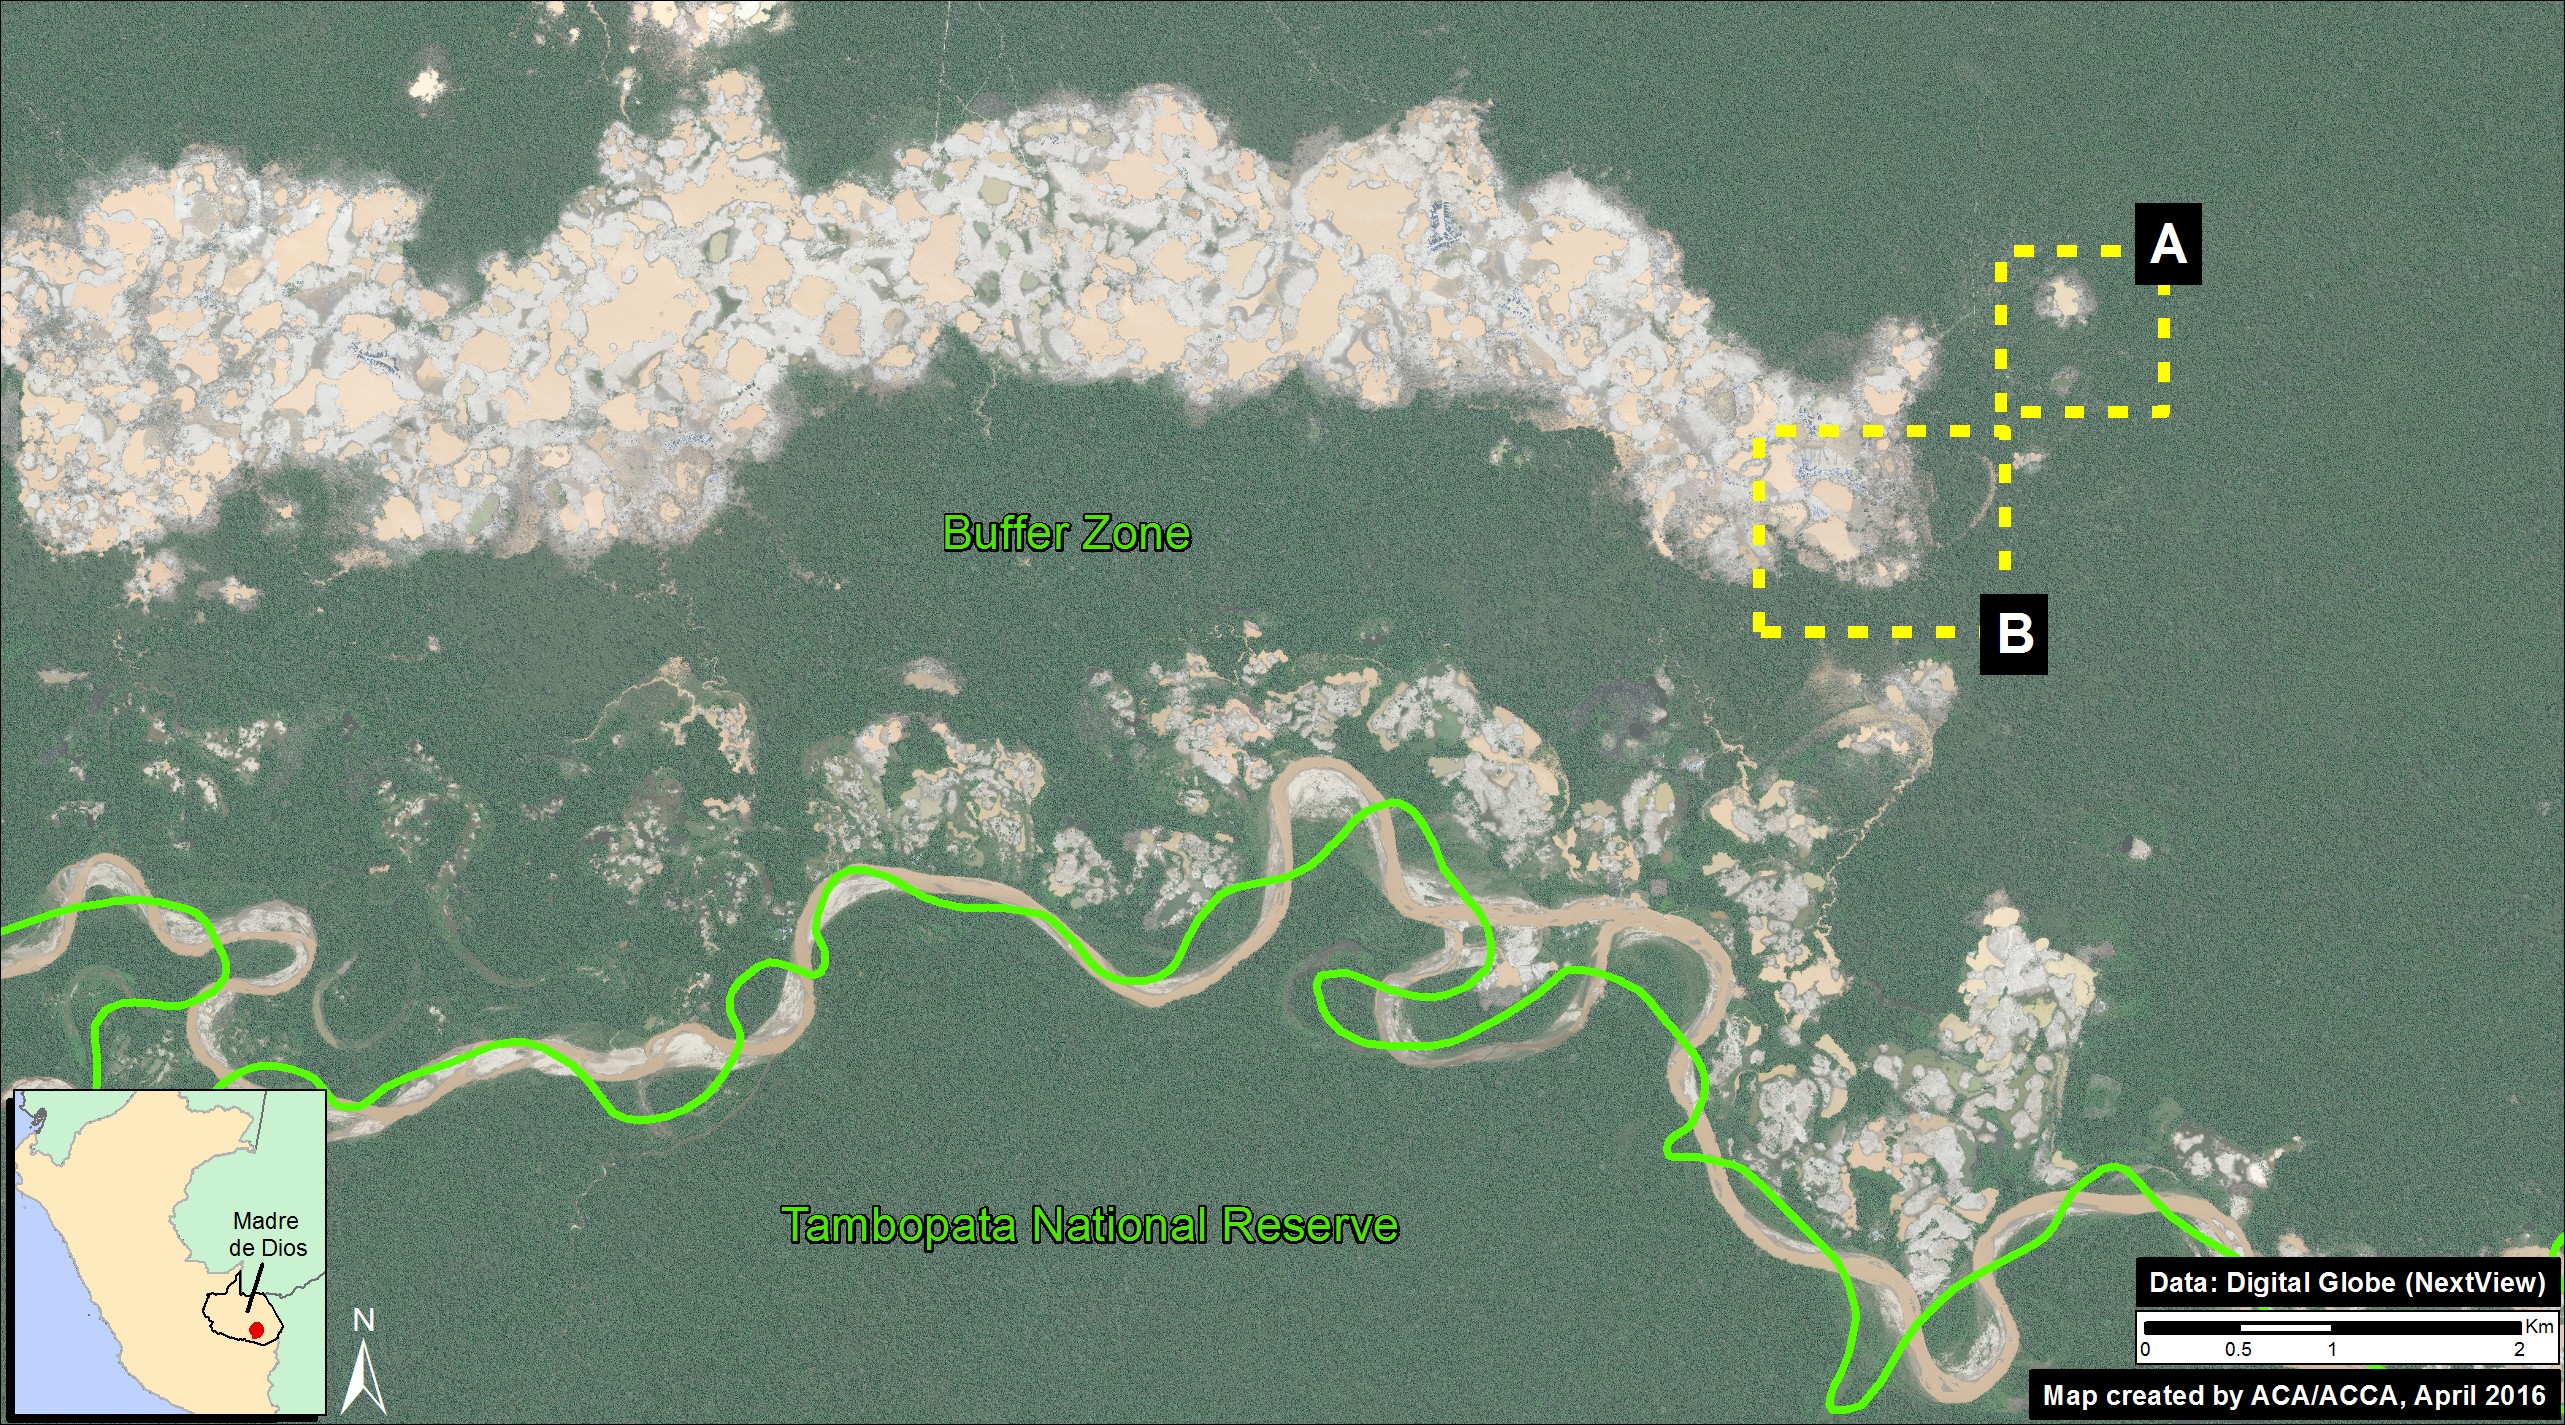
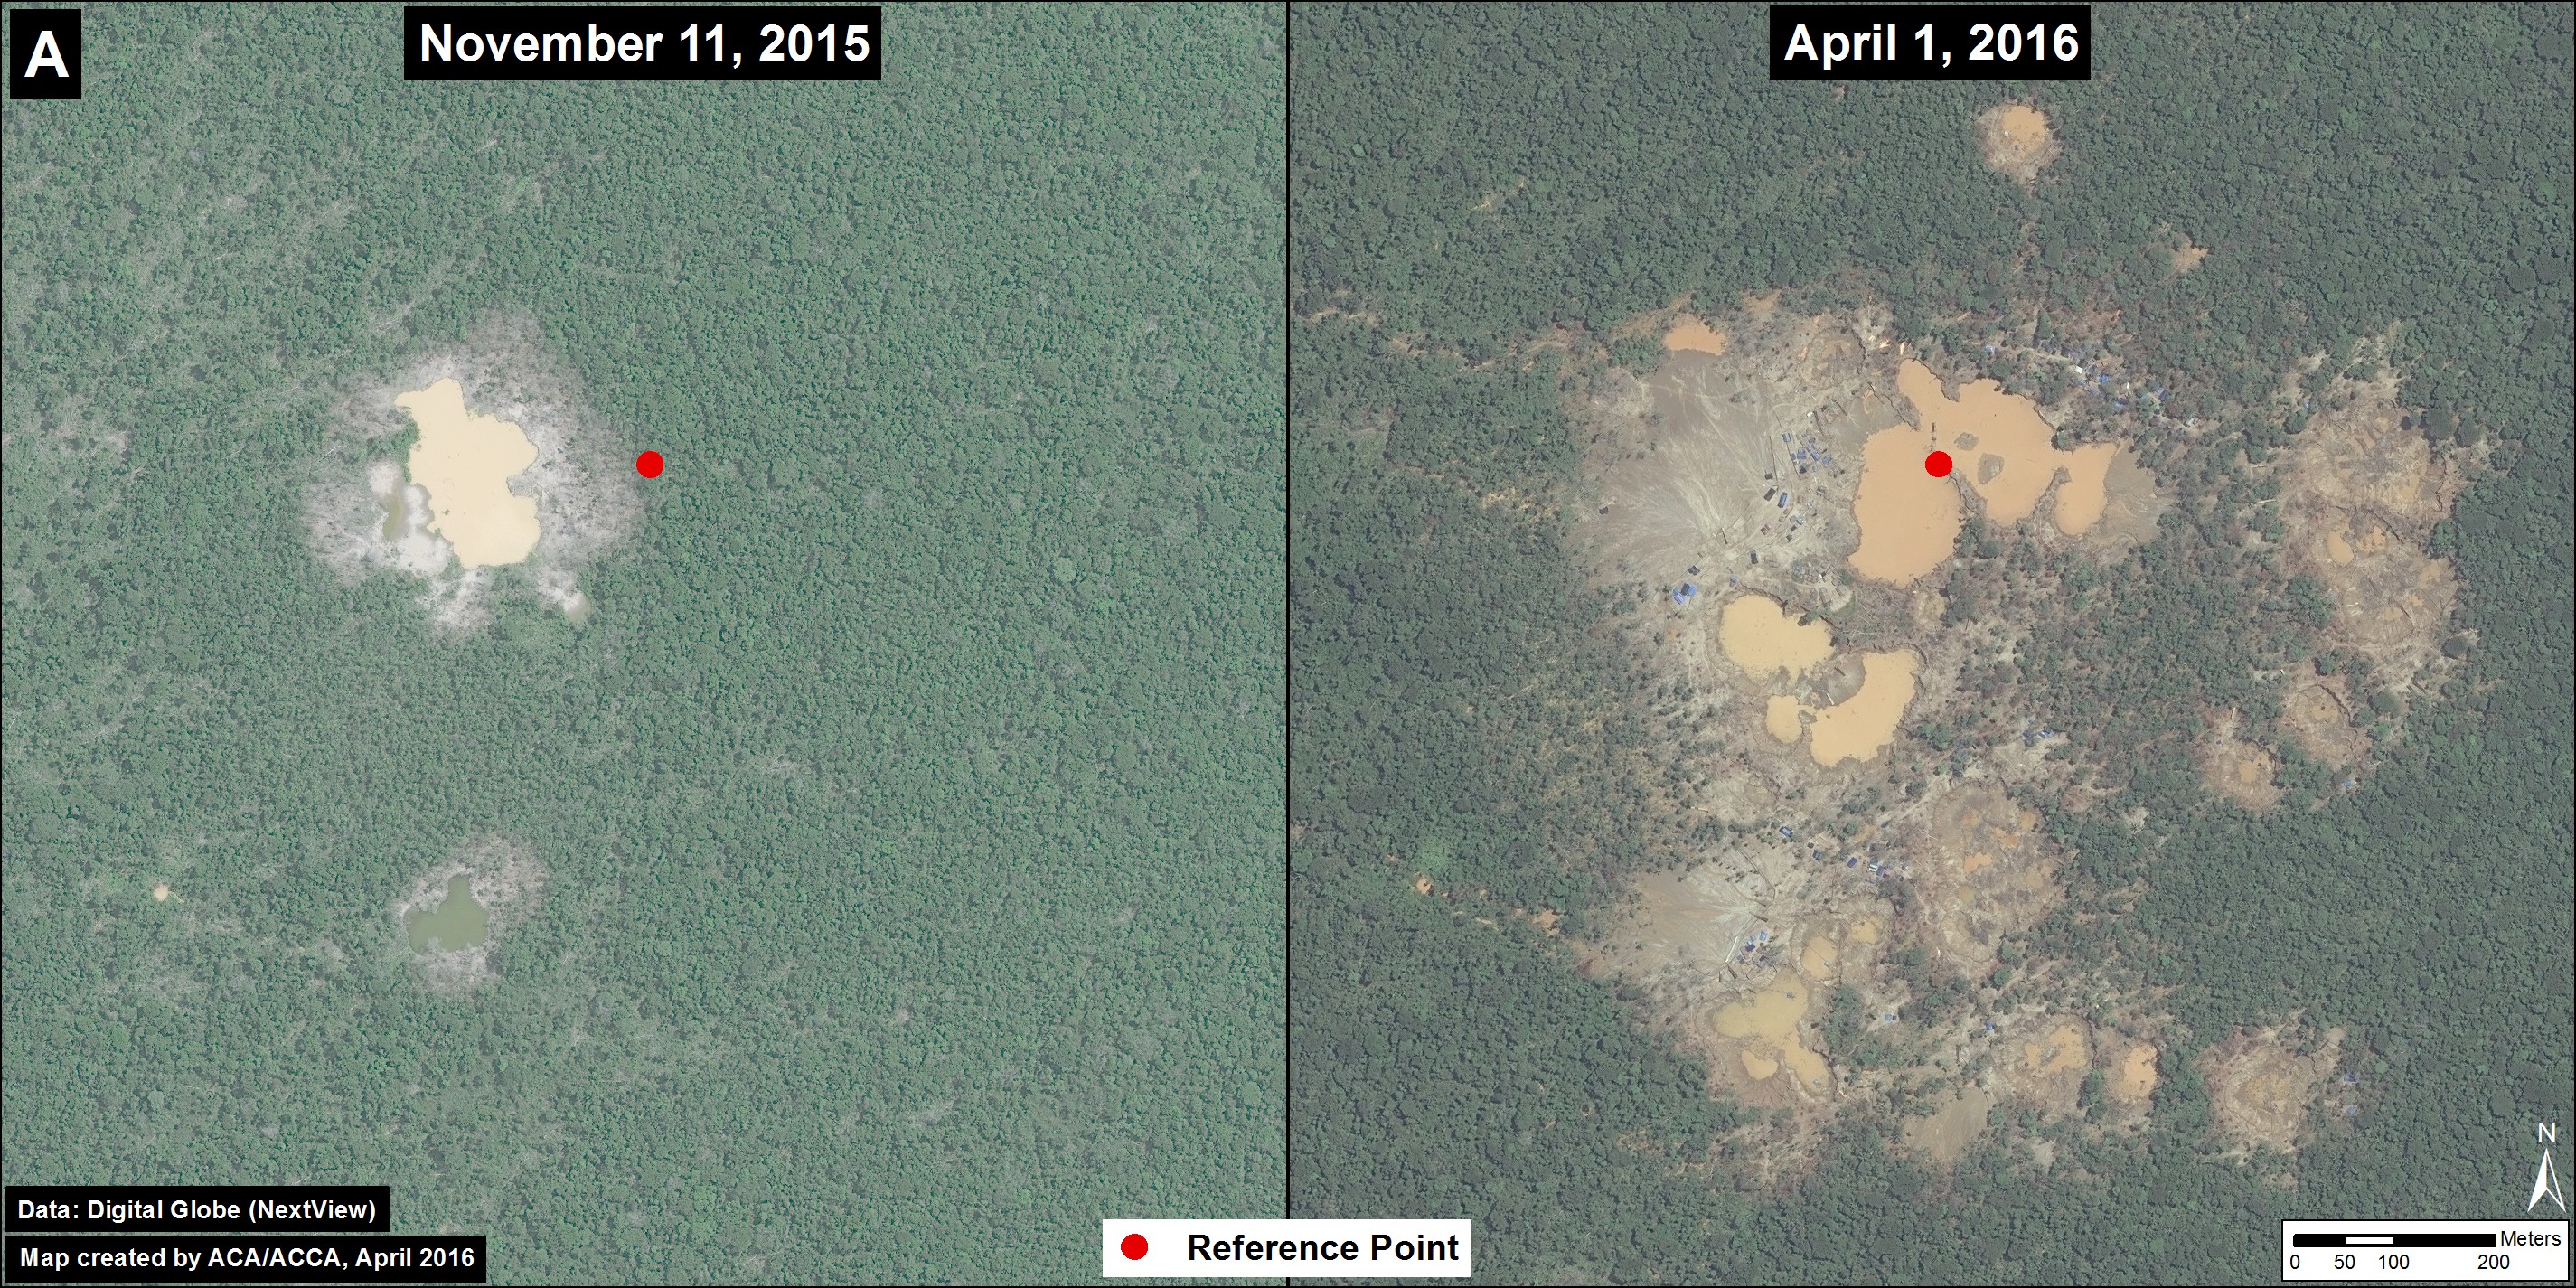
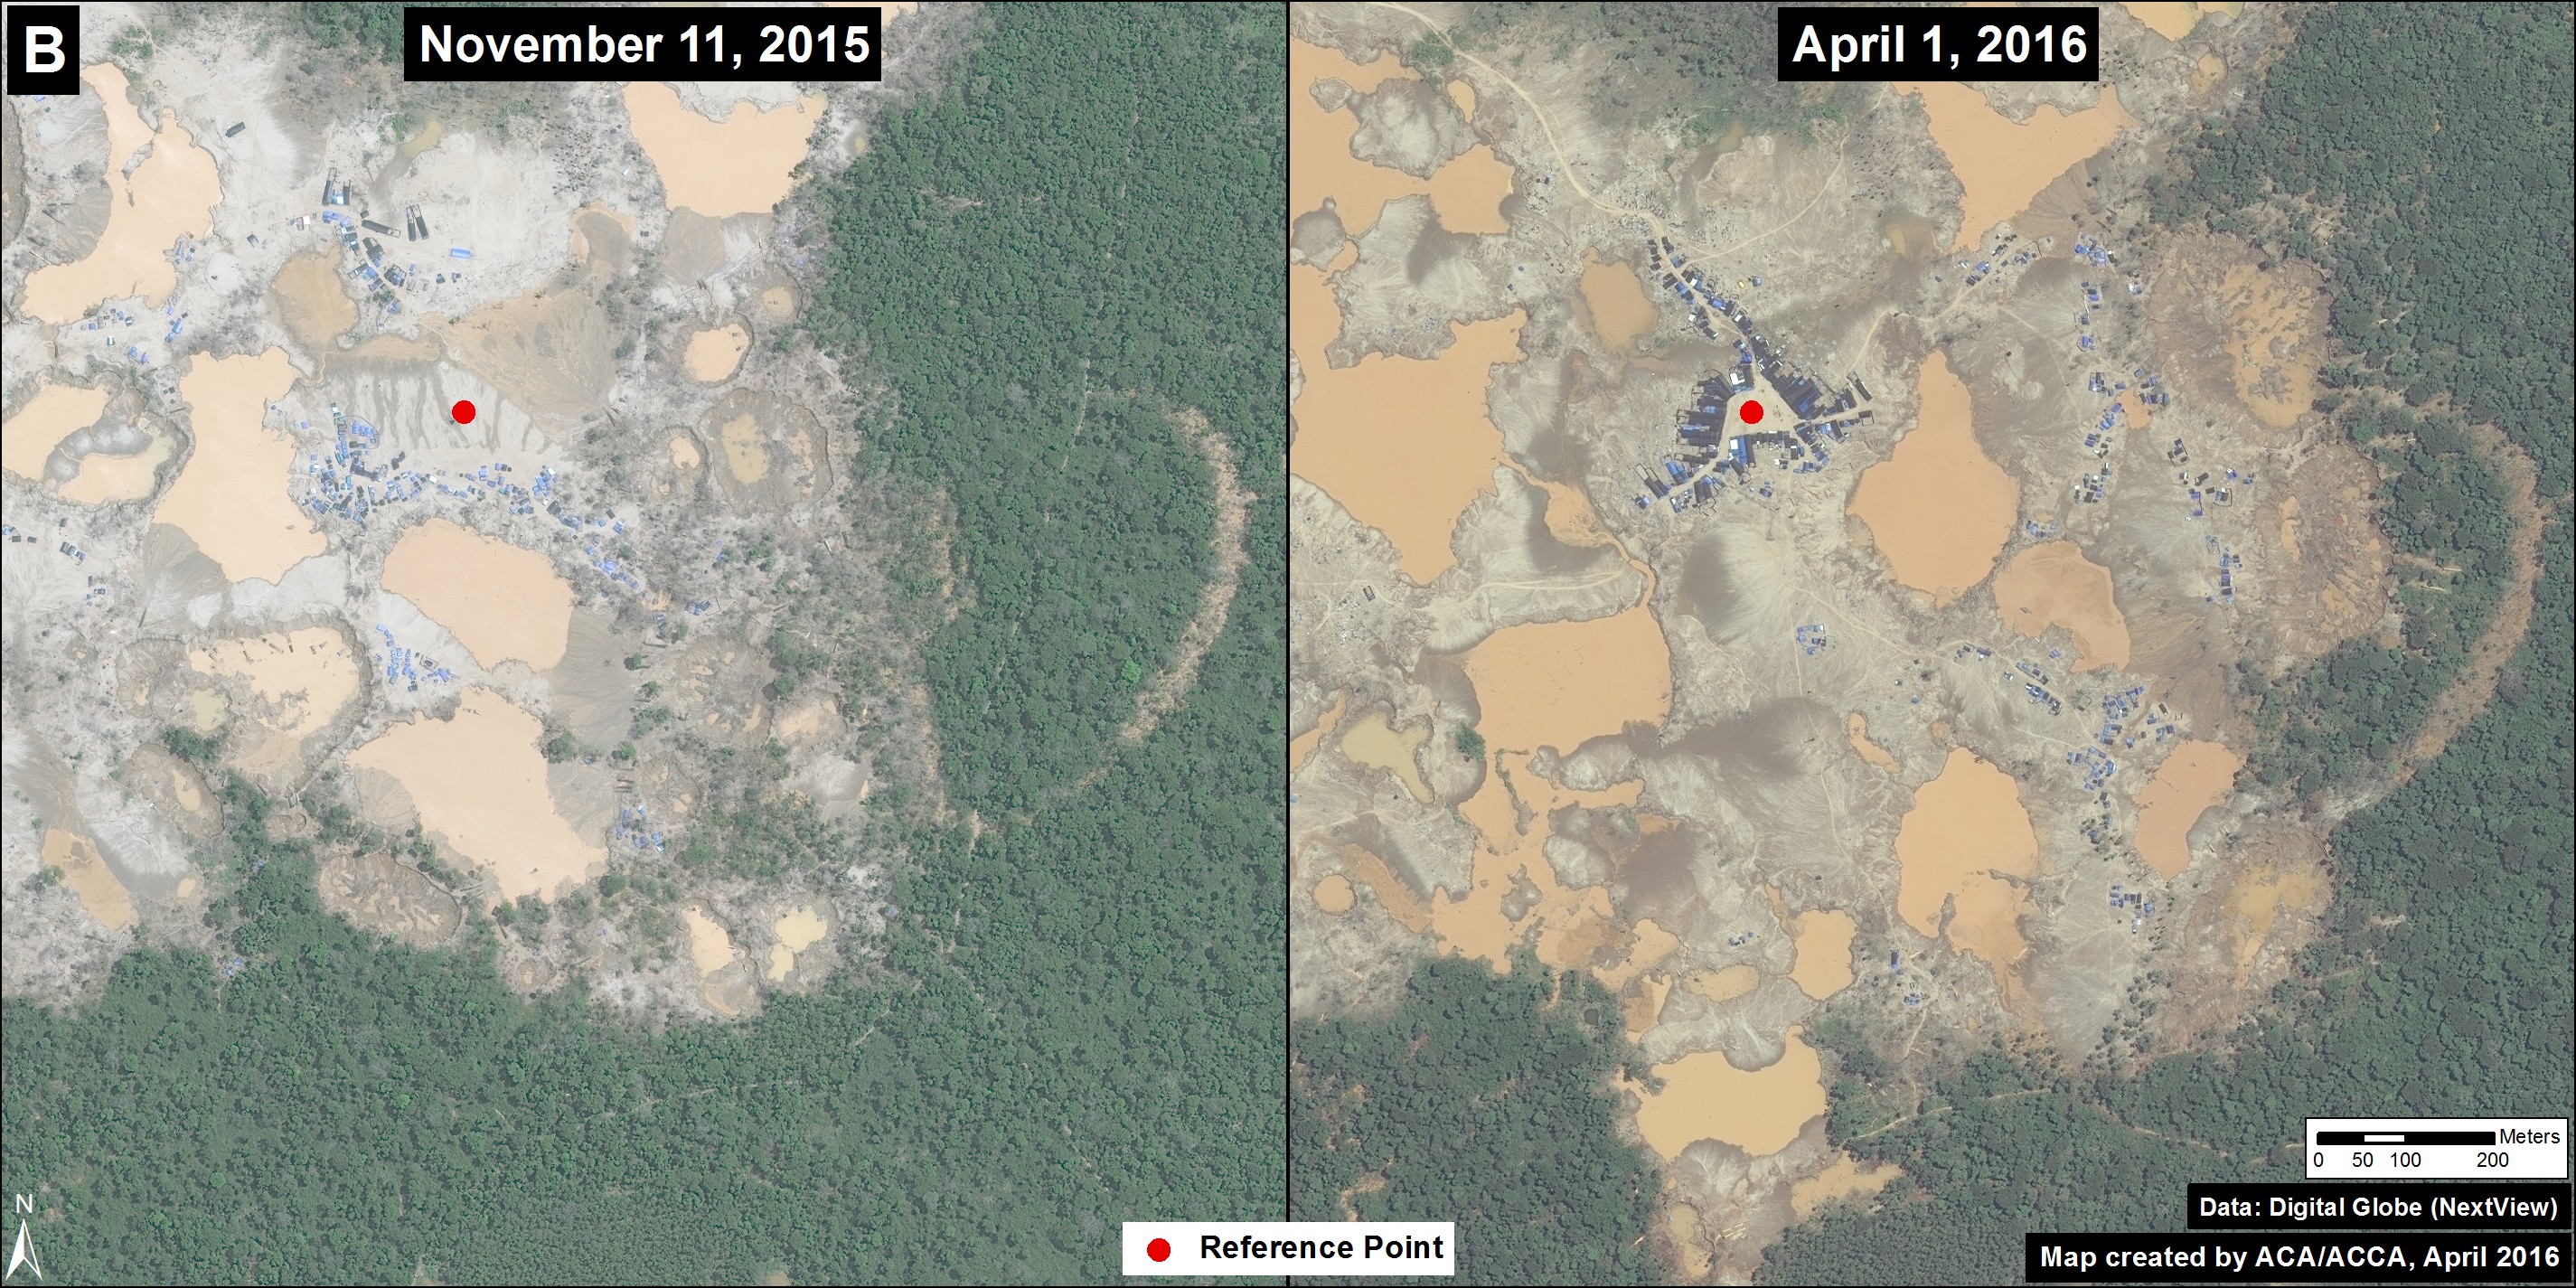
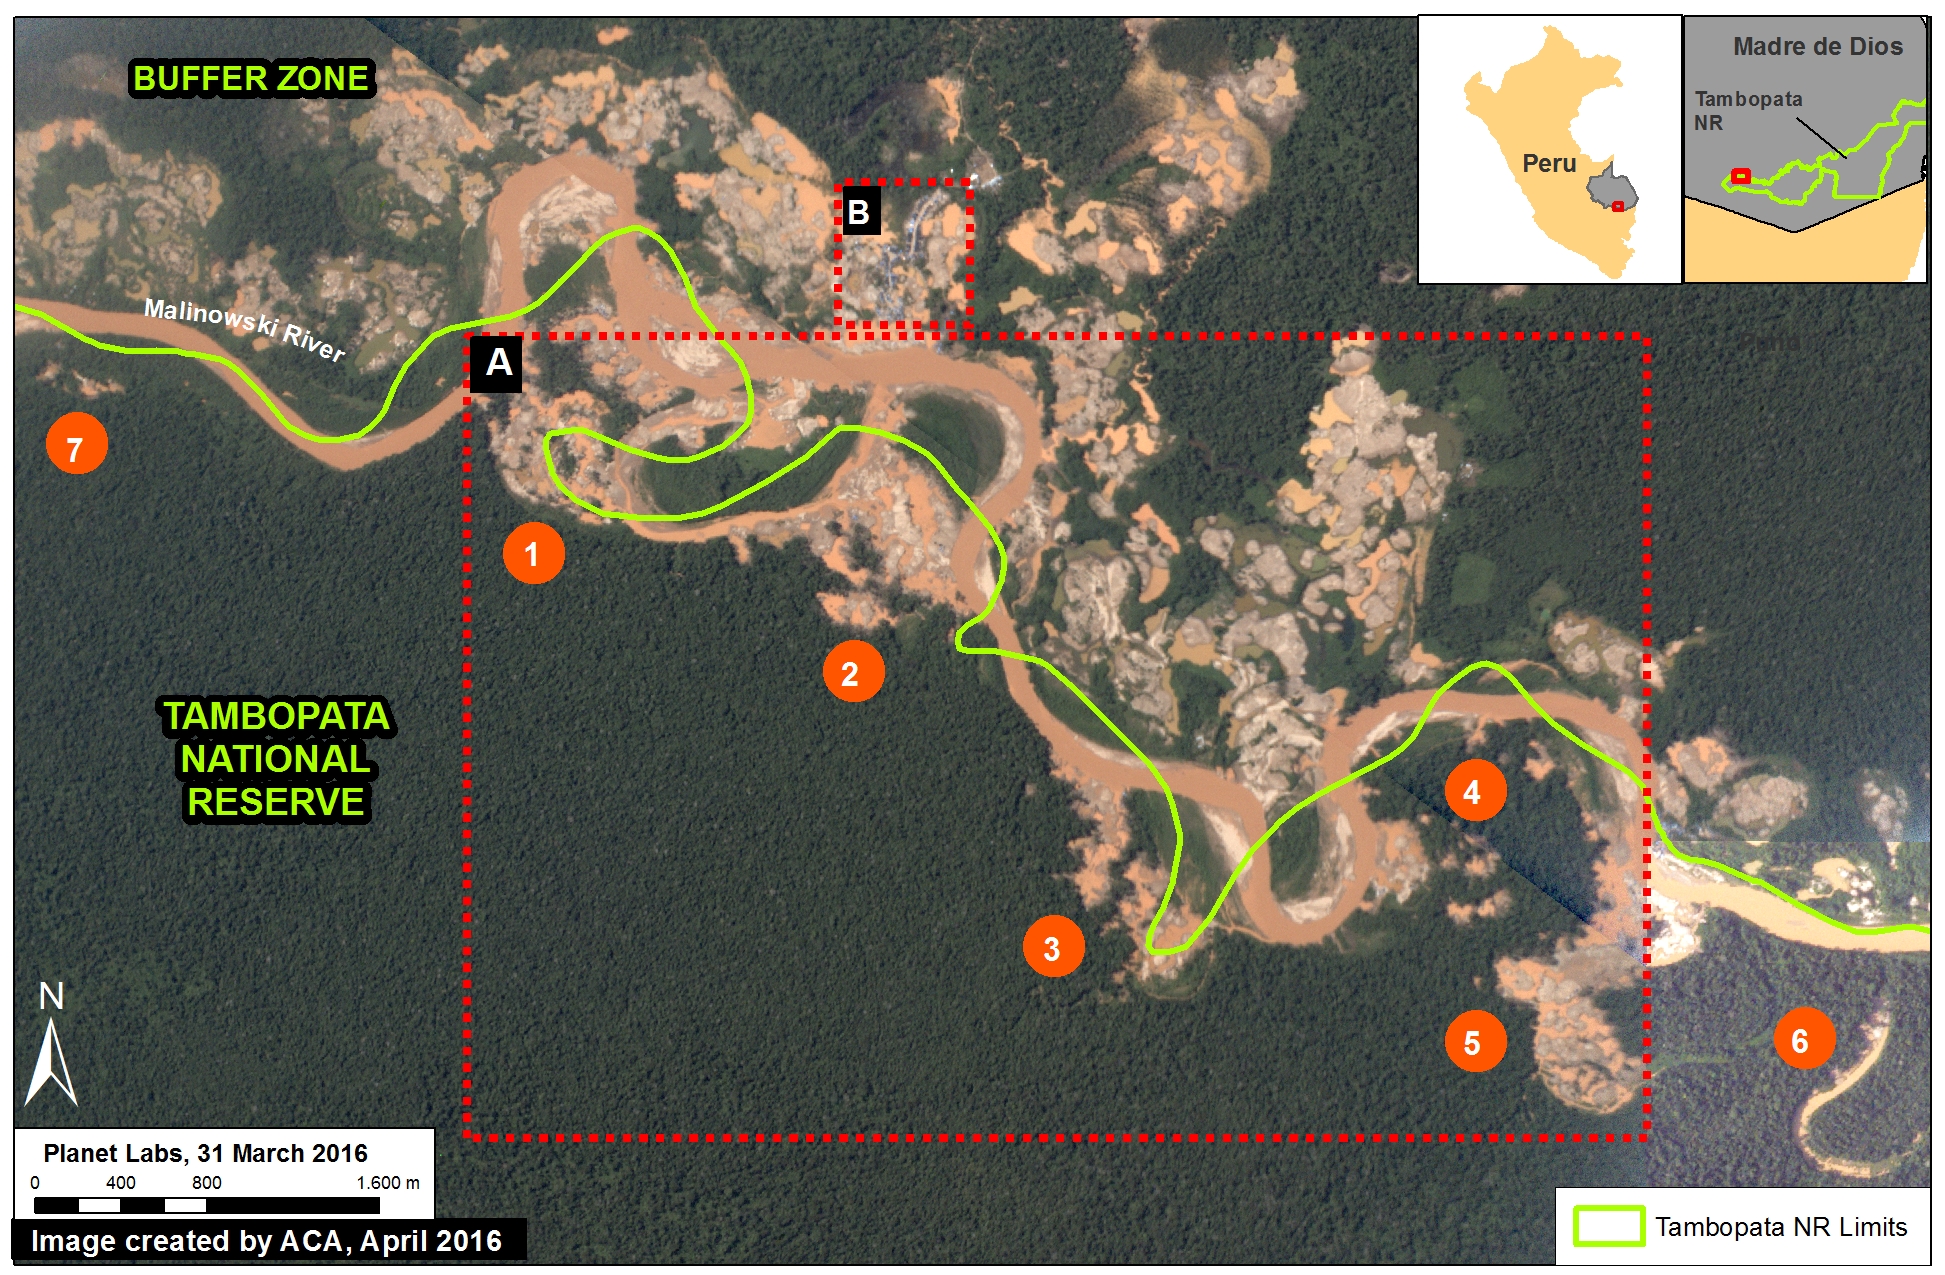
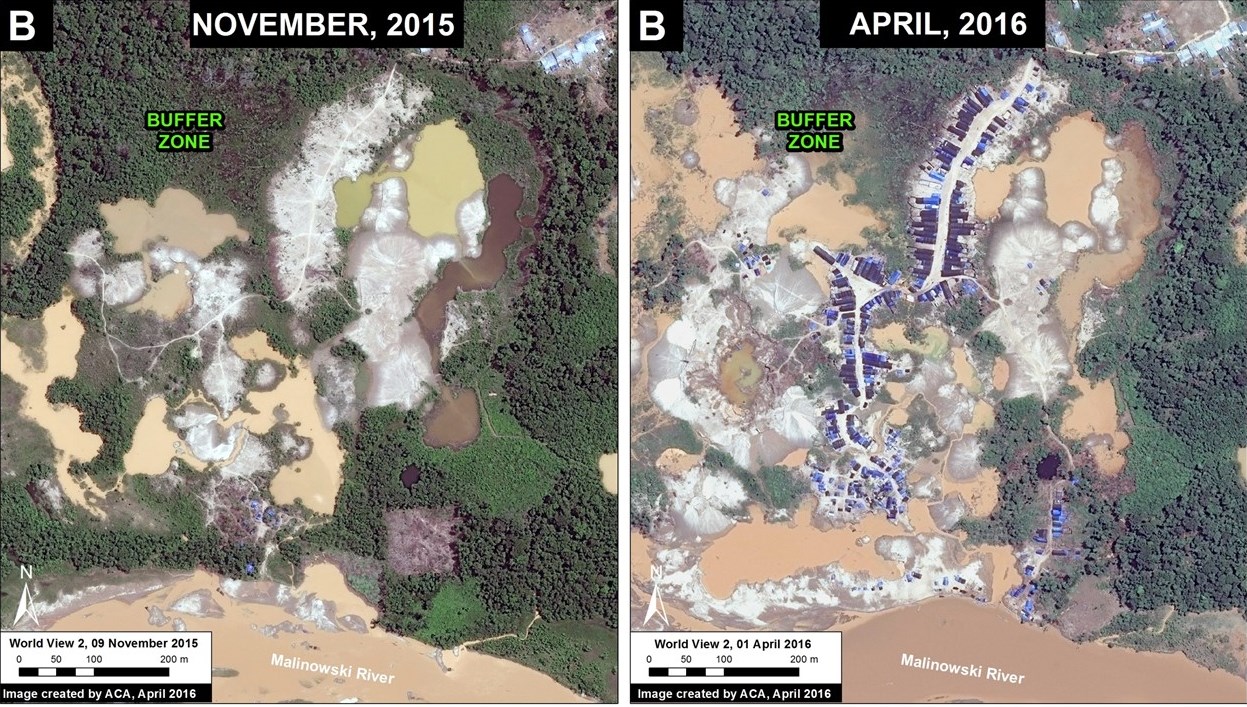
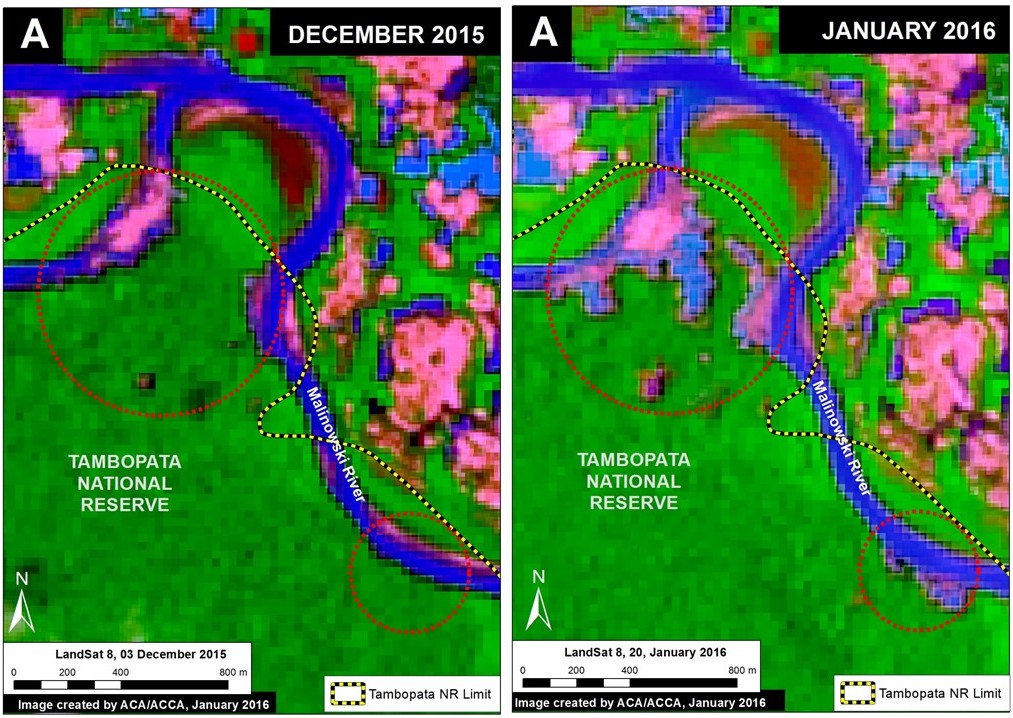
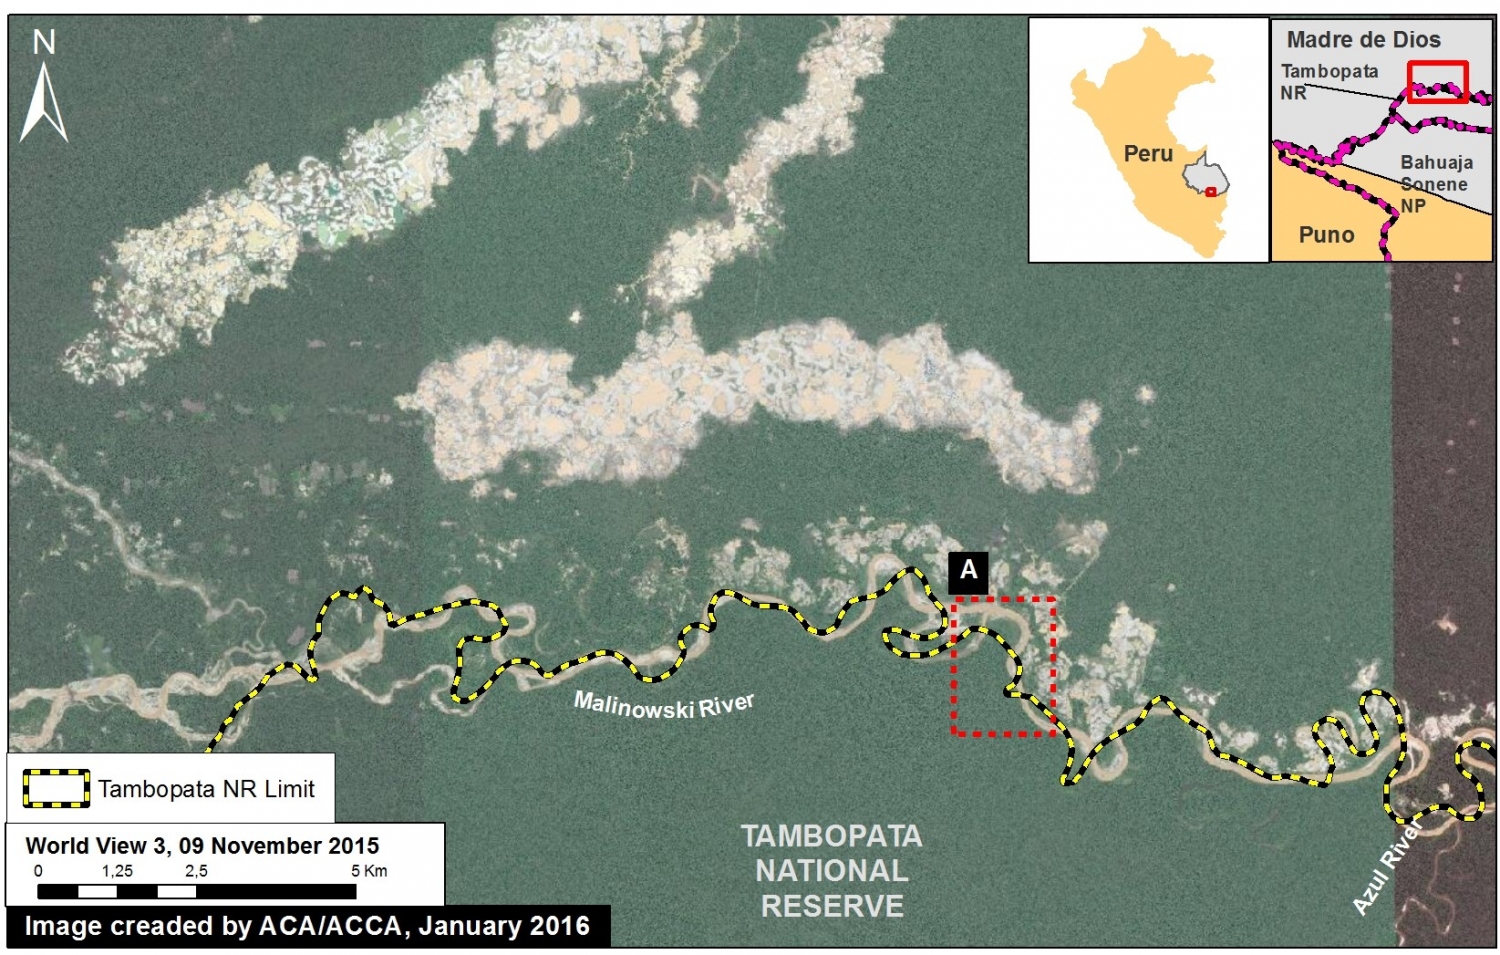
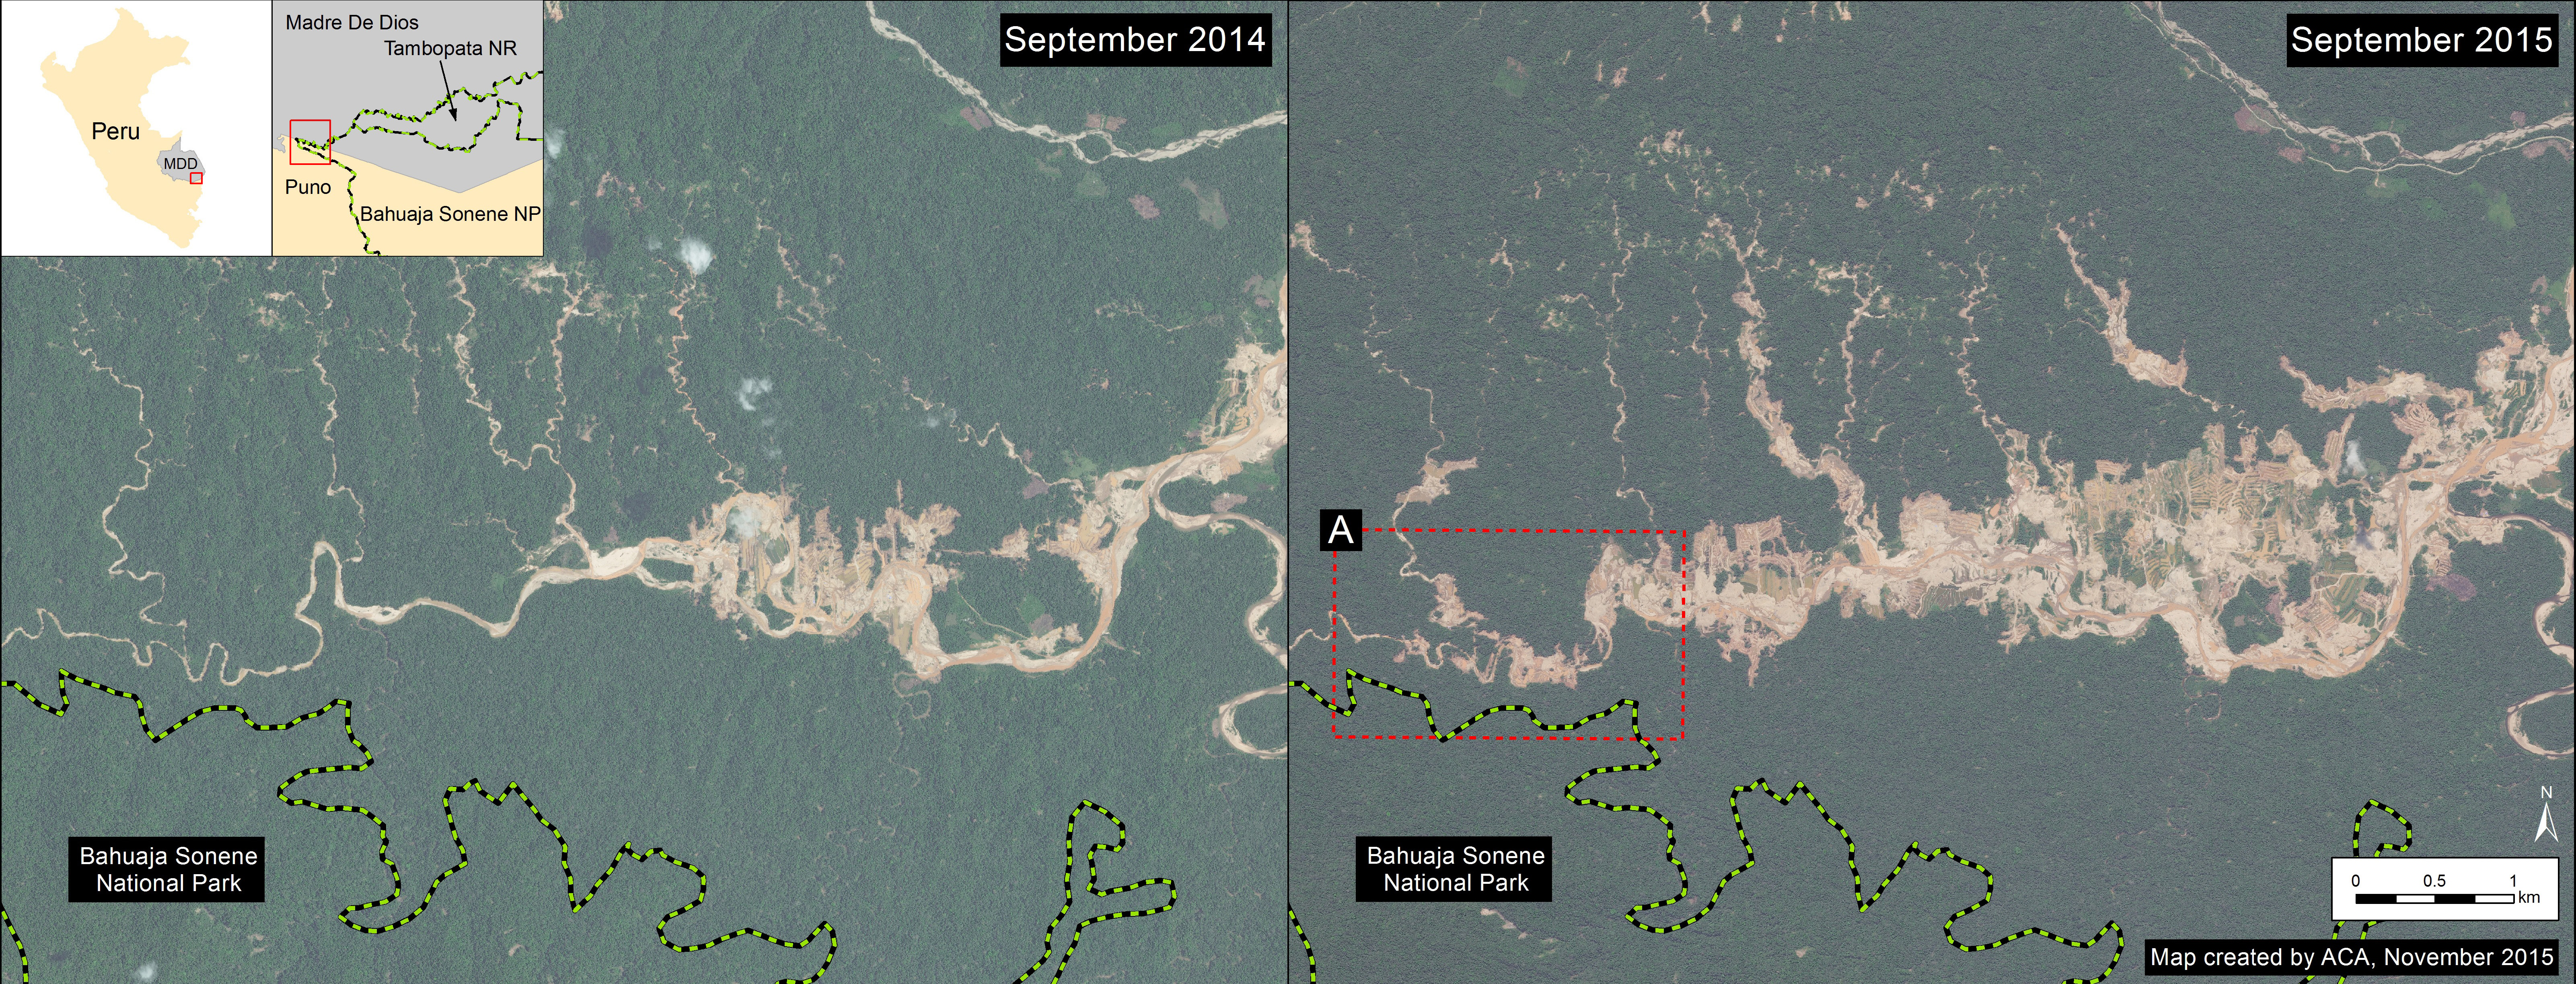
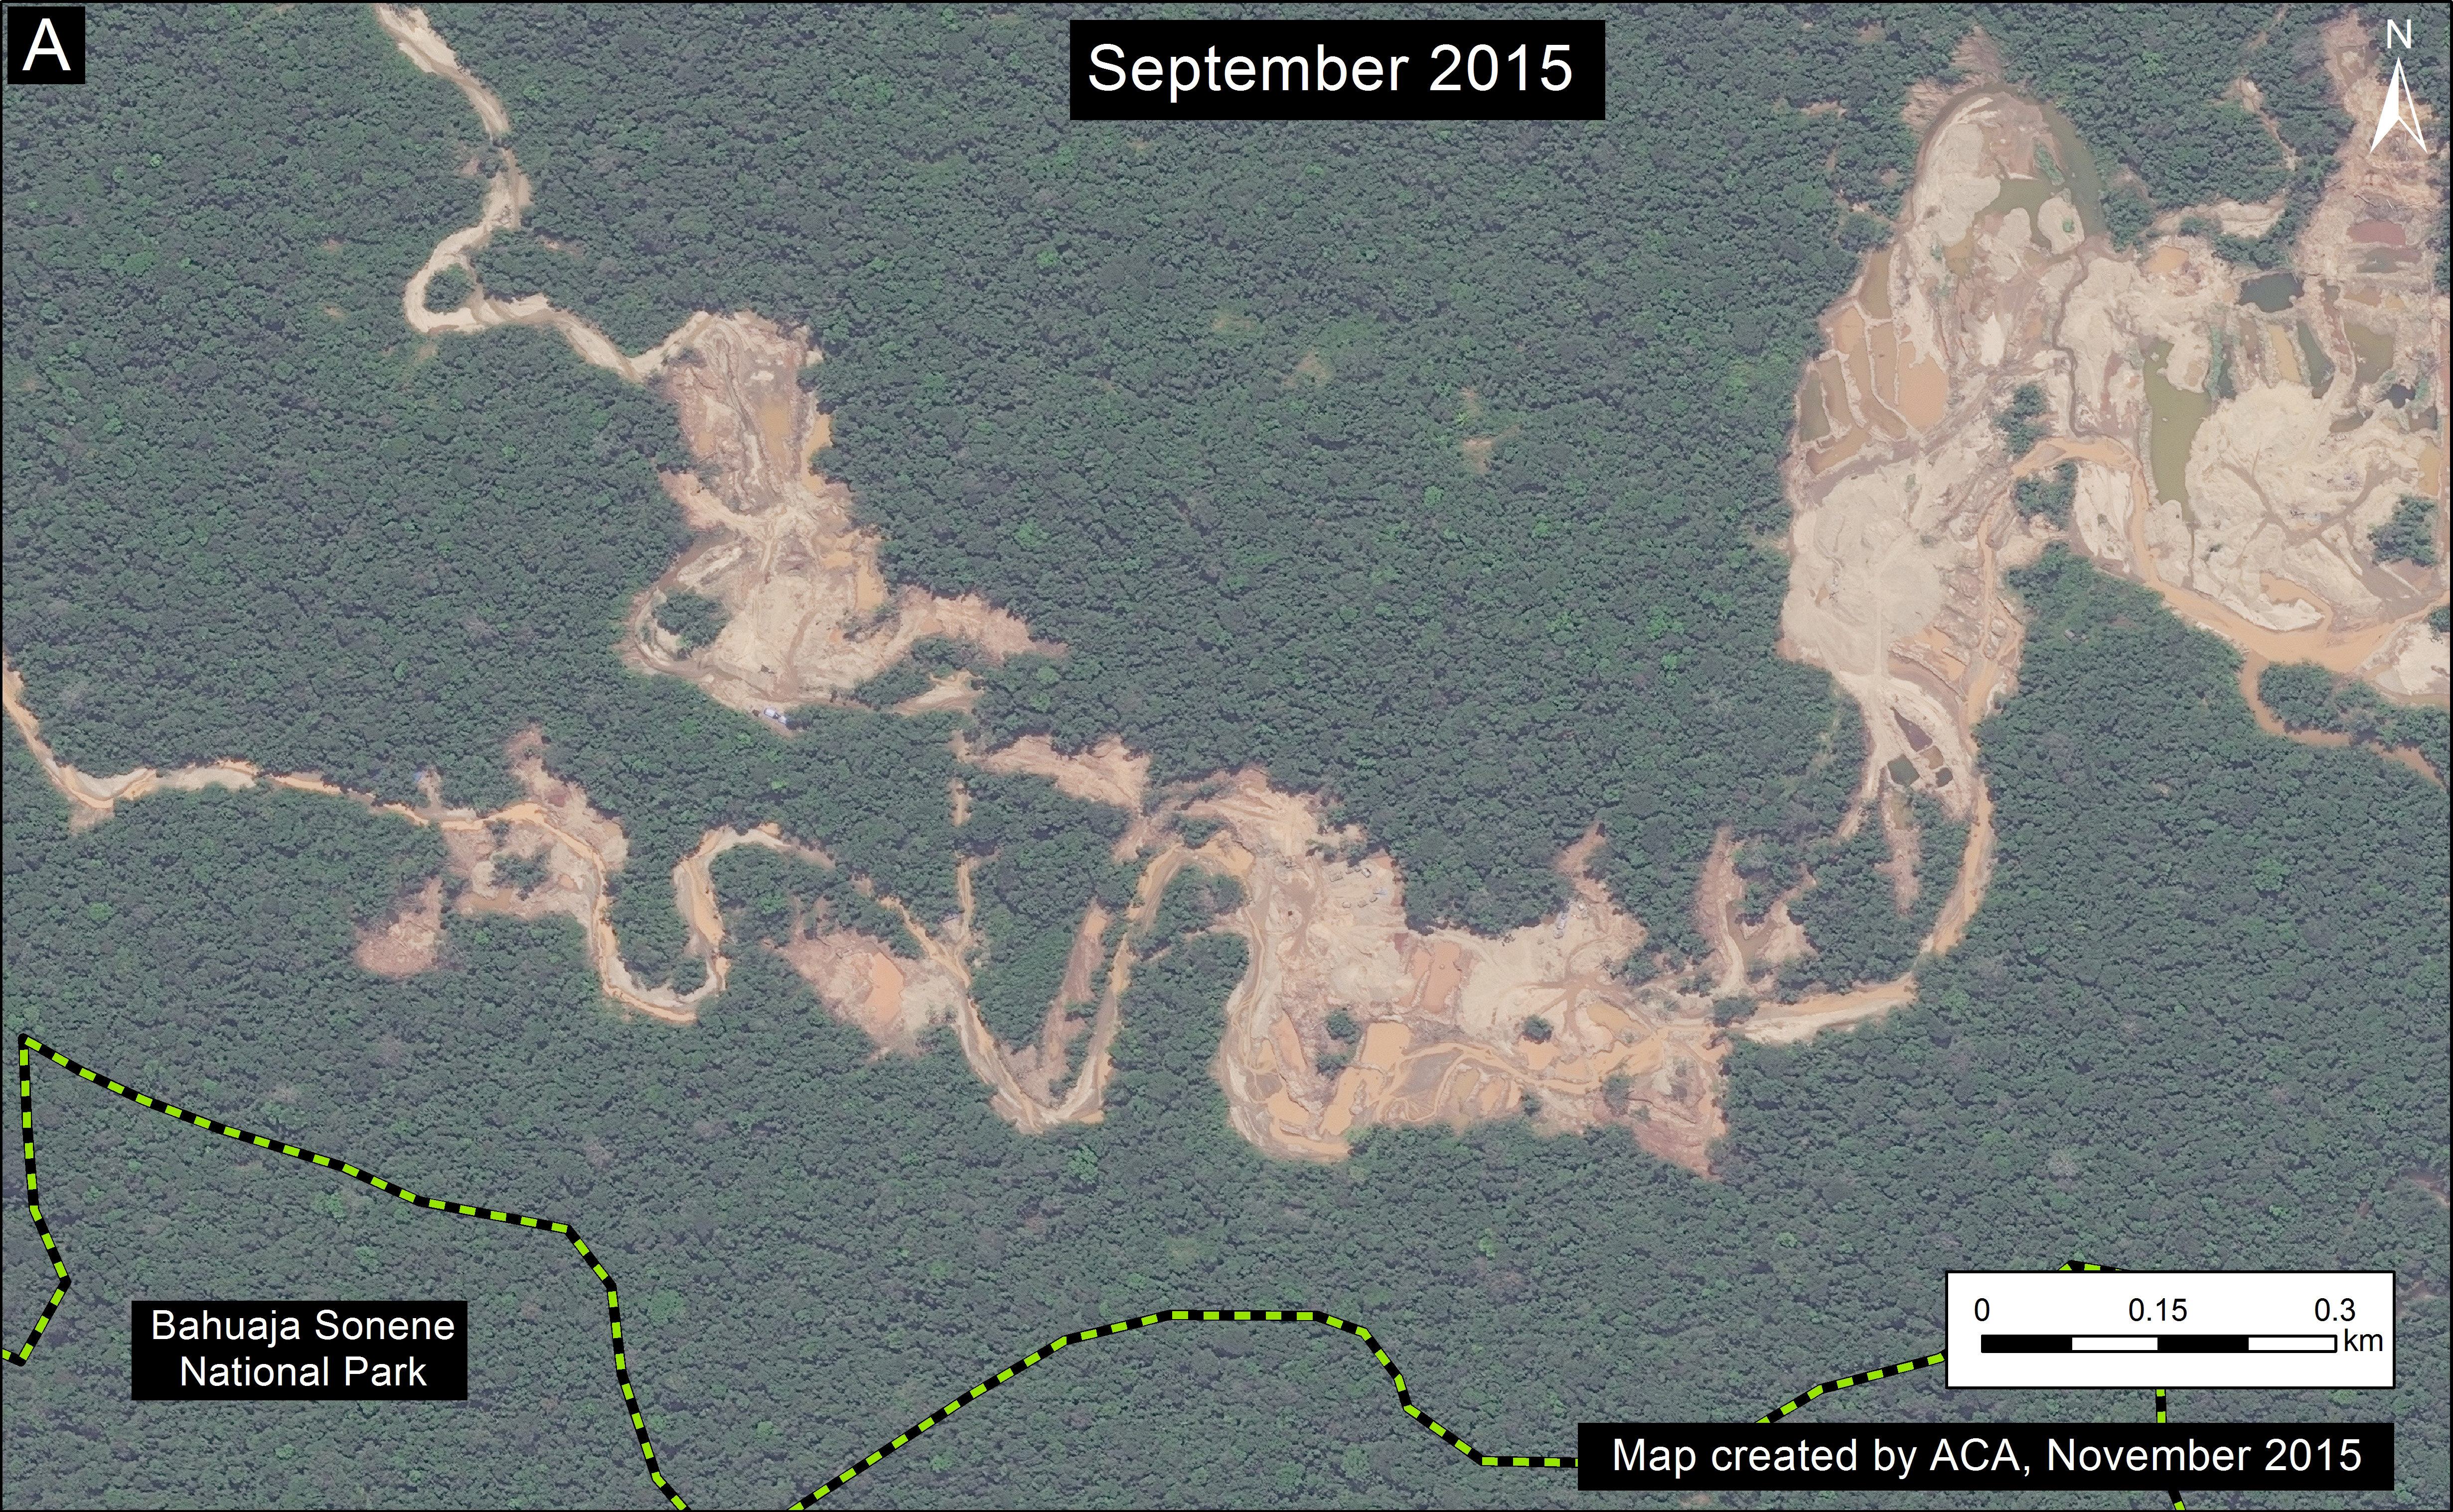
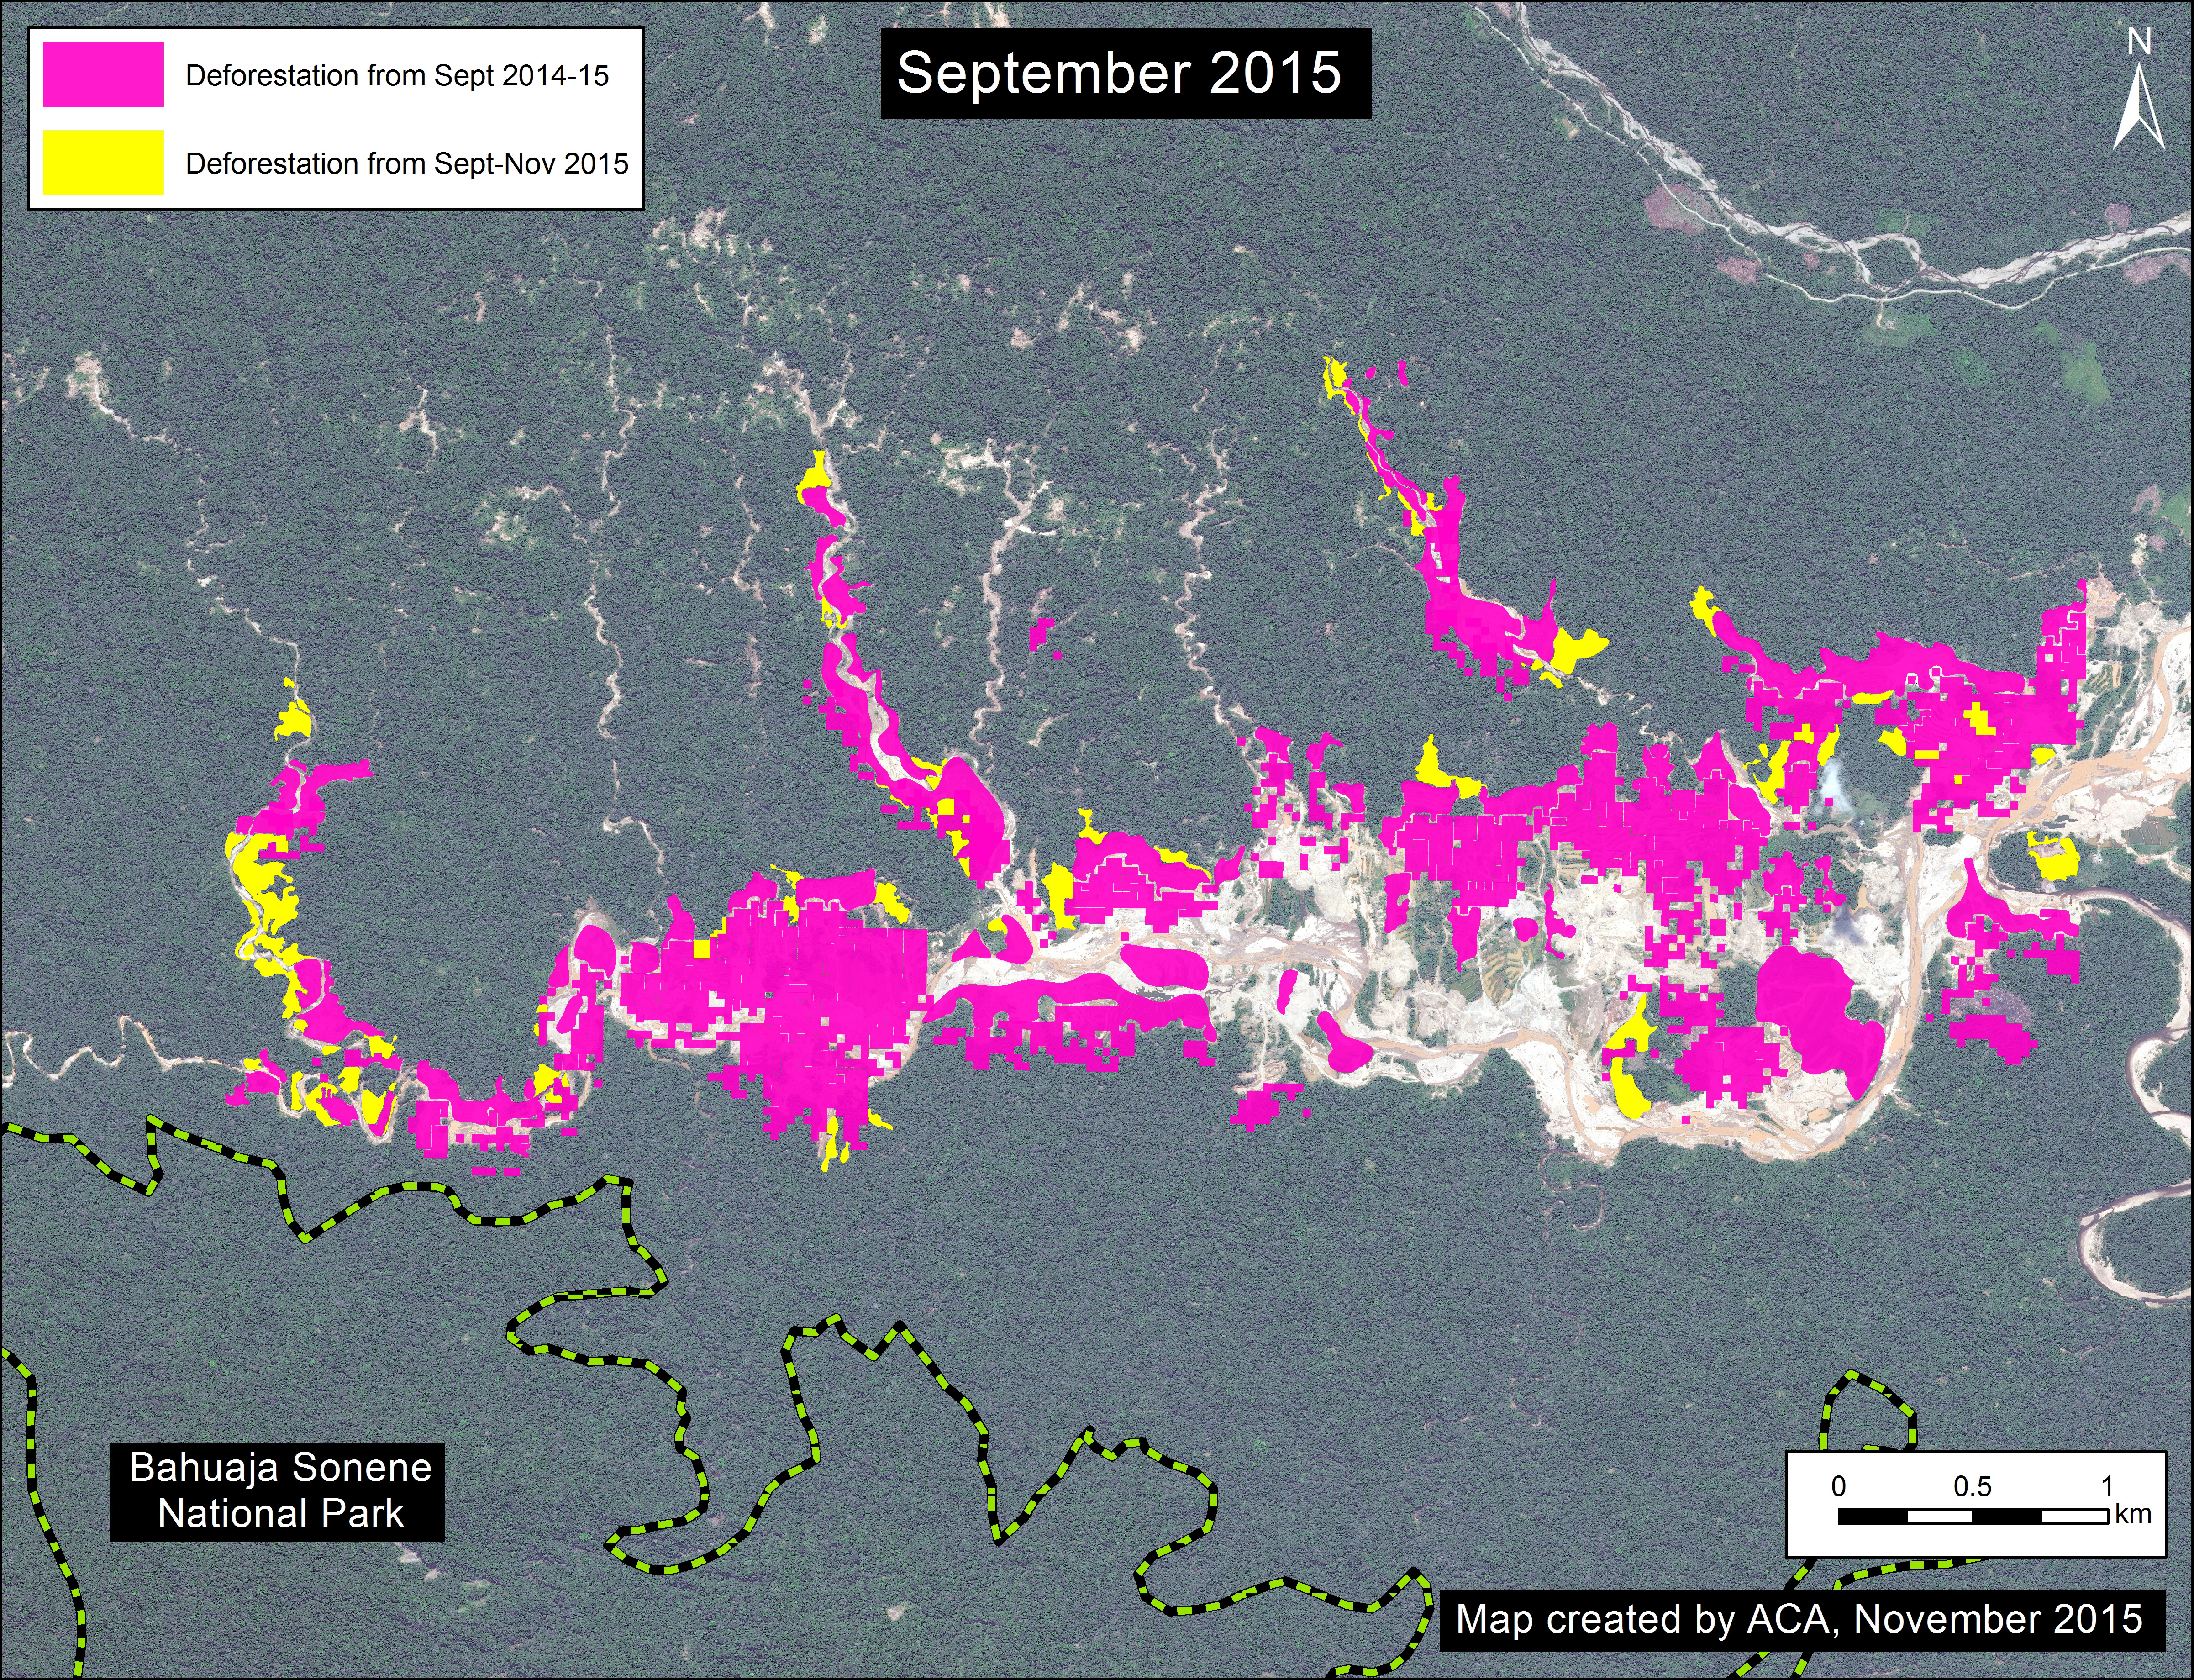
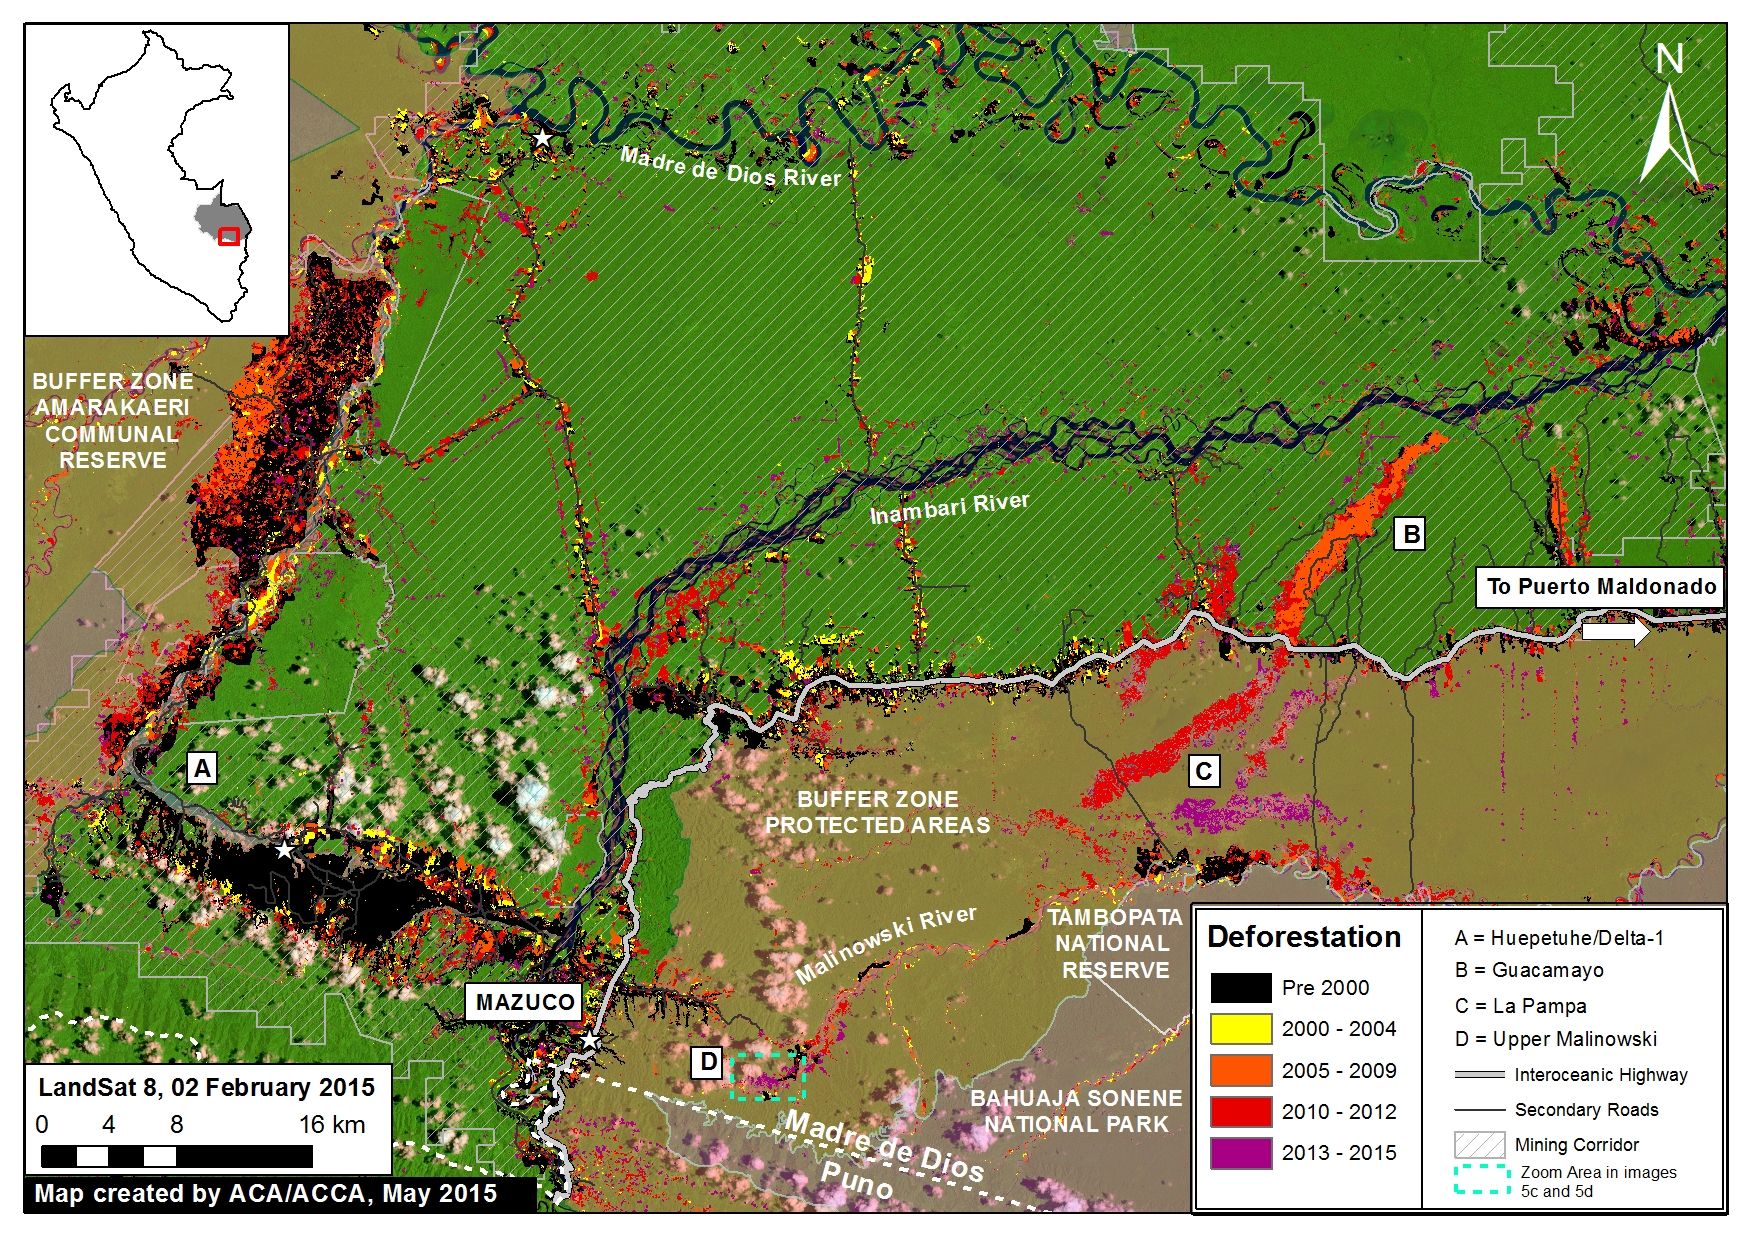
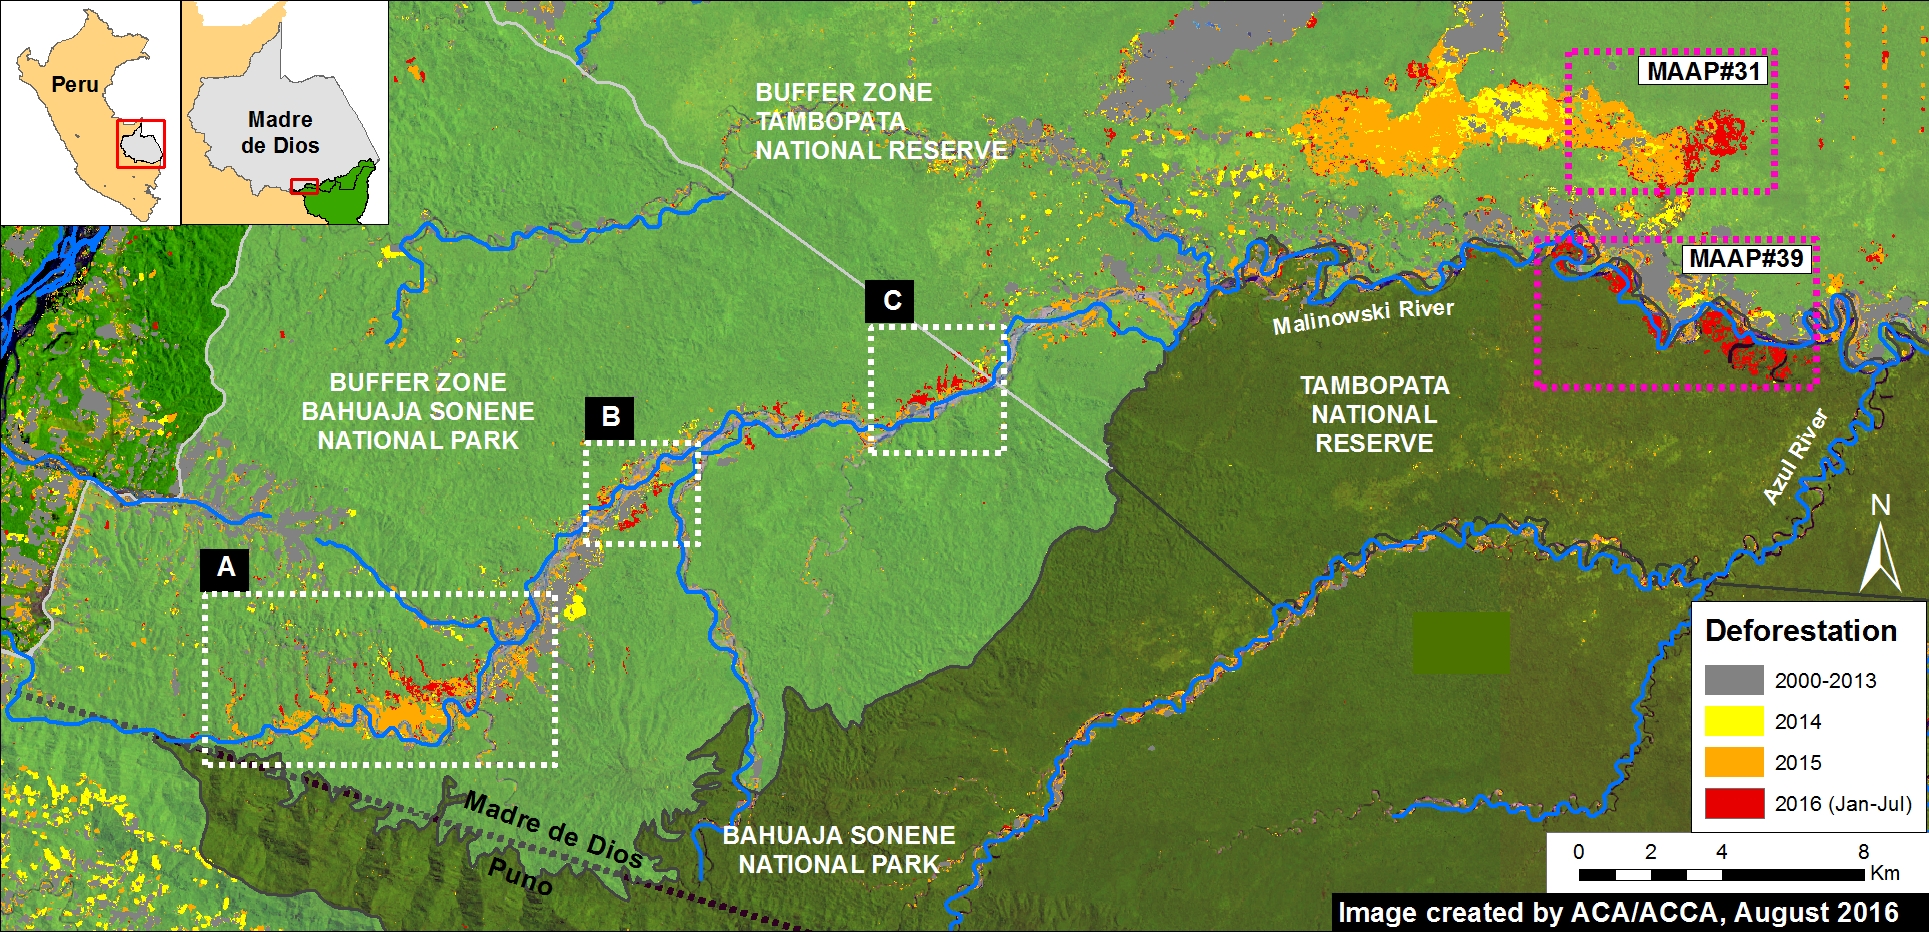
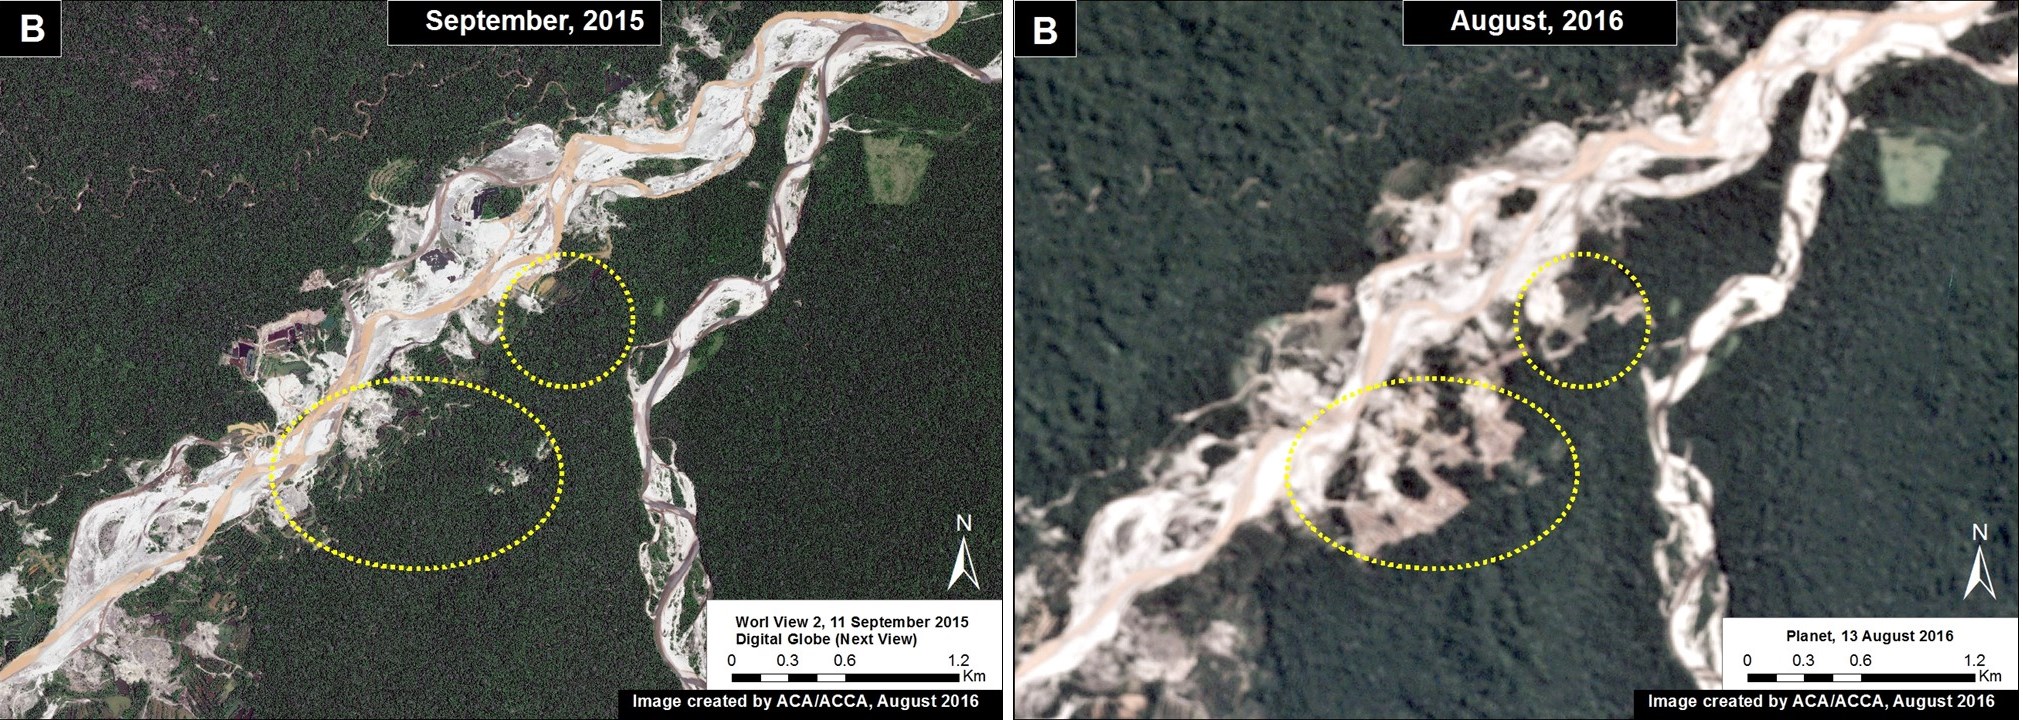
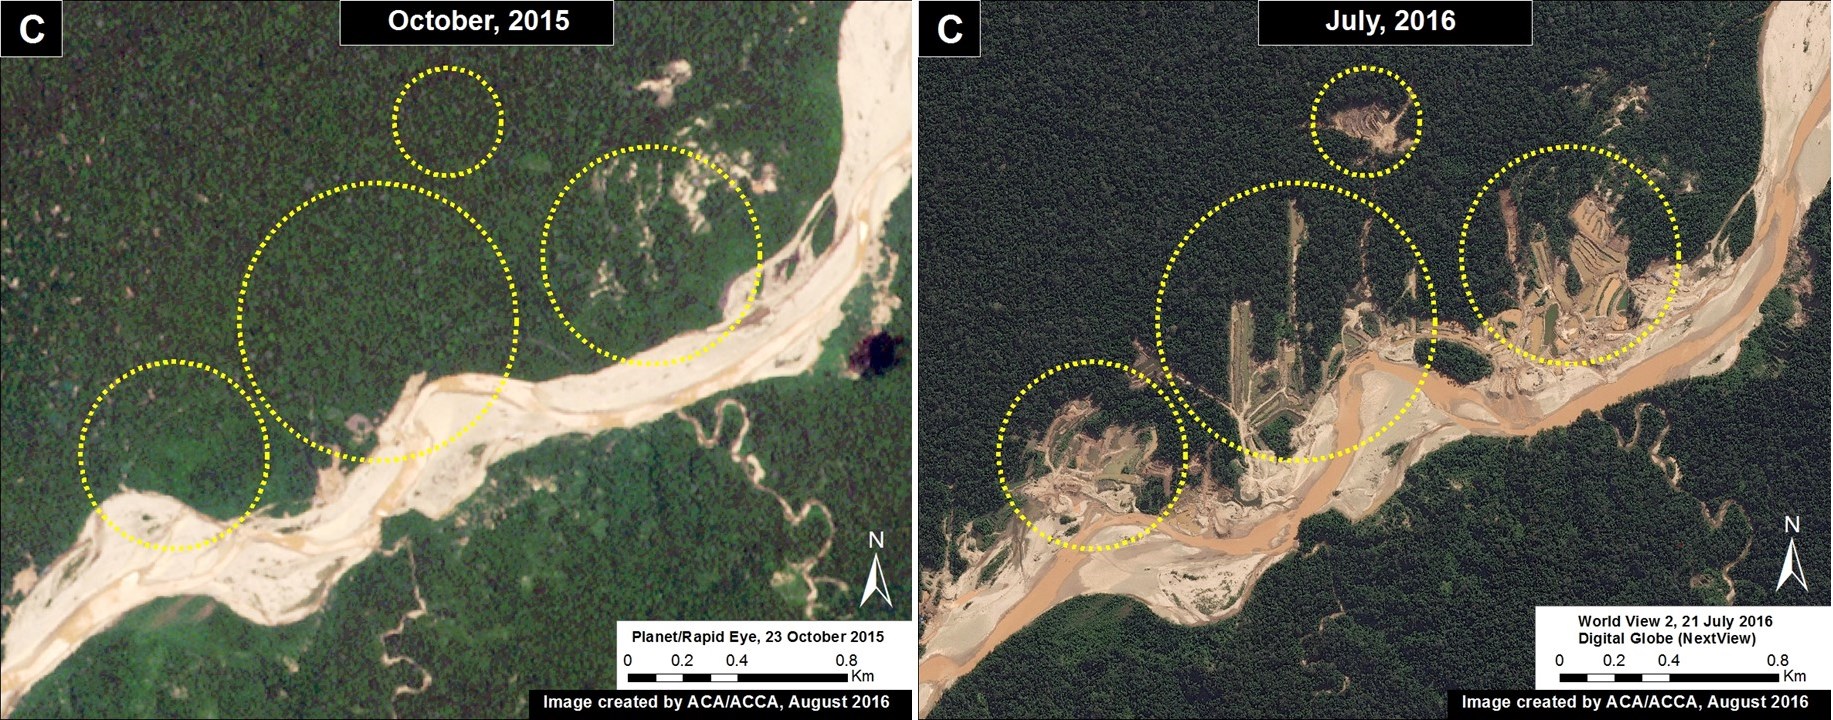
In the previous MAAP #5, we discussed illegal gold mining deforestation along the upper Malinowski River, located in the buffer zone of the Bahuaja Sonene National Park. As seen in Image 43a, the upper Malinowski is just upstream of the areas invaded by illegal gold mining in Tambopata National Reserve and its buffer zone (see MAAP #39 and #31, respectively). In MAAP #5, we documented the deforestation of more than 850 hectares between 2013 and 2015 along the upper Malinowski. Here, we show that gold mining deforestation continues in 2016, with an additional loss of 238 hectares (806 acres). Insets A-C correspond to the areas featured in the high-resolution zooms below.
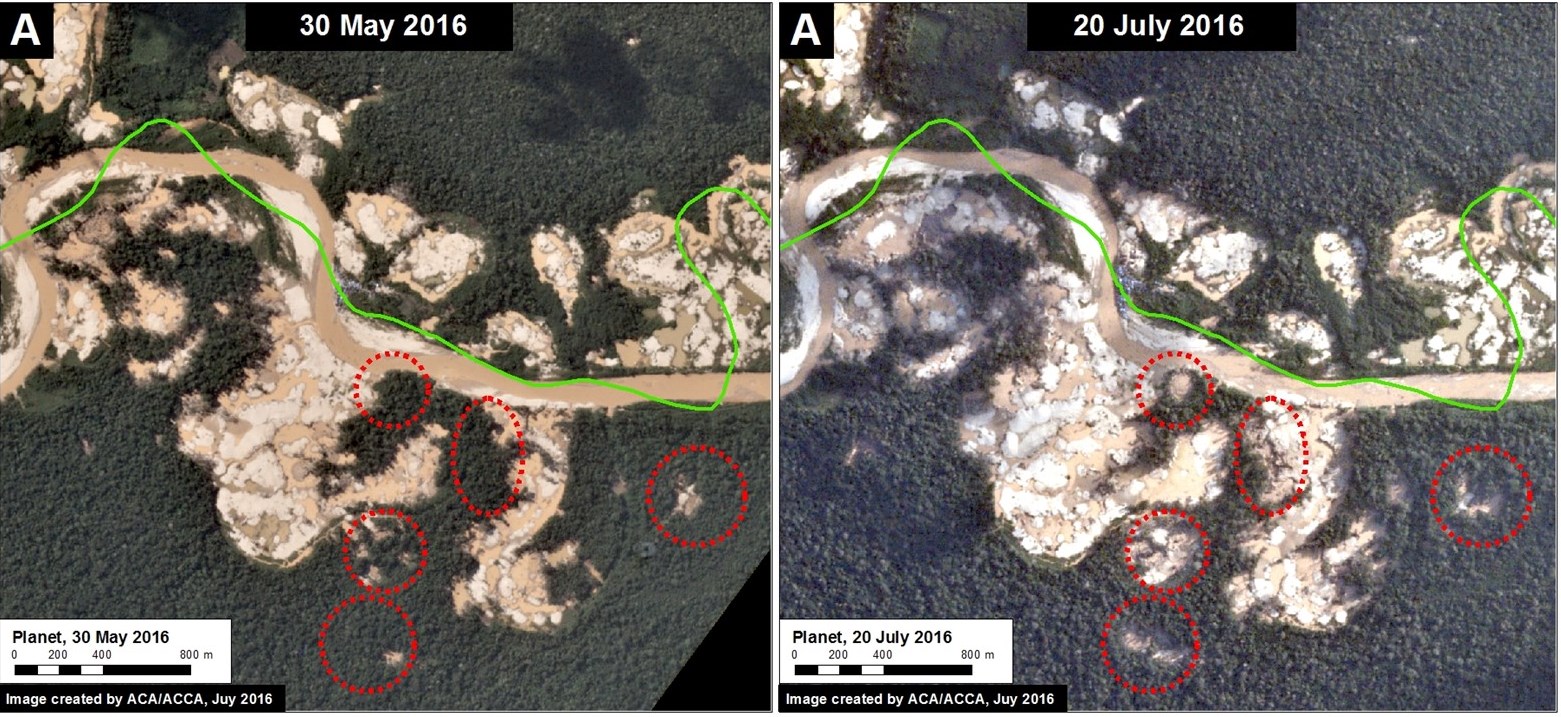
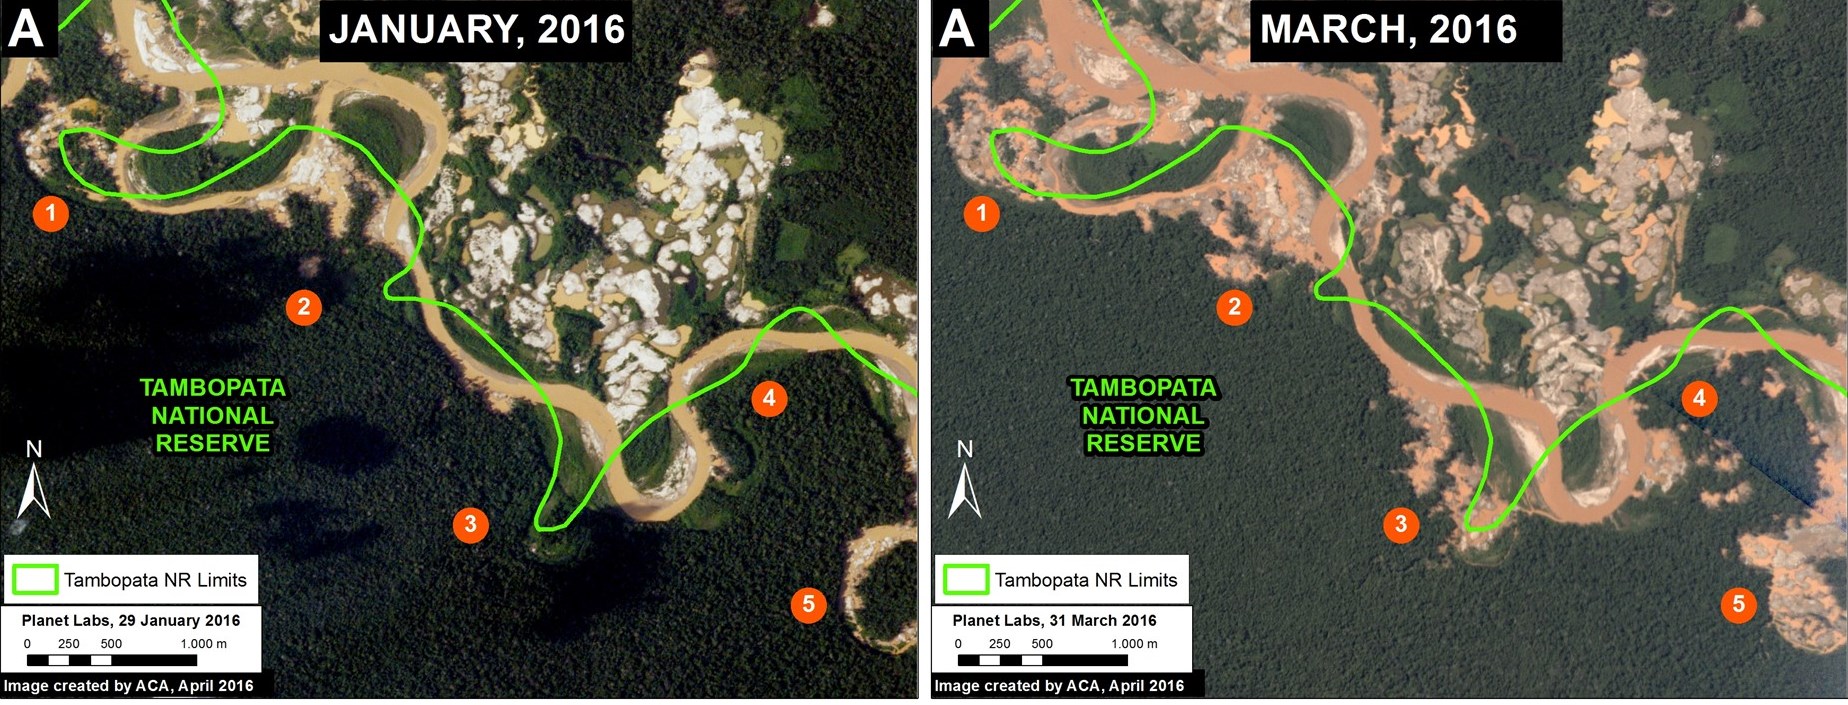
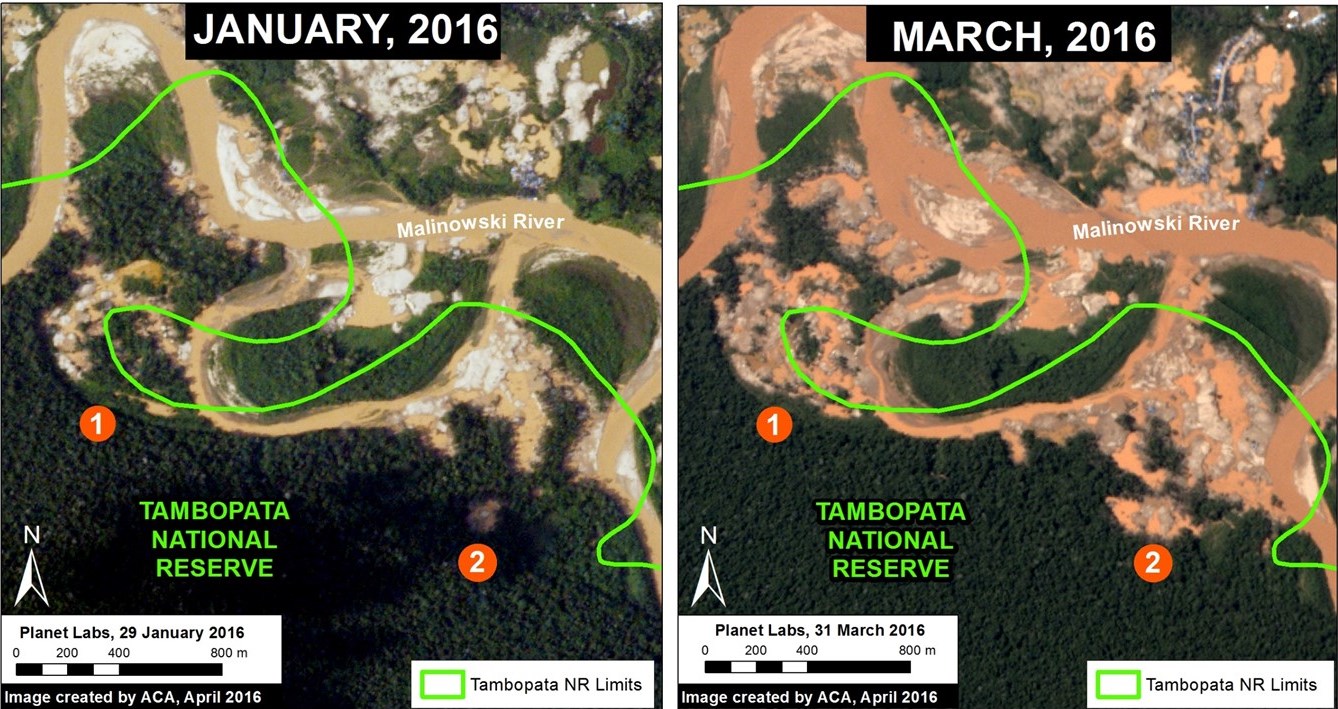
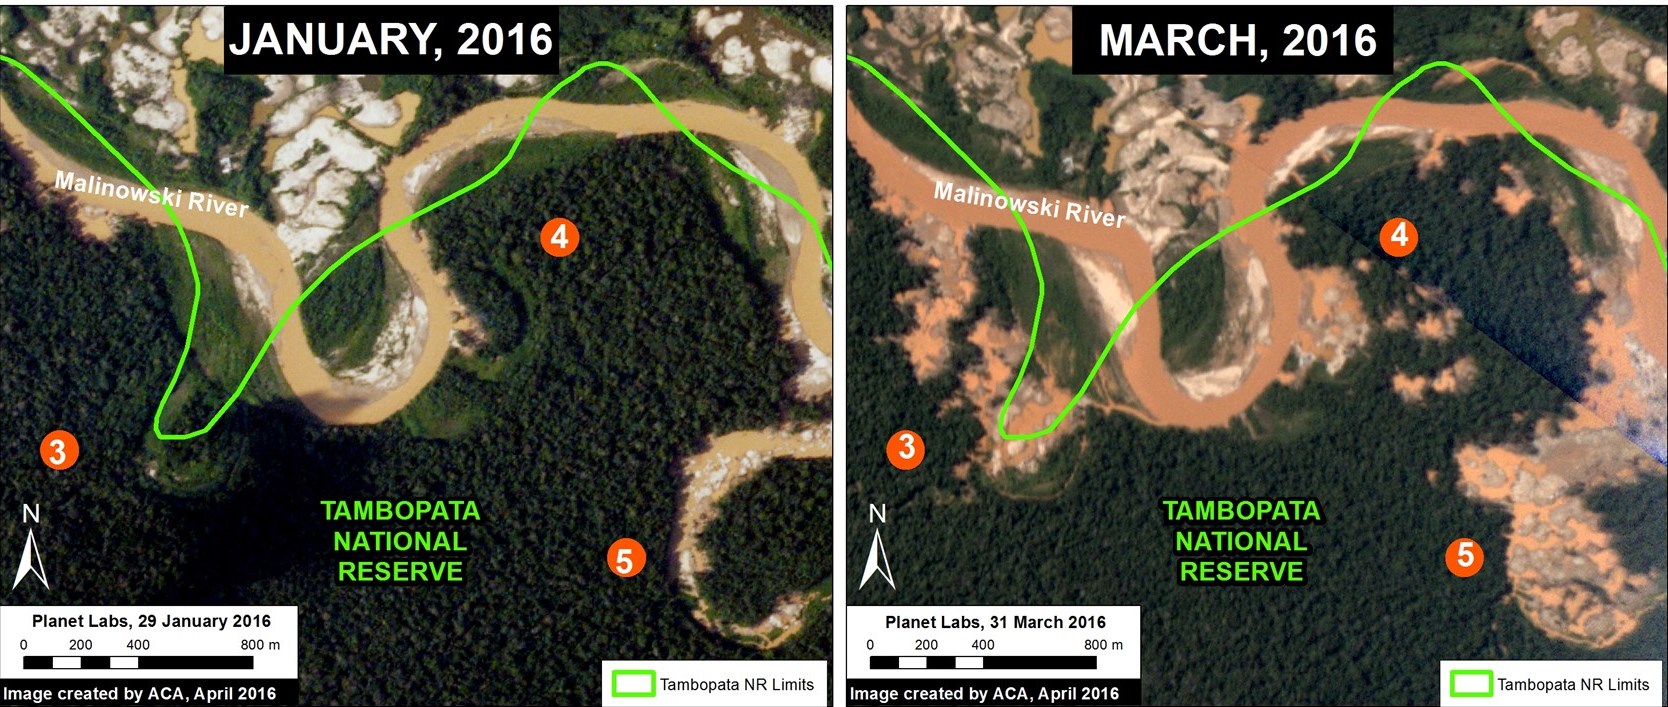
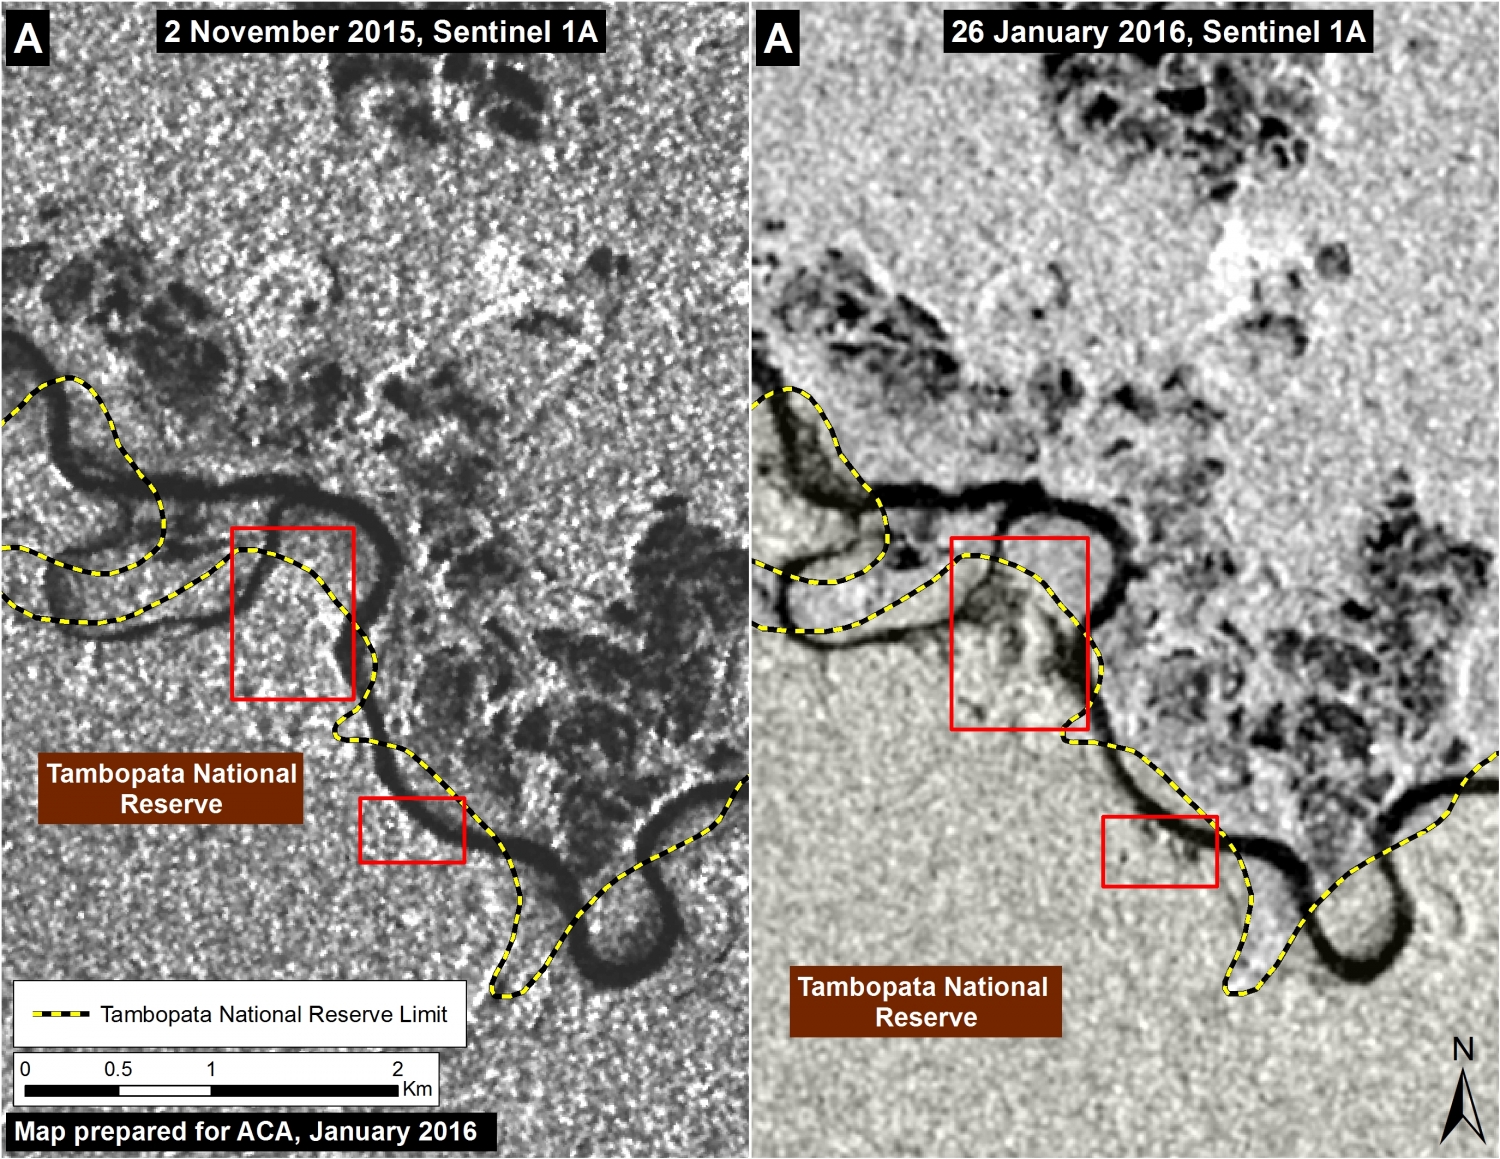
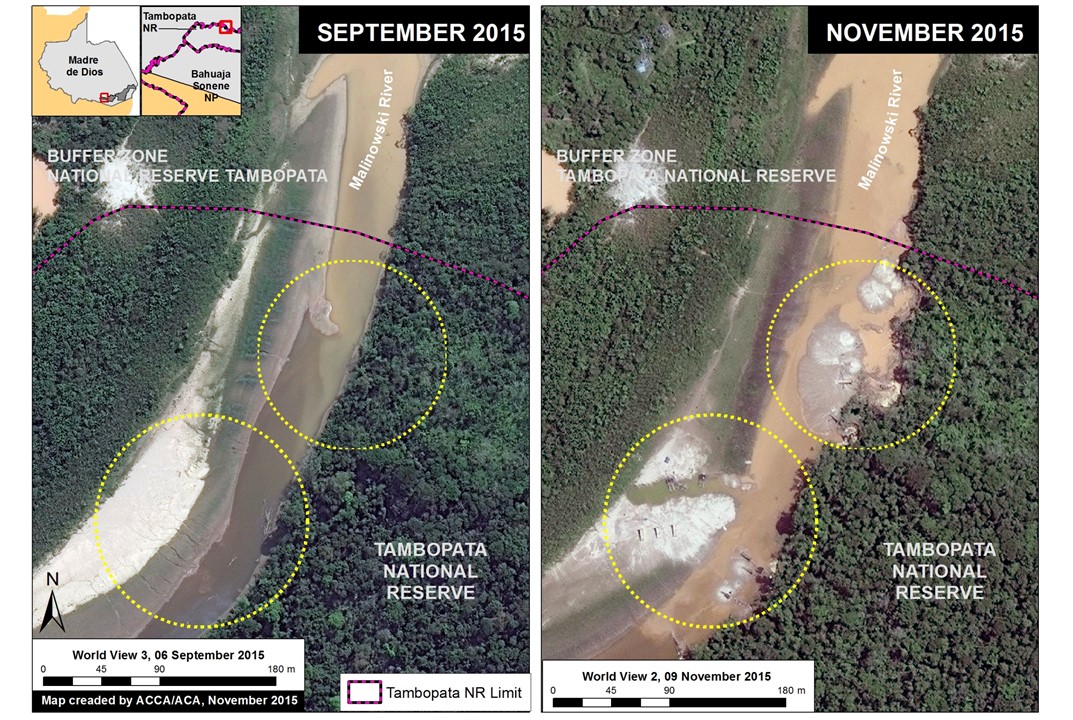
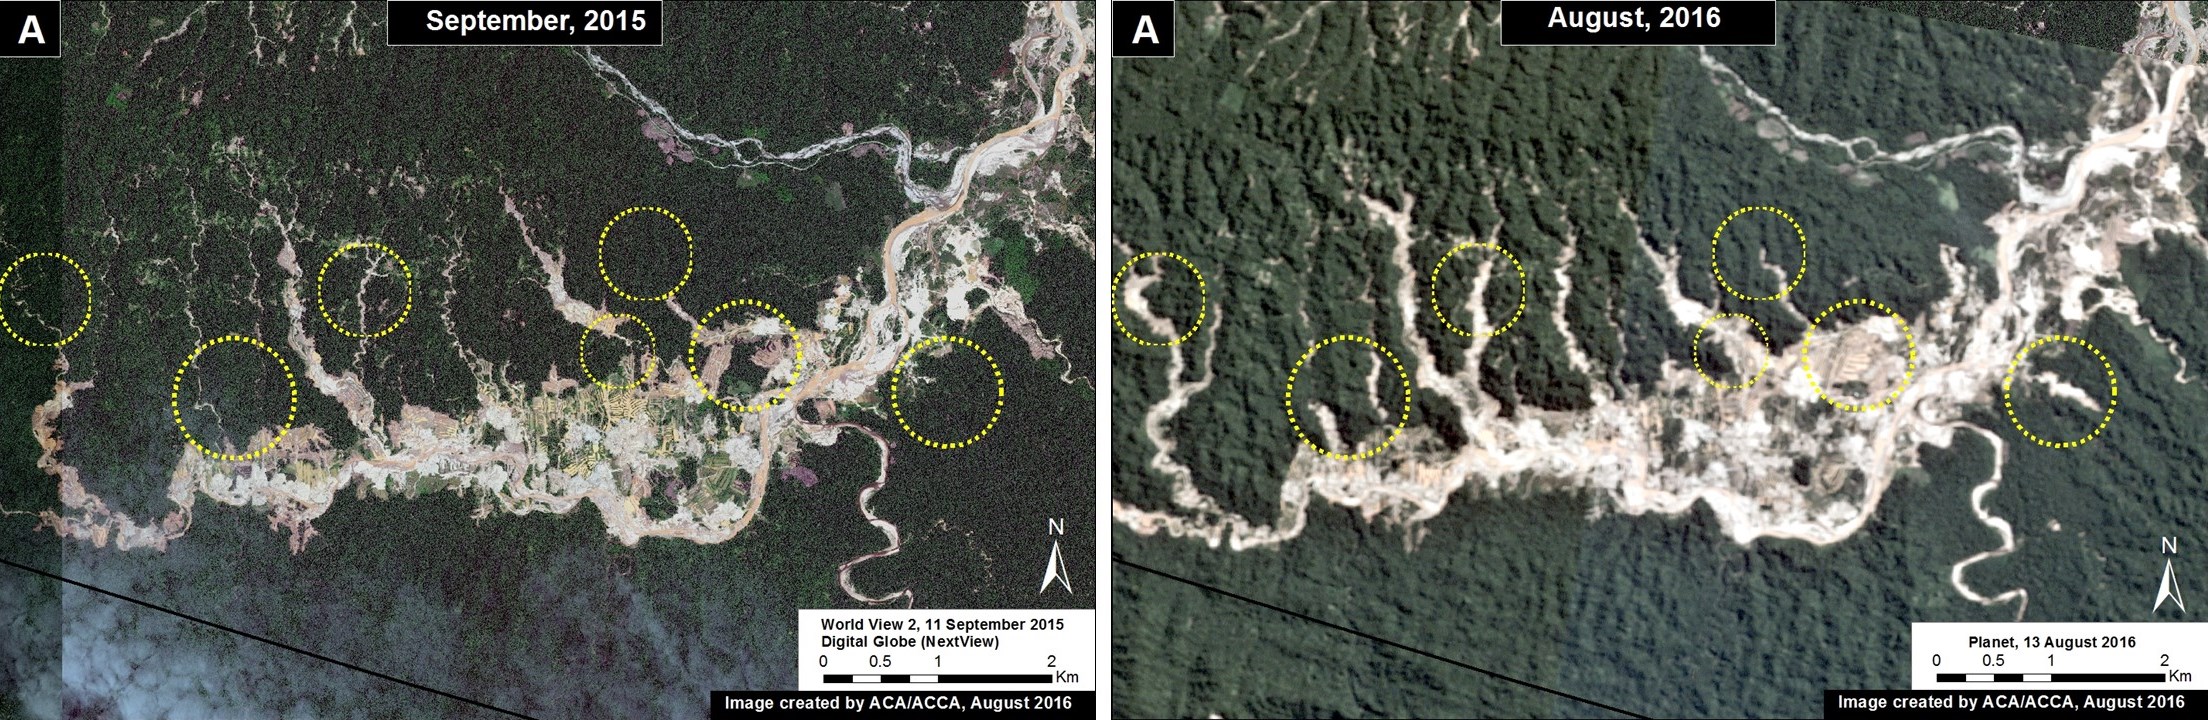
The following Images 43b-d show, in high-resolution, the rapid expansion of gold mining deforestation between August/September 2015 (left panel) and July/August 2016 (right panel). The yellow circles indicate the main areas of deforestation between the images.
Example 2: Logging Road in buffer zone of Cordillera Azul National Park (Ucayali/Loreto)
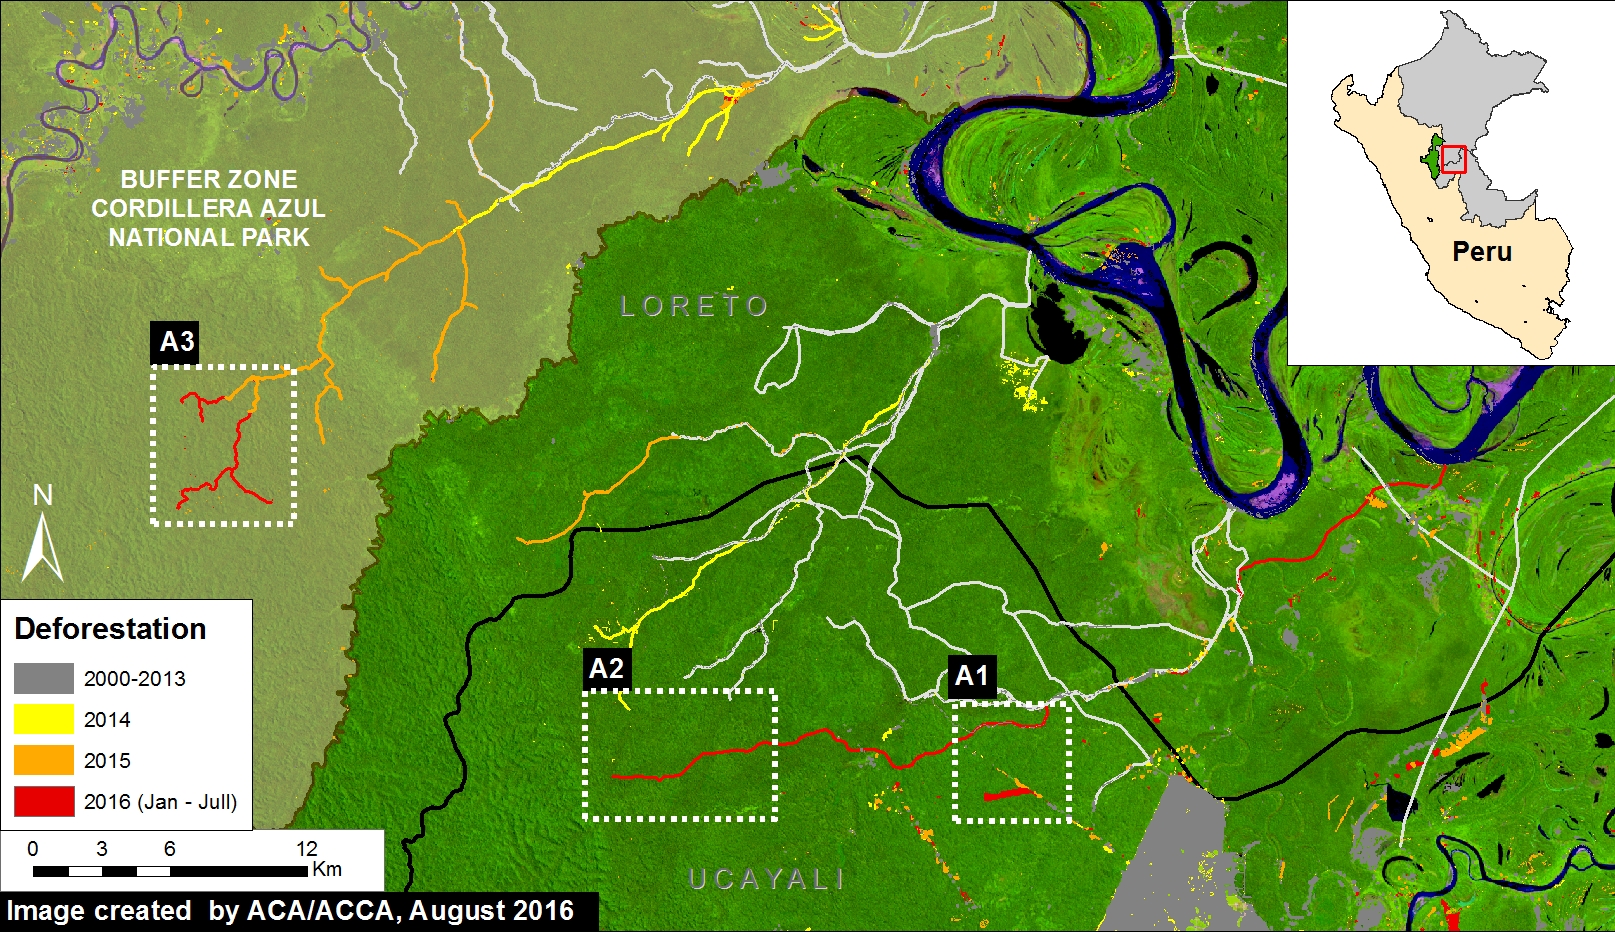
In the previous MAAP #18, we discussed the proliferation of logging roads in the central Peruvian Amazon in 2015. Here, we show the expansion of two of these logging roads in 2016. (see Image 43e). Red indicates construction during 2016 (47 km). Insets A1-A3 correspond to the areas featured in the high-resolution zooms below. Note that the northern road (Inset A3) is within the buffer zone of Cordillera Azul National Park. Evidence suggests that this road is not legal because it extends out of the permited area (see MAAP #18 for more details).
The following images show, in high-resolution, the rapid construction of these logging roads. Image 43f shows the construction of part of the southern road (Inset A1), and the deforestation for a nearby agricultural parcel, between April (left panel) and July (right panel) 2016. Image 43g shows the construction of 1.8 km in just three days along this same road (Inset A2) between July 21 (left panel) and July 24 (right panel) 2016.
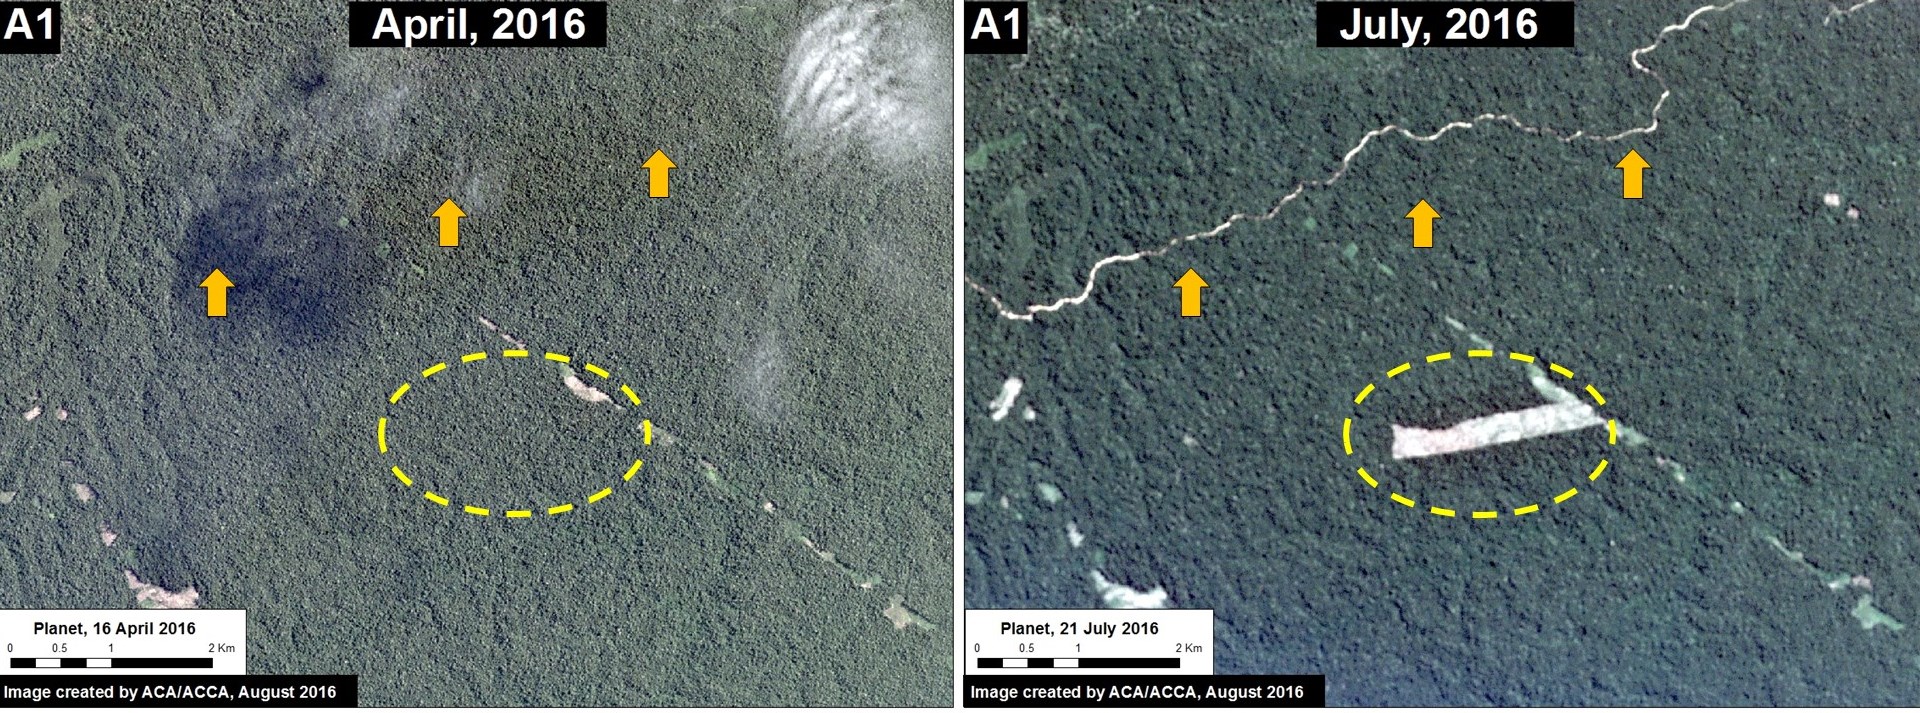
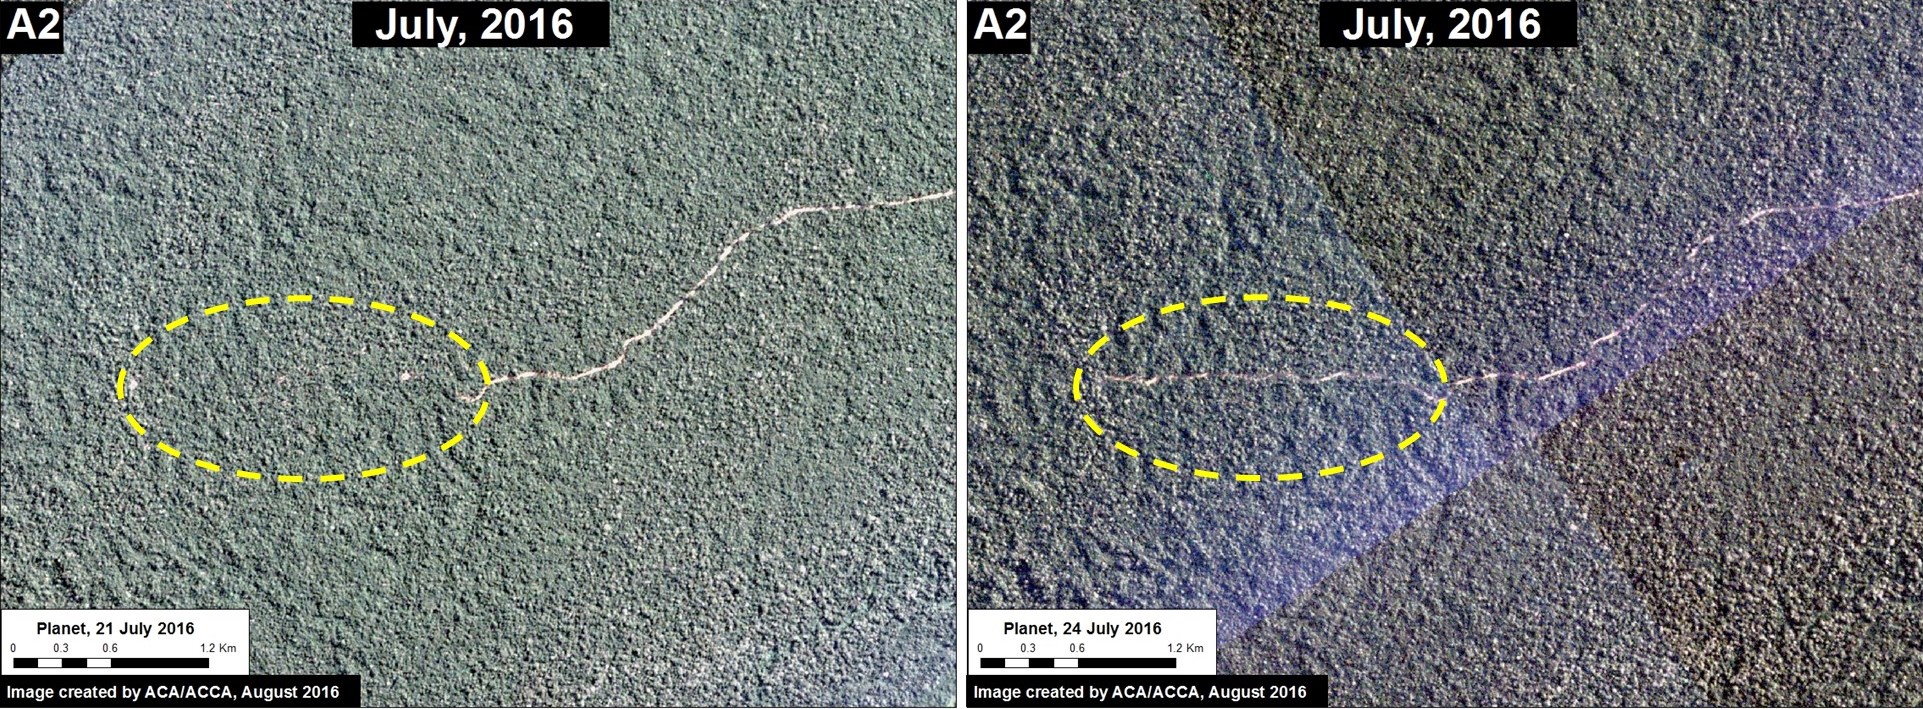
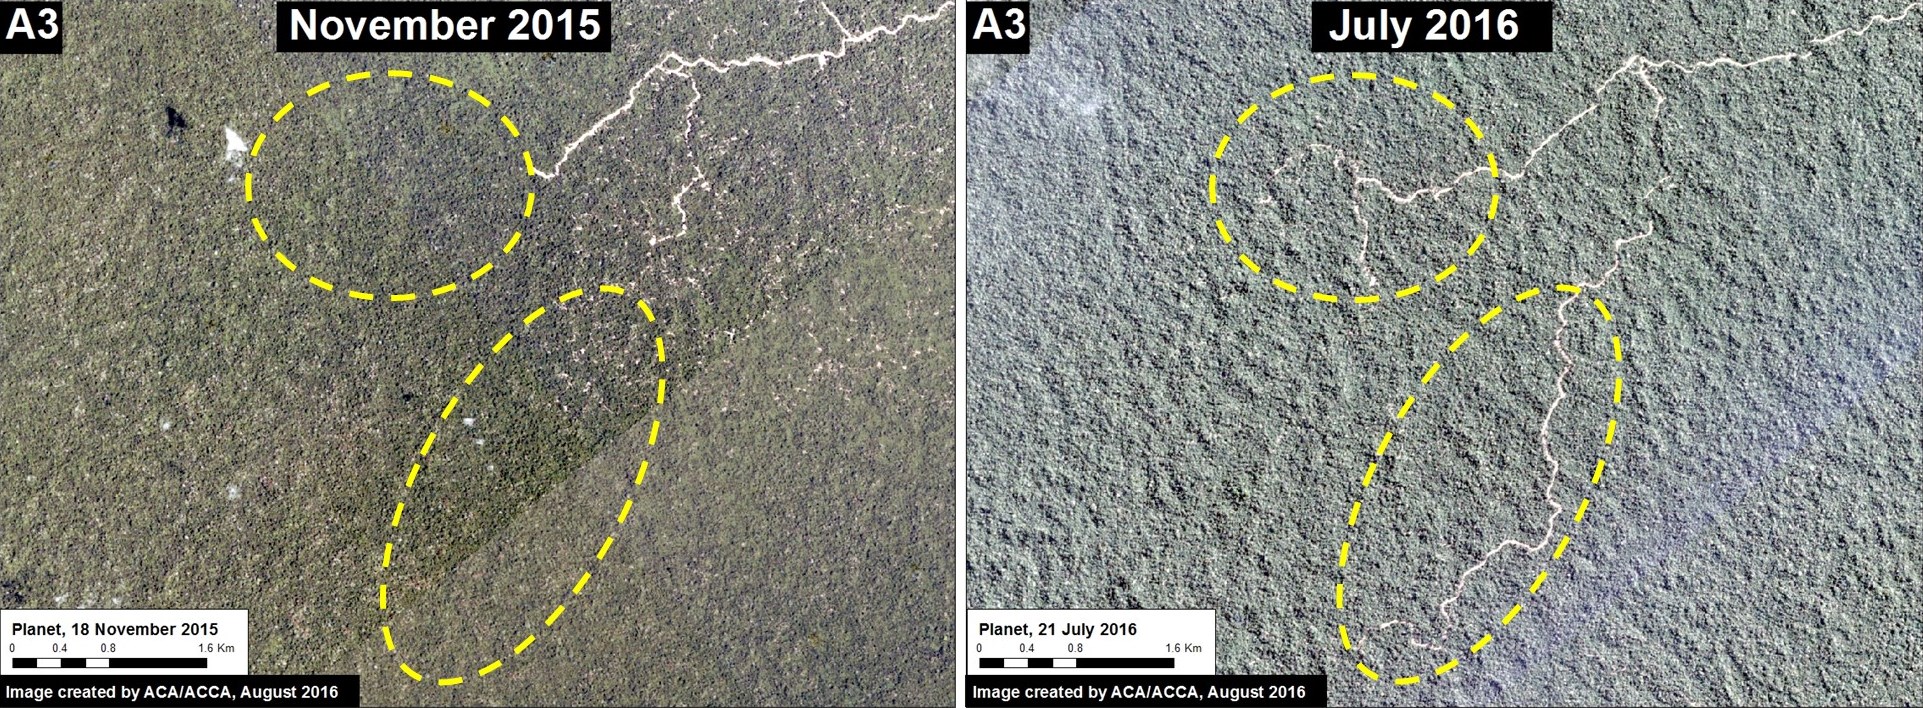
Image 43h shows the construction of 13 km on the northern road between November 2015 (left panel) and July 2016 (right panel) within the buffer zone of the Cordillera Azul National Park.
Example 3: Deforestation in Permanent Production Forest (Ucayali)
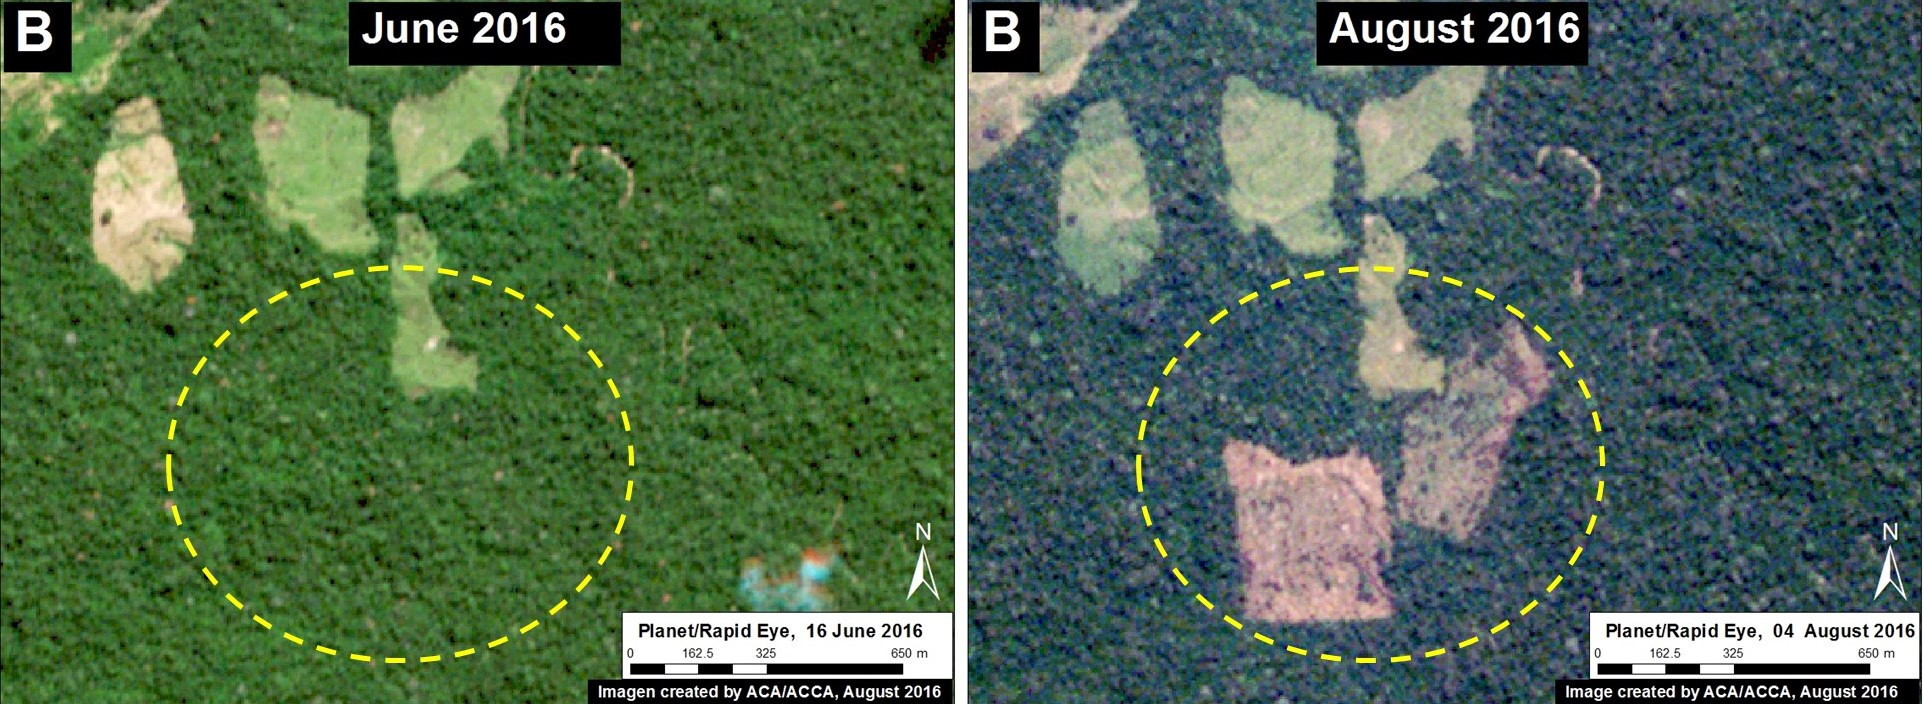
Image 43i shows recent deforestation of 136 hectares (336 acres) in 2016 in southern Ucayali region within areas classified as Permanent Production Forest and Foresty Concession. These types of areas are generally zoned for sustainable forestry uses, not clear-cutting, thus we question the legality of the deforestation. Tables A-B correspond to the areas featured in the high-resolution zooms, below.
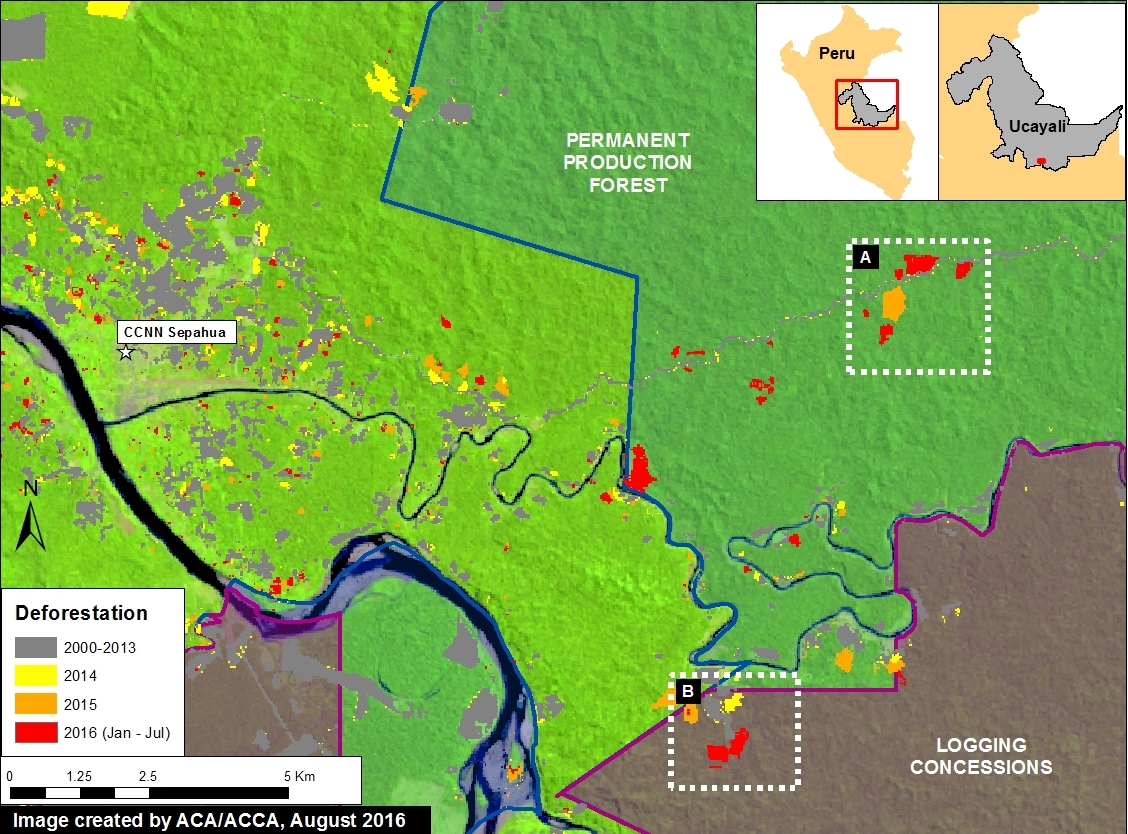
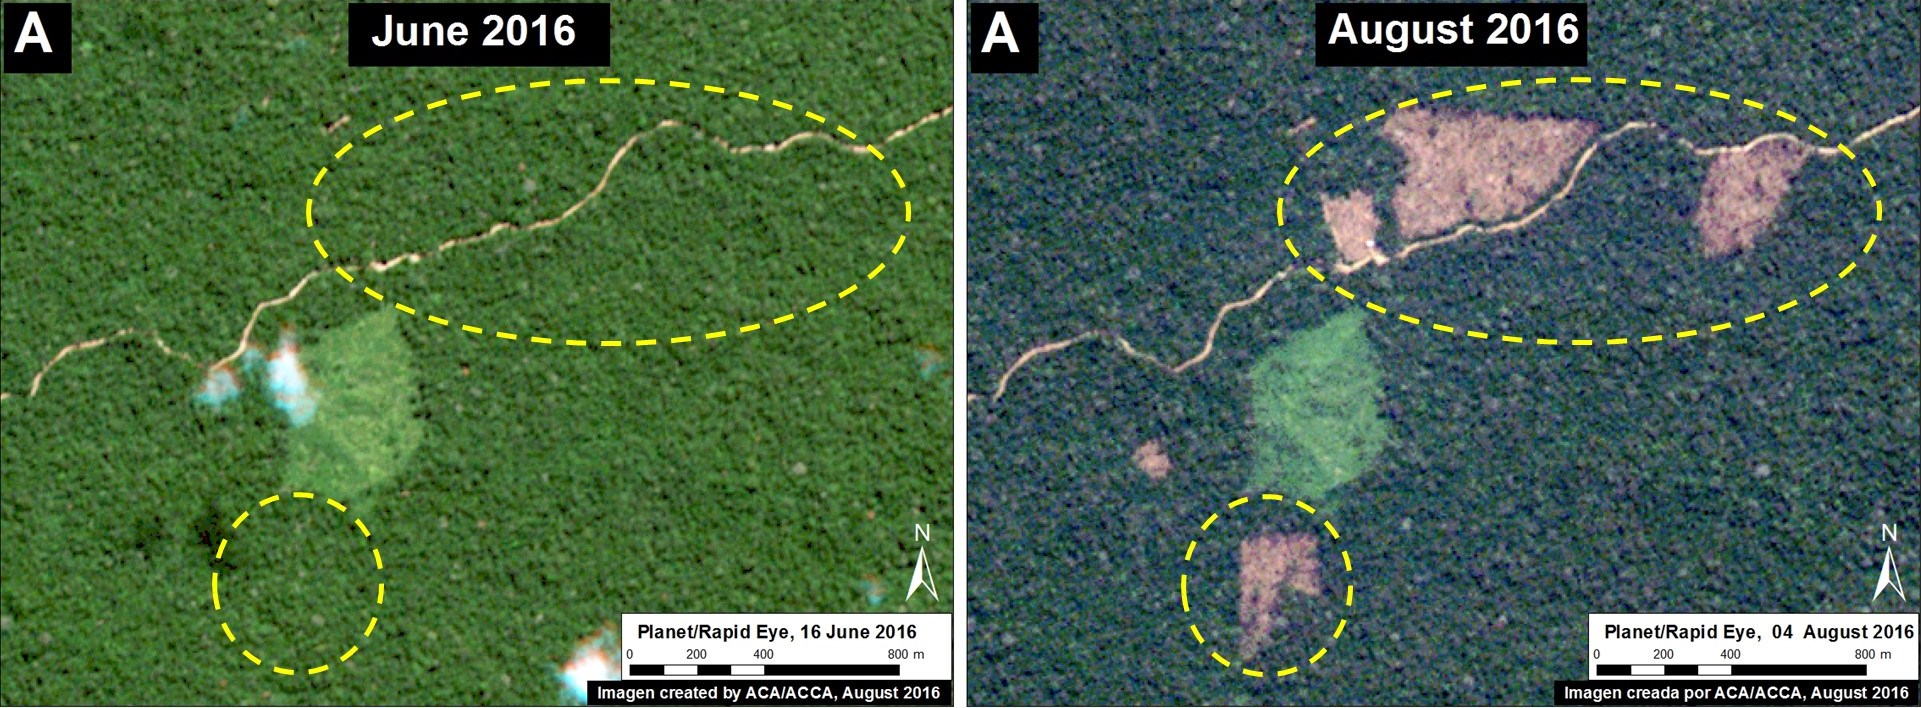
Image 43j shows deforestation within a section of Permanent Production Forest, and Image 43k shows deforestation within a section of Forestry Concession.
Citation
Finer M, Novoa S, Goldthwait E (2016) Early Warning Deforestation Alerts in the Peruvian Amazon, Part 2. MAAP: 43.