Image #6: Expanding Gold Mining Deforestation Enters Amarakaeri Communal Reserve (Madre de Dios, Peru)

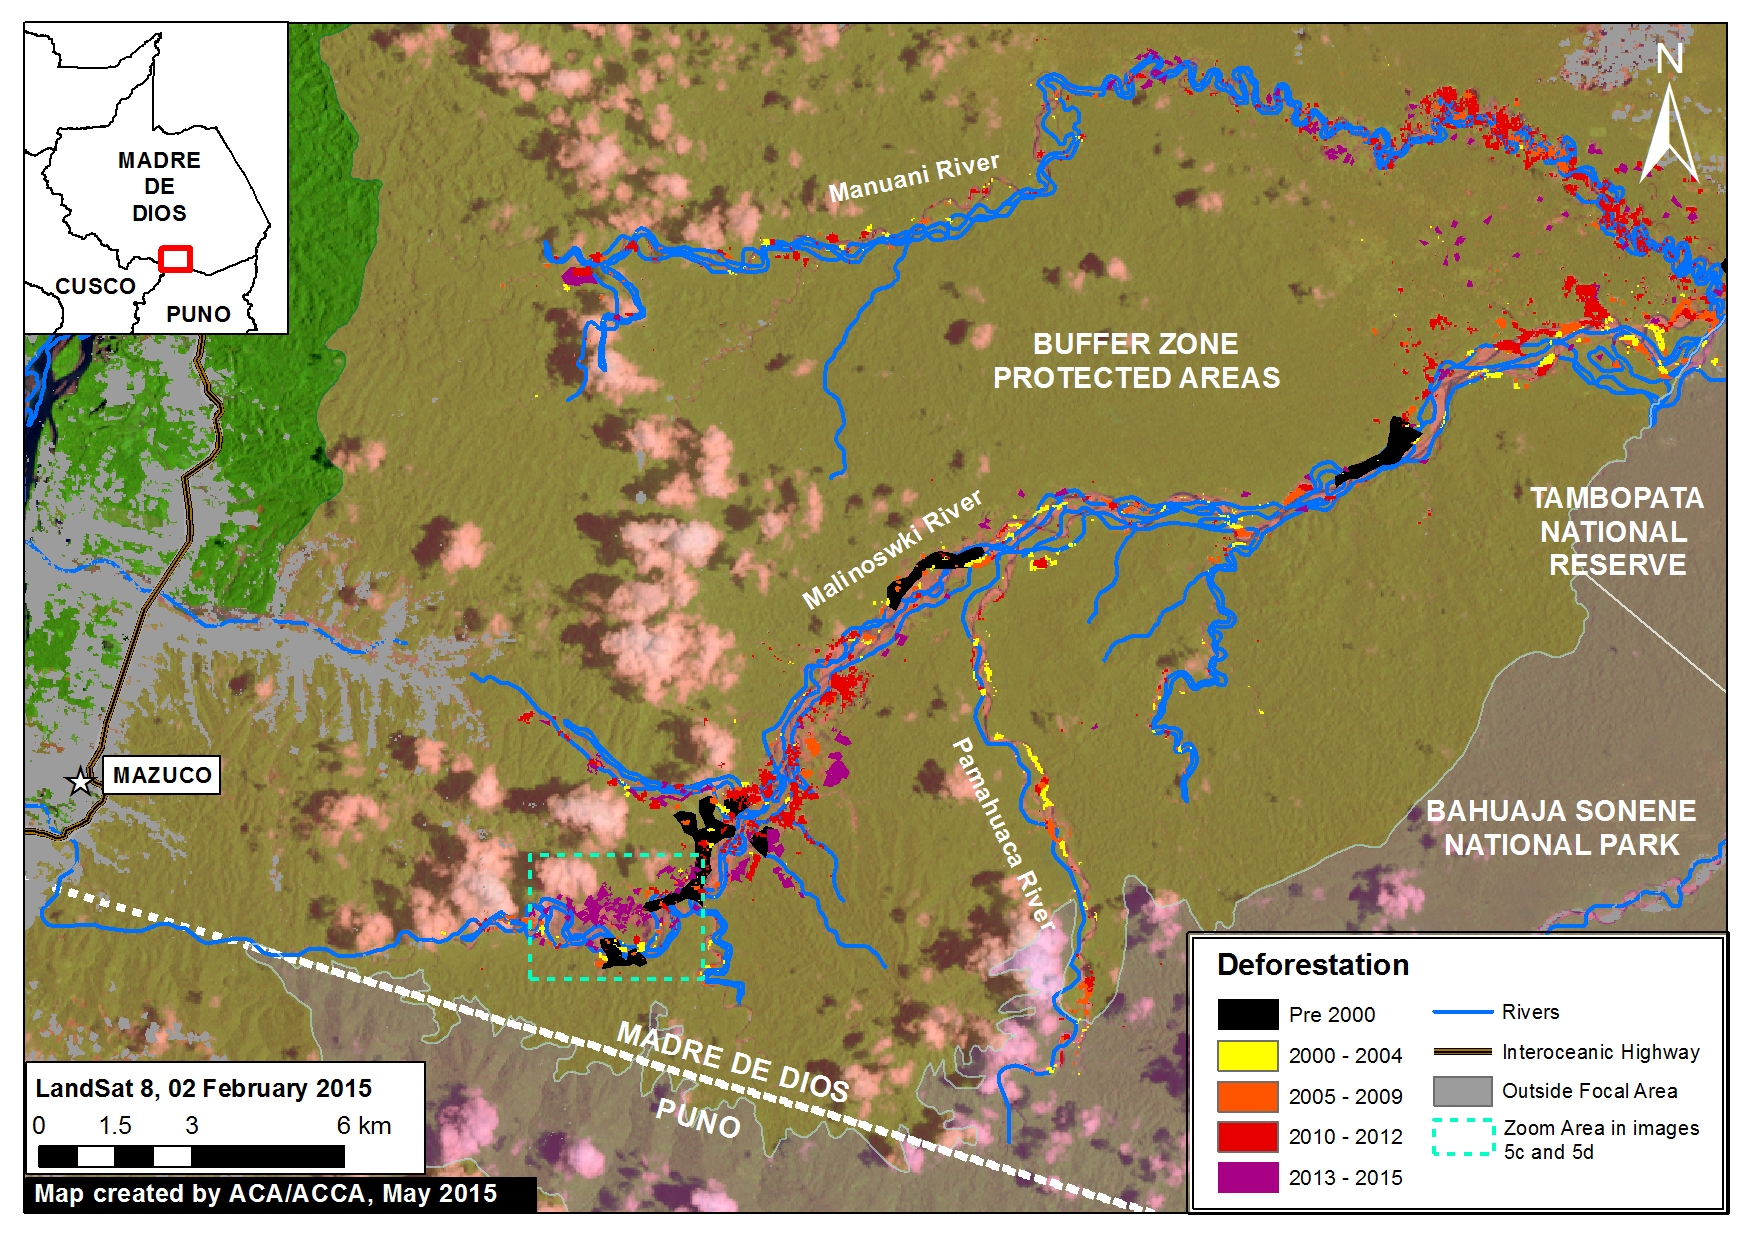
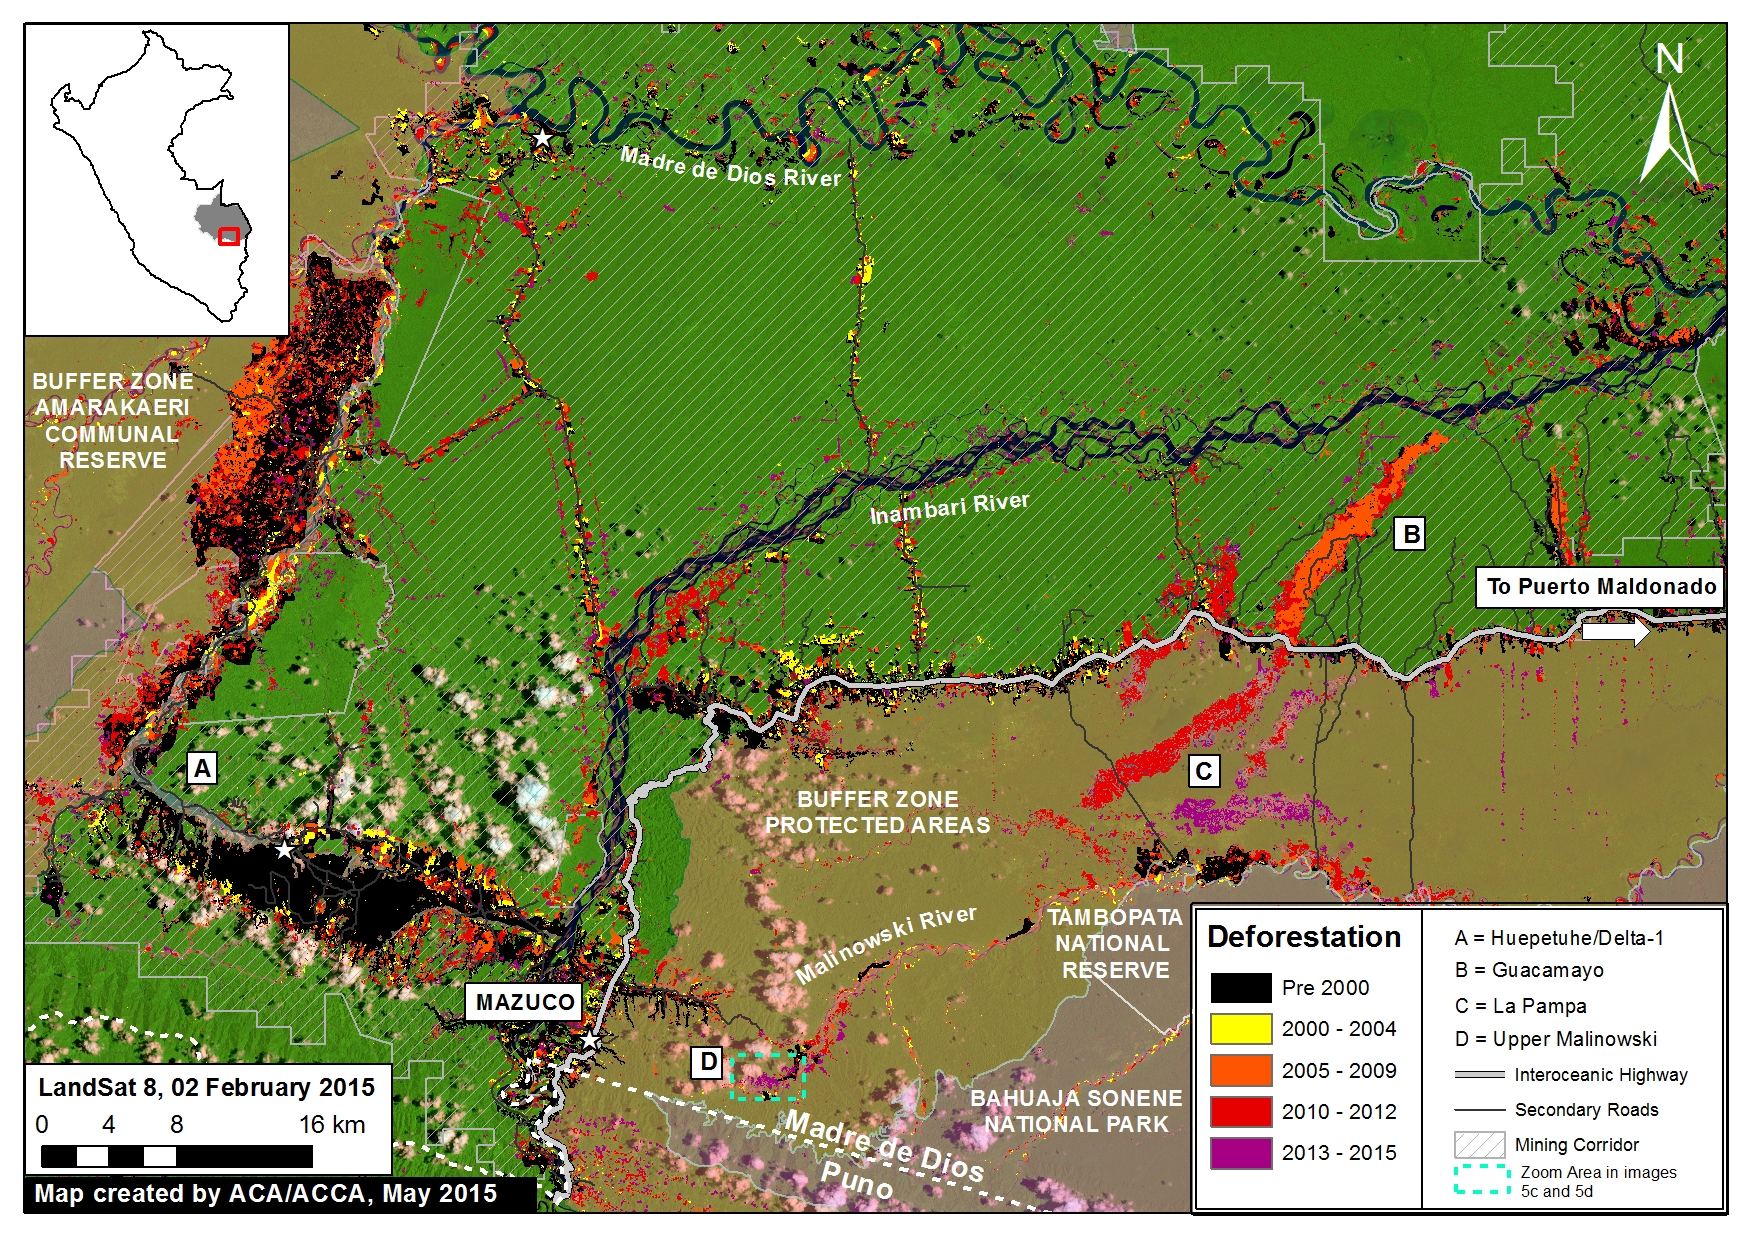
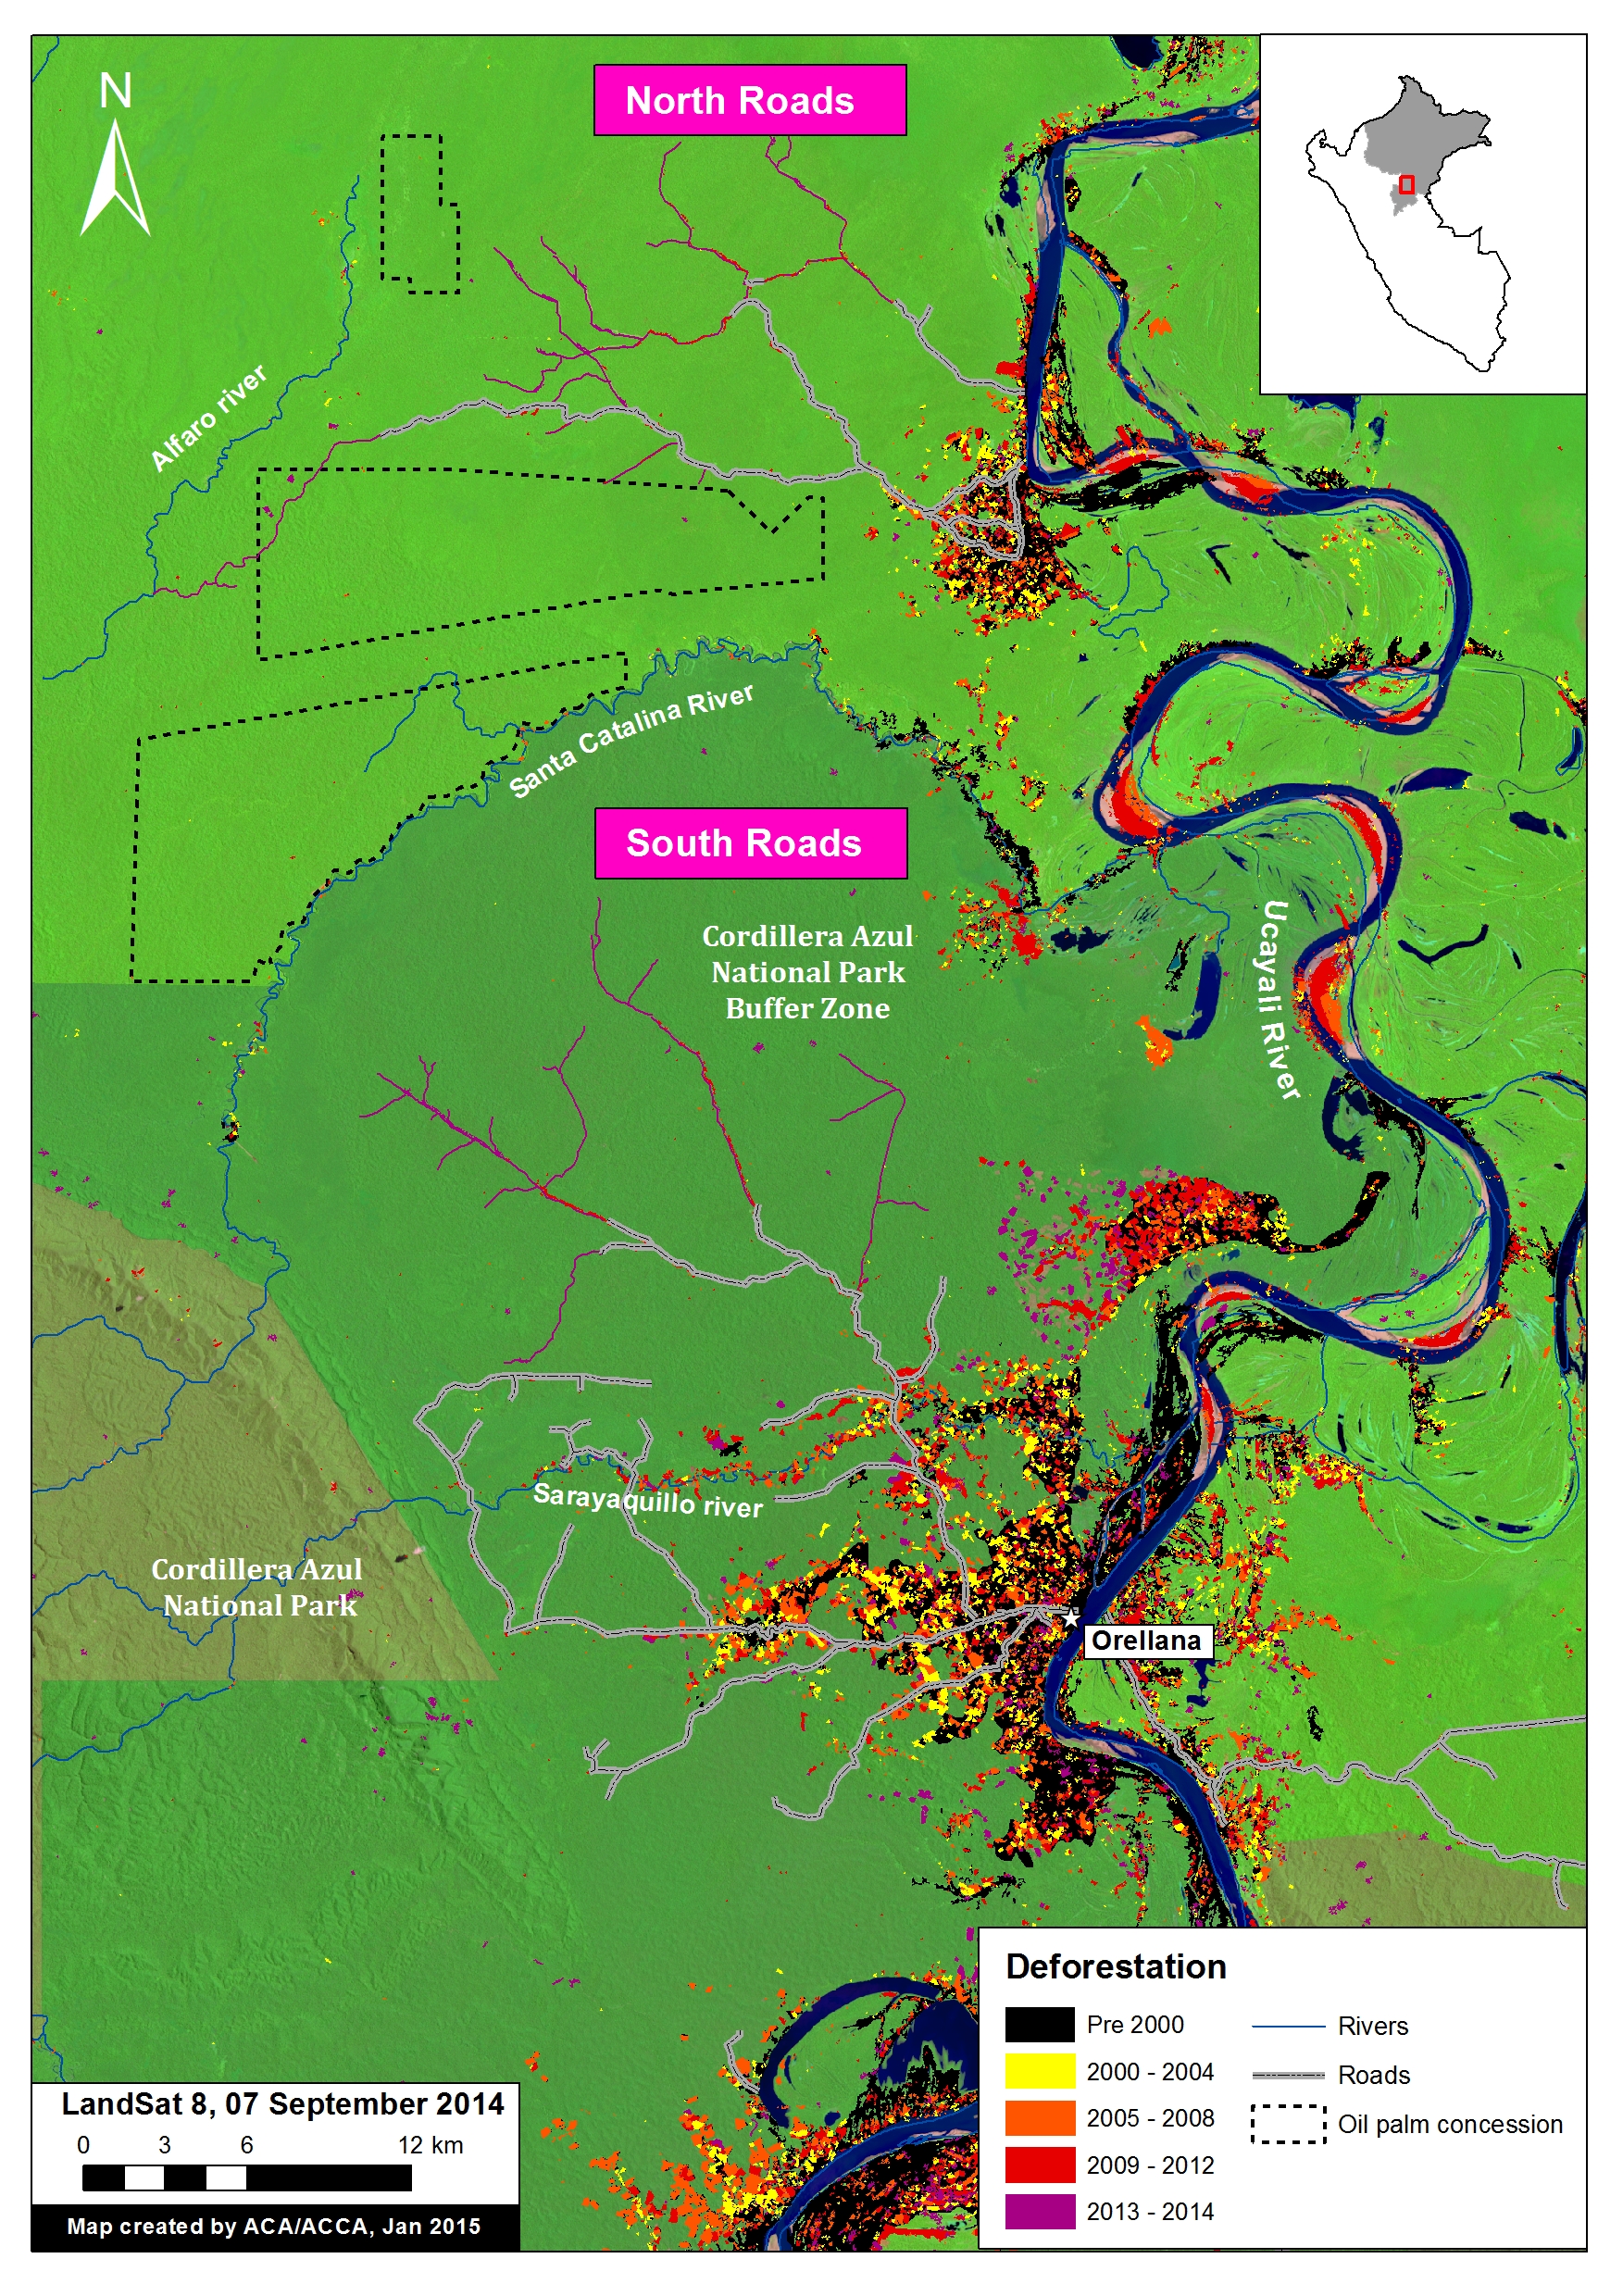
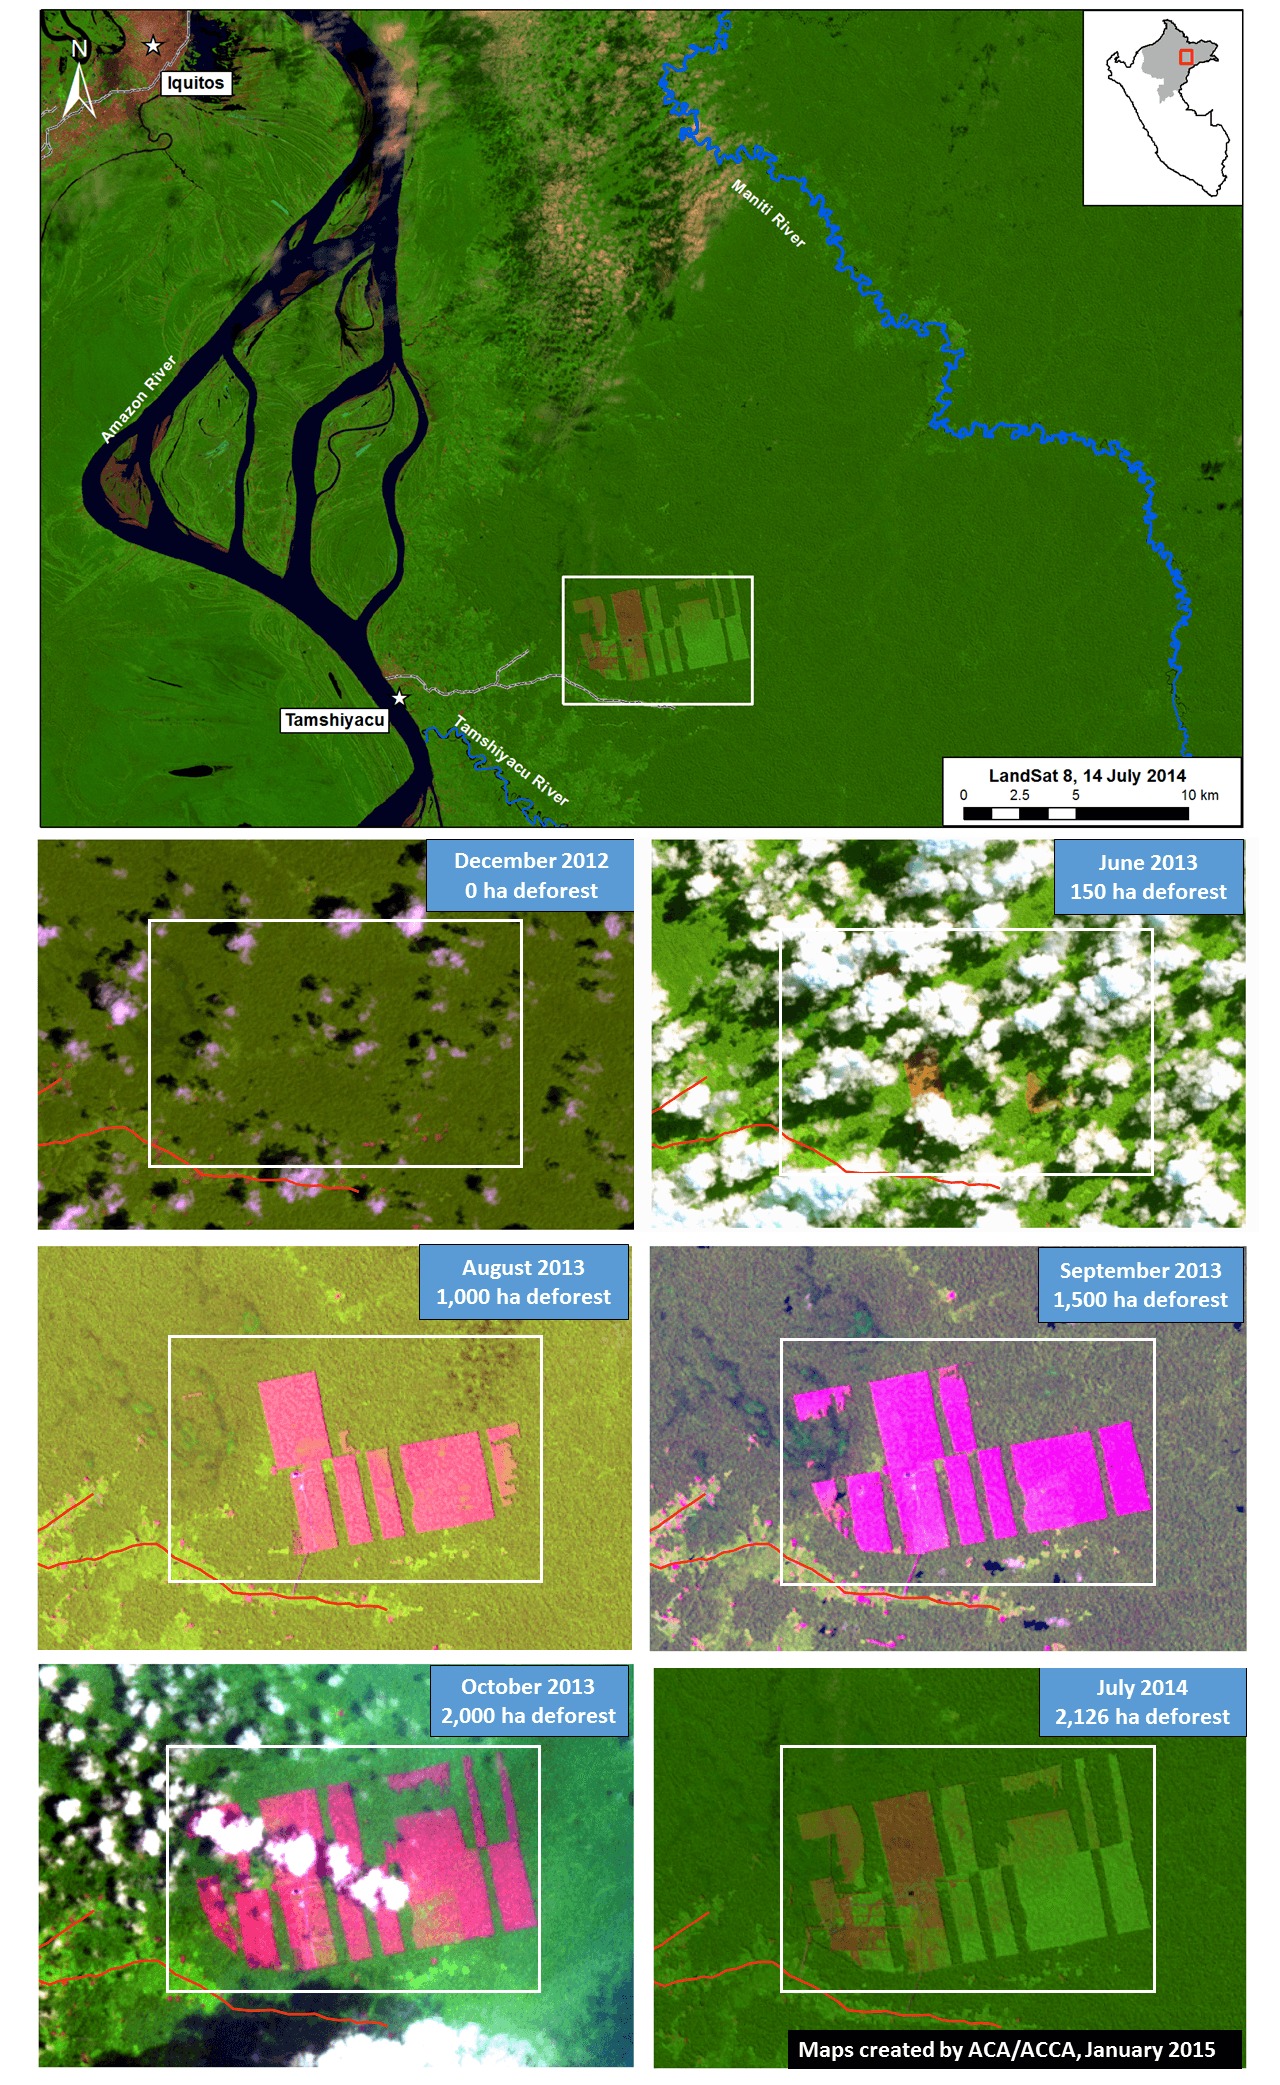
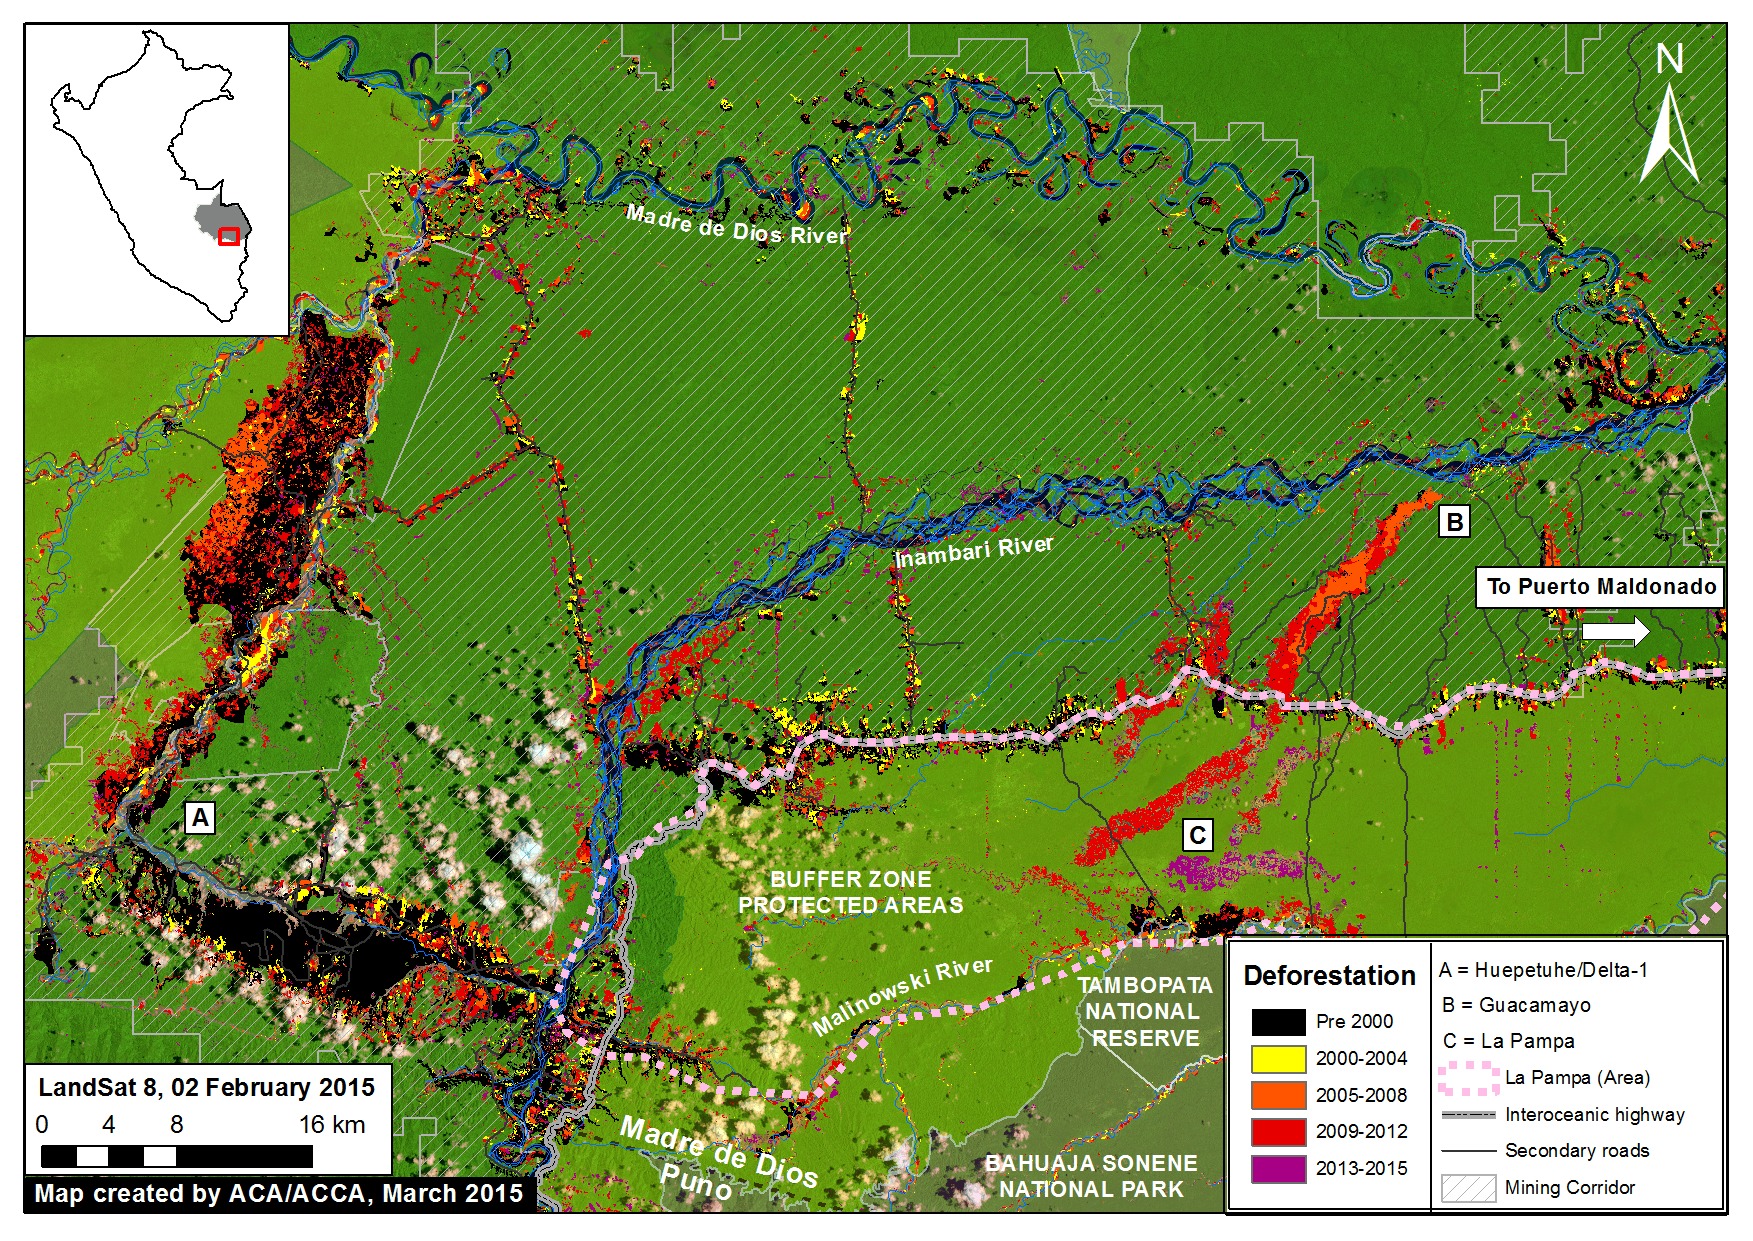
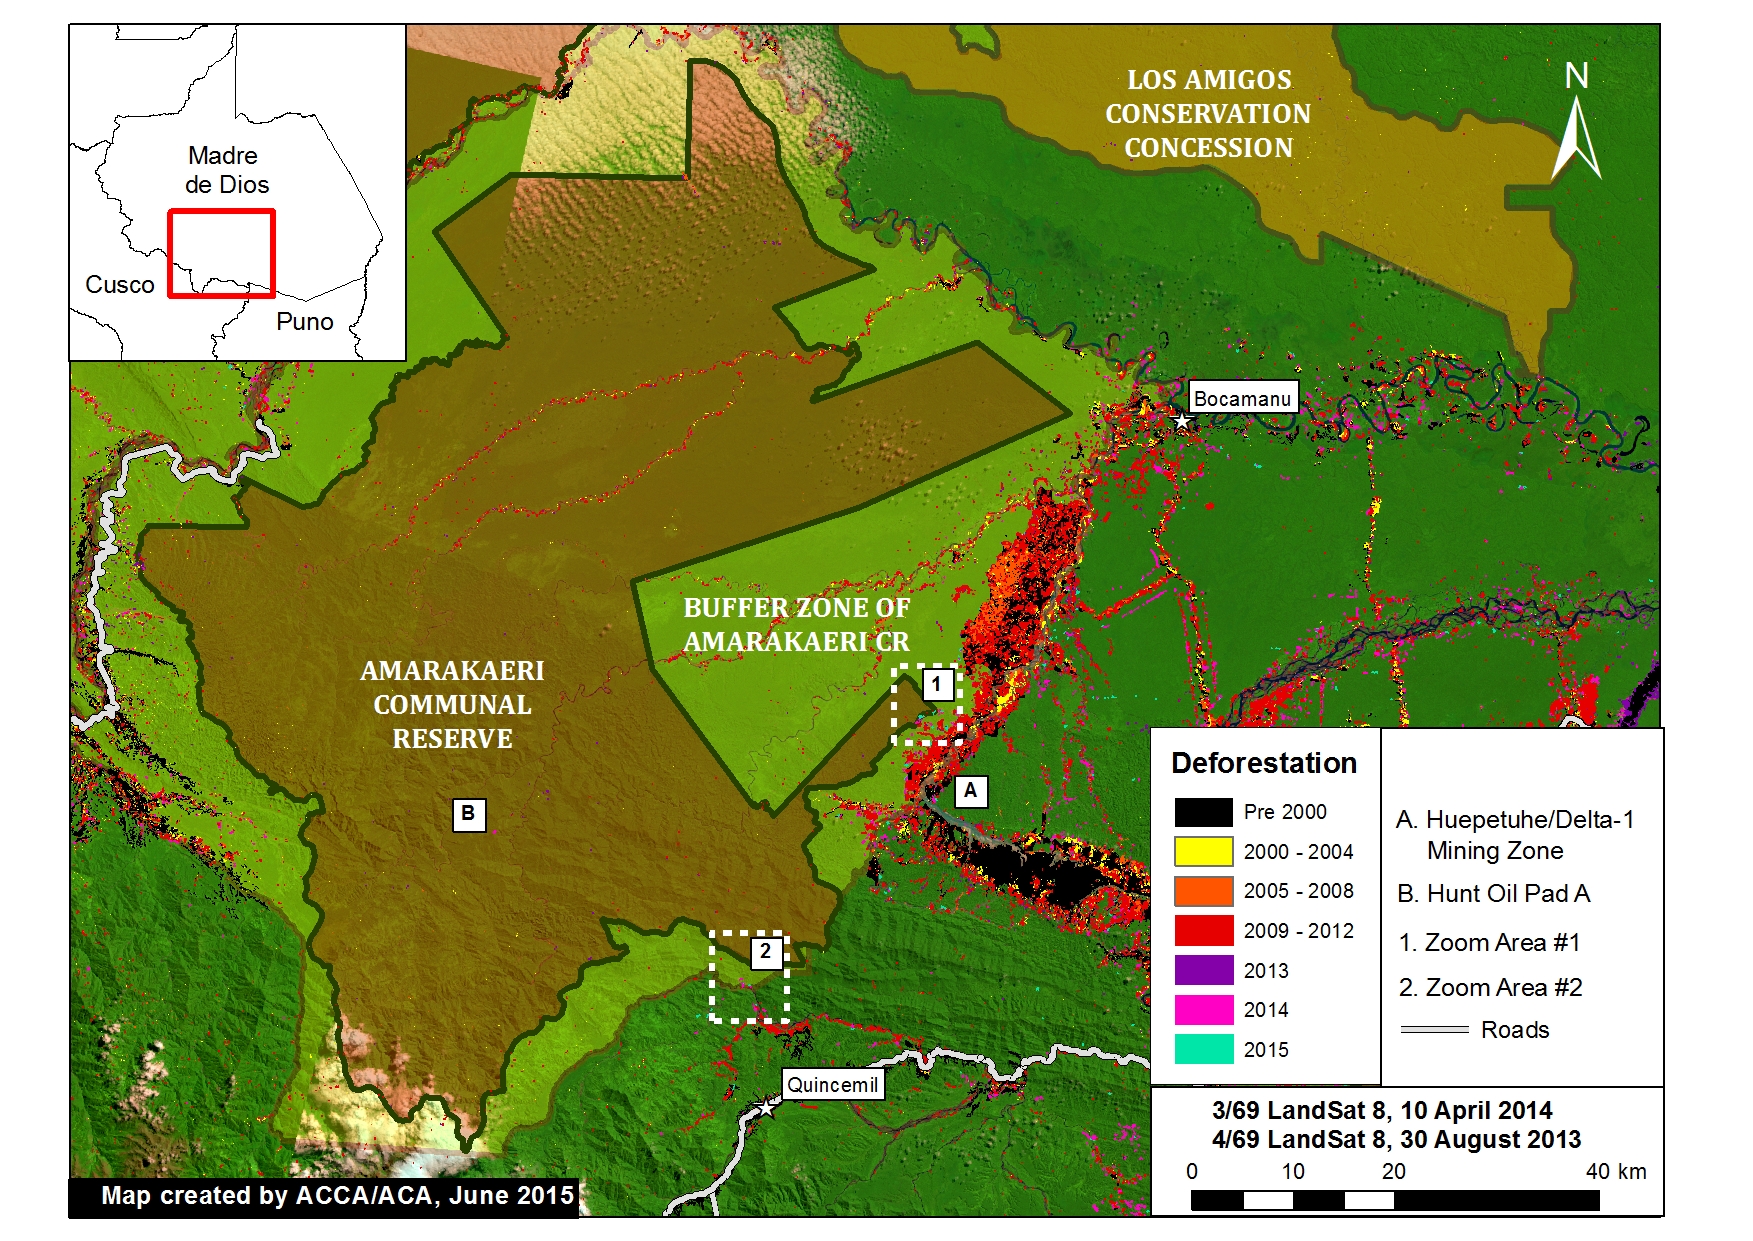
Recall that in Image of the Week #1 and Image of the Week #5 we documented how gold mining deforestation continues to expand within the Department of Madre de Dios, Peru (in the areas known as La Pampa and Upper Malinowski, respectively). Here, Image of the Week #6 documents how expanding deforestation from the mining zone known as Huepetuhe/Delta-1 is now entering the Amarakaeri Communal Reserve, an important Peruvian protected area that is co-managed by indigenous communities and Peru’s National Protected Areas Service (known as SERNANP).

Our analysis shows that gold mining deforestation, expanding from Huepetuhe/Delta-1, entered the southeast corner of the reserve in 2013 and expanded in 2014 and 2015. We also show that gold mining deforestation is spreading within the reserve’s south-eastern buffer zone.

2015_MDD_Amarakaeri_MAAP_6a_v8
Image of the Week 6a. Deforestation detected within and around the Amarakaeri Communal Reserve and its buffer zone. Zoom Area #1 indicates focal area in Images 6b and 6c, while Zoom Area #2 indicates focal area in Image 6d. Key data sources: MINAM, SERNANP, ACCA, USGS, IBC, Hansen/UMD/Google/USGS/NASA.

Key Findings:

According to our CLASlite analysis, deforestation entered the southeast corner of the Amarakaeri Communal Reserve in 2013 and expanded in 2014 and 2015 (see Zoom #1 below). Additional analysis revealed that the driver of this deforestation was gold mining due to the pattern and appearance of the forest loss.

We also detected increasing gold mining deforestation within the reserve’s south-eastern buffer zone between 2014 and 2015 (see Zoom #2 below). See below for more details.

We also detected a small amount of deforestation in 2014 from Hunt Oil’s drilling of Pad A within the reserve (see “B” in Image 6a). Note that overall deforestation from this gas exploration project has been very low because the company did not build an access road.

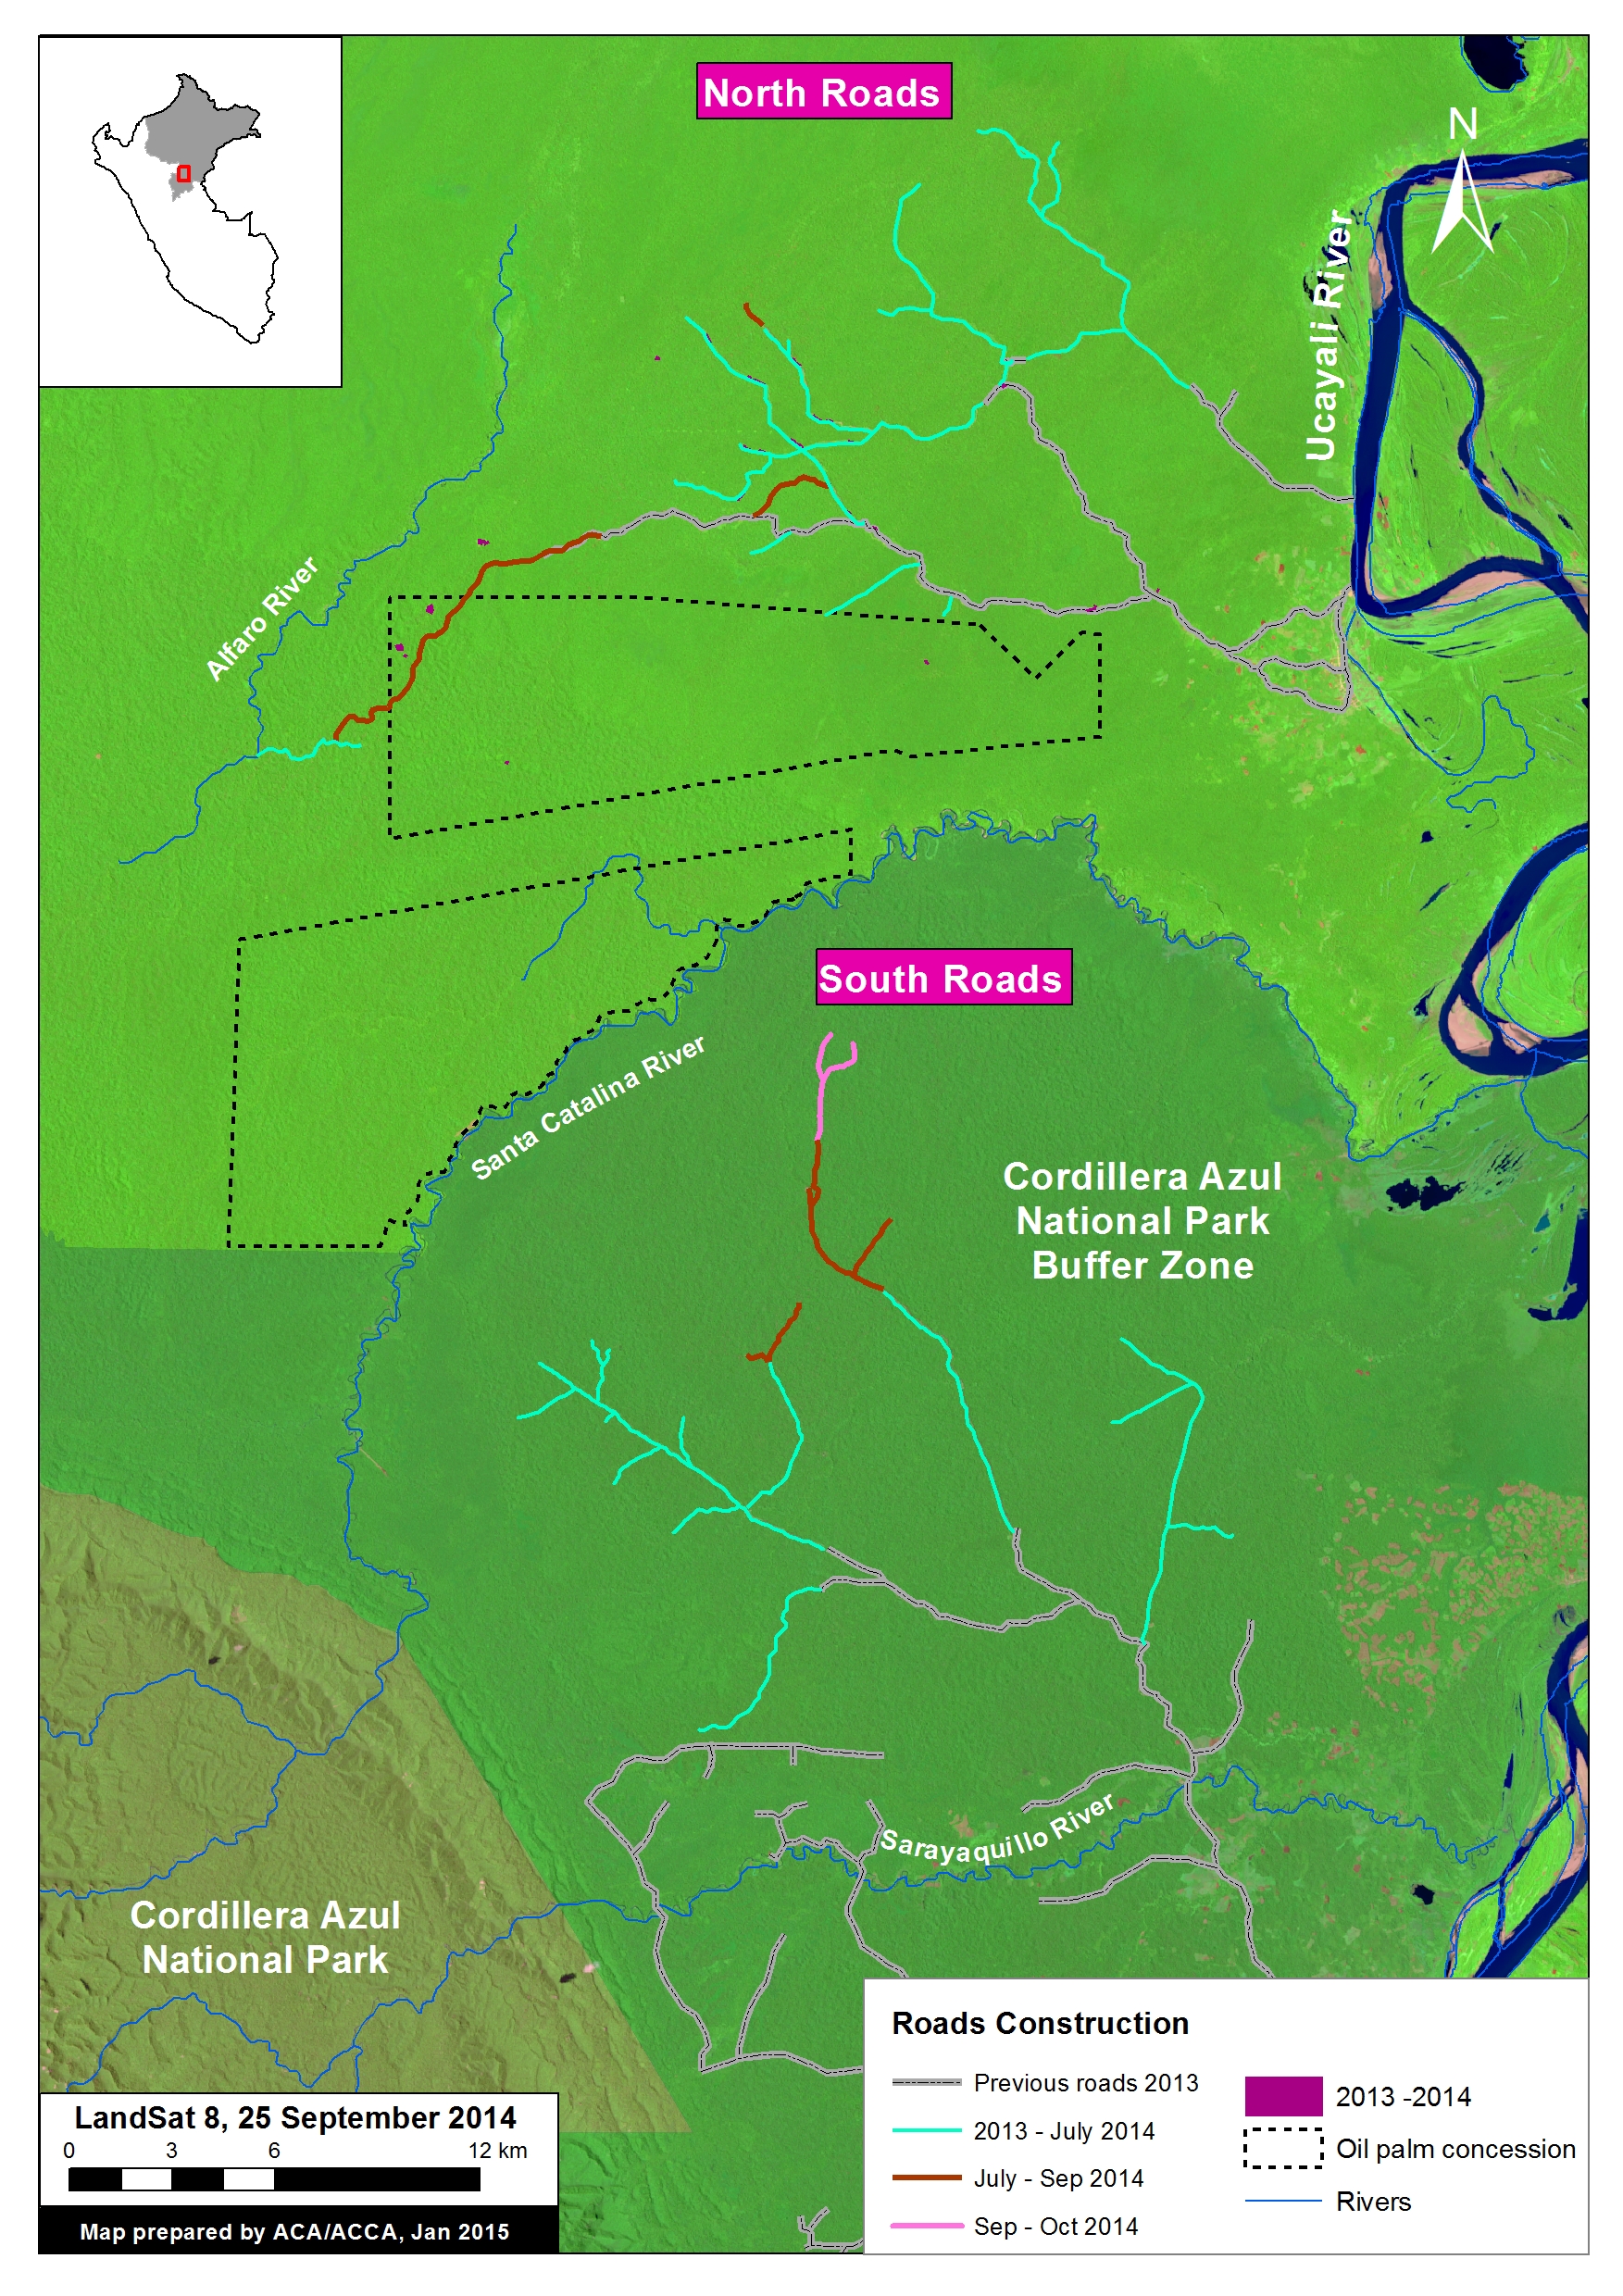
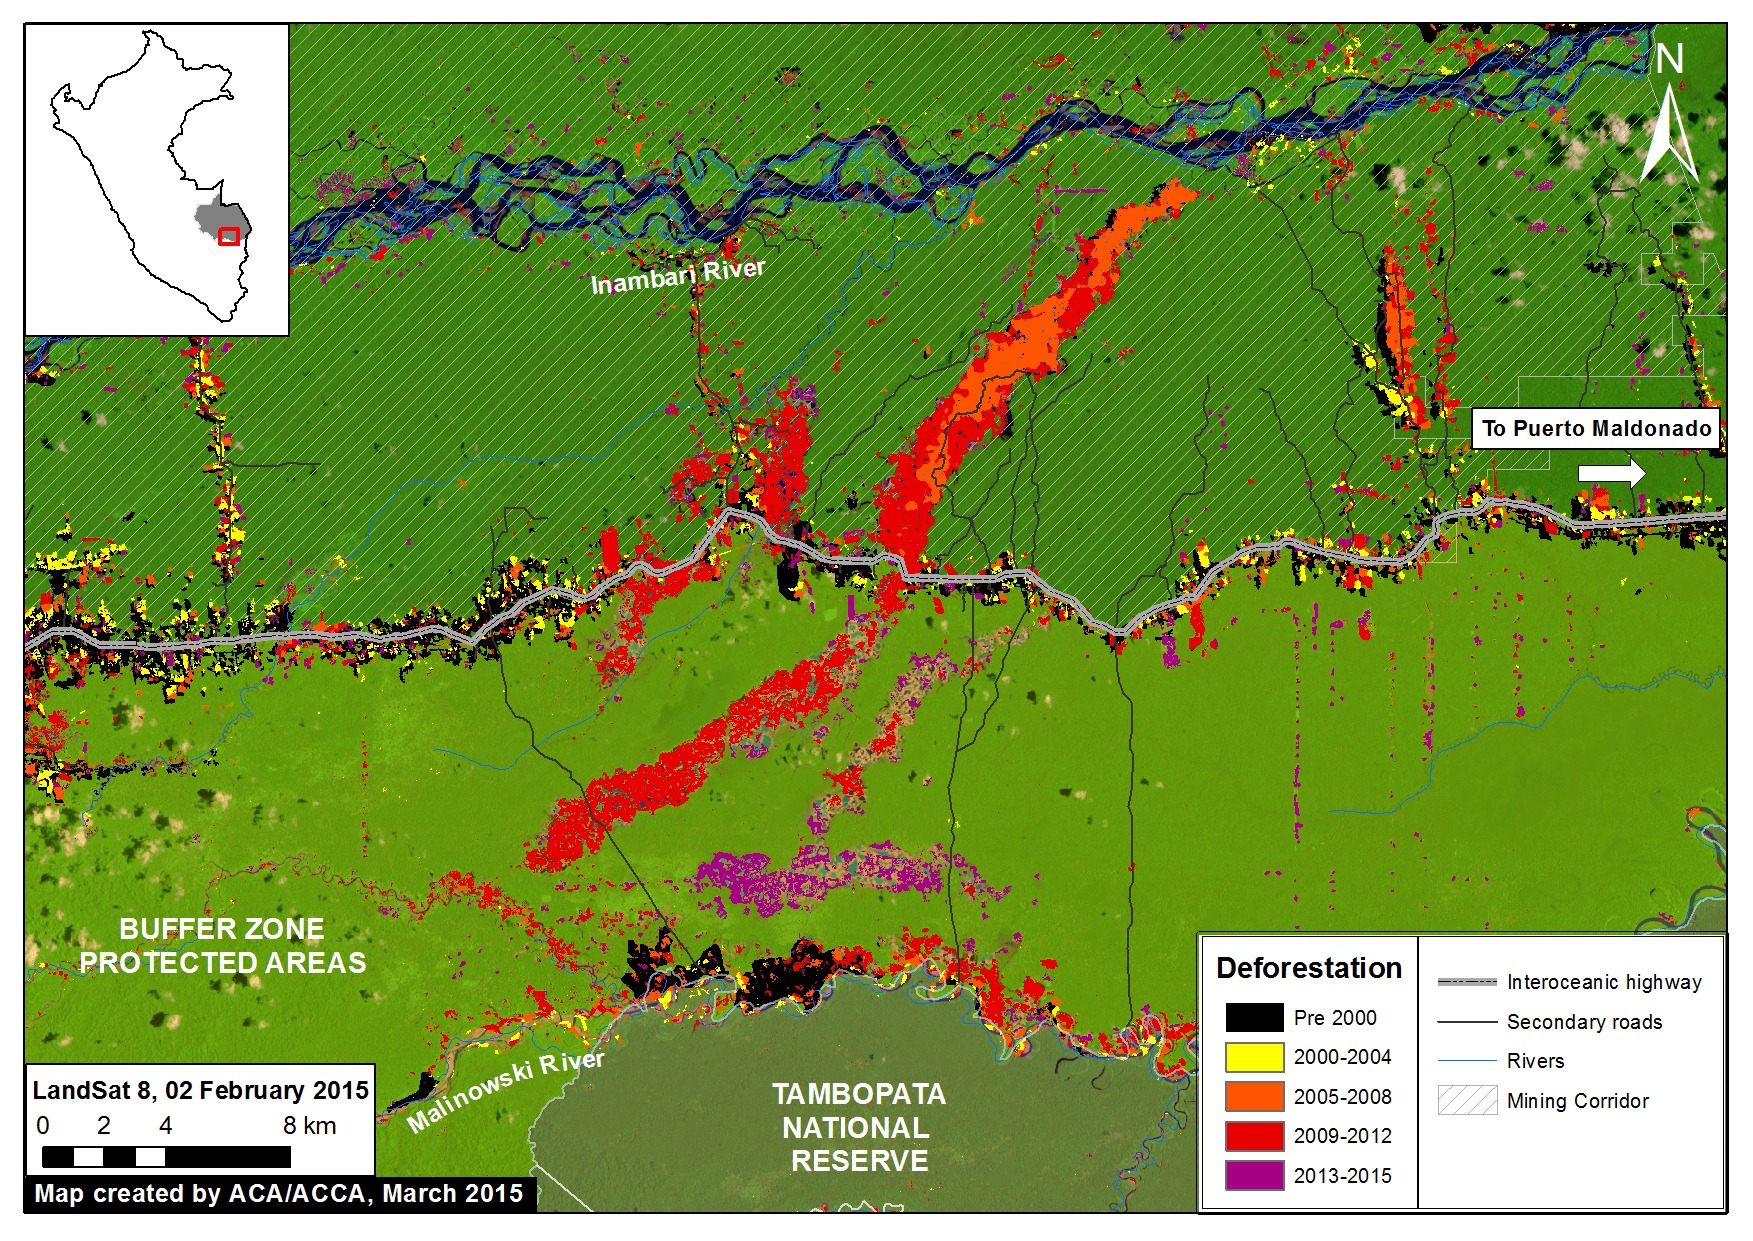
Gold Mining Deforestation Enters the Reserve (Zoom Area #1)

2015_MDD_Amarakaeri_MAAP_6b_v7 (1)
Image 6b. Zoom Area #1 provides an enhanced view of the deforestation within the southeast section of Amarakaeri Communal Reserve and its surrounding buffer zone. Key data sources: MINAM, SERNANP, ACCA, Hansen/UMD/Google/USGS/NASA, USGS.


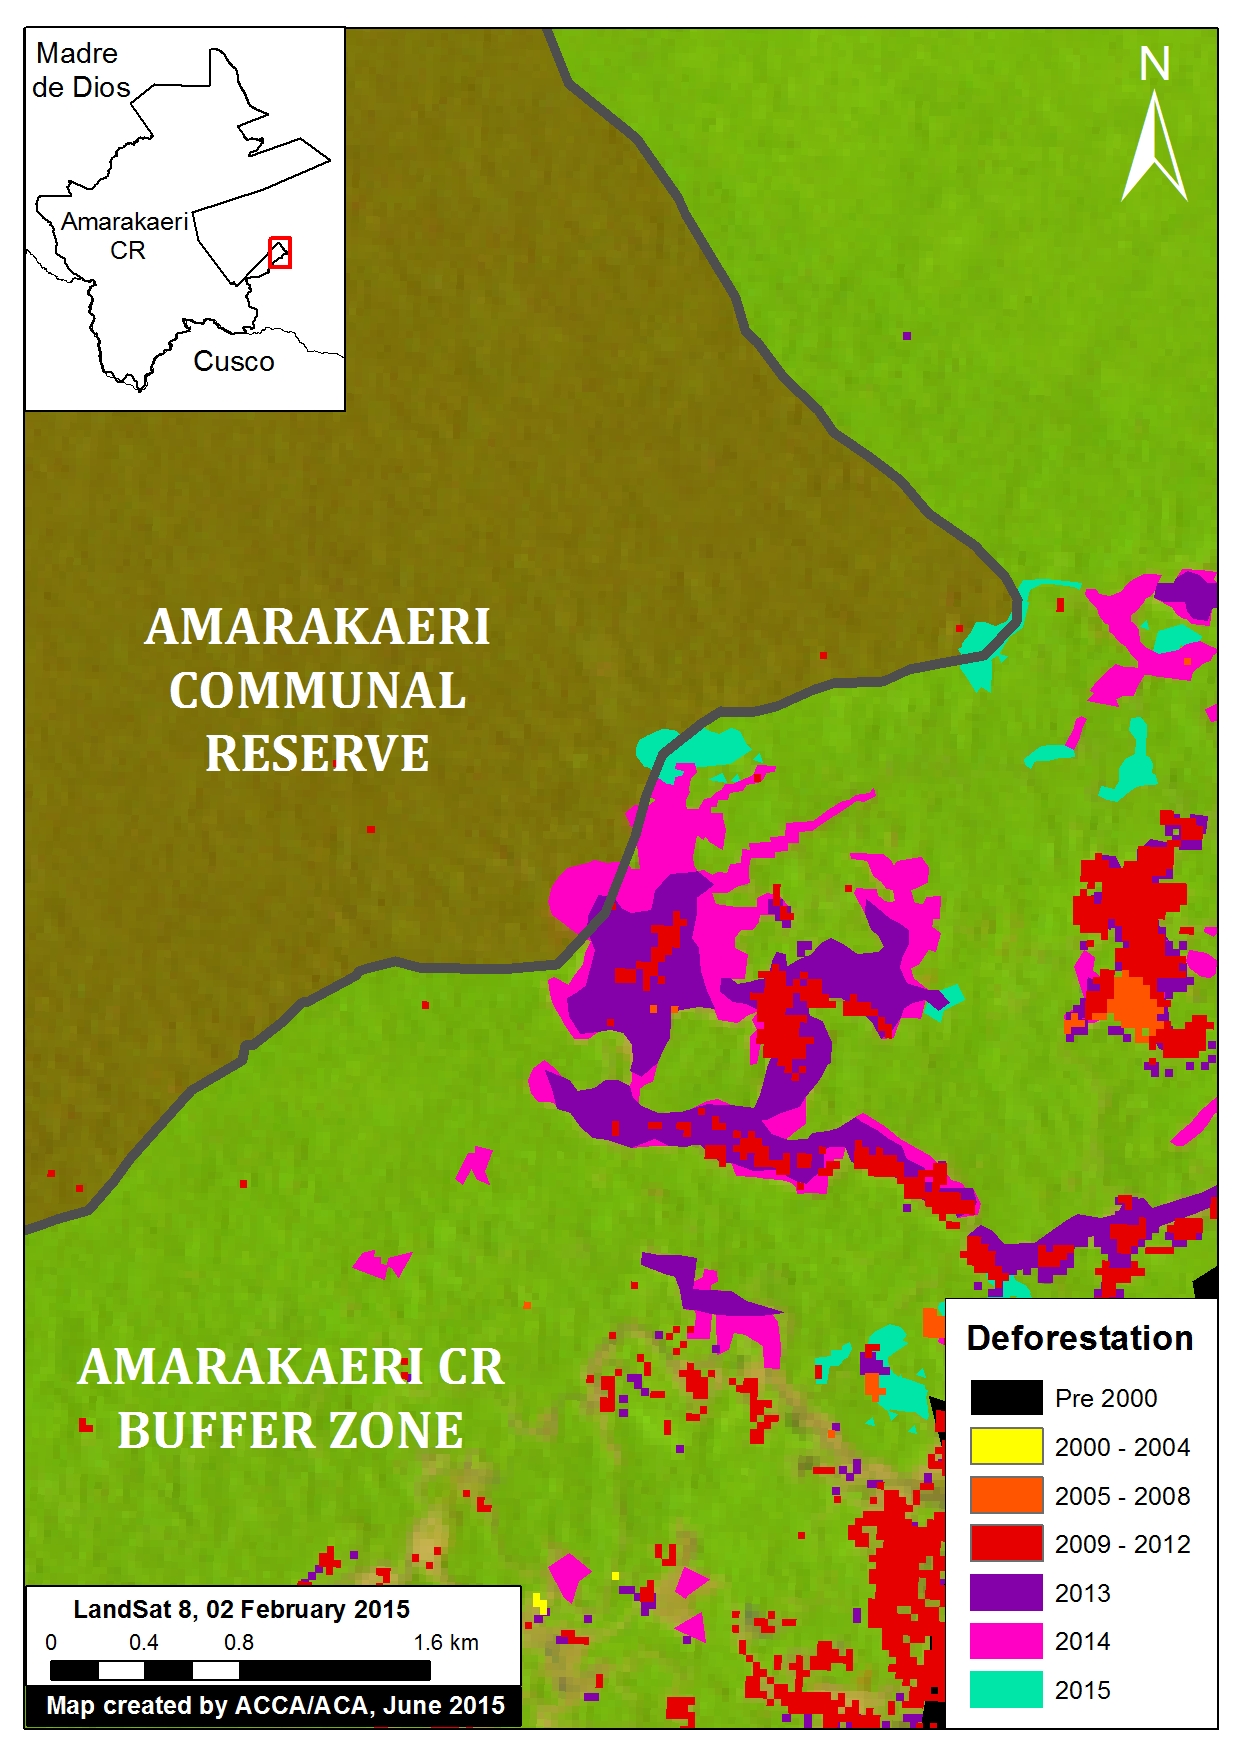
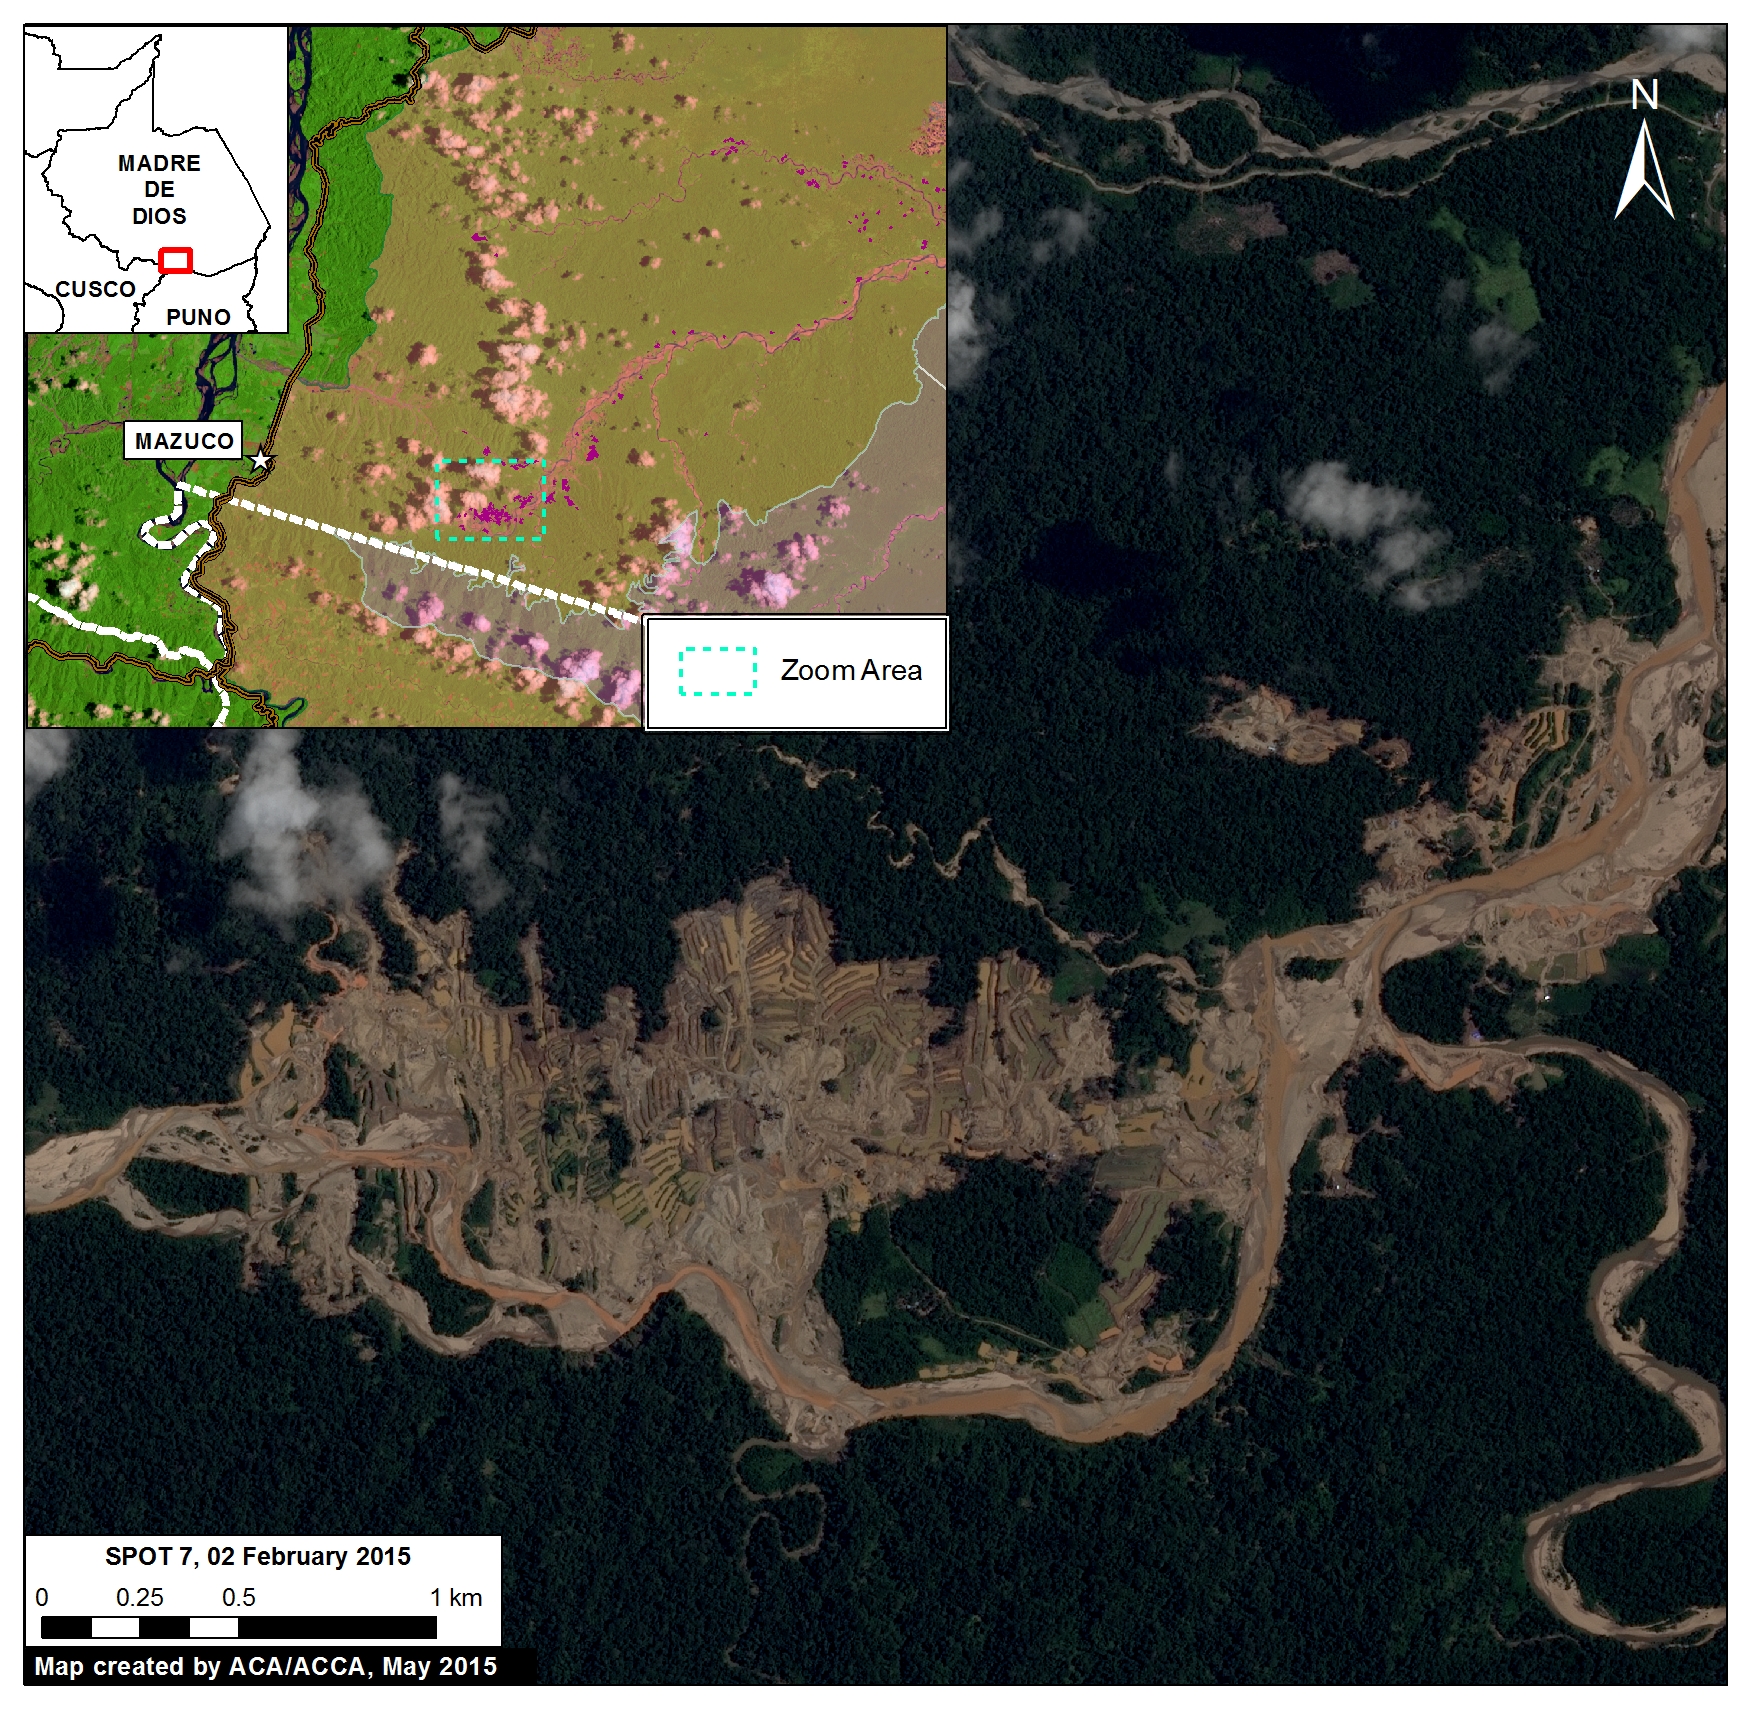
Image 6b is a zoom view of the deforestation within the southeast section of Amarakaeri Communal Reserve and its surrounding buffer zone (see Zoom Area #1 in Image 6a for context).

Here, one can more clearly see how the gold mining deforestation entered the southeast corner of the reserve in 2013 and expanded in 2014 and 2015.

Total gold mining deforestation within this section of the Reserve is currently 11 hectares. Although this is currently only 1% of the Reserve’s total area, it represents a growing trend that may worsen.

Note that all of the rest of the deforestation in the image is within the reserve’s surrounding buffer zone.


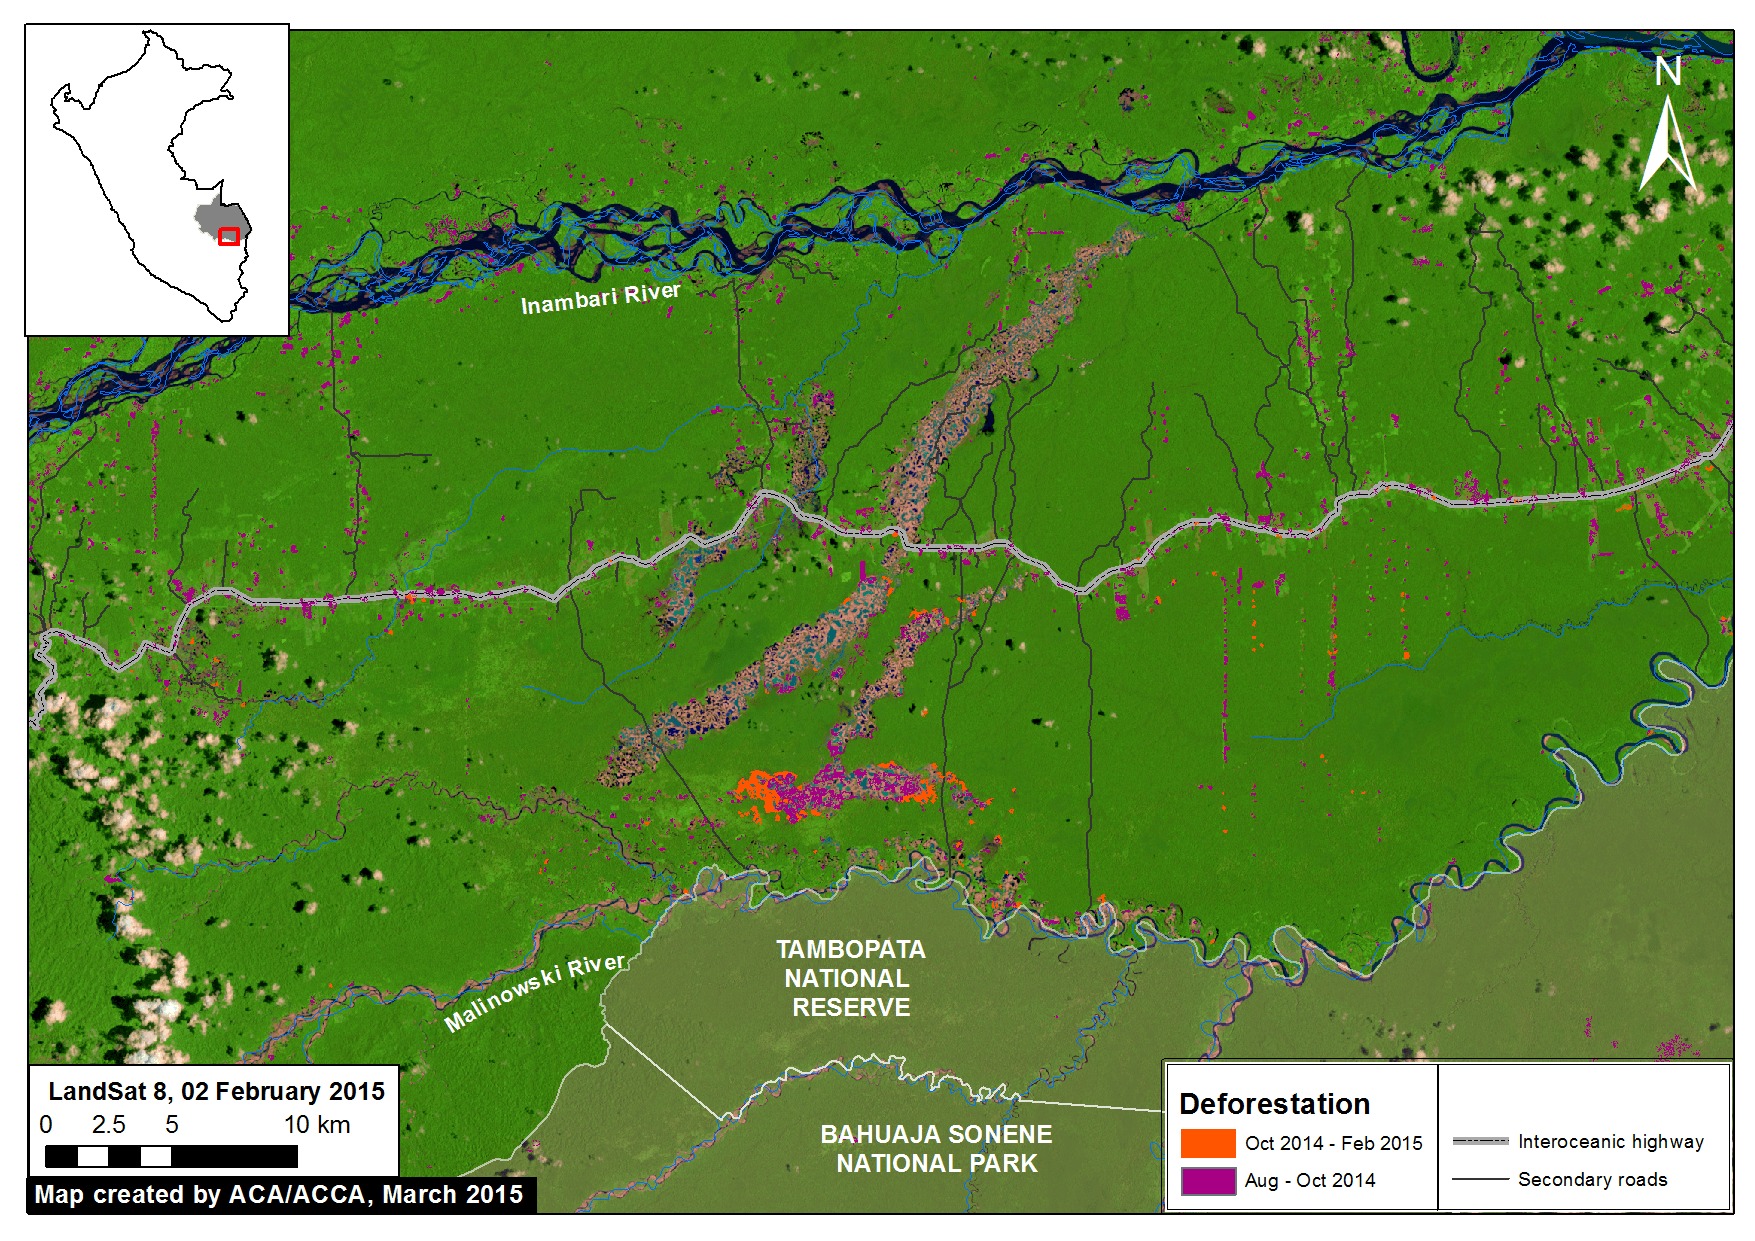
Satellite Image Time-series of Deforestation Entering the Reserve (Zoom Area #1)

2015_MDD_Amarakaeri_MAAP_6c_v4
Image 6c. Satellite (Landsat 8) image time-series (2013 – 2015) of deforestation within the southeast section of the Amarakaeri Communal Reserve. Note that all four panels show the same location over time. Key data sources: USGS, SERNANP.

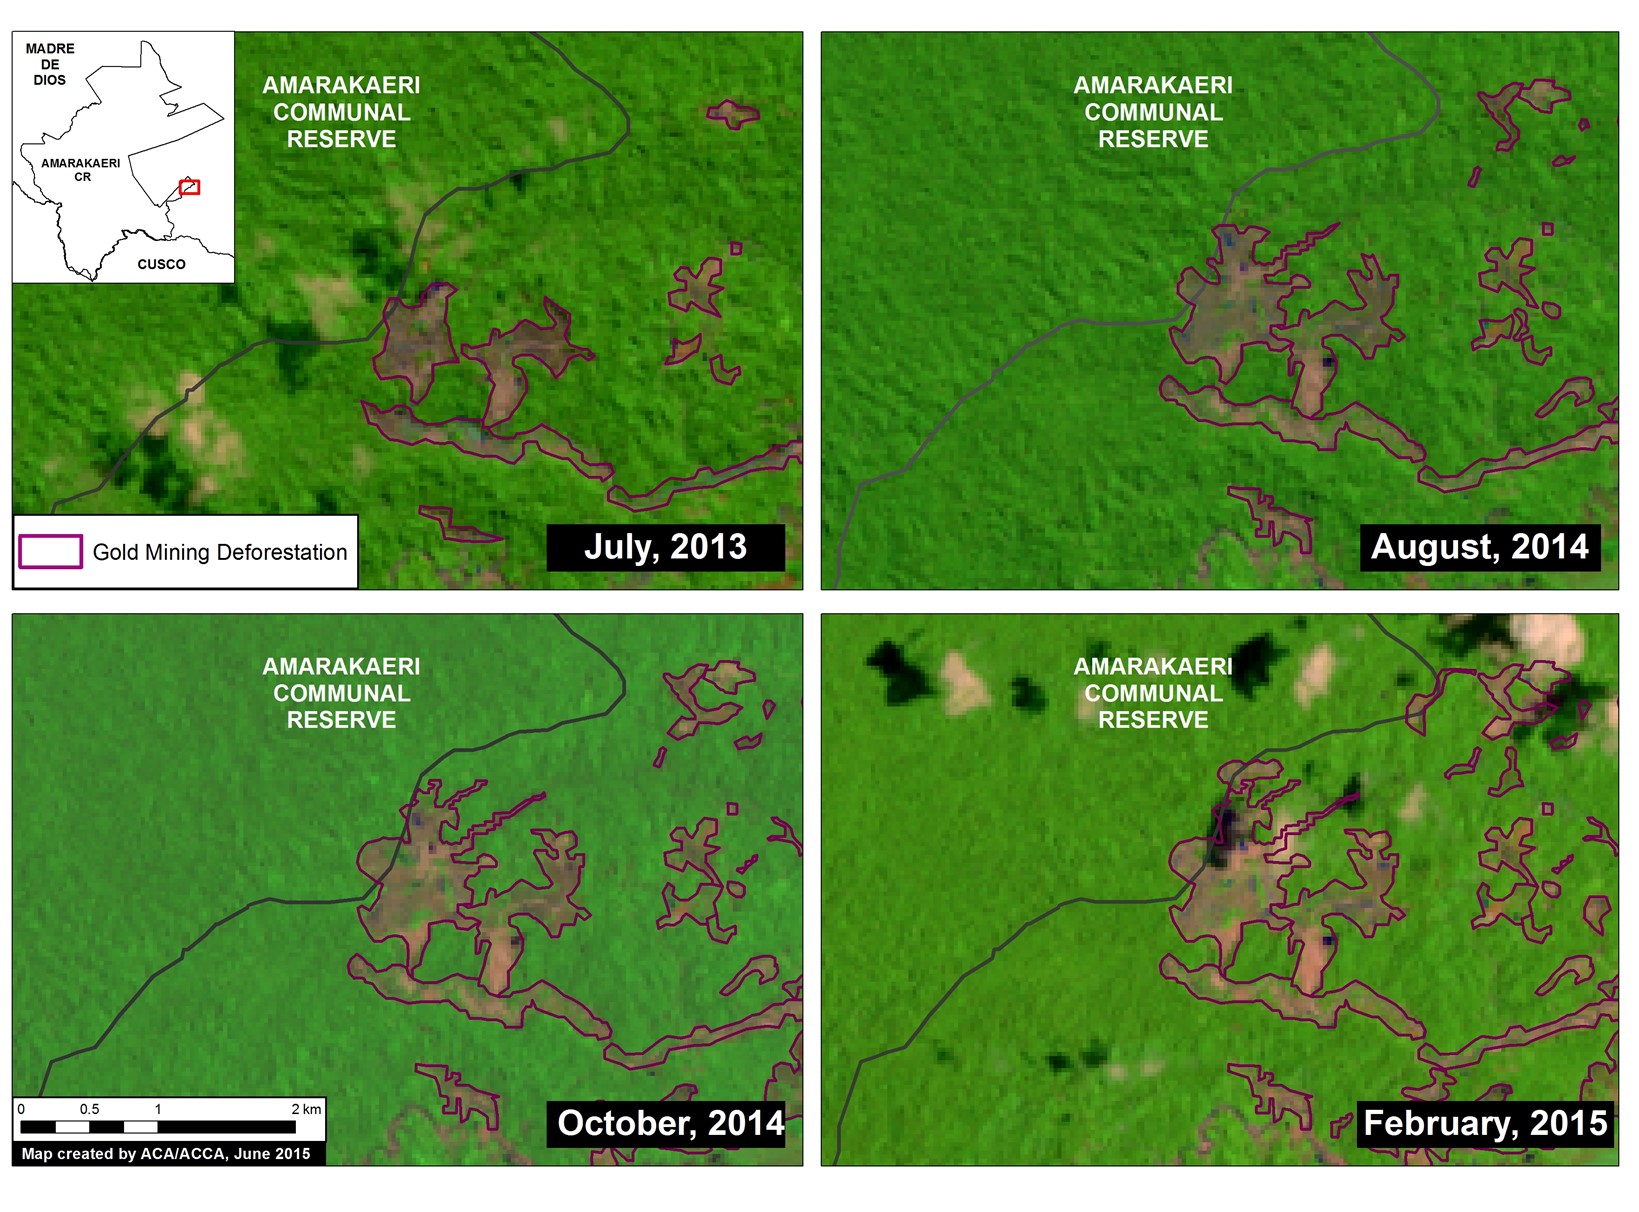
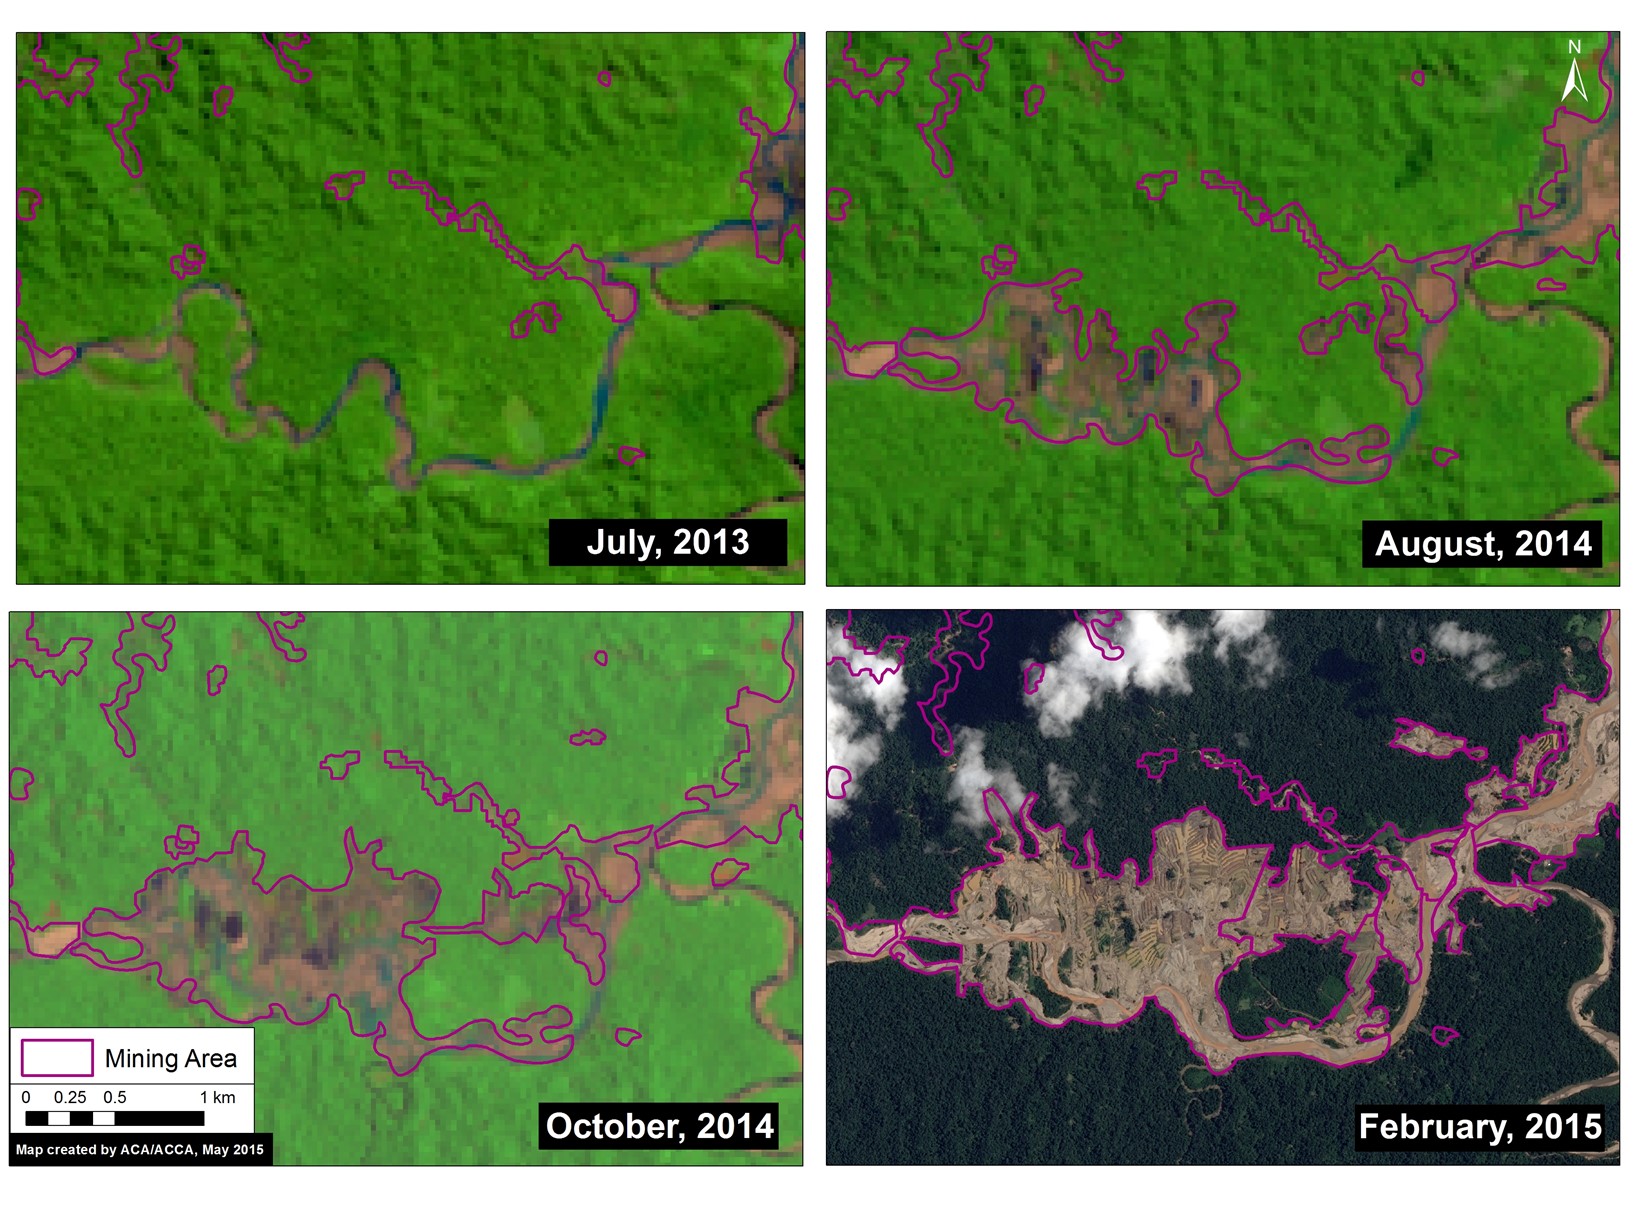
To better understand the deforestation dynamics over time within the southeast corner of the Amarakaeri Communal Reserve, we created a satellite (Landsat 8) image time-series. As seen in Image 6c, gold mining deforestation within the reserve is first seen in July 2013, and then slowly expands on several fronts until February 2015, the last good Landsat image for the area. Note that all four panels show the same location. Also note that all area in each panel outside the reserve is within its official buffer zone.

Gold Mining Deforestation Encroaching Upon Another Part of the Reserve (Zoom Area #2)

2015_MDD_Amarakaeri_MAAP_6e_v8
Image 6d. Zoom view of the deforestation within the south-eastern buffer zone of the Amarakaeri Communal Reserve. Left panel shows deforestation results data and right panel shows high resolution SPOT 7 imagery for the area in white dashed lines. Key data sources: MINAM, SERNANP, ACCA, Hansen/UMD/Google/USGS/NASA, USGS, and SPOT 7 from Airbus.

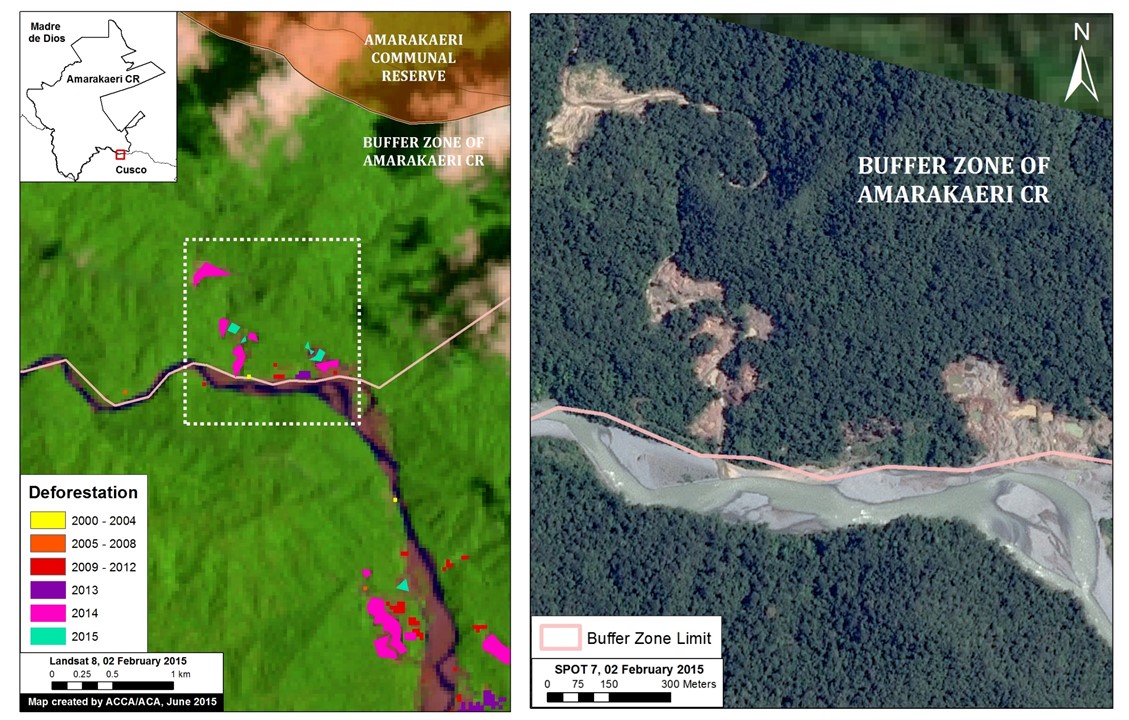
Image 6d shows how gold mining deforestation is encroaching on another part of the south-eastern section of the reserve (see Zoom Area #2 in Image 6a for context). As seen in the left panel, the deforestation within the buffer zone began expanding most notably in 2014 and 2015.

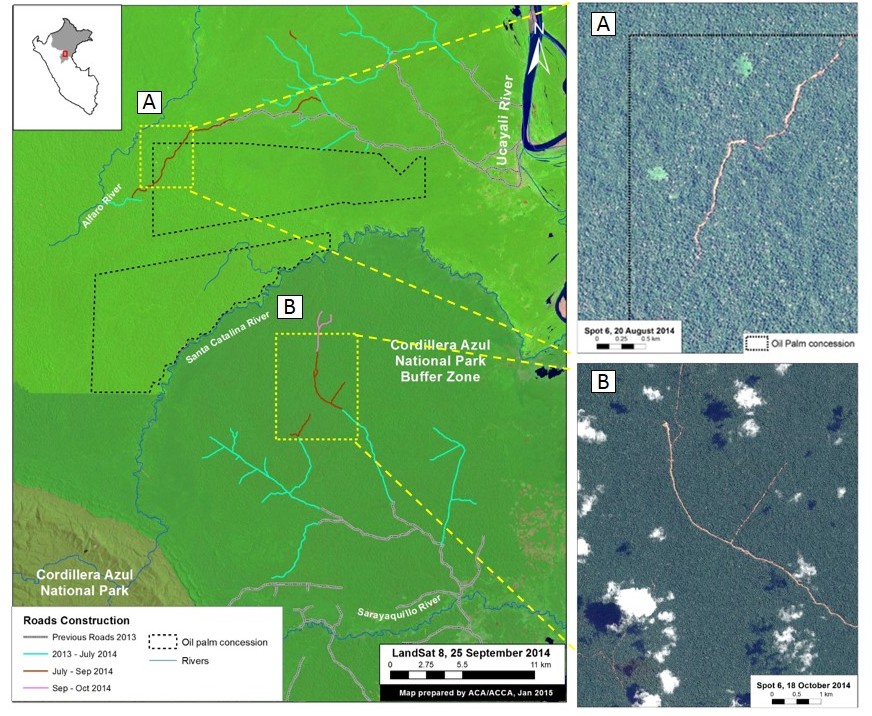
To confirm the driver of the deforestation, we acquired high resolution satellite imagery (SPOT 7 with 1.5 m resolution). As seen in the right panel of Image 6d, the pattern of the recent deforestation is characteristic of gold mining, and not other possible drivers such as agriculture.

Data Description:

Background map is a mosaic of two Landsat 8 images (30 m resolution) from April 10, 2014 and August 30, 2013. Any variation of green indicates forest cover. Note there is some scattered cloud cover. Data is from USGS.

Protected areas data is from SERNANP. Dark green indicates an established Peruvian national protected area or conservation concession and yellow-green indicates an official protected area buffer zone.

Black indicates areas that were deforested as of 2000 according to data from the Peruvian Environment Ministry (MINAM 2009). Yellow, orange, and red indicate areas that were deforested from 2000 to 2012 (each color covers a four year period) (Hansen MC et al. 2013 Science 342: 850–53; Data download).

Purple, pink, and teal indicate areas that were deforested between January 2013 and February 2015 based on our analysis of Landsat imagery using CLASlite forest monitoring software.

Citation

Finer M, Novoa S (2015) Gold Mining Deforestation Enters Amarakaeri Communal Reserve (Madre de Dios, Peru). MAAP: Image #6. Link: https://www.maapprogram.org/2015/08/image-of-the-week-6-gold-mining-deforestation-enters-amarakaeri-communal-reserve/


Image #5: Gold Mining Deforestation Intensifies along Upper Malinowski (Madre de Dios, Peru)

Recall that in Image of the Week #1 we documented how gold mining deforestation continues to expand within the Department of Madre de Dios (Peru) in an area known as La Pampa  (1,700 hectares of new deforestation between 2013 and 2015). Here, Image of the Week #5 examines the area immediately to the west of La Pampa along the Upper Malinowski River, where we document over 850 hectares of additional gold mining deforestation between 2013 and 2015. Like La Pampa, most mining along the Upper Malinowski is illegal because it is outside the permissible mining zone and within the official buffer zone of a protected area.

2015_MDD_Malinowski_MAAP_5a_v7
Image of the Week 5a. Expanding deforestation from illegal gold mining along the Upper Malinowski River. Key data sources: MINAM, SERNANP, ACCA, USGS, IBC, Hansen/UMD/Google/USGS/NASA.

Key Results

According to our CLASlite analysis, 864 hectares were deforested between 2013 and 2015 along the Upper Malinowski and nearby tributaries within the buffer zones of the Bahuaja Sonene and Tambopata protected areas.

Image of the Week Description

Background map is a Landsat 8 image (30 m resolution) from February 2, 2015. Any variation of green indicates forest cover. Note there is some scattered cloud cover. Data is from USGS.

Protected areas data is from SERNANP. Dark green indicates established national protected areas and yellow-green indicates their buffer zones.

Black indicates areas that were deforested as of 2000 according to data from the Peruvian Environment Ministry (MINAM 2009). Yellow, orange, and red indicate areas that were deforested from 2000 to 2012 (each color covers a four year period) (Hansen MC et al. 2013 Science 342: 850–53Data download).

Purple indicates areas that were deforested between January 2013 and February 2015 based on our analysis of Landsat imagery using CLASlite forest monitoring software.

Madre de Dios Mining Zone

2015_MDD_Malinowski_MAAP_5b_v4
Image 5b. Madre de Dios mining zone, highlighting location of La Pampa and Upper Malinowski. Note that we did not include other land uses such as forestry concessions. Key data sources: MINAM, SERNANP, ACCA, Hansen/UMD/Google/USGS/NASA, USGS.

Image 5b provides greater context of the Madre de Dios mining zone, highlighting La Pampa at “C” (Image of the Week #1) and the Upper Malinowski at “D”.

The Permissible Mining Zone was established in 2010 and indicates the zone that the Peruvian Government has delimited as potentially legal for small-scale and artisanal mining activities, but only if miners succesfully complete a multi-step formalization process for each project. One of the key steps of this process is to resolve any land use conflicts due to overlapping land claims (for example if a section of the mining corridor overlaps with a forestry concession). Data is from ACCA.

Importantly, note that most gold mining in both La Pampa and the Upper Malinowski is illegal since it is located outside the permissible mining zone and within the buffer zone of two protected areas (Bahuaja Sonene National Park and Tambopata National Reserve).

Also note that on the lower Malinowski, deforestation is concentrated on the buffer zone side and largely absent on the protected area side. This striking pattern indicates that official protection status is much more of an effective deforestation deterrent than the looser buffer zone status.

High-resolution Zoom

2015_MDD_Malinowski_MAAP_5c_v4
Image 5c. High resolution satellite image of deforestation along the Upper Malinowski River. Key data sources: SPOT 7, CLASlite.

To better understand the driver of the deforestation along the Upper Malinowski, we acquired high resolution satellite imagery (SPOT 7 with 1.5 m resolution). As seen in Image 5c, the pattern of the recent deforestation is characteristic of gold mining, and not other possible drivers such as agriculture. Note that the purple outlines indicate areas that were deforested between January 2013 and February 2015 based on our CLASlite analysis (this image shows 492 of the total 864 hectares of recent deforestation).

Satellite Image Time-series

2015_MDD_Malinowski_MAAP_5d_v3
Image 5d. Satellite image time-series (2013 – 2015) of deforestation along the Upper Malinowski. Note that all four panels in Image 5d show the same location. Key data sources: USGS, SPOT 7.

To better understand the deforestation dynamics over time along the Upper Malinowski, we created a satellite image (Landsat and SPOT 7) time-series. As seen in Image 5d, there was a rapid increase in mining deforestation in the less than two years between July 2013 and February 2015. Note that all four panels in Image 5d show the same location, but appear different because of the deforestation.

Citation

Finer M, Novoa S (2015) Gold Mining Deforestation Intensifies along Upper Malinowski (Madre de Dios, Peru). MAAP: Image #5. Link: https://www.maapprogram.org/2015/05/image-5-gold-mining-deforestation-intensifies-along-upper-malinowski-madre-de-dios-peru/

Image #4: Large-Scale Oil Palm Causes Deforestation of Primary Forest in the Peruvian Amazon (Part 1: Nueva Requena)

Image of the Week #4 shows the expansion of two large-scale oil palm projects near the town of Nueva Requena in the central Peruvian Amazon (Department of Ucayali). These projects began in late 2011 and, as of April 2015, now cover nearly 12,200 hectares (ha). Our analysis reveals that, of this total area, 9,400 ha came at the expense of primary forest and 2,350 ha from secondary forest.

NR_MAAP_4d_v5
Image of the Week 4a. Two large-scale oil palm projects near Nueva Requena in the central Peruvian Amazon (Department of Ucayali) began in late 2011 and now cover nearly 12,200 ha. Key data sources: USGS.

Map Description

Background map is a Landsat 8 satellite image (30 meter resolution) from August 2014. Dark green indicates forest cover. Light green indicates younger or secondary vegetation. Blue indicates water bodies. Data is from USGS.

The dashed black lines indicate the outline of the two large-scale oil palm projects, one of which is known to be “Plantaciones de Ucayali”, as of April 2015.

The colors indicate how the deforestation and plantation installation unfolded over time for the two projects according to our analysis of Landsat imagery.

Between October 2011 and August 2012, large scale-clearing and installation (indicated in yellow) started in the northern project.

Between September 2012 and August 2013, large-scale clearing and installation (indicated in orange) continued in the northern project and began in the southern project.

Between September and November 2013, clearing and installation (indicated in red) continued in the southern portion of both projects.

Most recently, between December 2013 and April 2015, clearing and installation (indicated in purple) continued in the southern portion of the northern project.

As of April 2015, the two projects cover an area of 12,188 ha.

Landsat Time-series 2010 – 2015

NR_MAAP_4g_v2
Image 4b. Landsat time-series (2010 – 2015) for both large-scale oil palm projects near Nueva Requena. Key data sources: USGS.

Image 4b is a series of Landsat images showing the change over time for both oil palm projects. In these images, dark green indicates forest cover, light green indicates secondary vegetation and oil palm plantations, pink indicates exposed ground (and is therefore a key indicator of recent deforestation), and the scattered white and black spots indicate clouds and their shade.

The first image, Landsat 5 from August 2010, shows the eventual project area (indicated by dashed black lines) immediately prior to the start of the project in 2011.

The second image, Landsat 7 from July 2012, shows the start of large-scale clearing in the northern portion of the project area.

The third image, Landsat 8 from September 2013, shows the clearing quickly expanded in both projects. It also shows the start of the oil palm plantation planting in the northern project (indicated by bright green).

The fourth image, Landsat 8 from April 2015, is the latest cloud-free image for the project area. It shows the continued expansion of the northern project and the extensive oil palm plantation plantings in both projects.

Landsat Time-series 1990 – 2015

NR_MAAP_4e_v5
Image 4c. Landsat time-series (1990 – 2015) for both large-scale oil palm projects near Nueva Requena. Key data sources: USGS.

We conducted another Landsat time-series analysis, but going back further in time (to 1990) in order to better understand the state of the forests cleared for the oil palm project. For each image, we determined whether an area was primary forest, secondary forest, deforested, or oil palm. Image 4c illustrates the results of this analysis.

It is important to note that in 2010, just prior to the large scale clearing, the two project areas were mostly a mix of primary and secondary forest.


Deforestation of Primary Forest

NR_MAAP_4f_v4
Image 4d. Classification of land use prior to oil palm activities. Key data sources: USGS.

Finally, we used the results from the Landsat time-series analysis to conduct a classification of land use prior to oil palm activities.

We determined that, of the 12,188 ha of the two oil palm projects, 9,404 ha (77%) was primary forest immediately prior to project installation. That is the equivalent to nearly 7,000 soccer fields. An additional 2,350 ha (19 %) was secondary forest. Only 434 ha (4 %) was already deforested at the start of the project.

We defined primary forest as an area that from the earliest available Landsat, in this case 1990, was characterized by dense closed canopy forest cover.


This work builds off of the following publication: Environmental Investigation Agency. Deforestation by Definition. 2015. Washington, DC. http://eia-global.org/news-media/deforestation-by-definition

Citation

Finer M, Novoa S (2015) Large-Scale Oil Palm Causes Deforestation of Primary Forest in the Peruvian Amazon (Part 1: Nueva Requena). MAAP: Image #4. Link: https://www.maapprogram.org/2015/04/image-4-oil-palm-projects-cause-deforestation-of-primary-forest-in-the-peruvian-amazon-part-1-nueva-requena/

Image #3: Detection of New (Logging?) Roads in the Peruvian Amazon

Image of the Week #3 shows the rapid proliferation of two new road networks in the northern Peruvian Amazon (Department of Loreto). Most notably, it highlights the construction of nearly 150 km of new roads, possibly illegal logging roads, through mostly primary forest between 2013 and 2014. One of the roads is within the buffer zone of the Cordillera Azul National Park.

TierraBlanca_MAAP_3a_v4
Image of the Week 3. Detection of new road construction in the northern Peruvian Amazon (Department of Loreto) Key data sources: MINAM, Hansen/UMD/Google/USGS/NASA, USGS, SERNANP, Grupo Palmas, GOREL.

Map Description

Background map is a Landsat 8 image (30 m resolution) from September 7, 2014. Green indicates forest cover. Our analysis has demonstrated that much of this forest cover is primary forestData is from USGS.

Black indicates areas that were deforested as of 2000 according to data from the Peruvian Environment Ministry. Yellow, orange, and red indicate areas that were deforested from 2000 to 2012 (each color covers a four year period) (Hansen MC et al. 2013 Science 342: 850–53; Data download).

Purple indicates areas that were deforested between 2013 and 2014 based on our analysis of Landsat imagery using CLASlite forest monitoring software. Note the two new road networks, labeled North and South, respectively, to the west of the Ucayali River.

Black dashed lines indicate planned oil palm plantations. We obtained this data from Environmental Impact Studies and the Regional Government of Loreto (GOREL).

Protected areas data is from SERNANP. Note the different shades of green to differentiate the protected area and its respective buffer zone.

TierraBlanca_MAAP_3b_v3
Image 3b. Road construction time-series. Key data sources: USGS, SERNANP, Grupo Palmas.

Construction of New Roads

We color coded the segments of road by construction period: Grey indicates  road segments constructed between 2009 and 2012. Teal indicates road  segments constructed between January 2013 and July 2014 (117.3 km). Dark-orange   indicates road segments constructed between July and September 2014 (25.9  km). Pink indicates road segments constructed between September and October  2014 (4.8 km).

In sum, 148 km of new roads was constructed in this area between January 2013 and  October 2014 (76.24 km in south and 77.38 km in the north).

The southern network is characteristic of a logging road in that it does not have a clear destination and instead just keeps extending and branching deeper into closed-canopy forest.

The northern network is more puzzling in that it crosses a proposed palm oil concession (Grupo Romero’s Tierra Blanca project) and terminates at the Alfaro River. Also note several areas of recent deforestation near the road in the northwest corner of the oil palm concession.


TierraBlanca_MAAP_3c_v3
Image 3c. High resolution SPOT 6 images (1.5 m resolution) of portions of the northern and southern road networks. Key data sources: USGS, SPOT 6.

High-resolution zooms

Panel A is a high resolution SPOT 6 image (1.5 m resolution) from August 2014 of a portion of the northern road network.

Panel B is a high resolution SPOT 6 image (1.5 m resolution) from October 2014 of a portion of the southern road network.


Citation

Finer M, Novoa S (2015) Detection of New (Logging?) Roads in the Peruvian Amazon. MAAP: Image #3. Link: https://www.maapprogram.org/2015/04/detection-of-new-road-construction-in-southern-loreto-peru/

MAAP #2: Large-scale Forest Clearing for Cacao in Tamshiyacu, Peru

Image of the Week #2 shows the recent and rapid forest clearing for a new cacao project outside of the town of Tamshiyacu in the northern Peruvian Amazon (Department of Loreto). Specifically, we found that over 2,100 hectares (ha) were cleared between May 2013 and August 2014 in an area known as Fundo Tamshiyacu.

Tamshiyacu_MAAP_Mapa_3a_v6
Image of the Week 2a. Rapid clearing for large-scale agriculture in Tamshiyacu (Loreto, Peru). Key data sources: MINAM, Hansen/UMD/Google/USGS/NASA, USGS.

Map Description 

Background map is a Landsat 8 image (30 m resolution) from July 14, 2014. Green indicates forest cover. Note there is some cloud cover. Data is from USGS.

Black indicates areas that were cleared as of 2000 according to data from the Peruvian Environment Ministry (MINAM 2009). Yellow, orange, and red indicate areas that were cleared from 2000 to 2012 (each color covers a four year period) (Hansen MC et al. 2013 Science 342: 850–53; Data download).

Purple indicates areas that were cleared in 2013 and 2014 based on our analysis of Landsat imagery using CLASlite forest monitoring softwareUsing CLASlite, we found that 2,126 ha were cleared between May 2013 and August 2014 in the cacao project area known as Fundo Tamshiyacu. That is the equivalent to 2,900 soccer fields.

See this article published on mongabay.com for more information on the company that carried out the forest clearing (United Cacao, through its subsidiary in Peru, Cacao del Peru Norte). See this article, also published on mongabay, for more information on the legality of the forest clearing.

Landsat Time-series

Tamshiyacu_MAAP_Mapa_3b_v4
Image 2b. Results of Landsat time series analysis, December 2012 – August 2014. Key sources: USGS.

Image 2b is a series of Landsat images (30 meter resolution) of the recently cleared area that illustrates how the forest clearing unfolded.

In December 2012, the area was predominantly covered by closed-canopy forest.

In June 2013, although the image is cloudy, we detected the first signs of major forest clearing (about 150 ha).

In August 2013, a cloud-free image clearly revealed that forest clearing jumped to 1,000 ha.

Subsequent images in September and October 2013 revealed that forest clearing continued to 1,500 ha and 2,000 ha, respectively.

During the peak clearing between June and September 2013, the clearing rate was approximately 100 ha per week.

The forest clearing halted between November 2013 and June 2014, but in July 2014 we detected some new clearing. This additional clearing in 2014 raised the total cleared area to 2,126 ha.


Cutting Primary Forest 

Tamshiyacu_MAAP_Mapa_3c_v2
Image 2c. Tamshiyacu Landsat time series, 1989 – 2013. See text for definition of primary forest. Key sources: USGS.

Image 2c shows the results of our analysis of another series of Landsat images of the recently cleared area that go further back in time, until 1985. We conducted this analysis to determine whether the clearing described above came at the expense of primary forest.

We defined primary forest as an area that from the earliest available Landsat (in this case an image from 1985) was characterized by dense closed canopy coverage and having a similar spectral signature (NDVI) as areas in remote areas of the Amazon known to be undisturbed.

Using this methodology, we found that nearly 98% of the recently cleared area in Tamshiyacu was primary forest at the start clearing around May 2013.


Much More Forest Clearing to Come?

Tamshiyacu_MAAP_Mapa_3d_v1
Image 2d. Rapid clearing for large-scale agriculture in Tamshiyacu (Loreto, Peru). Key sources: MINAM, Hansen/UMD/Google/USGS/NASA, GOREL, USGS.

Image 2d includes spatial information on proposed cacao and oil palm projects in the Tamshiyacu area (indicated by grey lines). This data was obtained from the Regional Government of Loreto (GOREL). The total area for proposed cacao and oil palm projects around Tamshiyacu is greater than 50,000 ha.


Tamshiyacu_MAAP_Mapa_3e_v1
Image 2e. Landsat time series (1989 – 2012) for Pacific Plantation. See text for definition of primary forest. Key sources: USGS, GOREL.

We conducted a Landsat time-series analysis for the proposed oil palm projects noted above. We refer to these proposed projects as Pacific Plantation because this is how they are labelled in the information obtained from GOREL. As seen in Image 2e, our analysis indicates that 99.3% of the Pacific Plantation project area, or 44,685 ha, is primary forest.


Citation

Finer M, Novoa S (2015) Large-scale Forest Clearing for Cacao and Oil Palm in Tamshiyacu, Peru. MAAP: Image #2. Link: https://www.maapprogram.org/2015/03/image-3-rapid-clearing-for-large-scale-agriculture-in-tamshiyacu-_/


Image #1: Gold Mining Deforestation Continues to Expand in La Pampa (Madre de Dios, Peru)

Image of the Week #1 highlights that gold mining deforestation continues to expand in the southern Peruvian Amazon (Department of Madre de Dios). Most notably, the image illustrates that much of the most recent (2013 – 2015) deforestation occured a) in an area known as La Pampa, b) outside of the legal mining corridor, and c) within the buffer zone of the Tambopata National Reserve.

2015_MDD_MAAP_a1_v6_rose1
Image of the Week 1a. Deforestation in the mining corridor of Madre de Dios in the southern Peruvian Amazon from 2000 – 2015. Key data sources: MINAM, SERNANP, ACCA, Hansen/UMD/Google/USGS/NASA, USGS

Map Description: 

Background map is a Landsat 8 image (30 m resolution) from February 2, 2015. Green indicates forest cover. Note there is some cloud cover. Data is from USGS.

Black indicates areas that were deforested as of 2000 according to data from the Peruvian Environment Ministry (MINAM 2009). Yellow, orange, and red indicate areas that were deforested from 2000 to 2012 (each color covers a four year period) (Hansen MC et al. 2013 Science 342: 850–53; Data download).

Purple indicates areas that were deforested between January 2013 and February 2015 based on our analysis of Landsat imagery using CLASlite forest monitoring software.

Data for secondary roads is from Conservación Amazónica-ACCA.

The mining corridor indicates the zone that the Peruvian Government has delimited as potentially legal for mining activities, but only if miners succesfully complete a multi-step formalization process for each project. Data is from ACCA.

Protected areas data is from SERNANP. Dark green indicates established protected areas and light green indicates their buffer zones.

The majority of the forest loss shown on the map is associated with gold mining activity, although some is also associated with the recently paved Interoceanic Highway and its growing secondary roads network.

According to a recent study published in PNAS by Greg Asner et al., the gold mining deforestation in this region increased from 10,000 ha in 2000 to 50,000 hectares (ha) in 2012. This deforestation was concentrated in two primary areas: Huepetuhe/Delta-1 and Guacamayo (A and B on the map, respectively).

More recently, the deforestation has largely shifted to La Pampa (C on the map). This shift is particularly important because La Pampa is within the buffer zone of the Tambopata National Reserve and outside of the designated mining corridor. Using CLASlite, we detected 1,711 ha of deforestation in La Pampa between 2013 and 2015.

Zoom View of La Pampa

2015_MDD_MAAP_b1_v2_zoom
Image 1b. Zoom view of La Pampa mining zone within the buffer zone of the Tambopata National Reserve. Key data sources: MINAM, SERNANP, Hansen/UMD/Google/USGS/NASA, ACCA, USGS

Image 2b is a zoom view of the La Pampa area provided to better illustrate the most recent deforestation within the Tambopata National Reserve buffer zone. As noted above, using CLASlite we detected 1,711 ha of deforestation within the La Pampa area between 2013 and 2015. That is the equivalent to more than 2,300 soccer fields.

Note that much of the most recent deforestation is within 6 km of the Tambopata National Reserve.

Near Real-time Monitoring

2015_MDD_MAAP_c1_v3
Image 1c. Near real-time deforestation monitoring in La Pampa. Key data sources: SERNANP, USGS, ACCA

Thanks to a series of relatively cloud-free Landsat images, we were able to conduct near real-time analysis with CLASlite during 2014 and 2015.

For example, we found that between mid-October 2014 and early February 2015 (about four months) there was deforestation of 226.5 ha in La Pampa within the buffer zone of the Tambopata National Reserve. That is the equivalent to 310 soccer fields, a rate of over 2.5 fields a day.

Prior to that time period, we found that between mid-August  and mid-October 2014 (abount nine weeks), there was deforestation of 431 ha in La Pampa.

Citation

Finer M, Novoa S (2015) Gold Mining Deforestation Continues to Expand in La Pampa (Madre de Dios, Peru). MAAP: Image #1. Link: https://www.maapprogram.org/2015/03/gold-mining-deforestation-expand-peruvian-amazon/