Here, in MAAP #10, we show the results of a deforestation analysis of two sectors of Bahuaja Sonene National Park and its surrounding buffer zone. The Park, which covers an area of more than 1.6 million hectares in the regions of Puno and Madre de Dios in the southern Peruvian Amazon, is an area of high biological diversity.
Specifically, we found increasing deforestation in 1) the buffer zone of the Park’s western section (Loromayo sector) and 2) inside the Park’s southeastern section (Colorado sector). In both cases, we identified shifting cultivation associated with coca cultivation as one of the main drivers of deforestation.
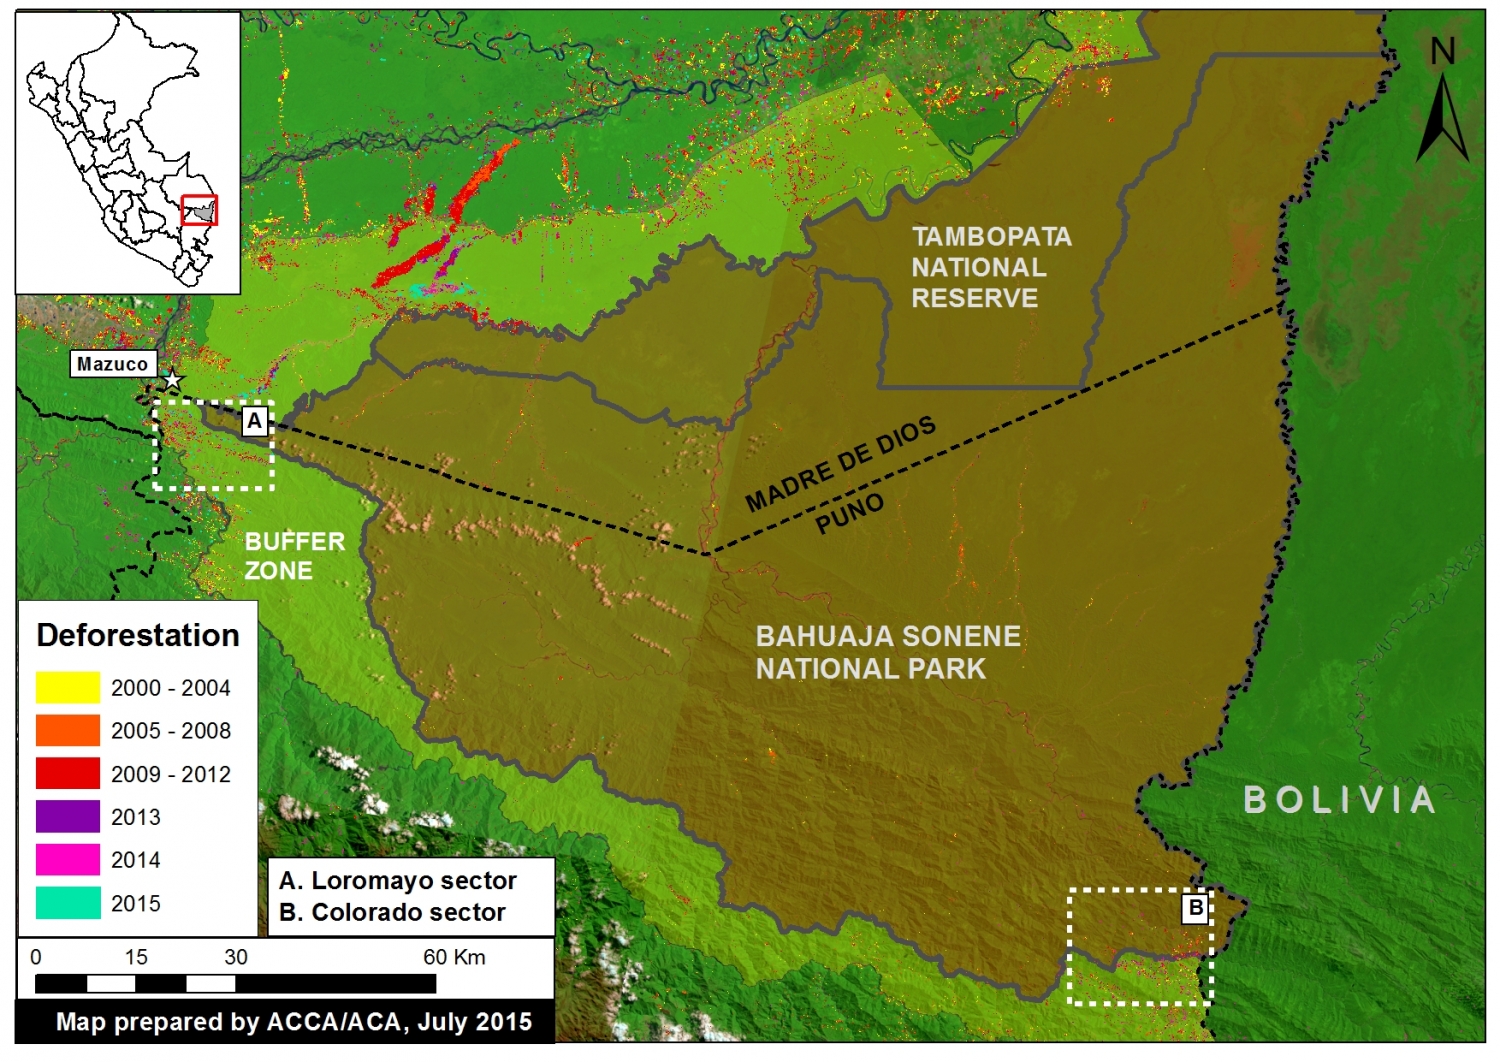
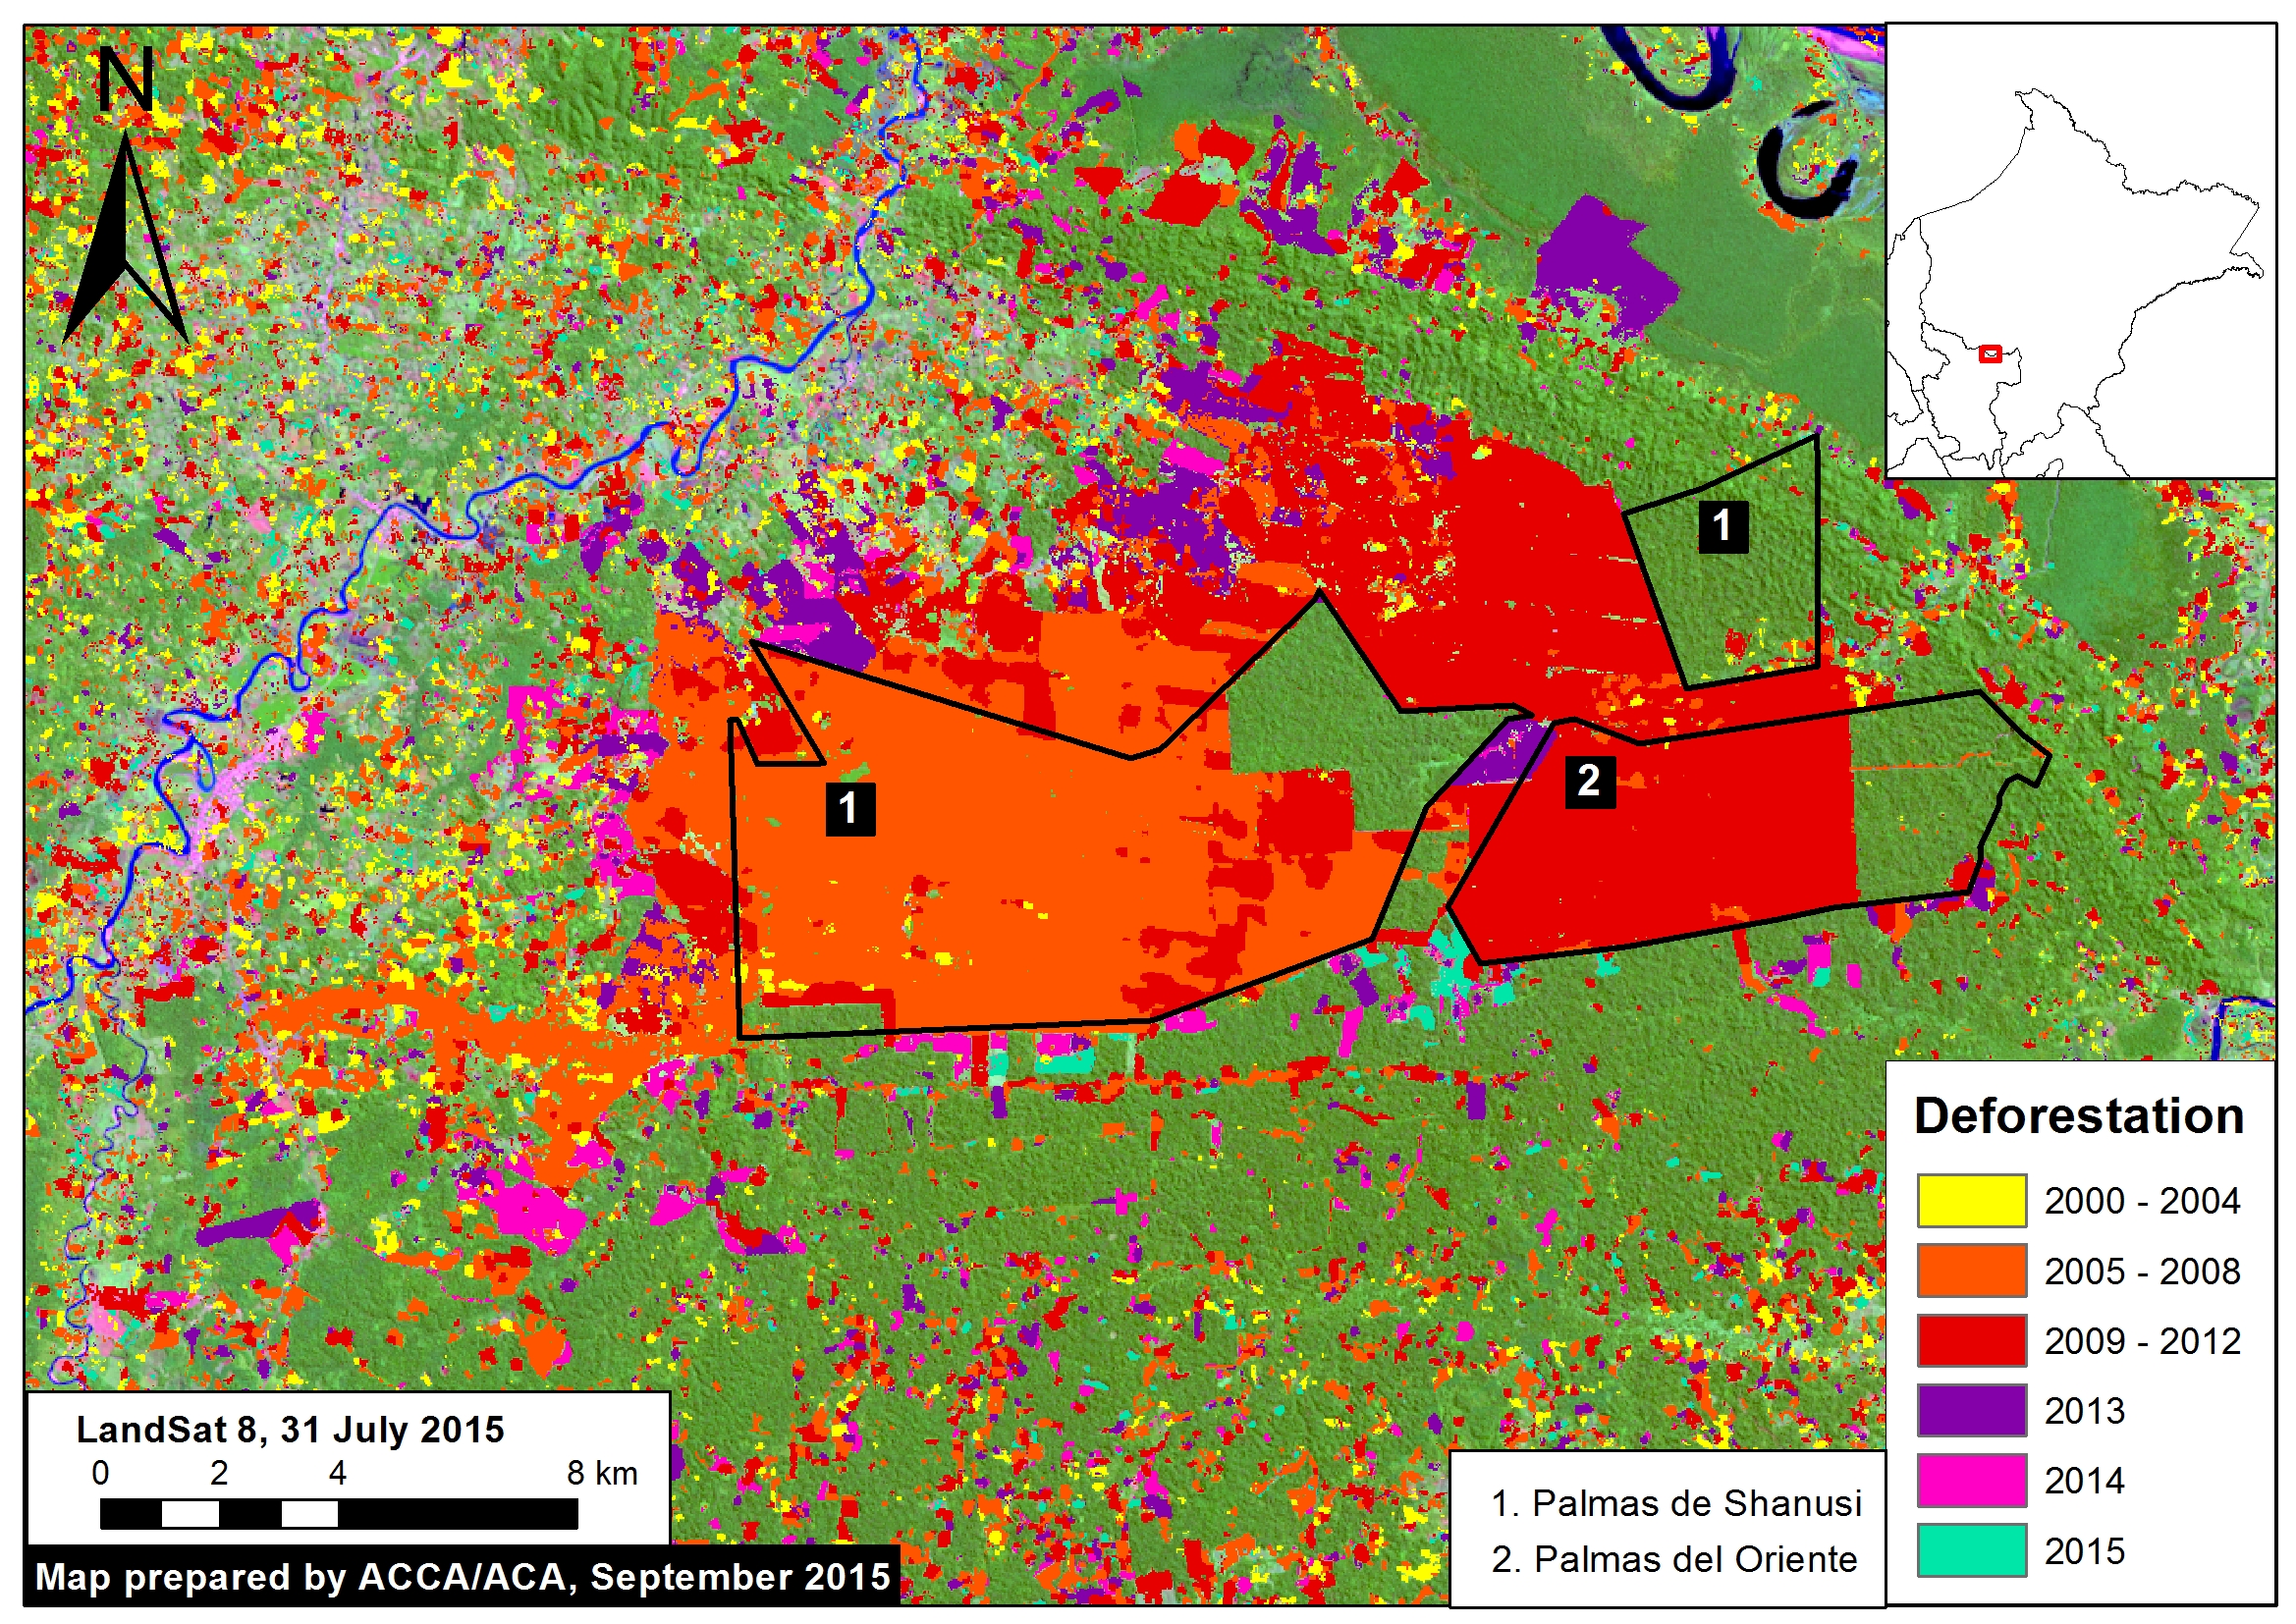
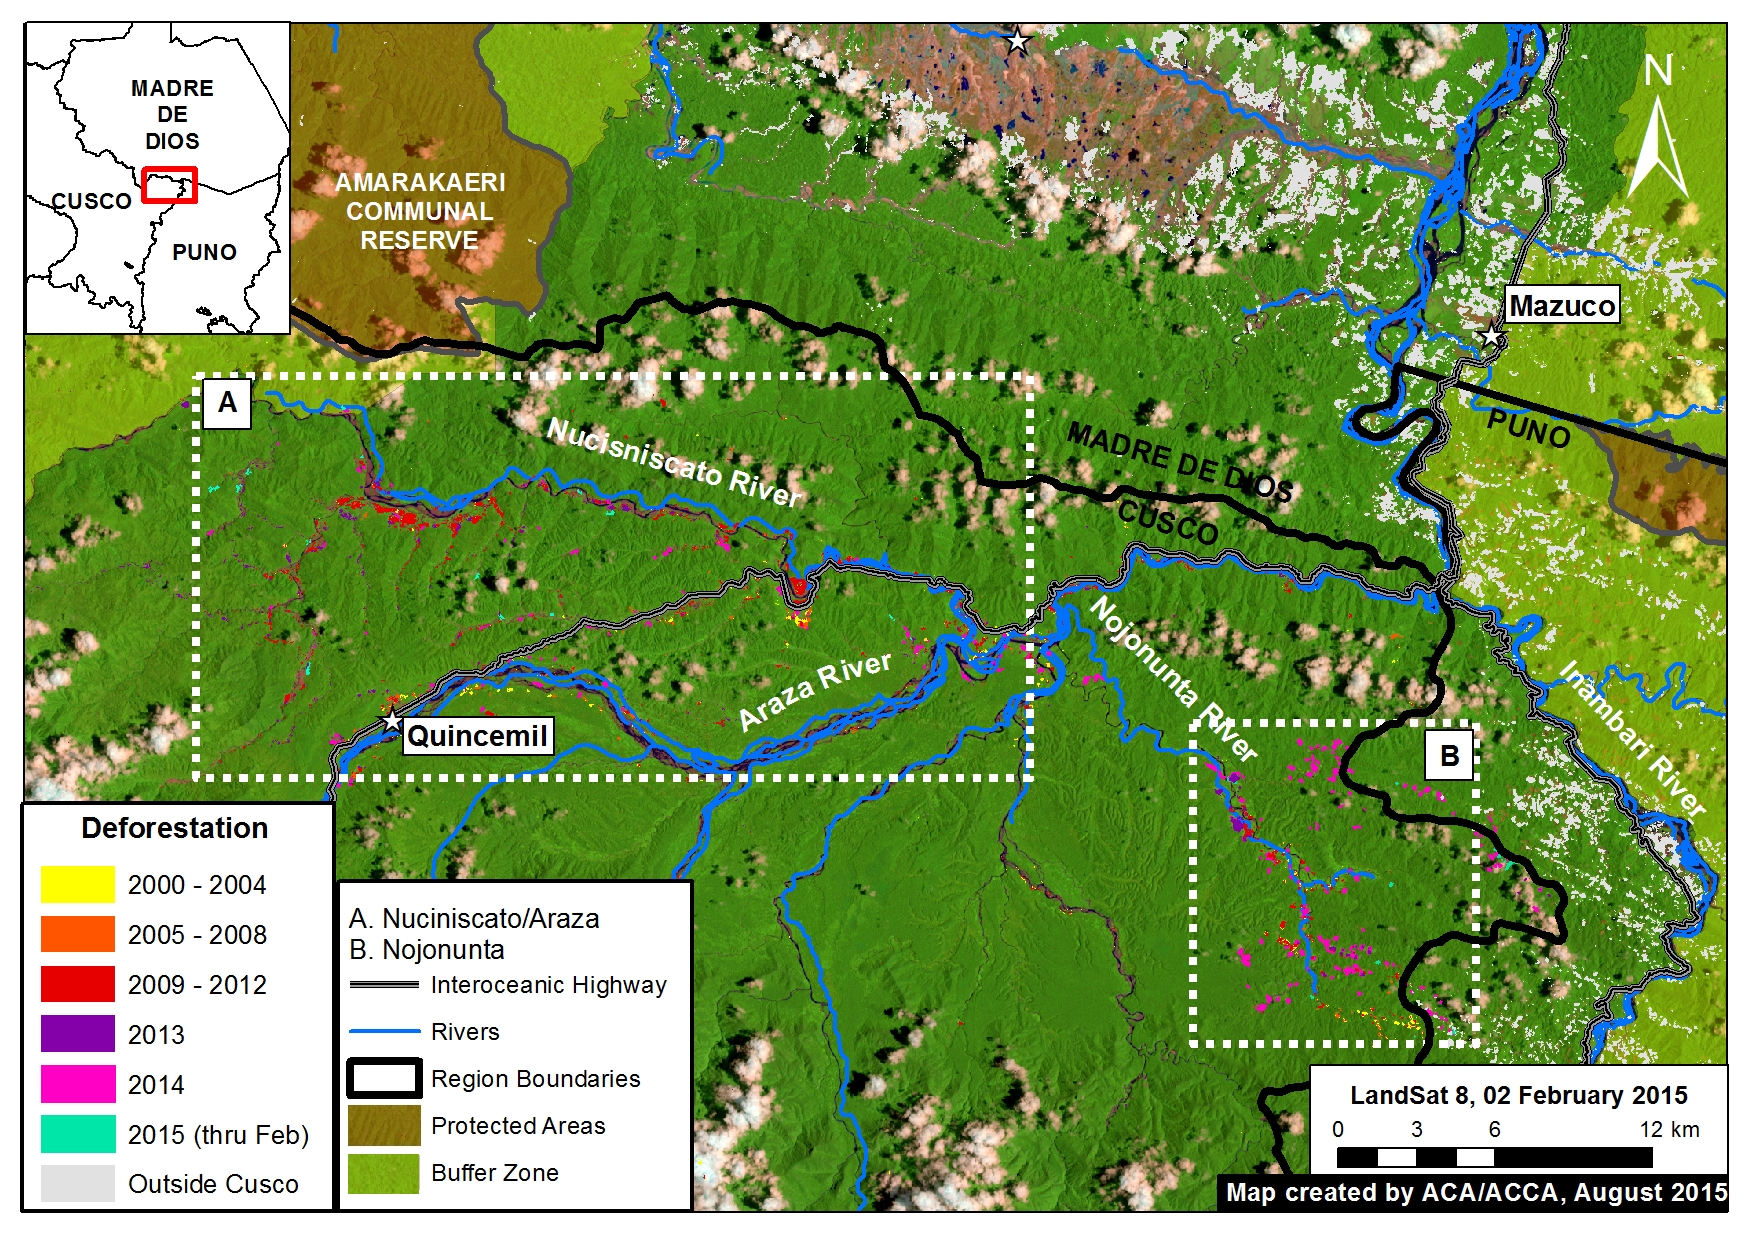
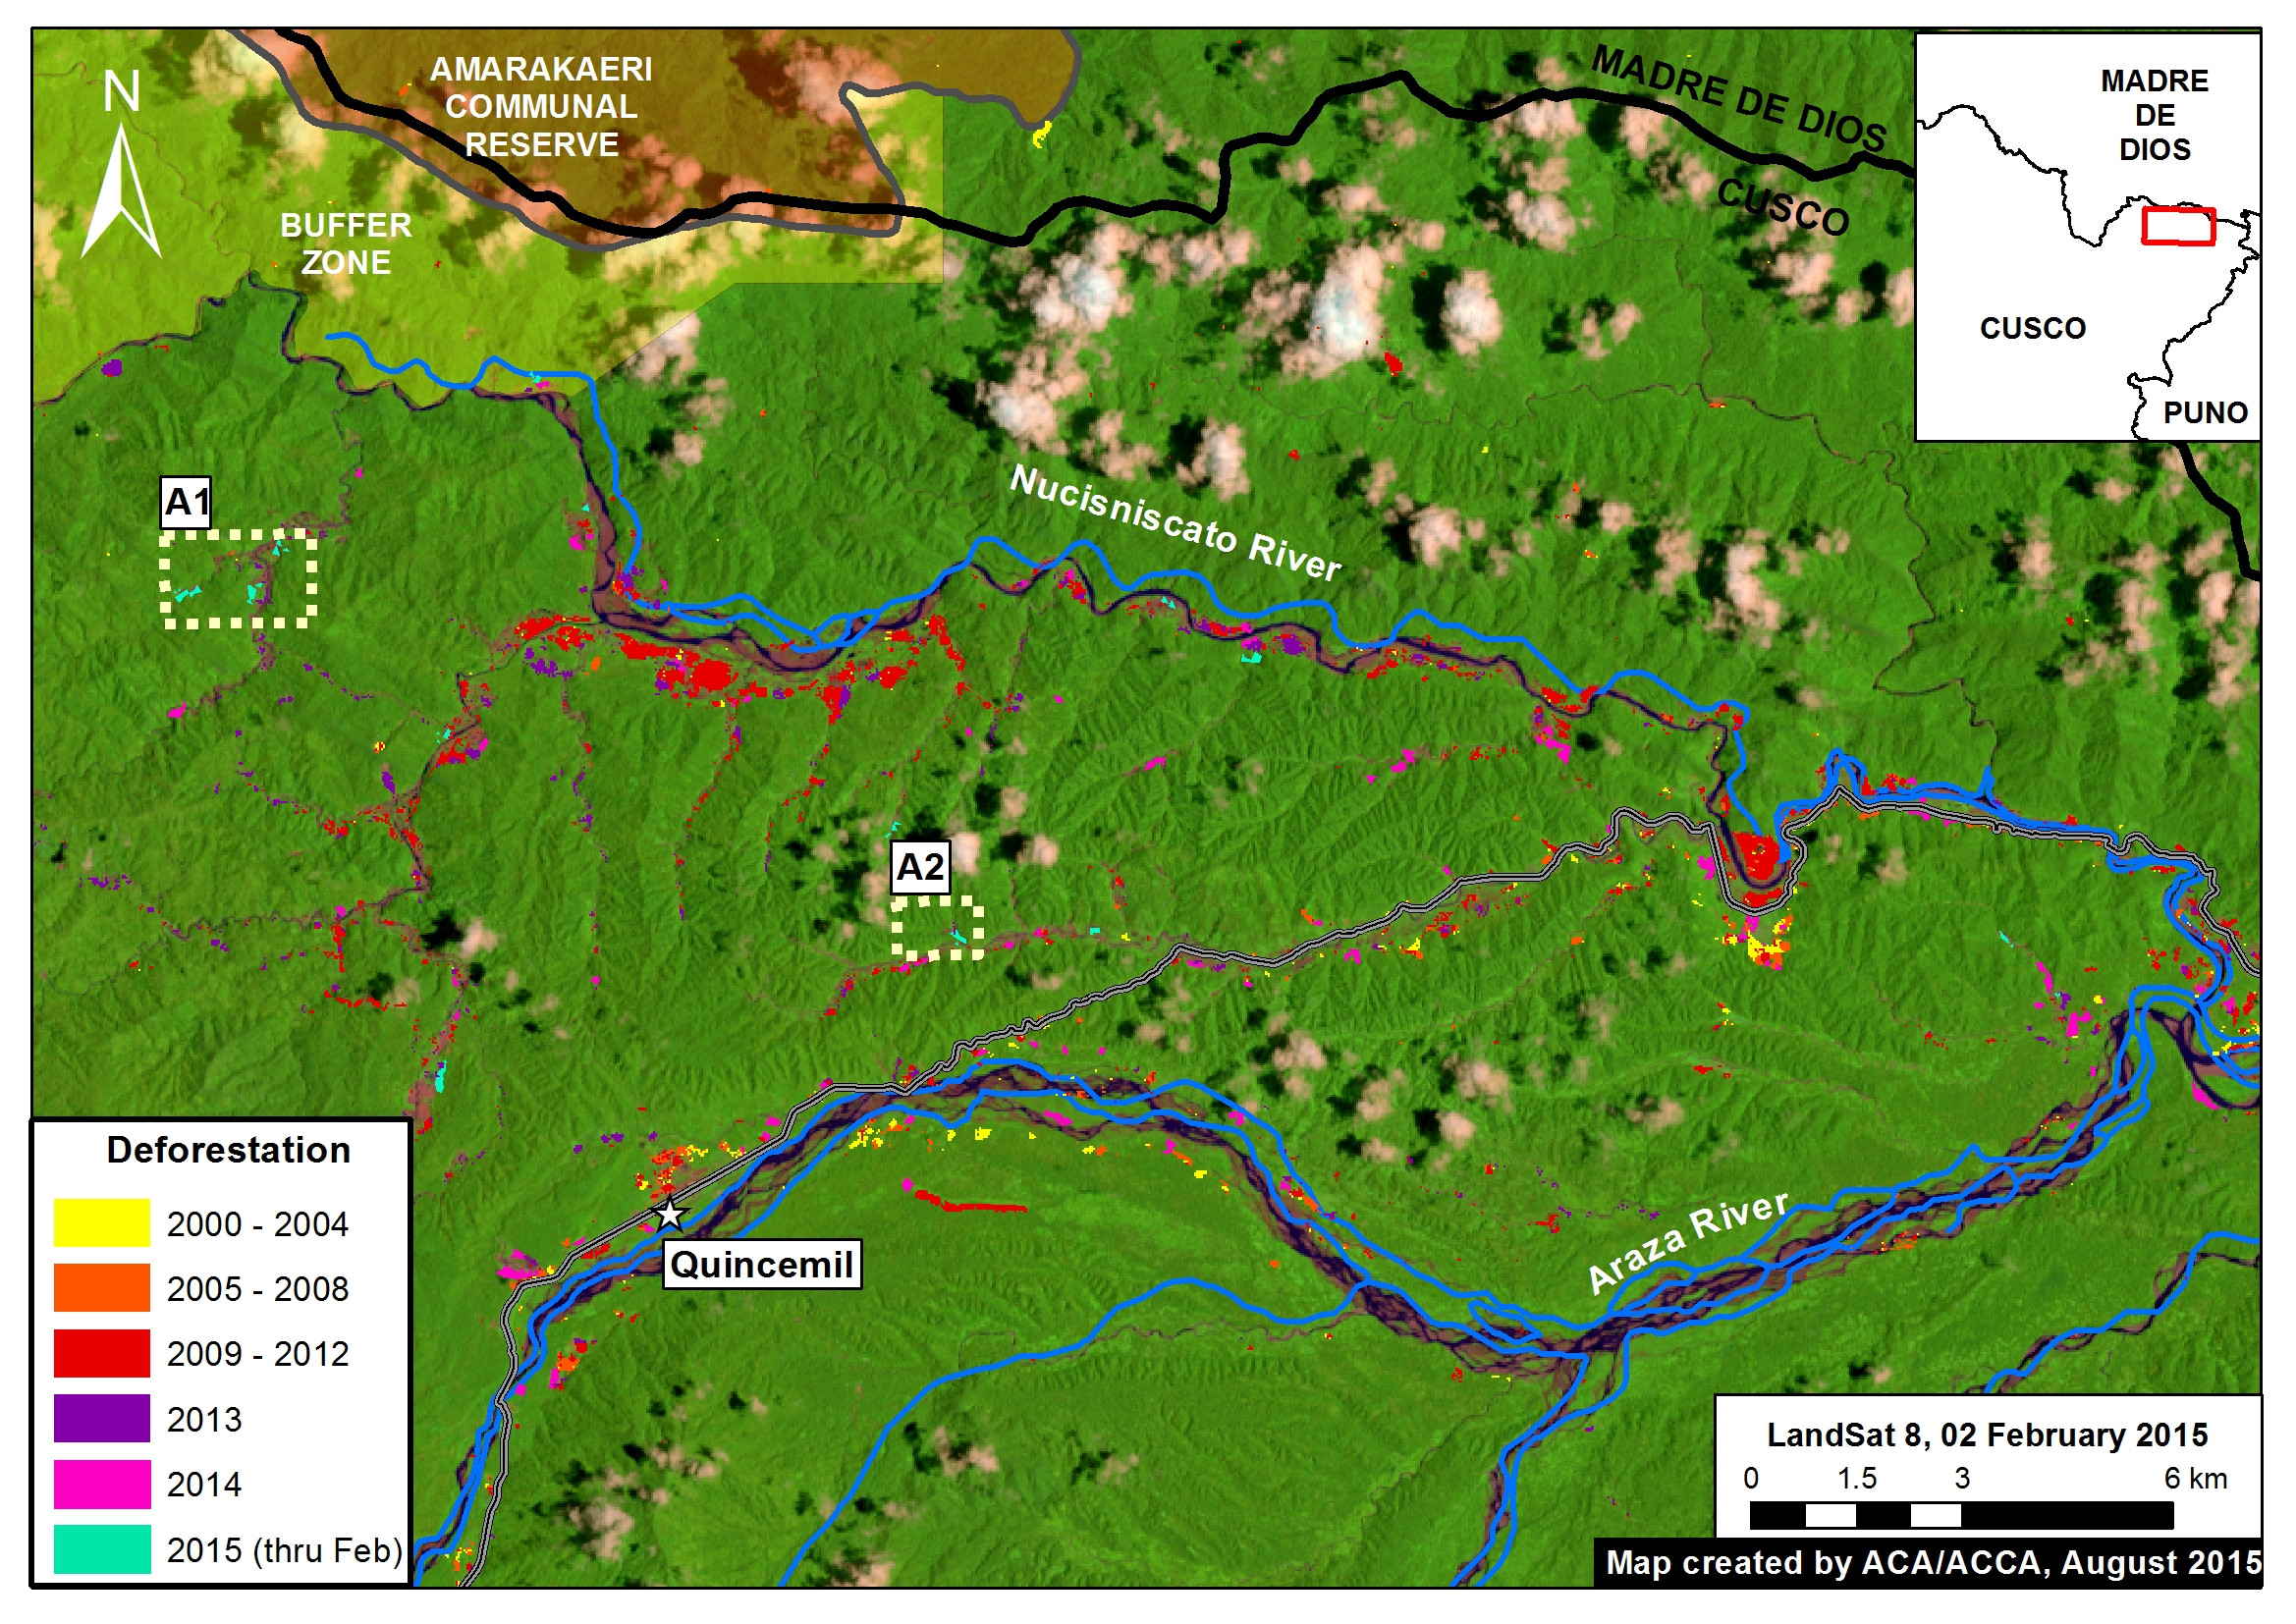
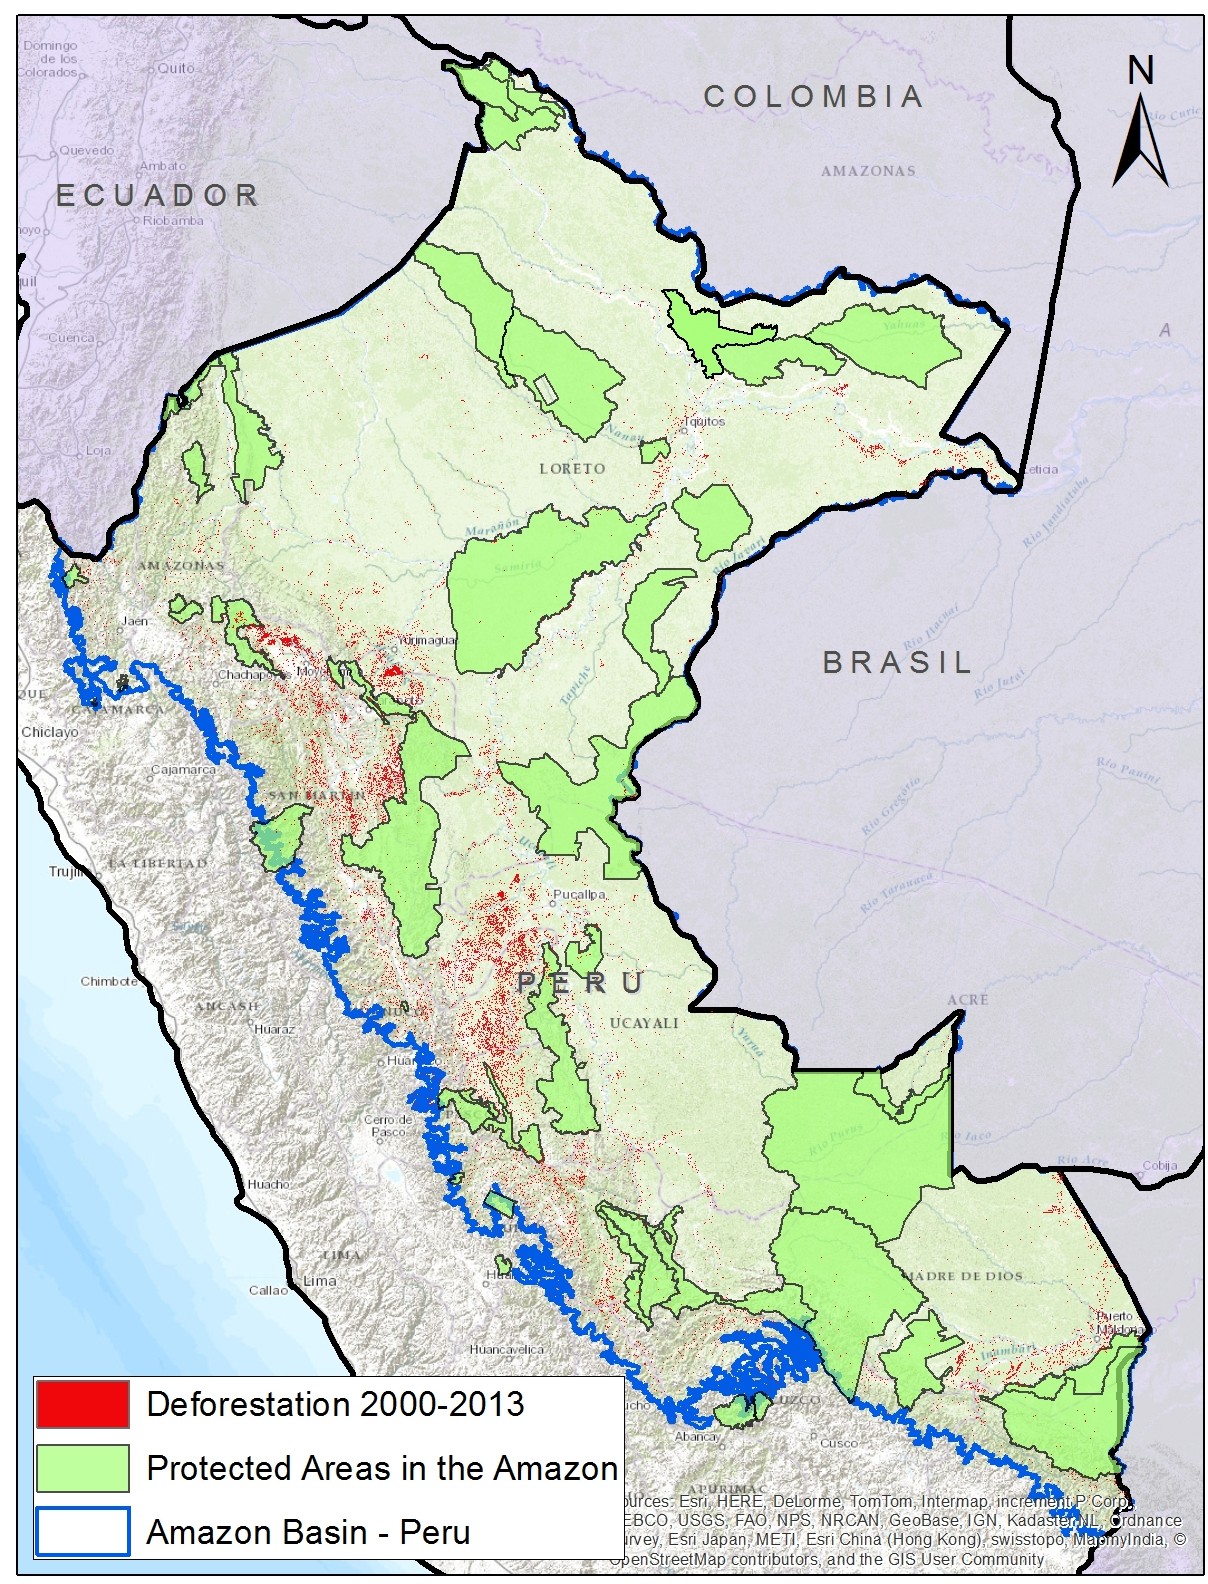
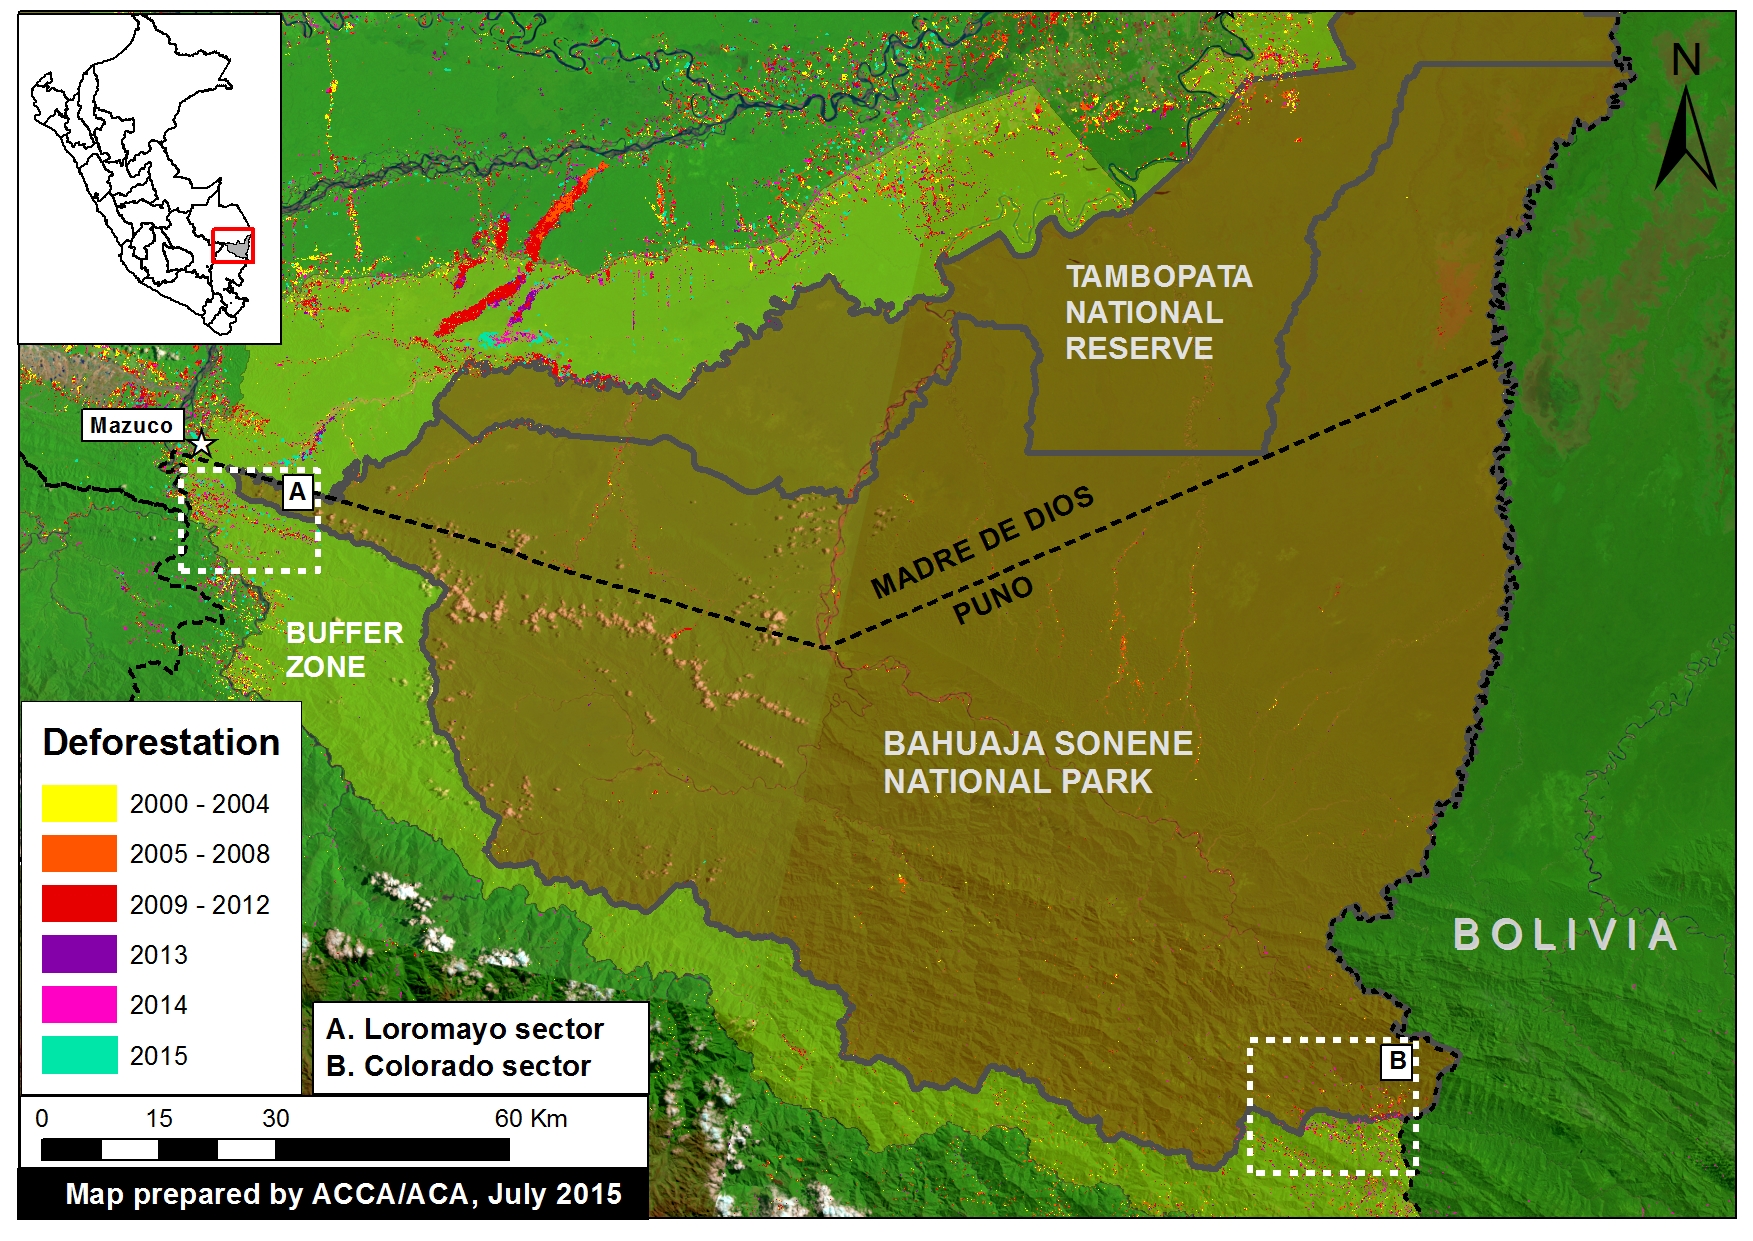
Image 10a. Deforestation detected in and around Bahuaja Sonene National Park and its buffer zone. Please note that Zooms “A” and “B” are described in more detail below. Data: SERNANP, PNCB, USGS.
Key Results
We highlight two key areas within and around Bahuaja Sonene National Park where deforestation grew substantially between 2013 and 2015:
1) Sector Loromayo, located in the buffer zone immediately outside the western section of the Park (see Zoom A). We estimate that more than 1,000 hectares (ha) were deforested since 2010, peaking in 2014 (331 ha). This expanding deforestation entered the Park in 2014.
2) Sector Colorado, located in the southeastern section of the Park (see Zoom B). We estimate, between 2001 to 2014, the deforestation of over 530 hectares inside the Park and over 1,170 hectares in the surrounding buffer zone. As in Loromayo, there was a notable increase in deforestation starting in 2010, with the peak occurring in 2014.
In both sectors, Loromayo and Colorado, we identified that one of the main drivers of deforestation is coca cultivation.
Description of Data
In the following maps:
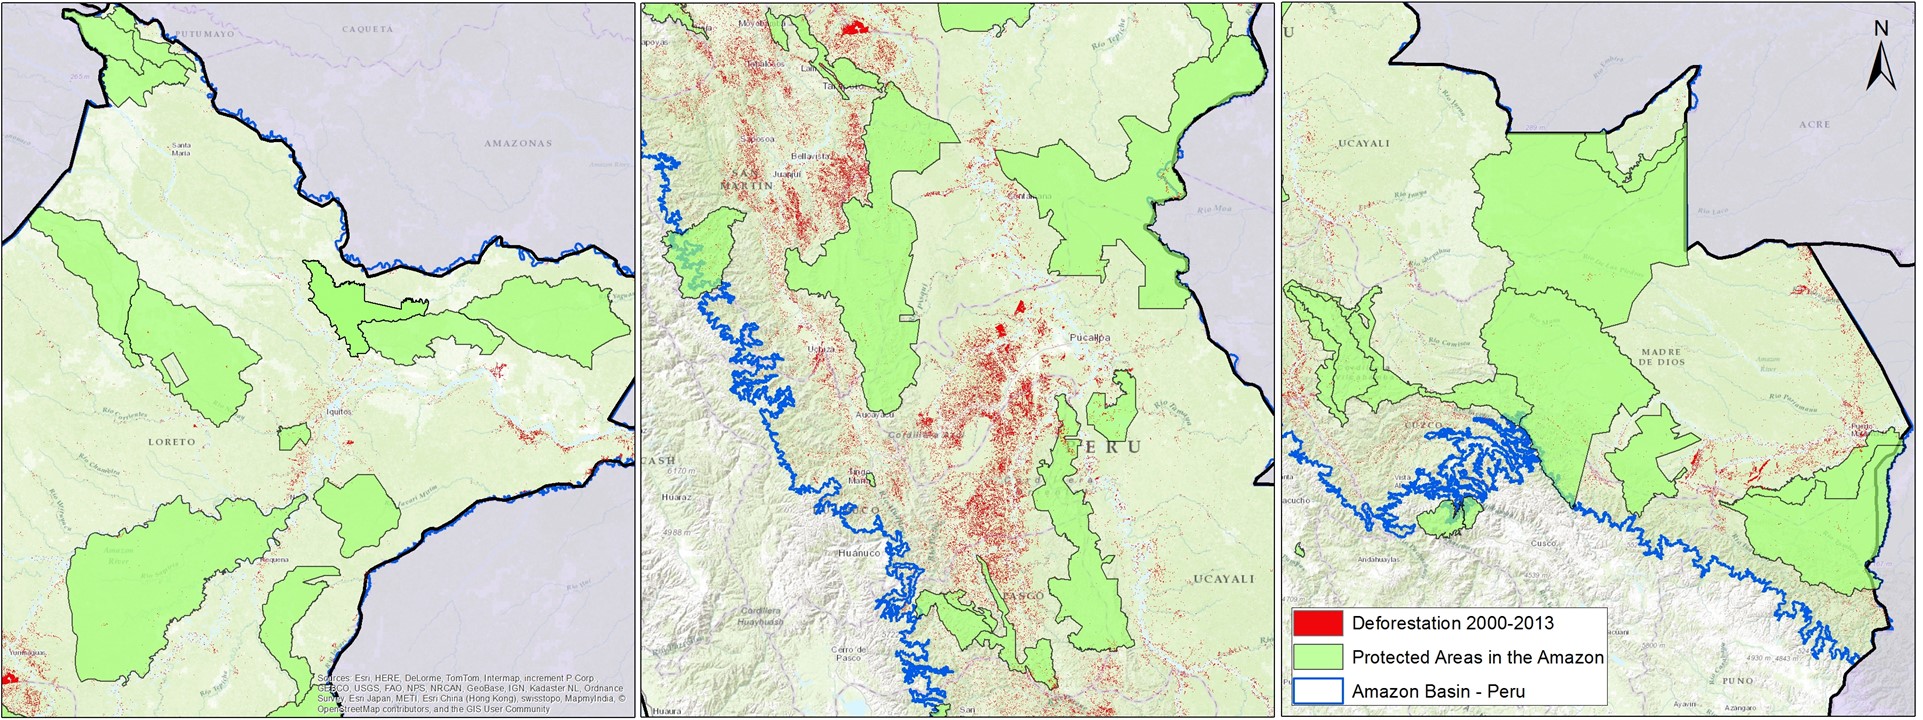
Any variation of green in the satellite imagery indicates areas of forest cover.
Yellow (2000-2004), orange (2005-2008), red (2009-2012), and purple (2013) indicate areas that were deforested between 2000 and 2013 according to data from the National Program of Forest Conservation for the Mitigation of Climate Change (PNCB) of the Ministry of the Environment of Peru.
The colors pink (2014) and turquoise (2015) indicate areas that were deforested in the last two years based on our analysis of Landsat imagery using CLASlite forest monitoring software.
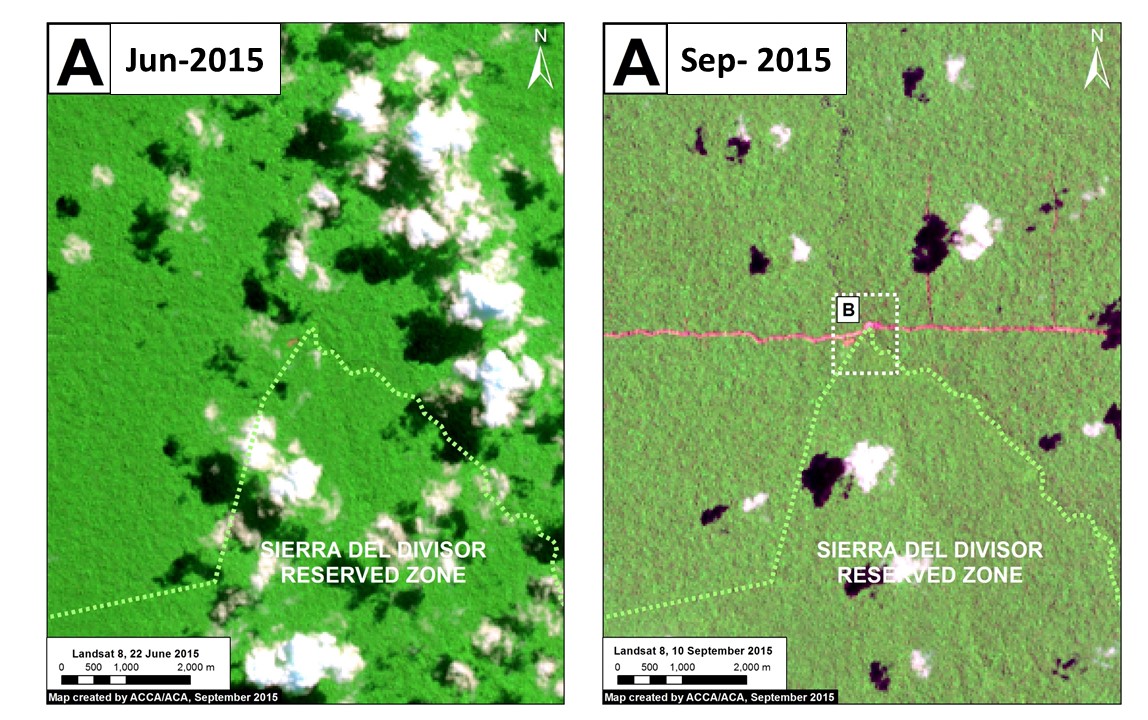
Zoom A: Loromayo River (western buffer zone)
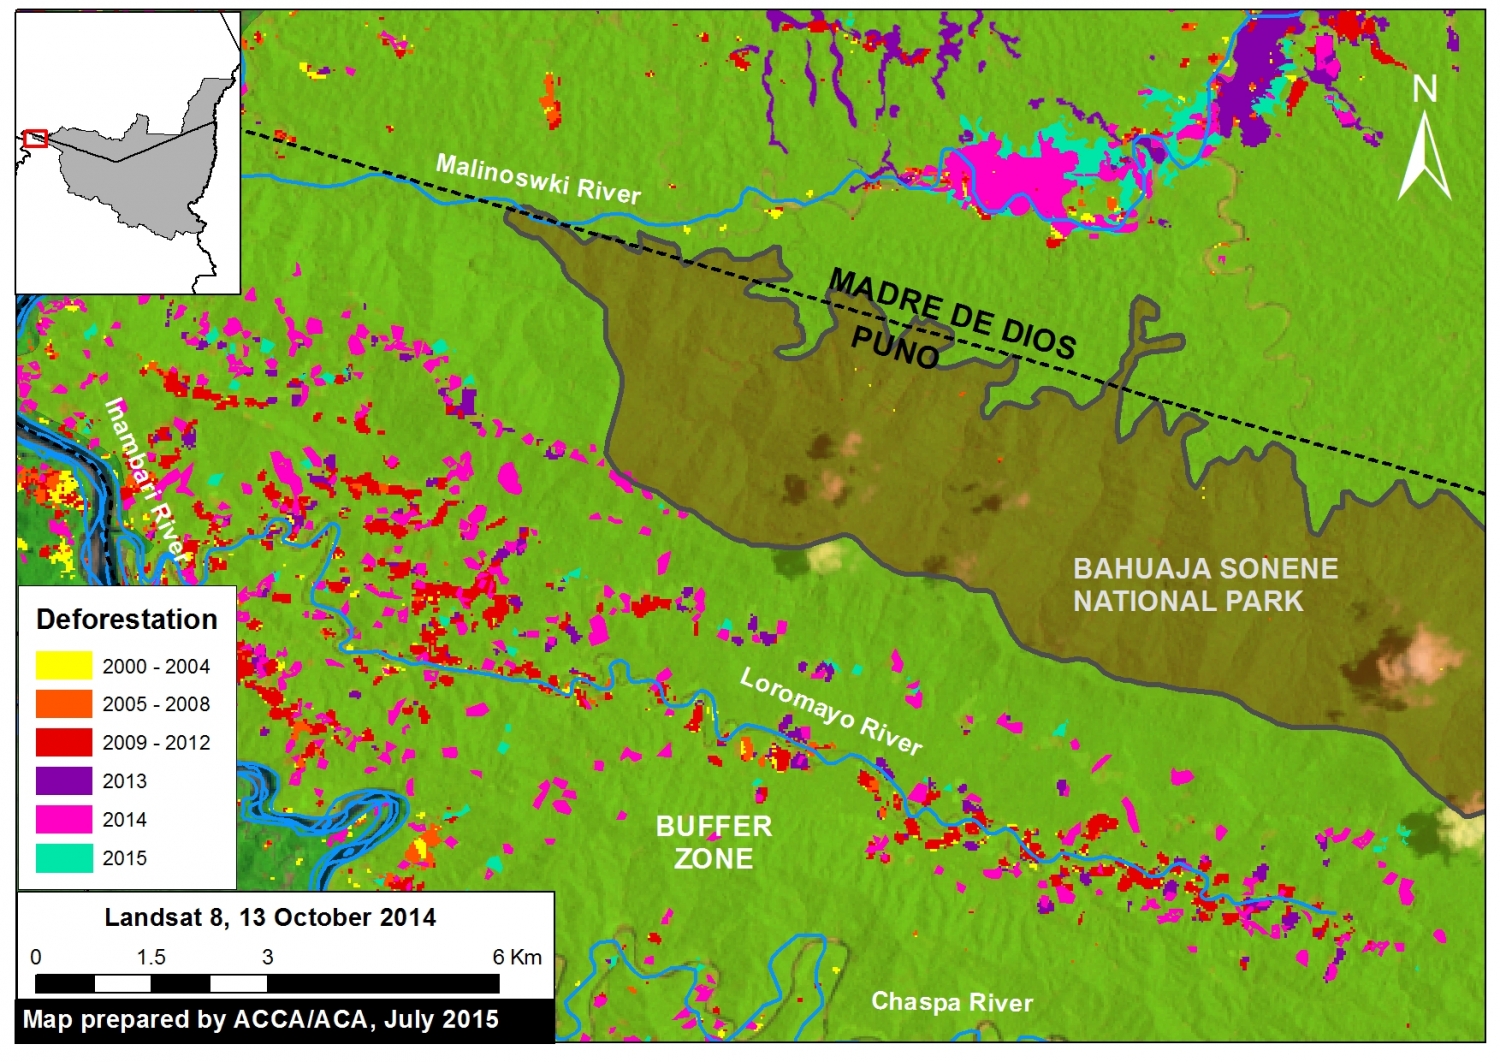
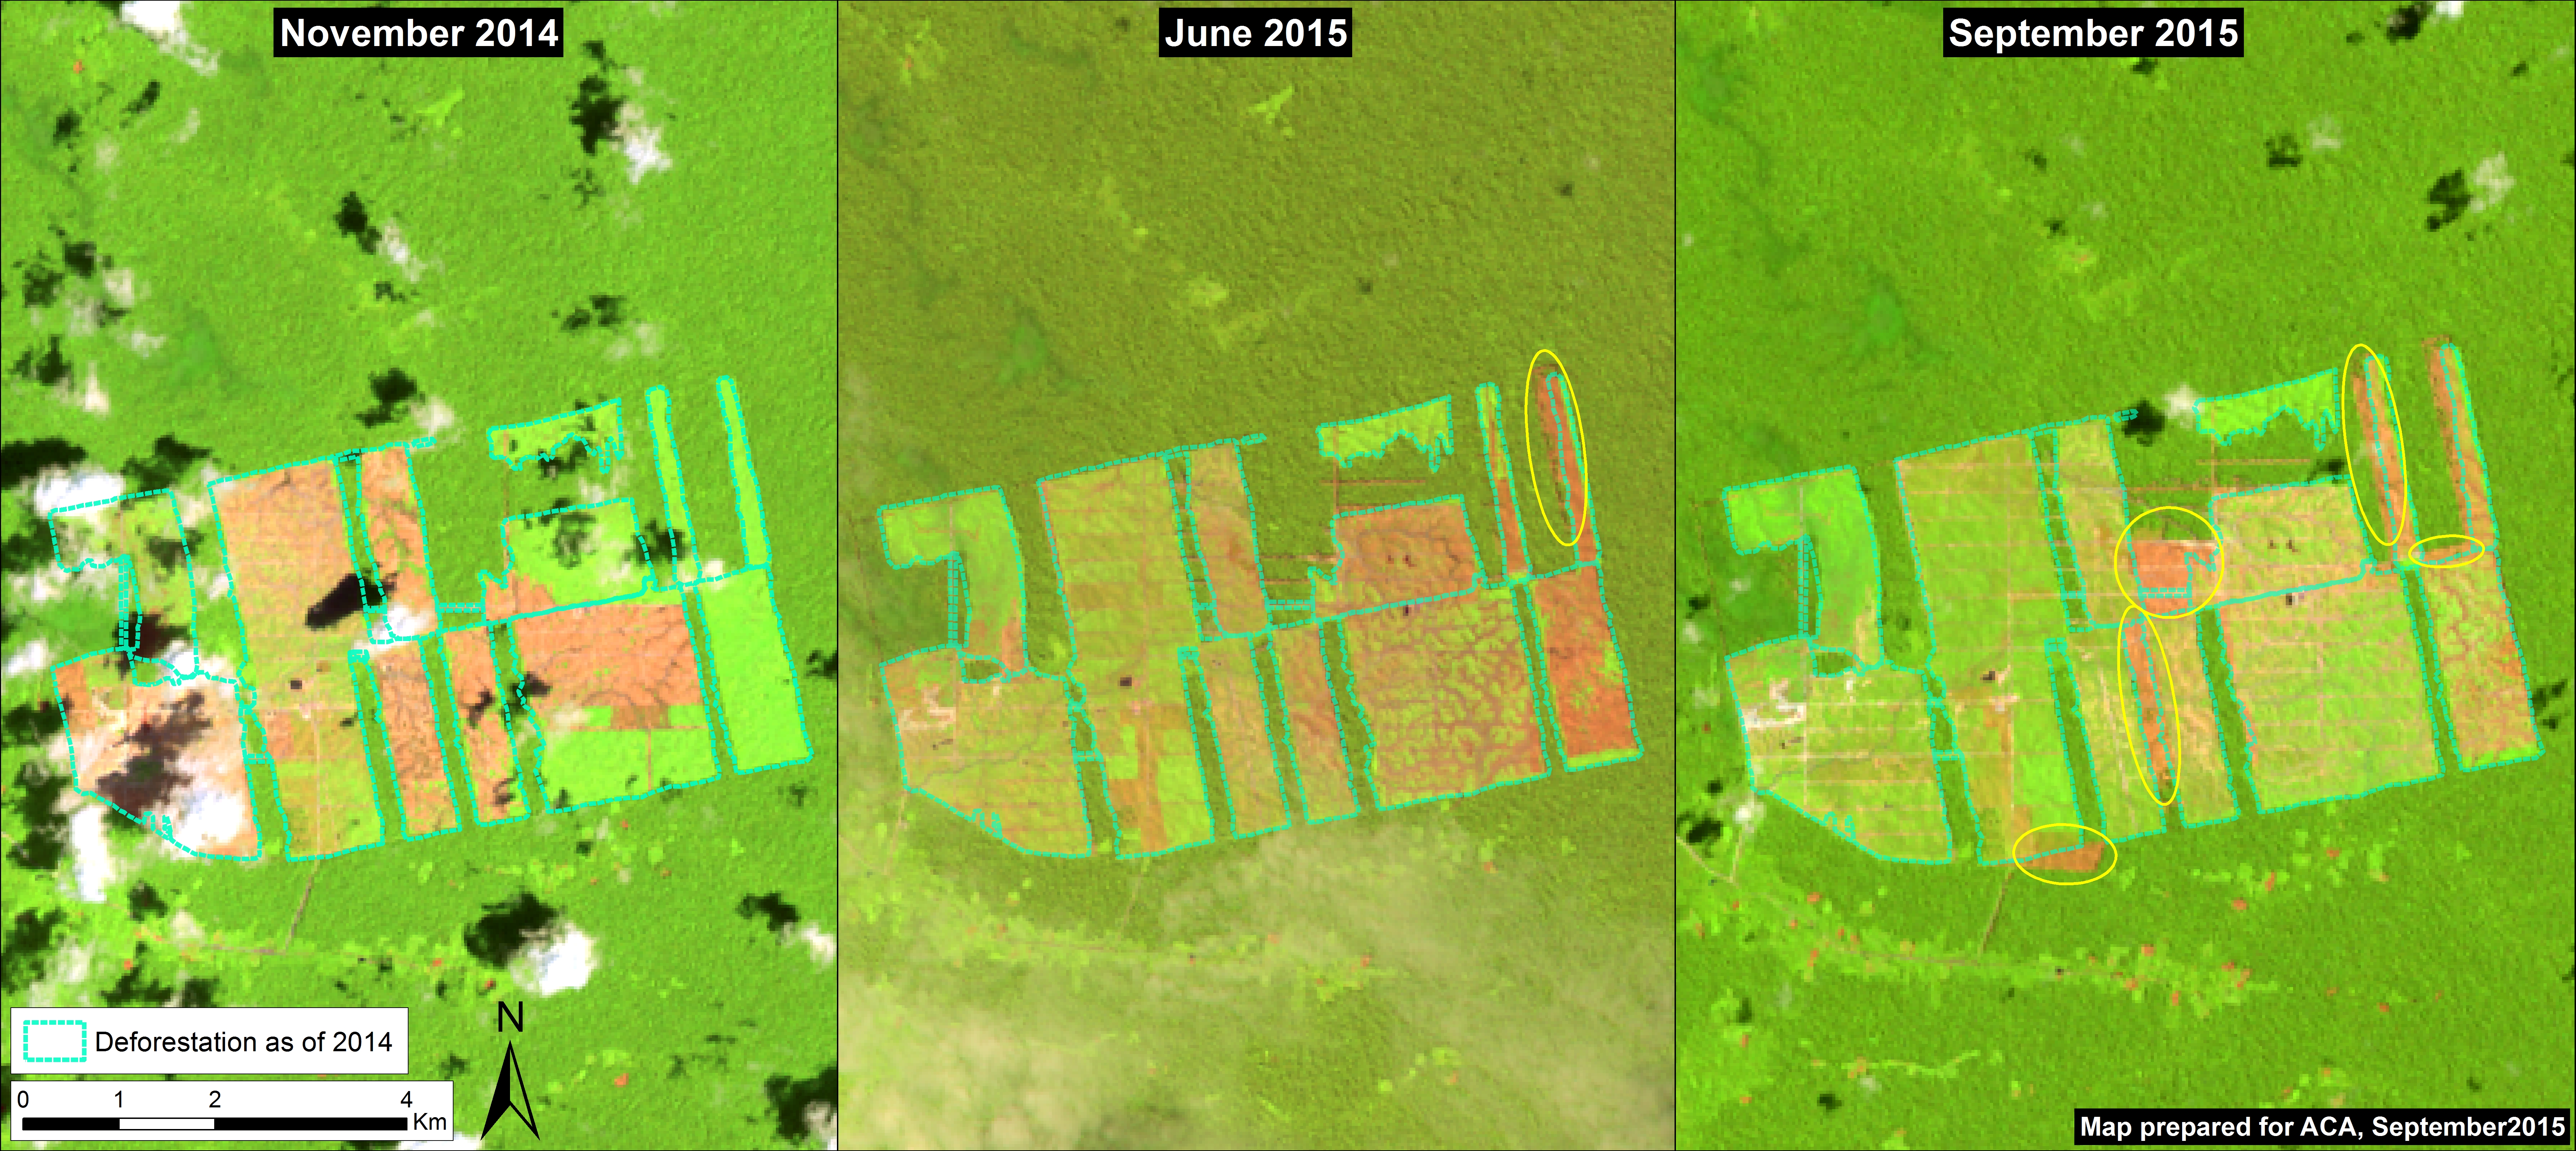
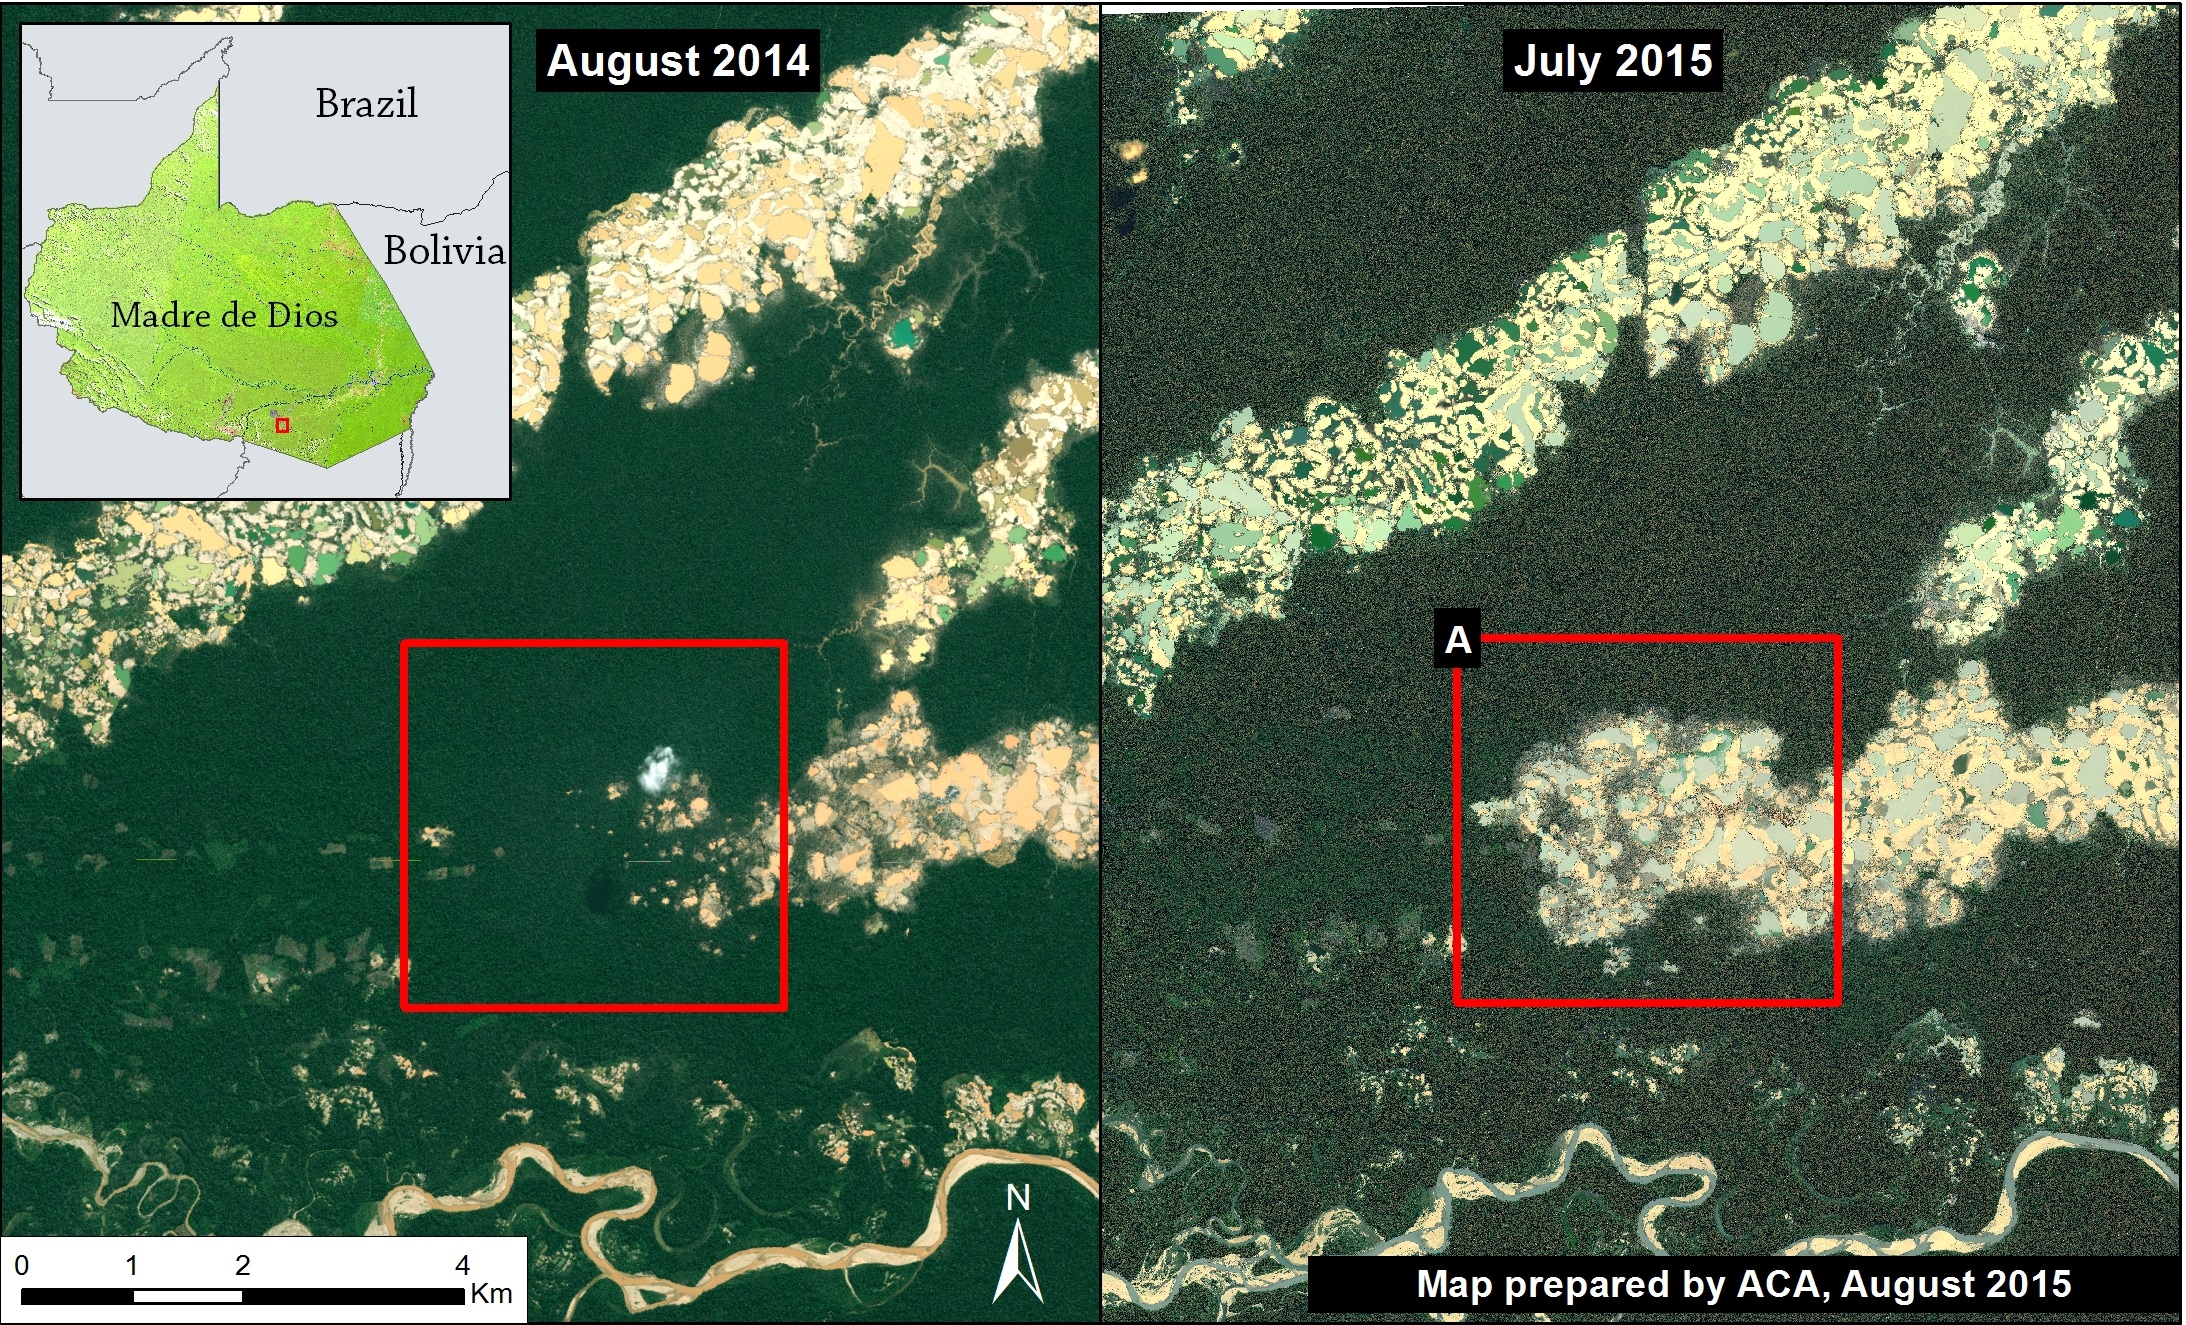
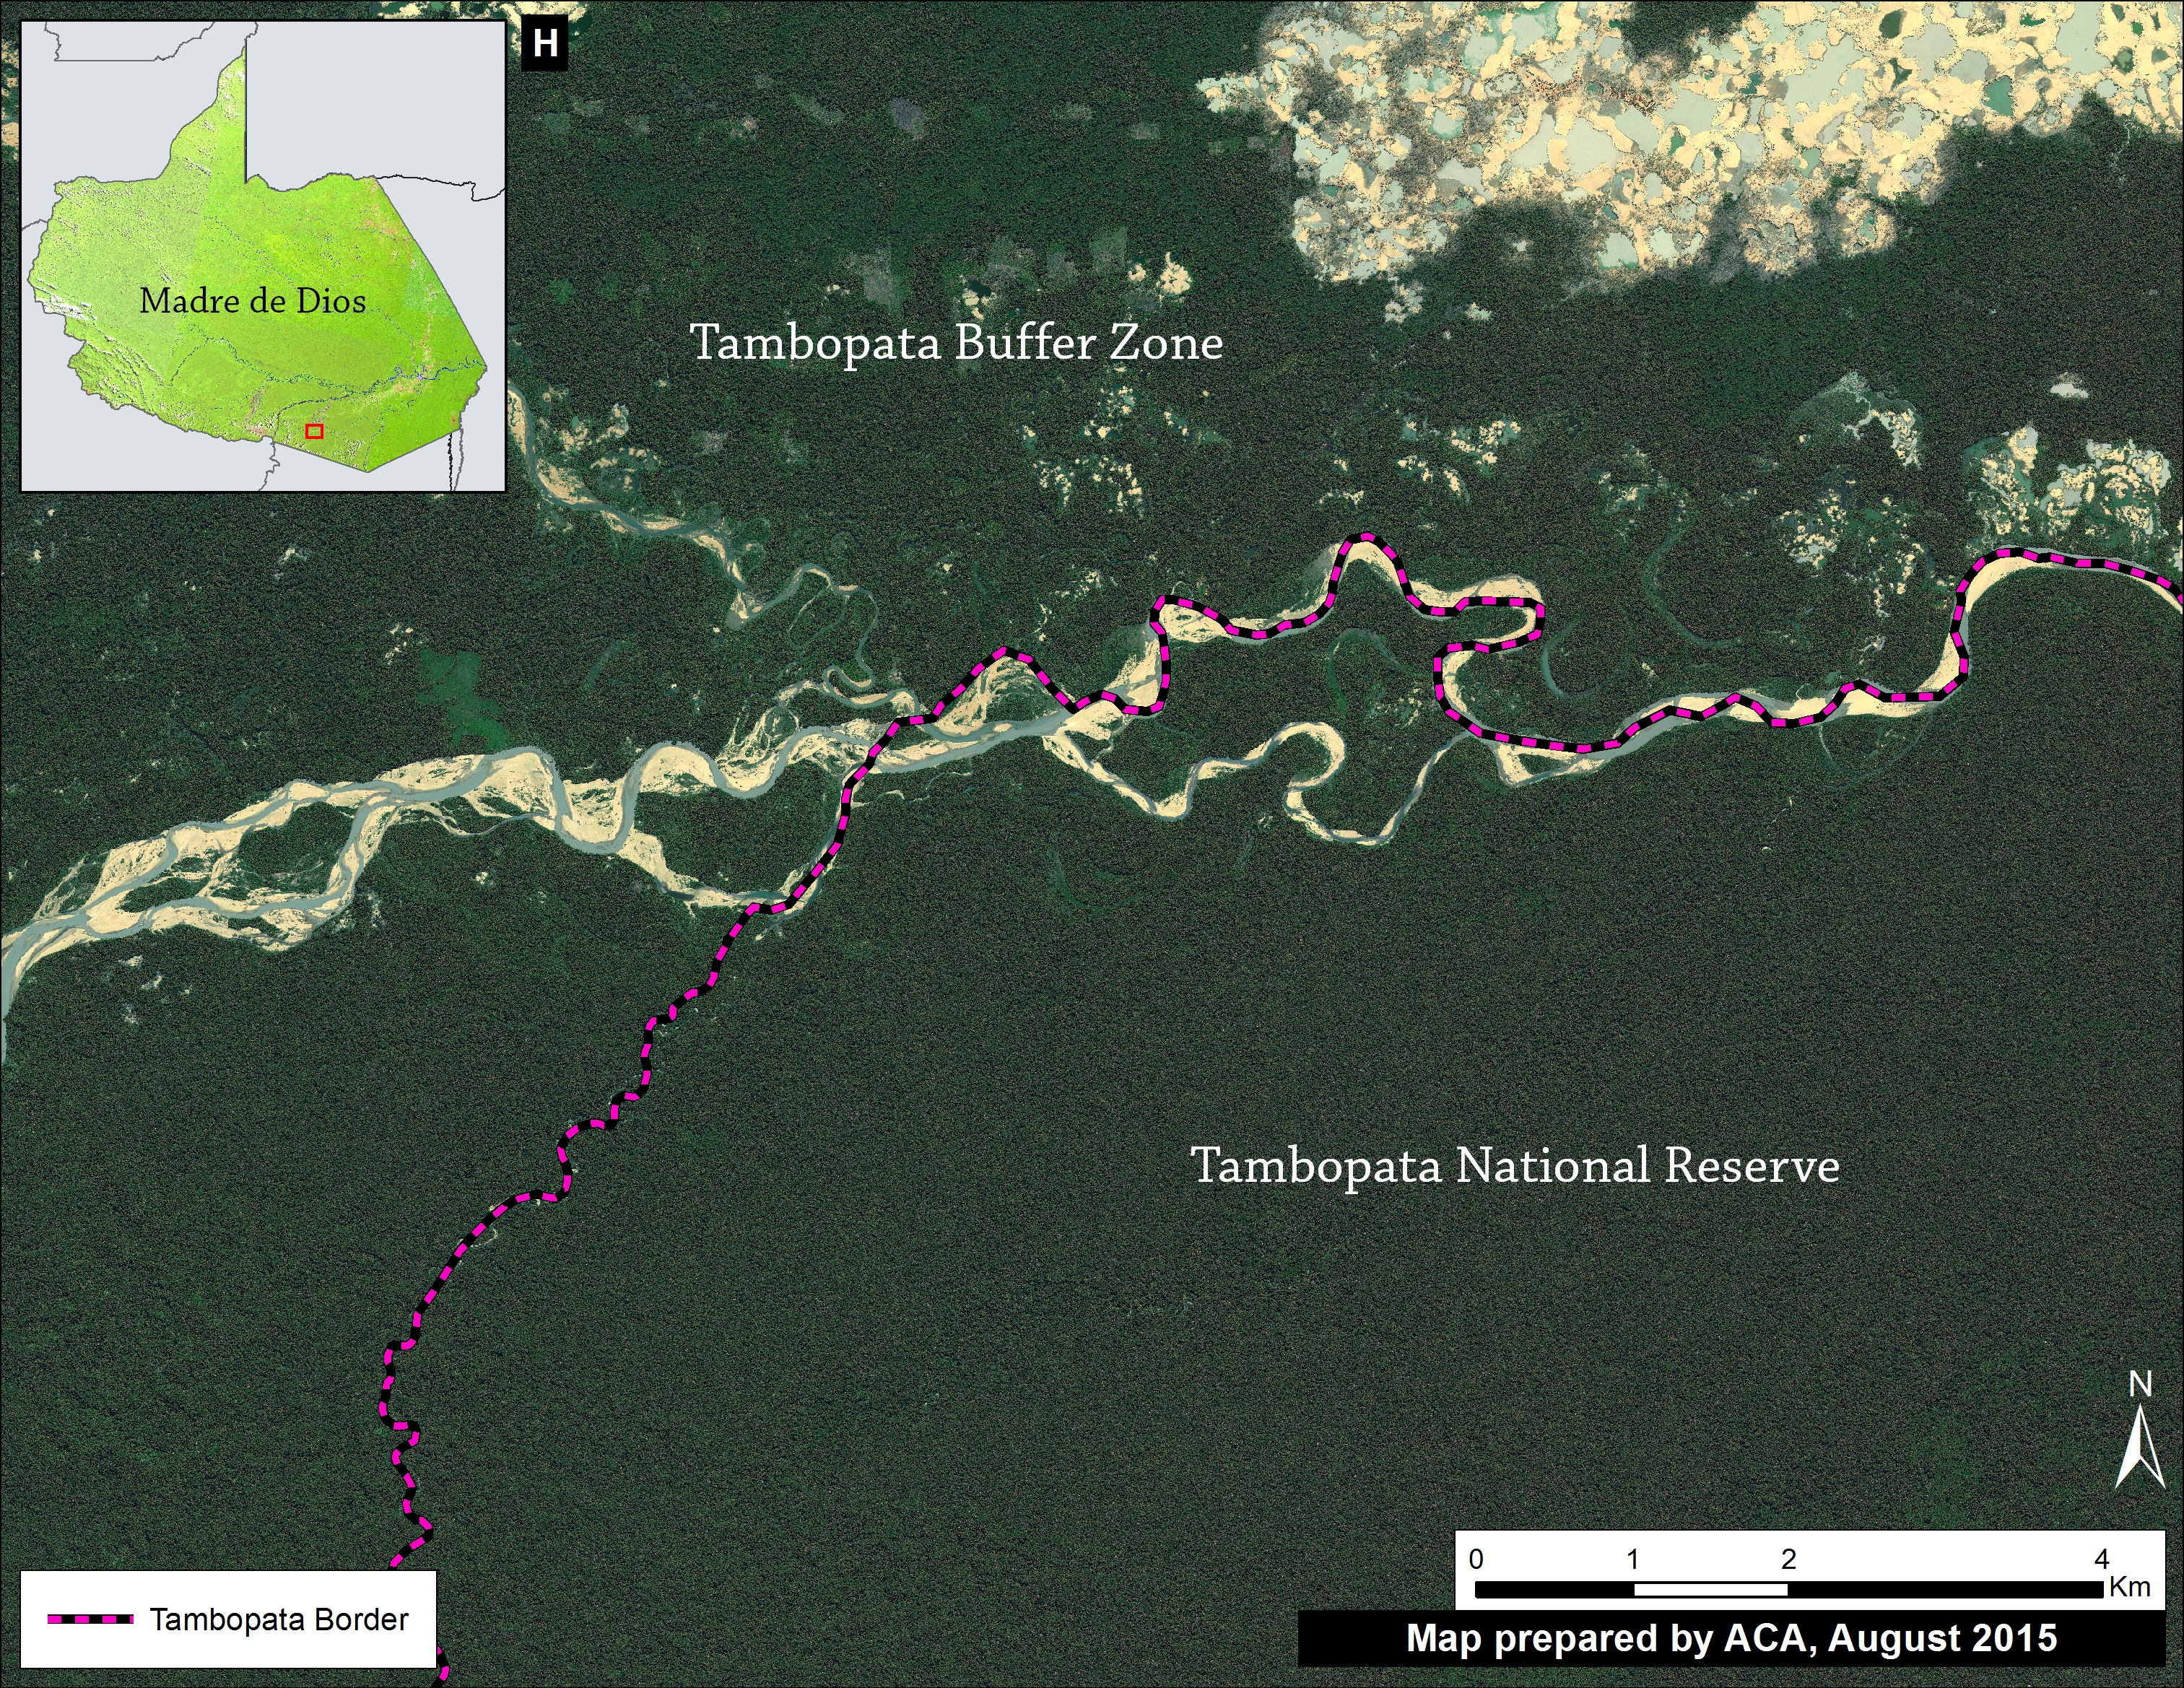
Image 10b. The expansion of deforestation along the Loromayo river in the buffer zone to the west of Bahuaja Sonene National Park. Data: SERNANP, USGS, IBC, PNCB.
As shown in Figure 10b, we identified a striking pattern of deforestation in the sector Loromayo, located between the Malinowski and Chaspa rivers in the Park’s western buffer zone in the department of Puno. Note that the deforestation entered the Park in 2014.
In this area, we documented the deforestation of 1,005 hectares since 2010. This deforestation peaked in 2014, with 331 hectares, including 1.8 hectares within the Park. Not much data is yet available for 2015.
Please note that we previously reported on the advance of gold mining deforestation seen in Image 10b along the Malinowski River in MAAP #5.
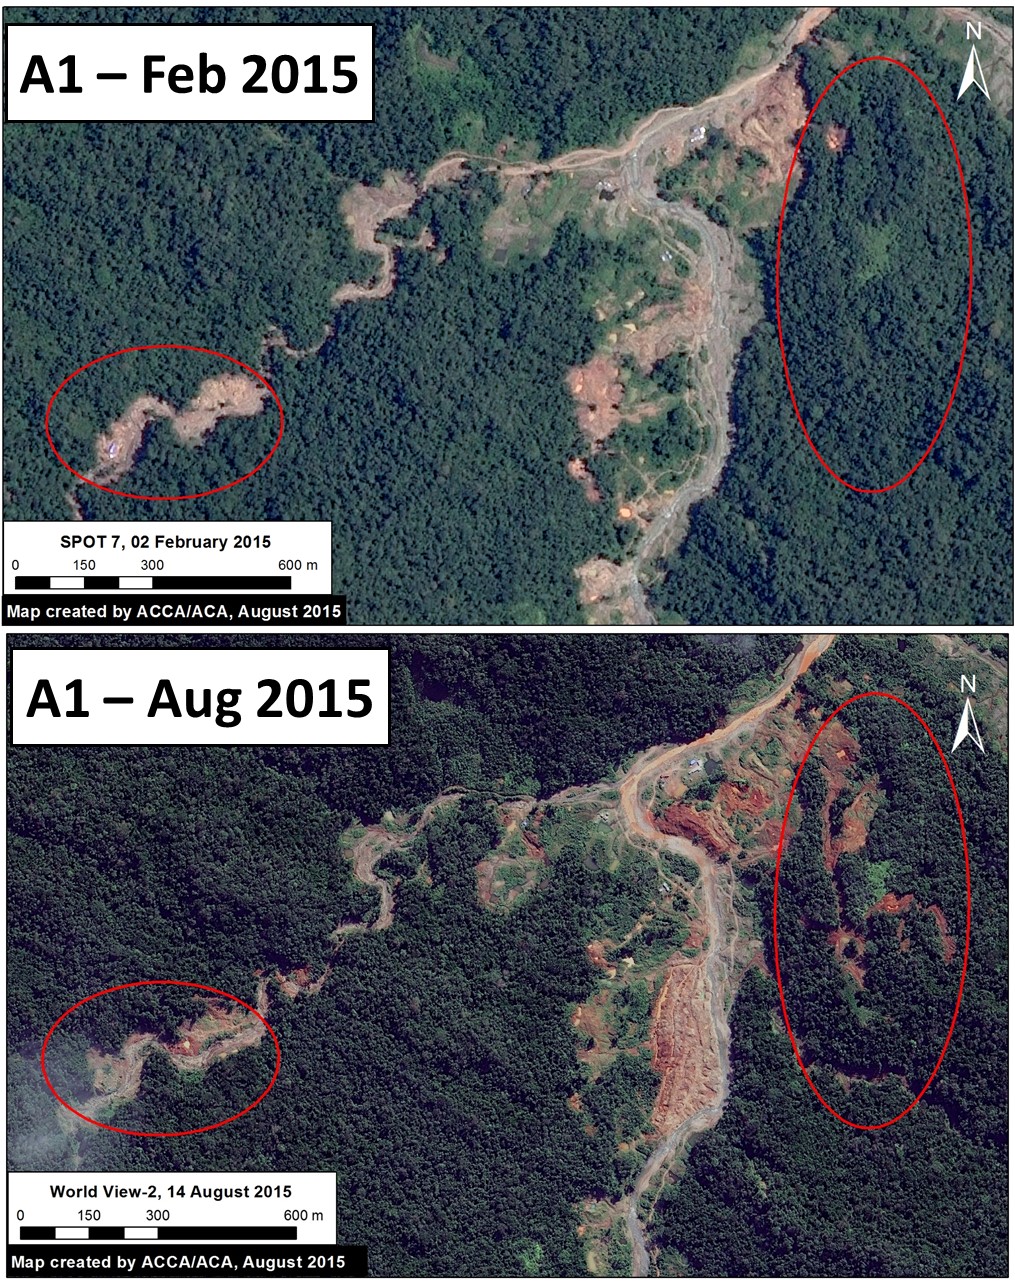
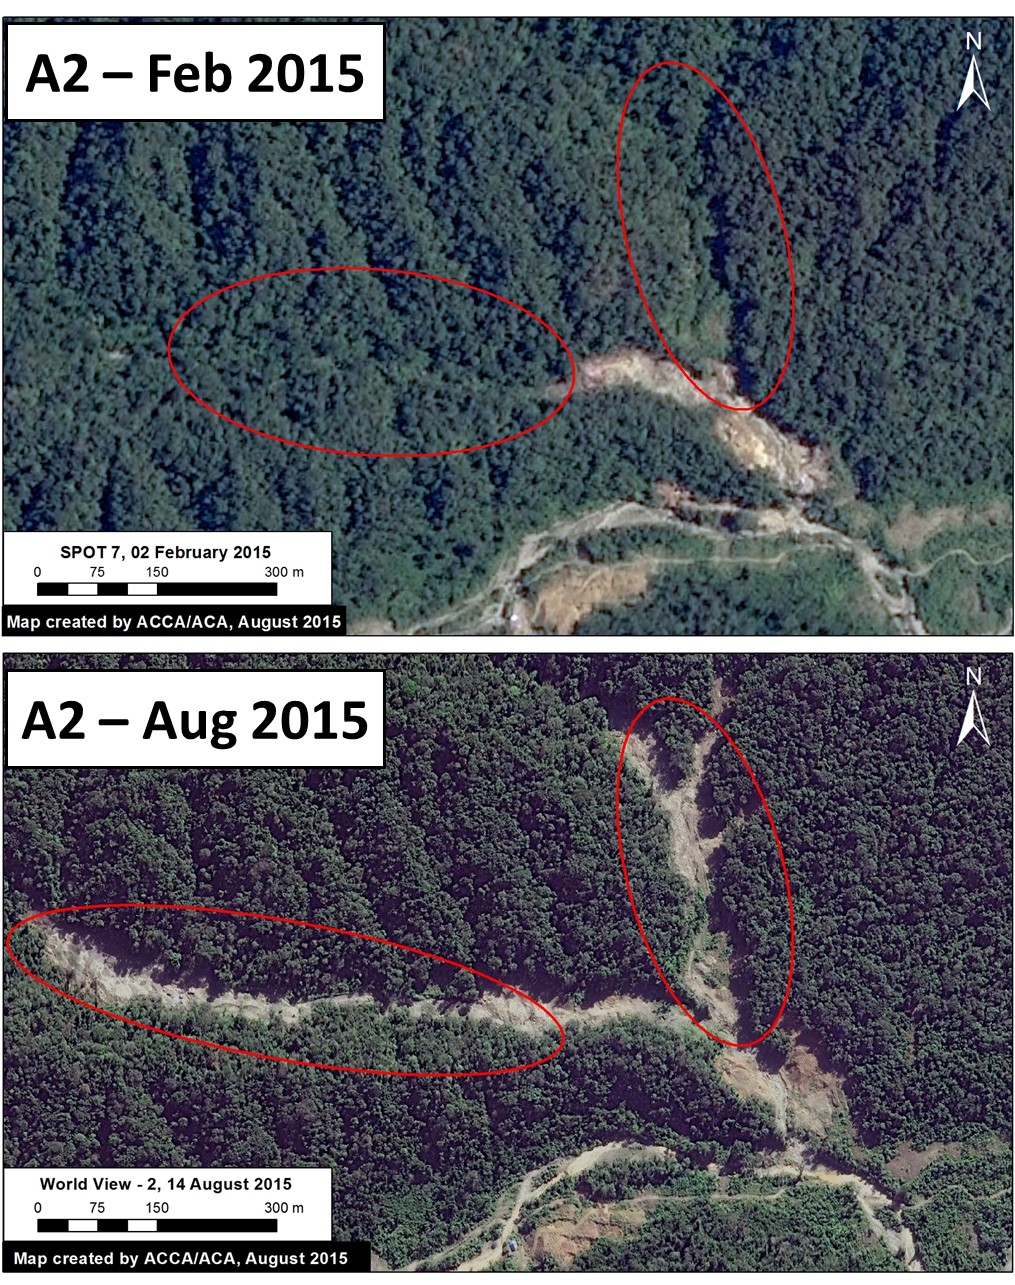
Sector Loromayo: Shifting Agriculture that includes Coca Cultivation
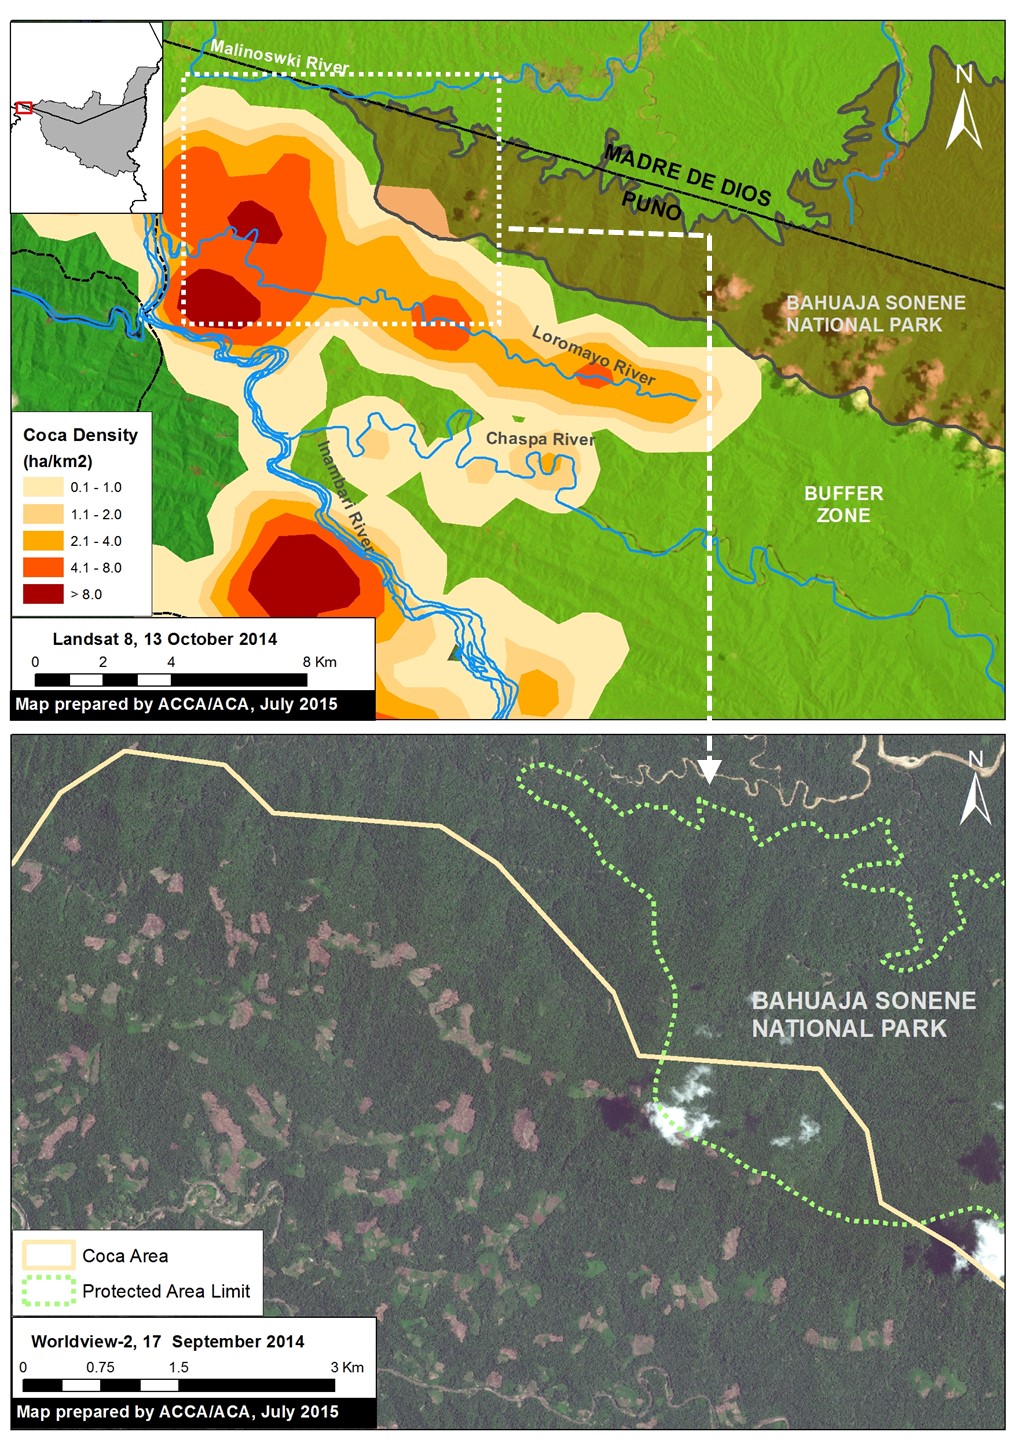
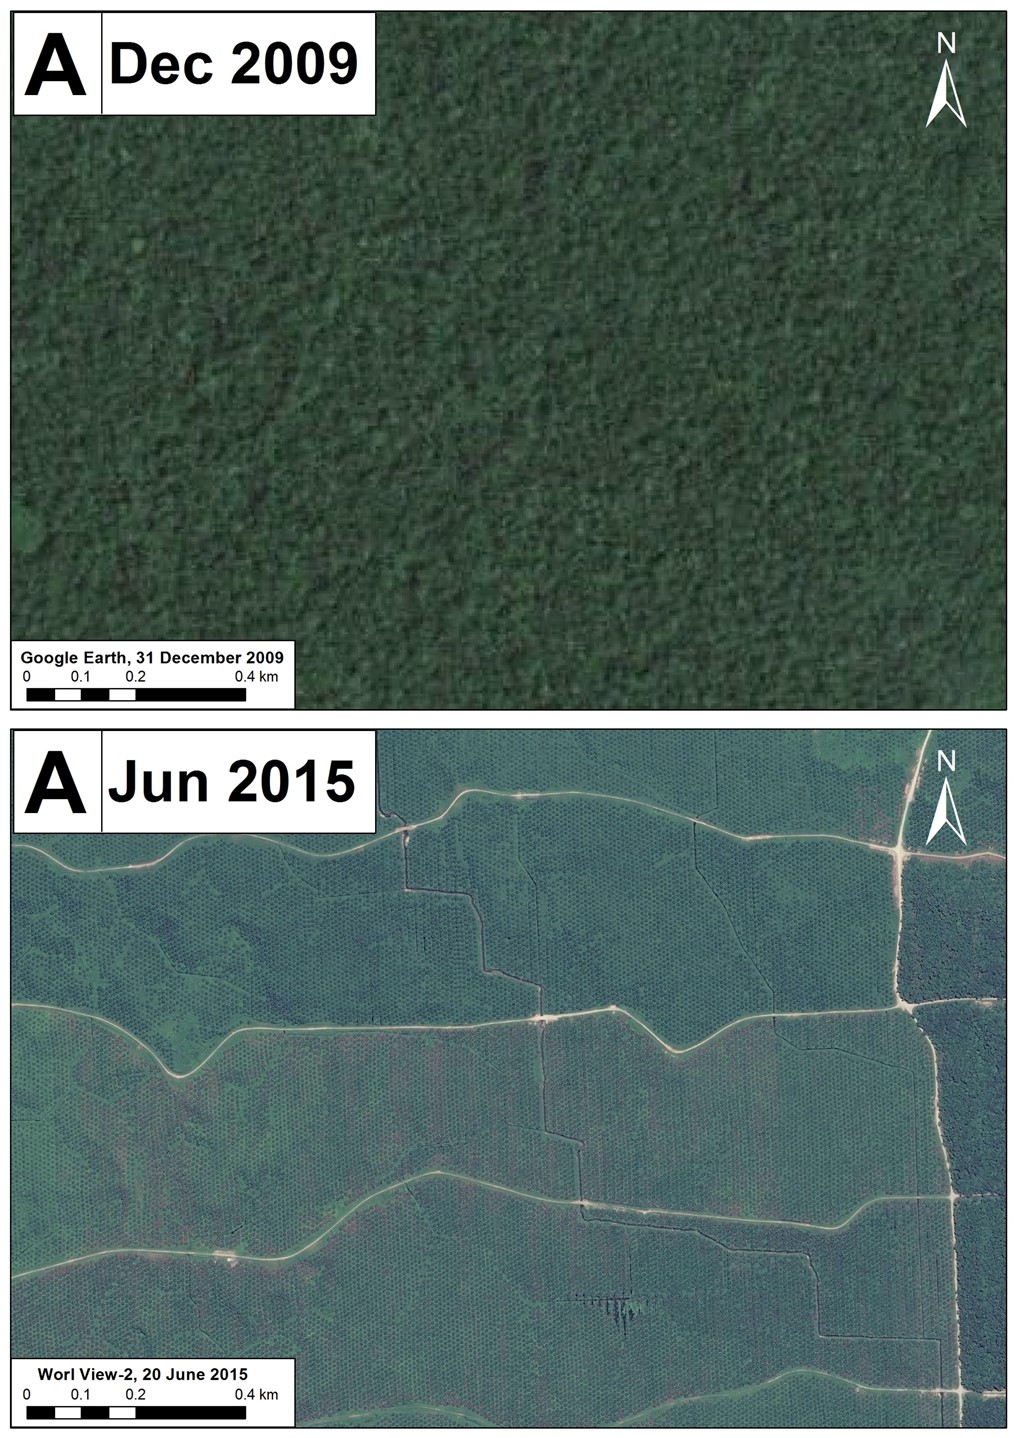
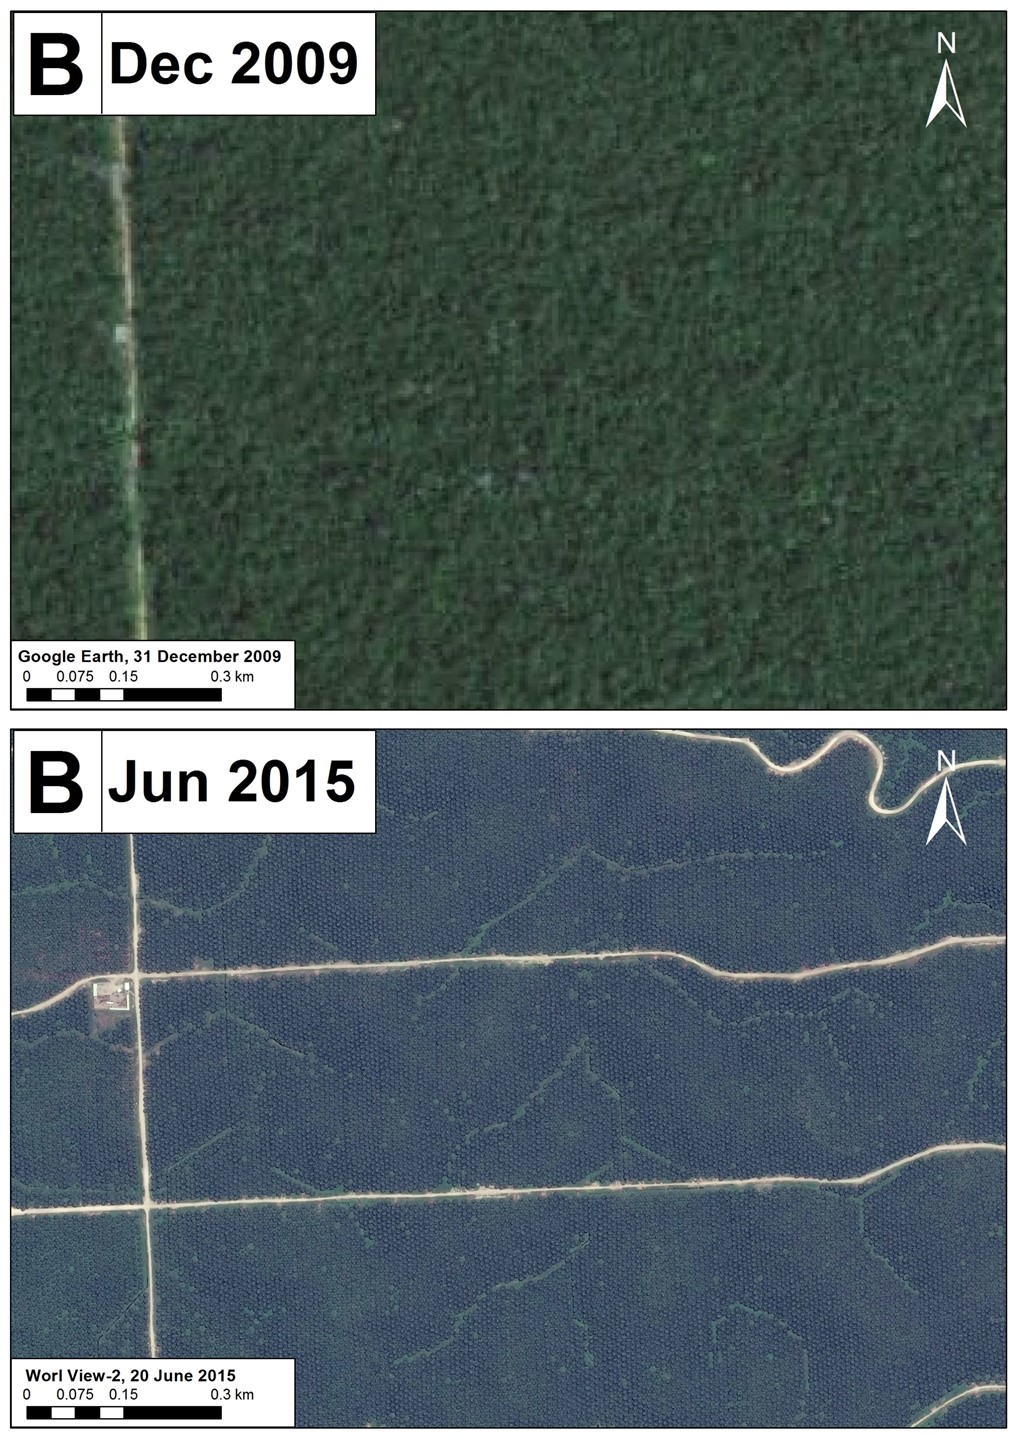
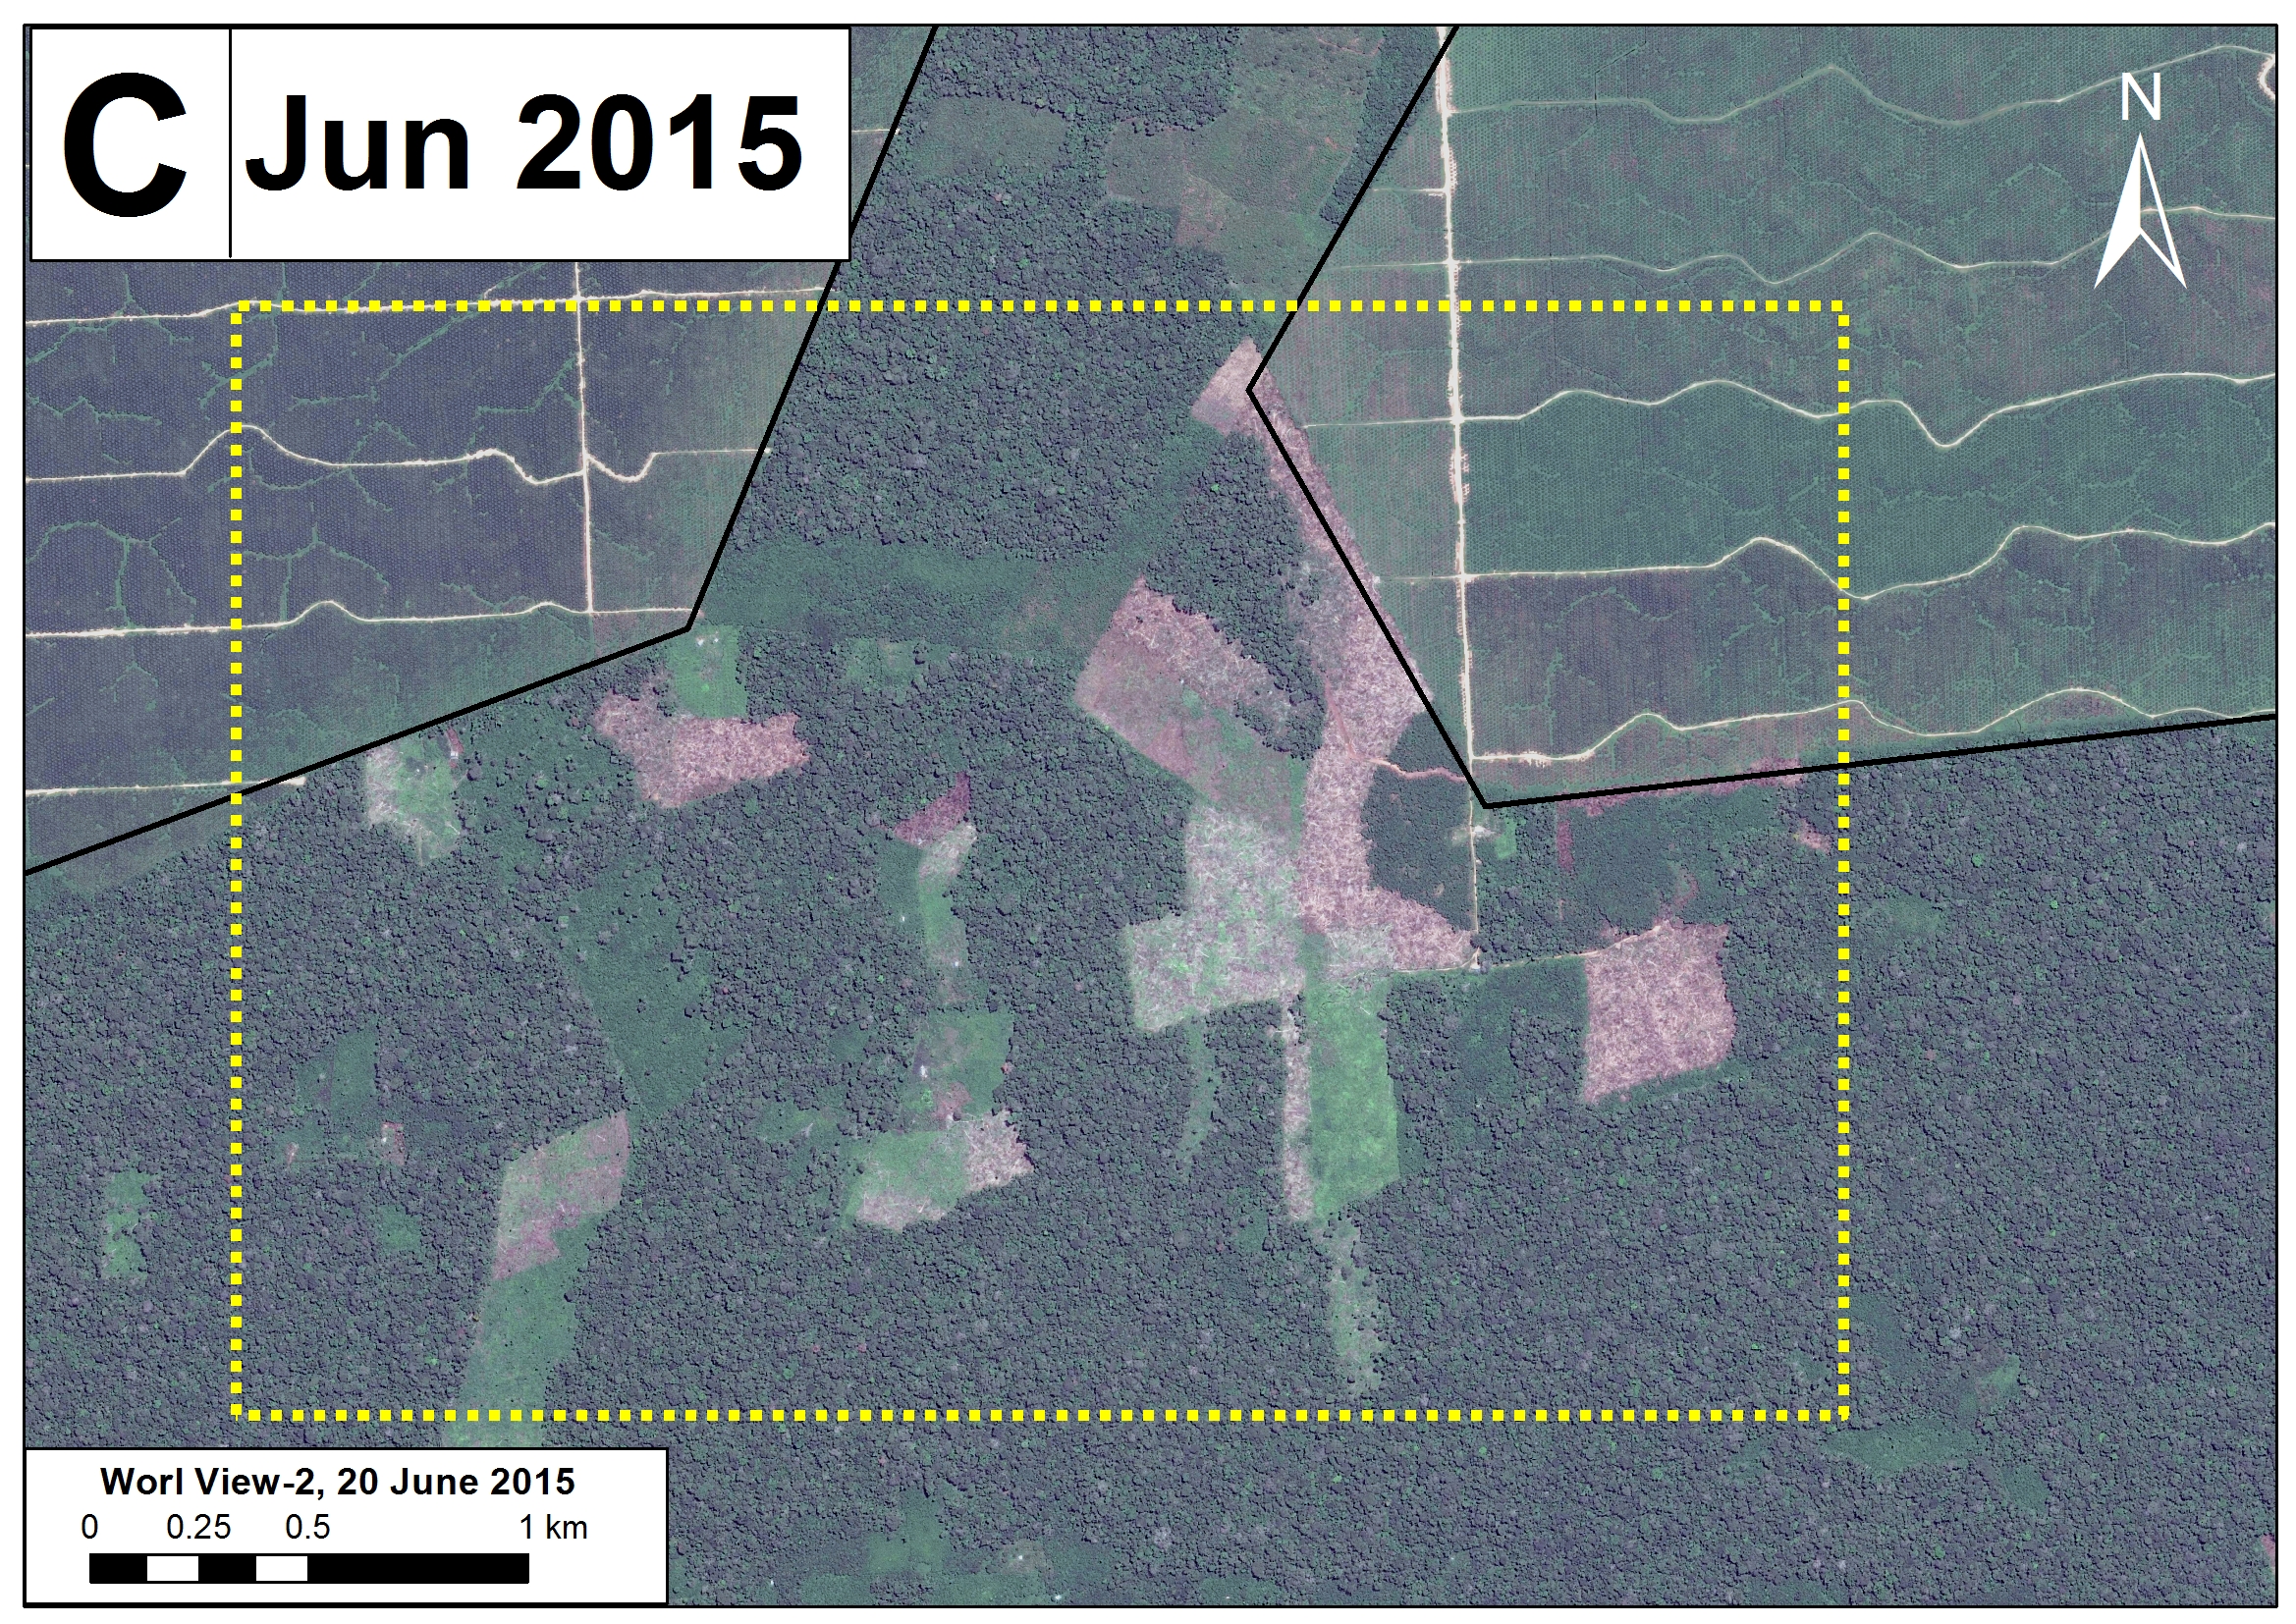
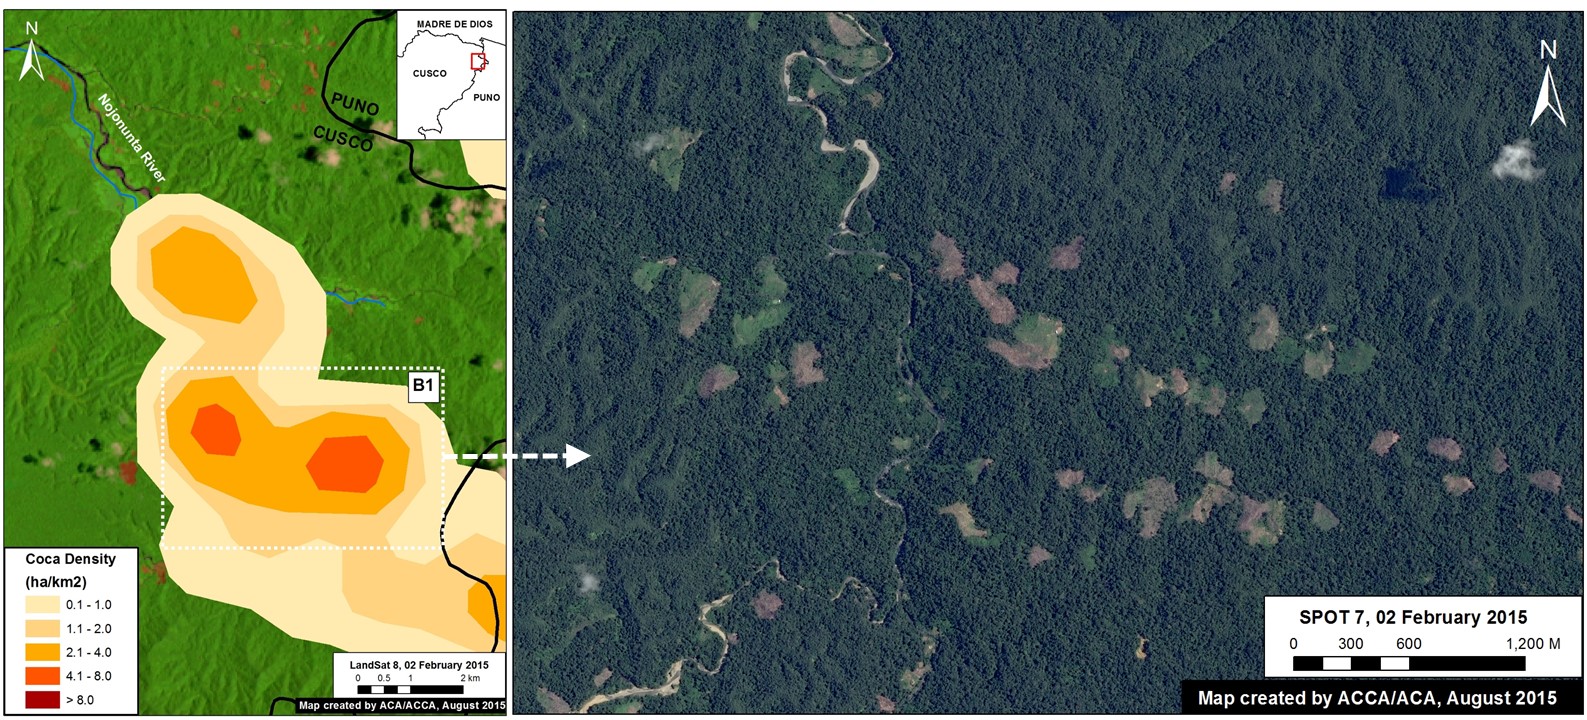
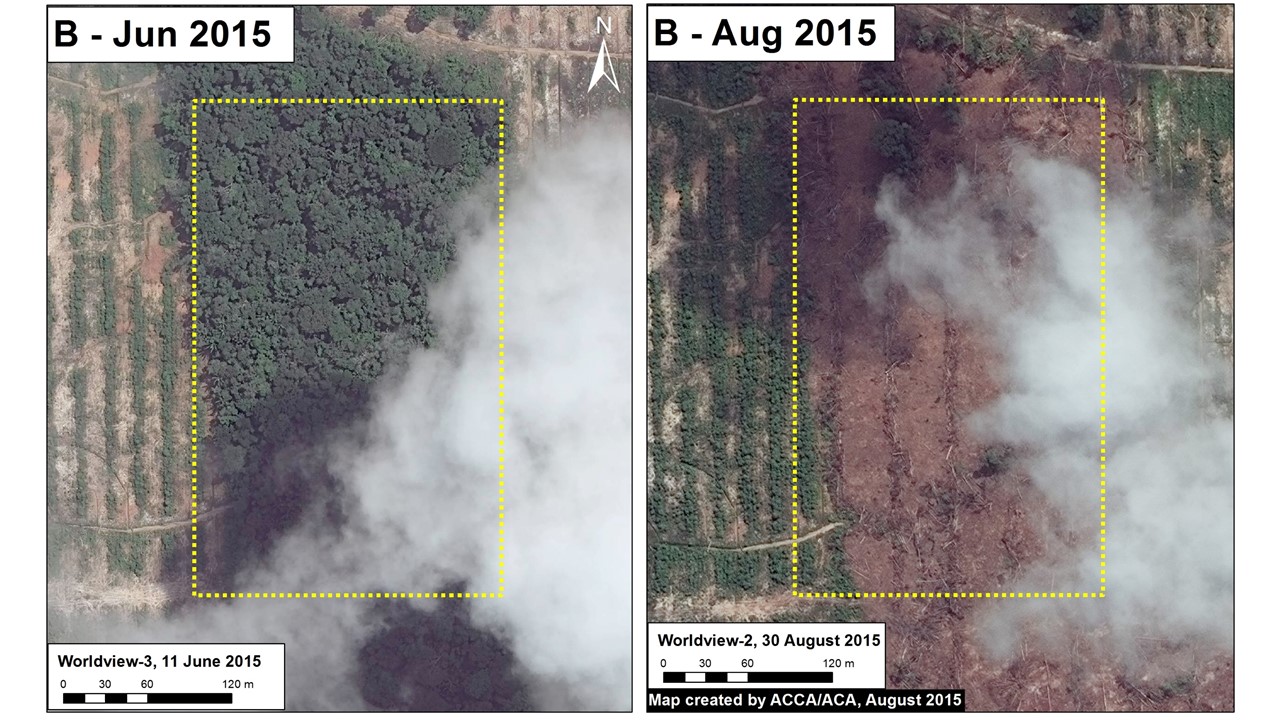
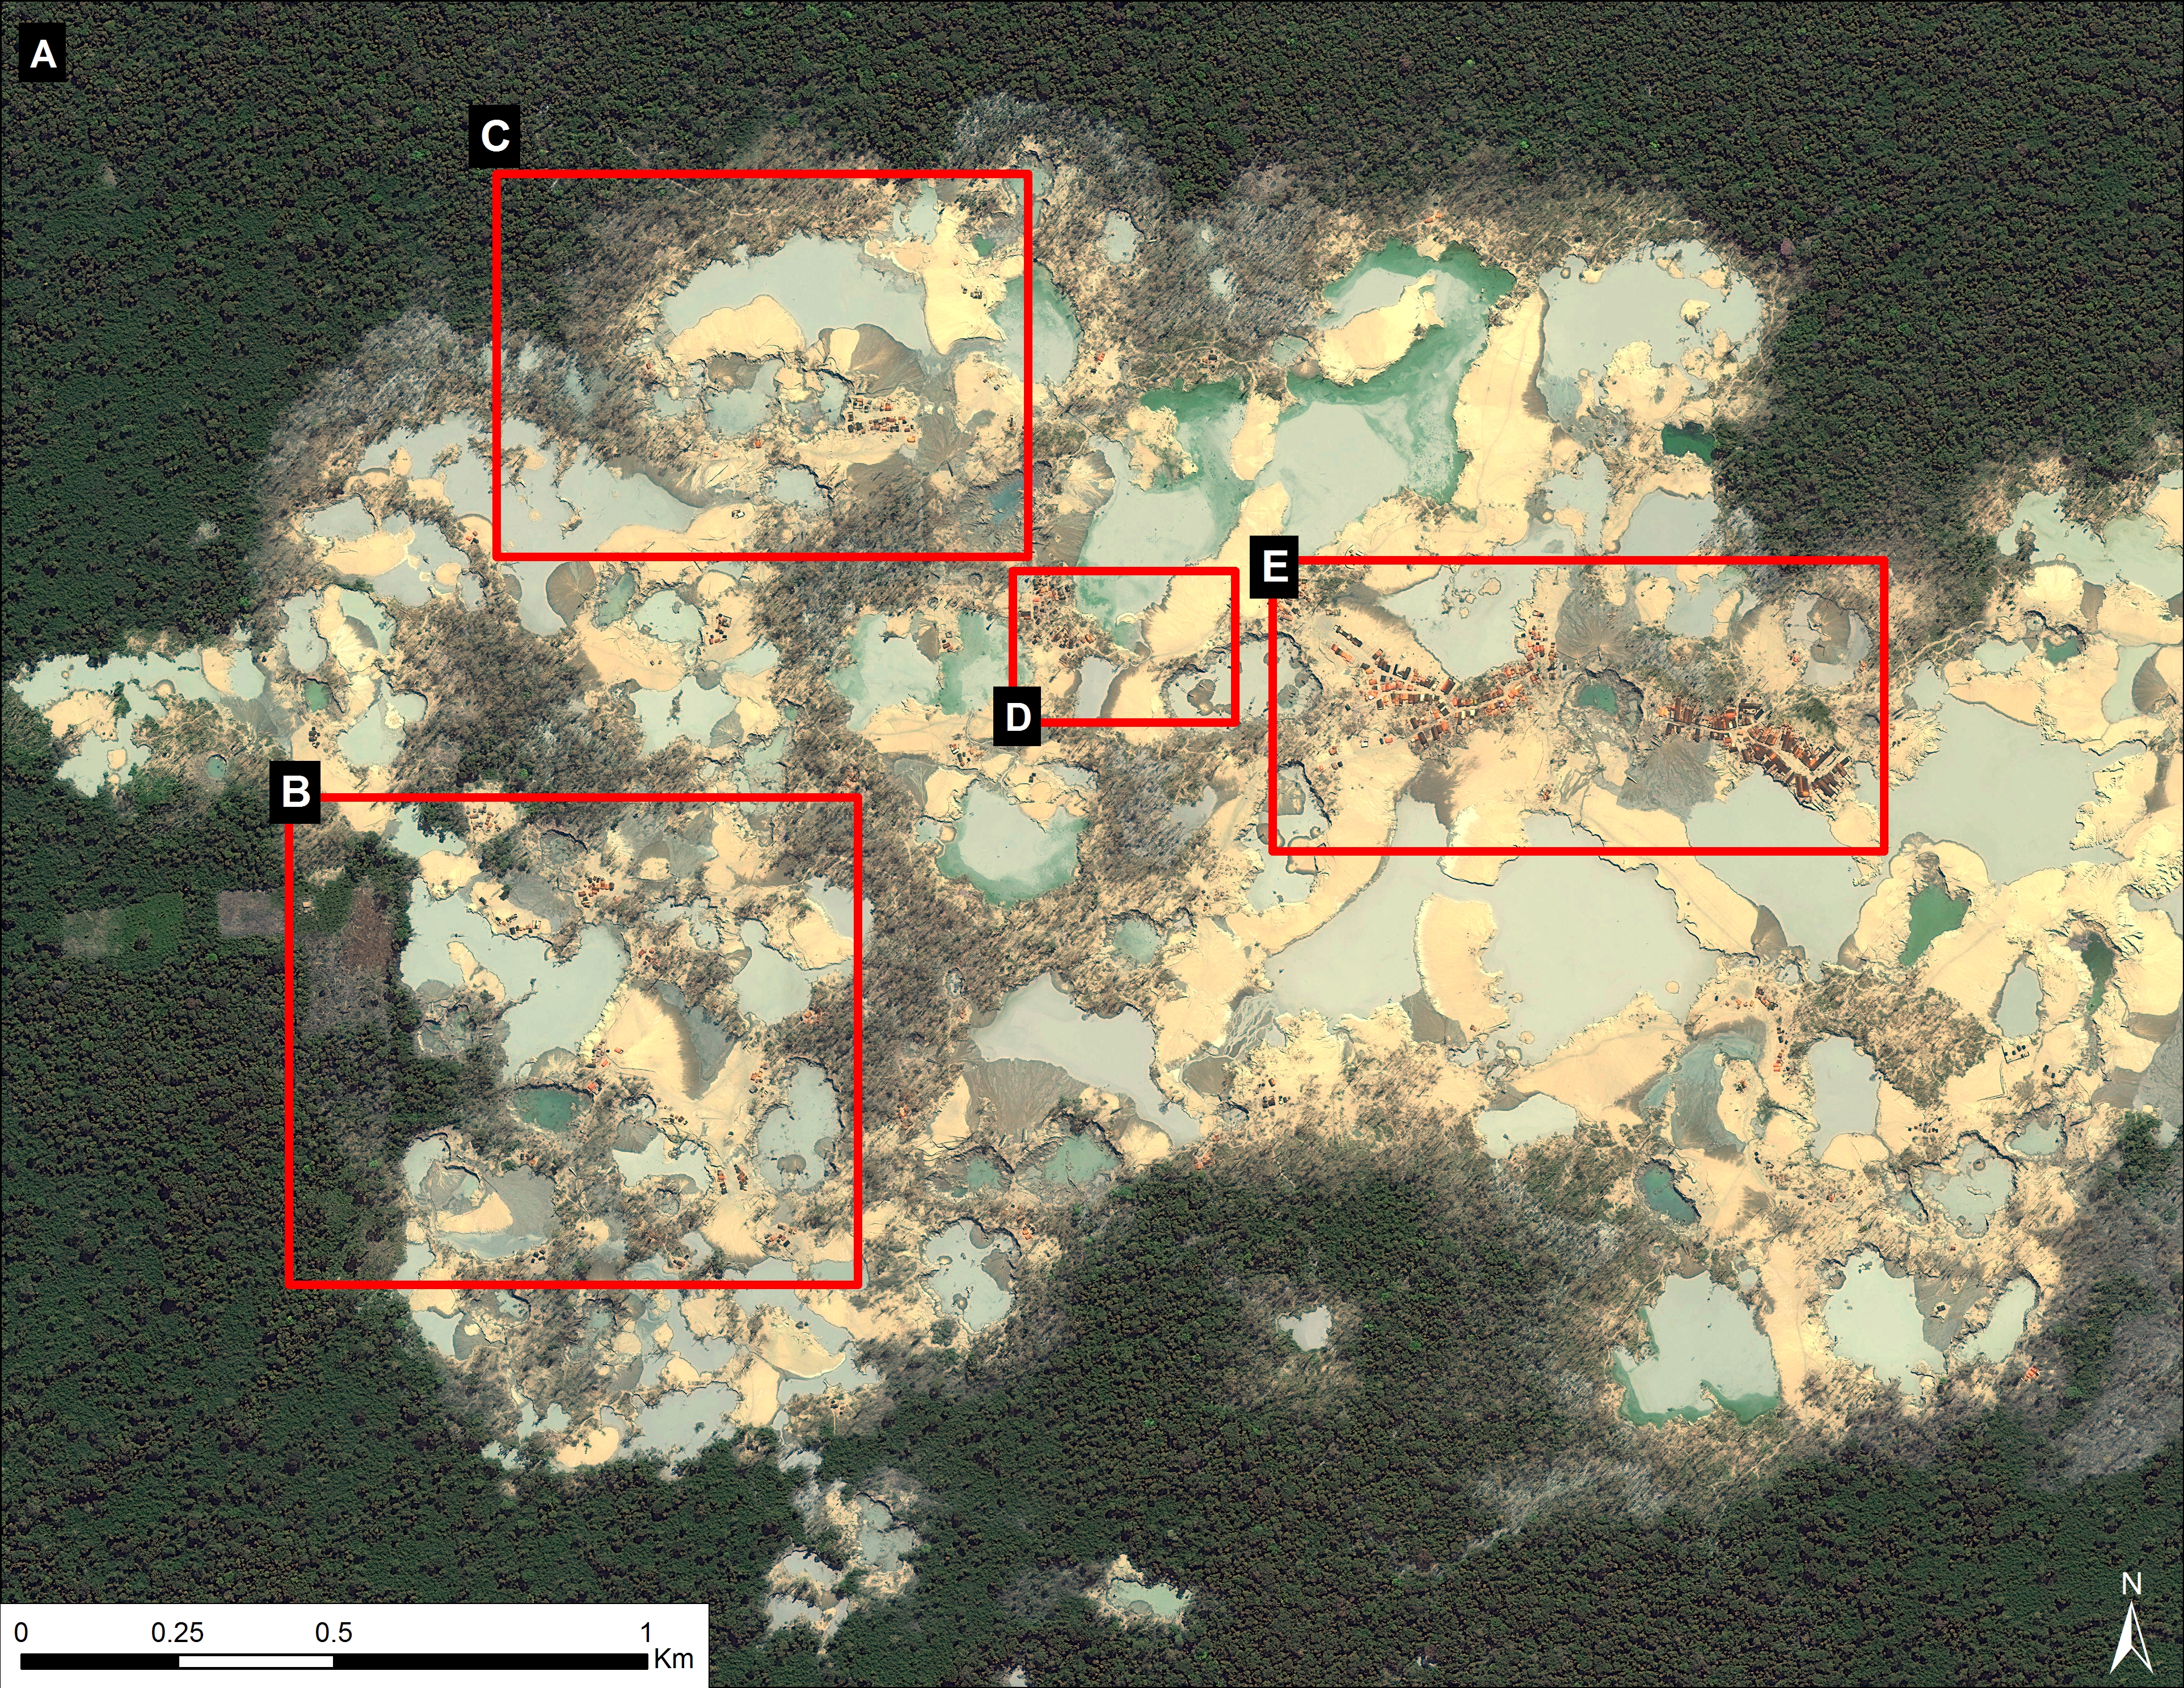
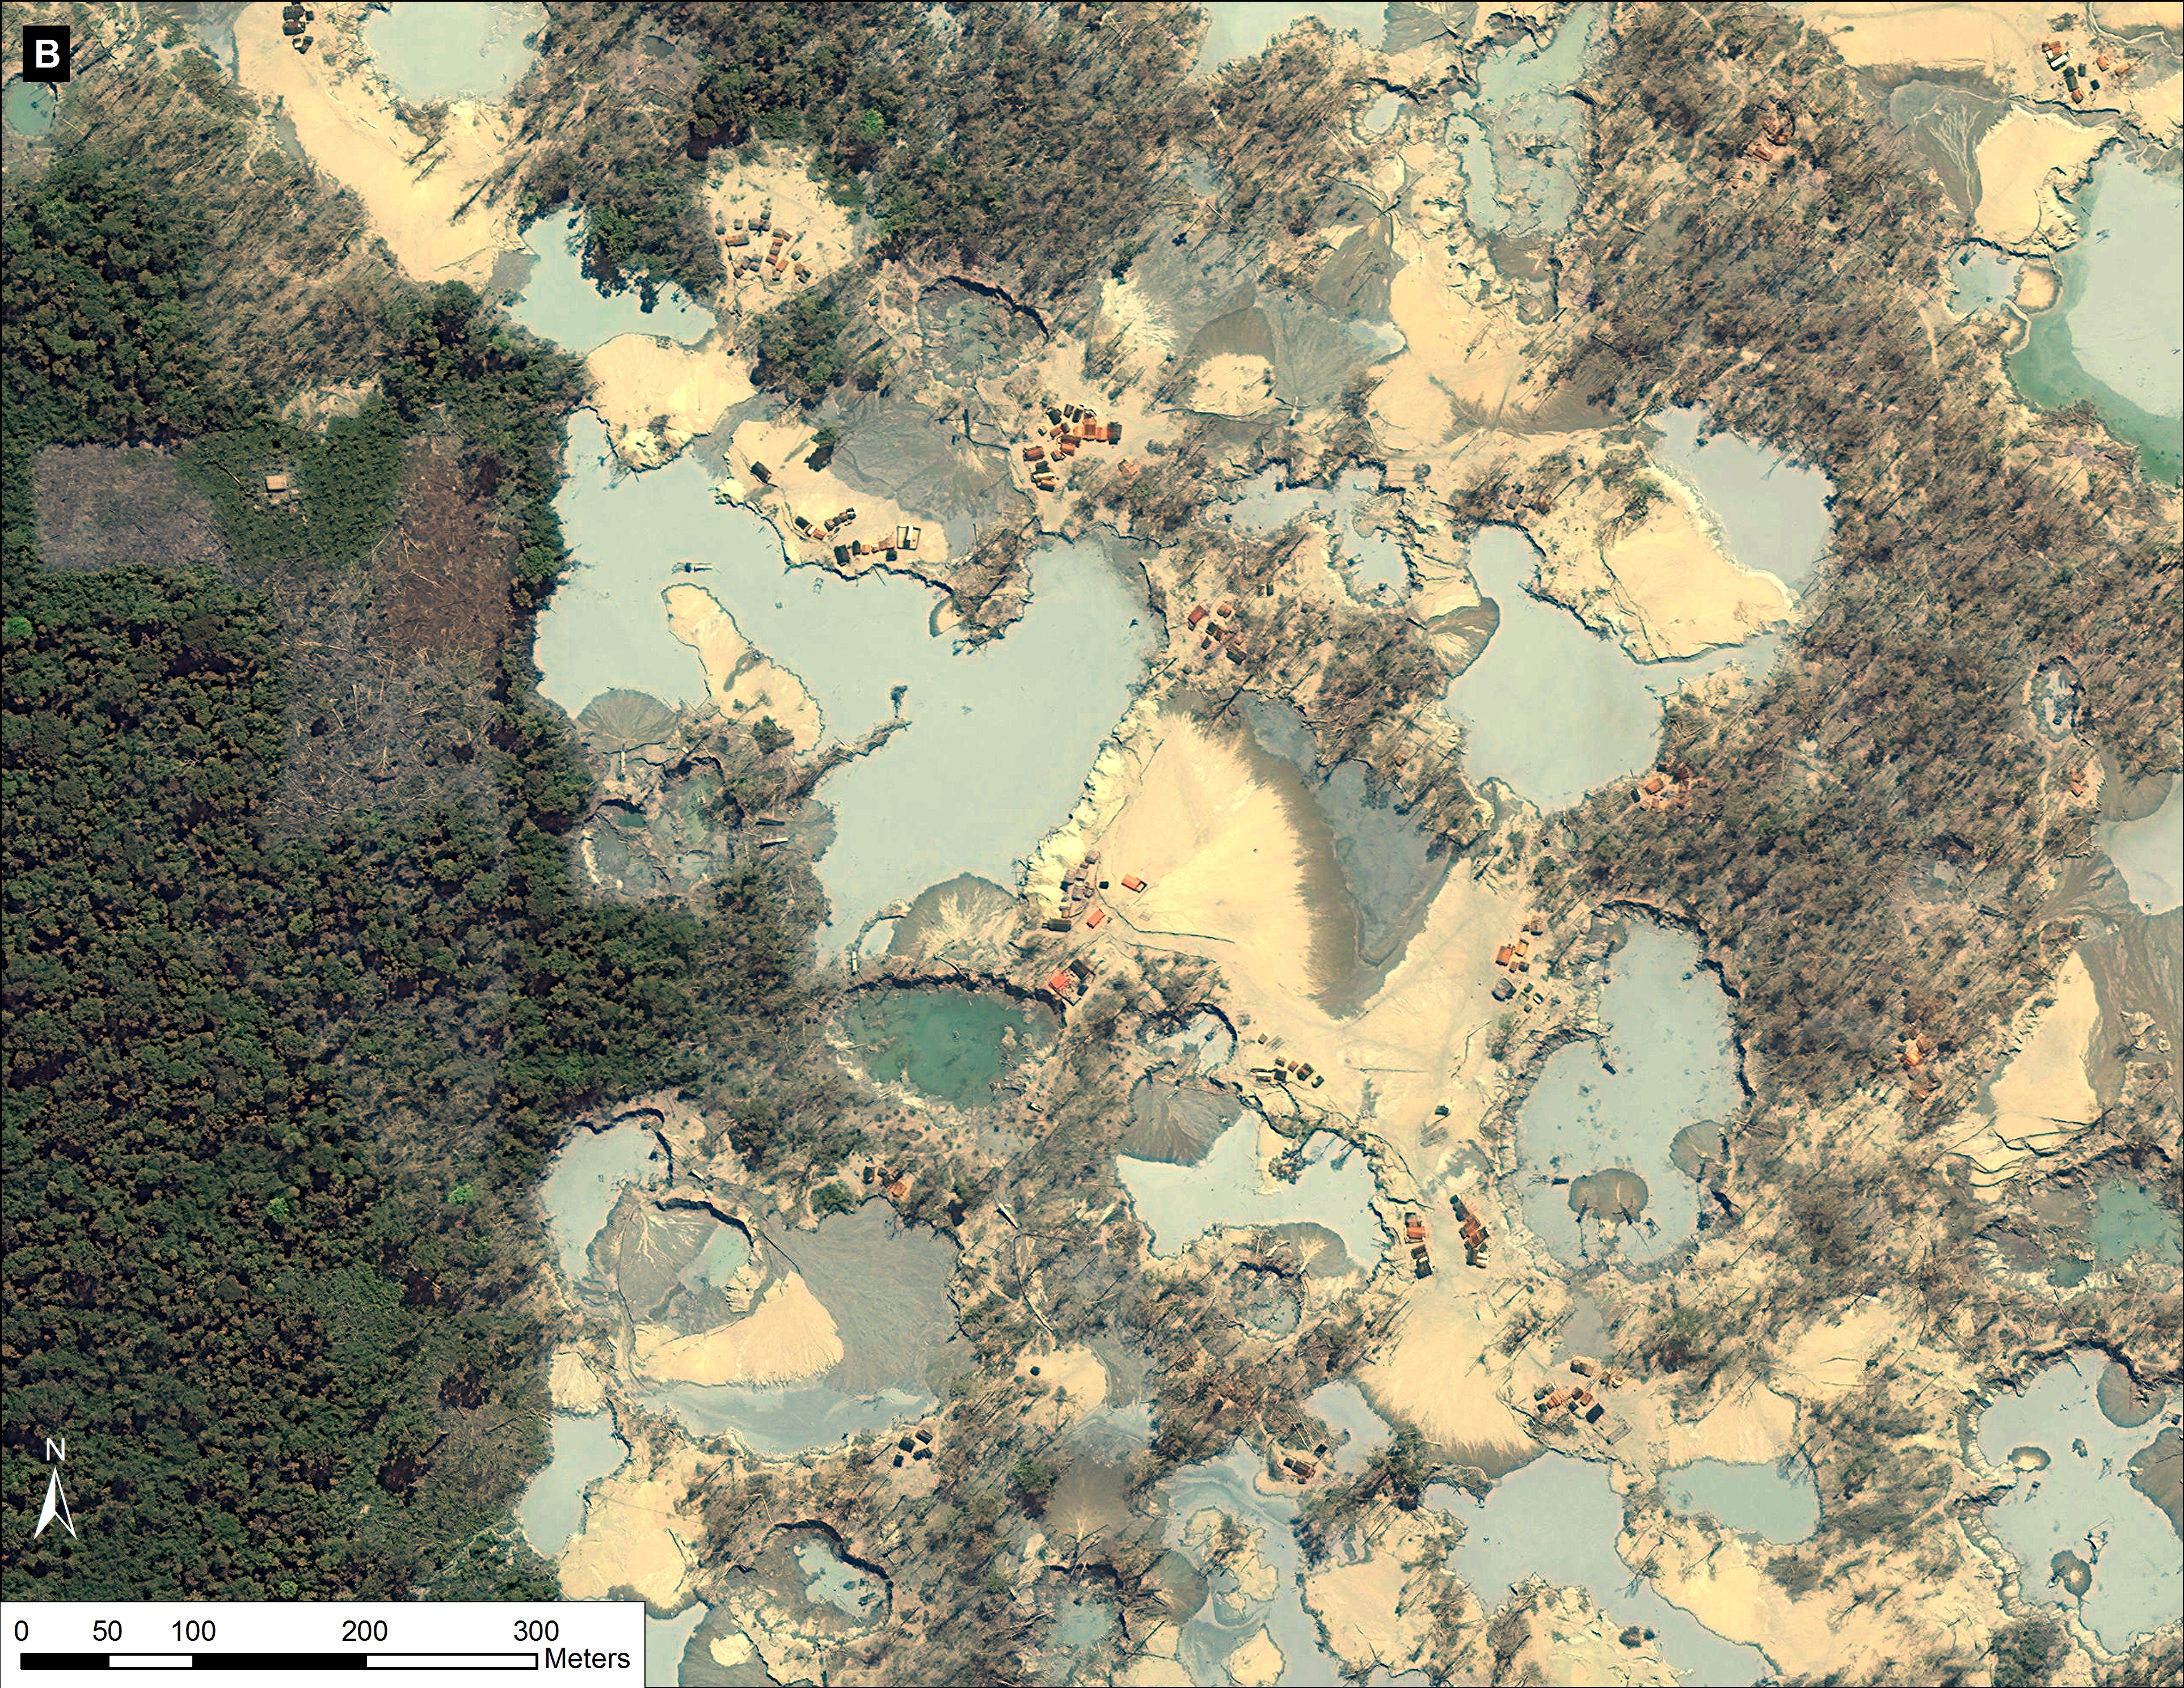
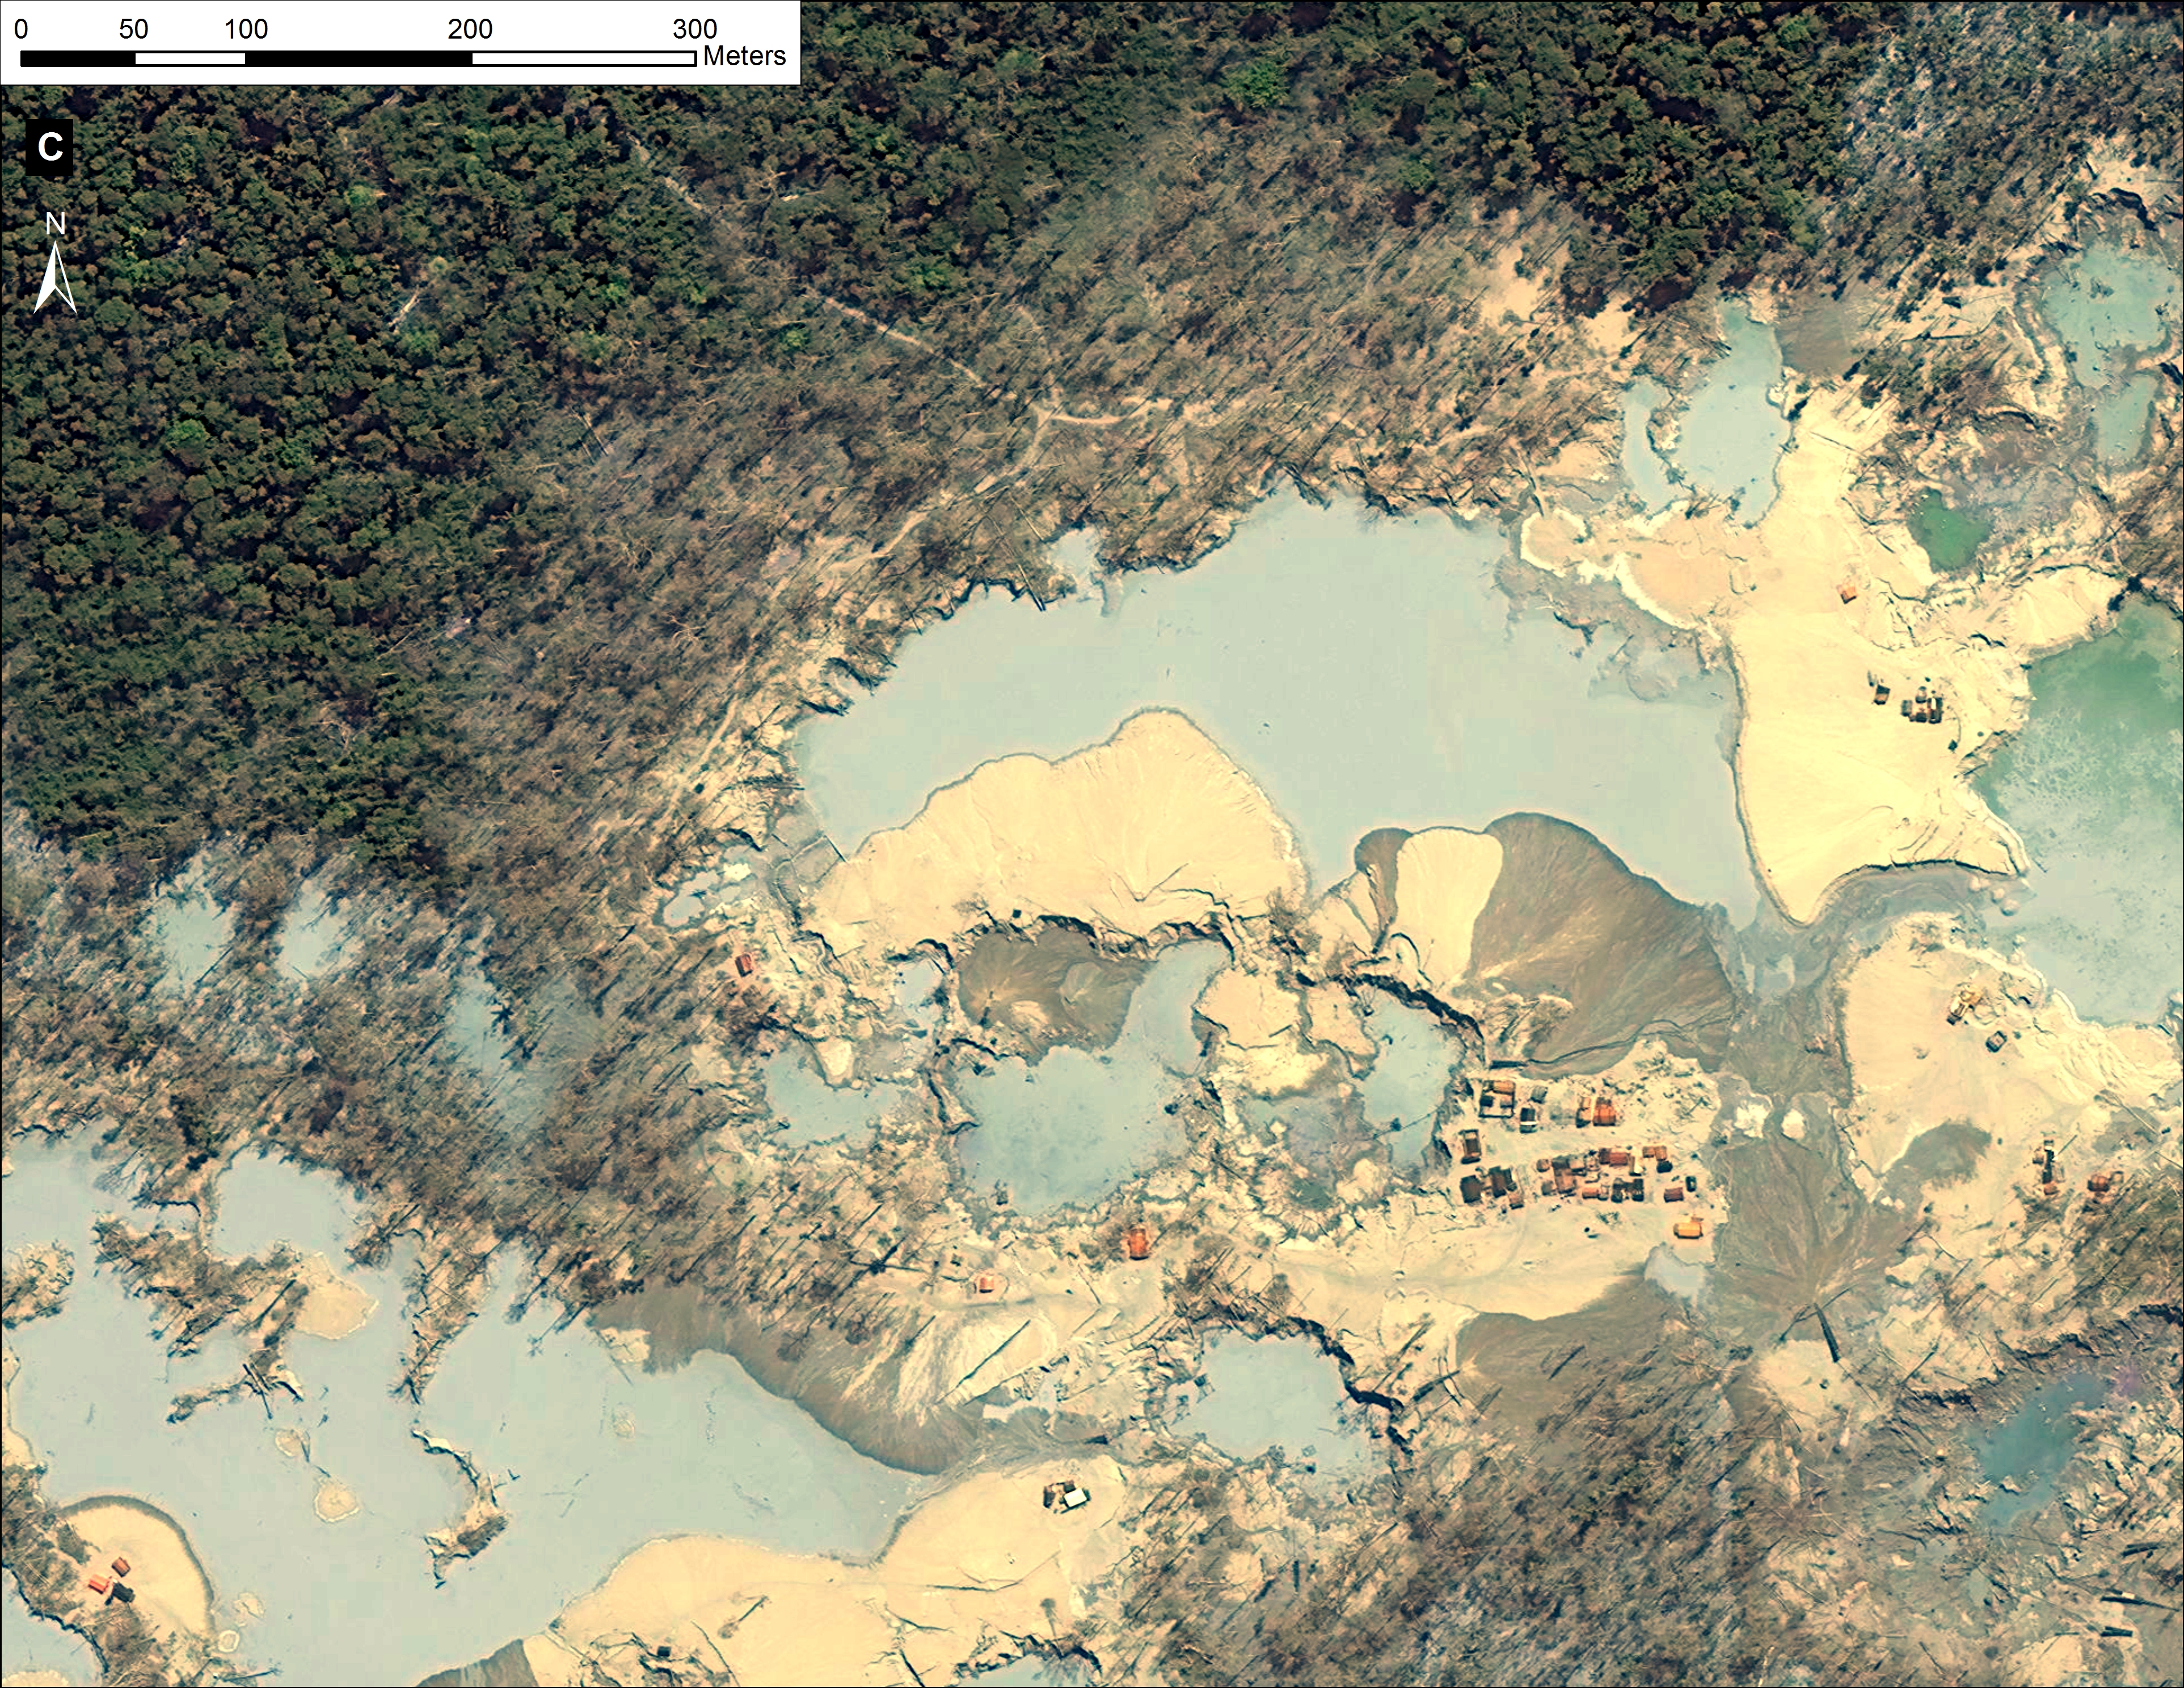
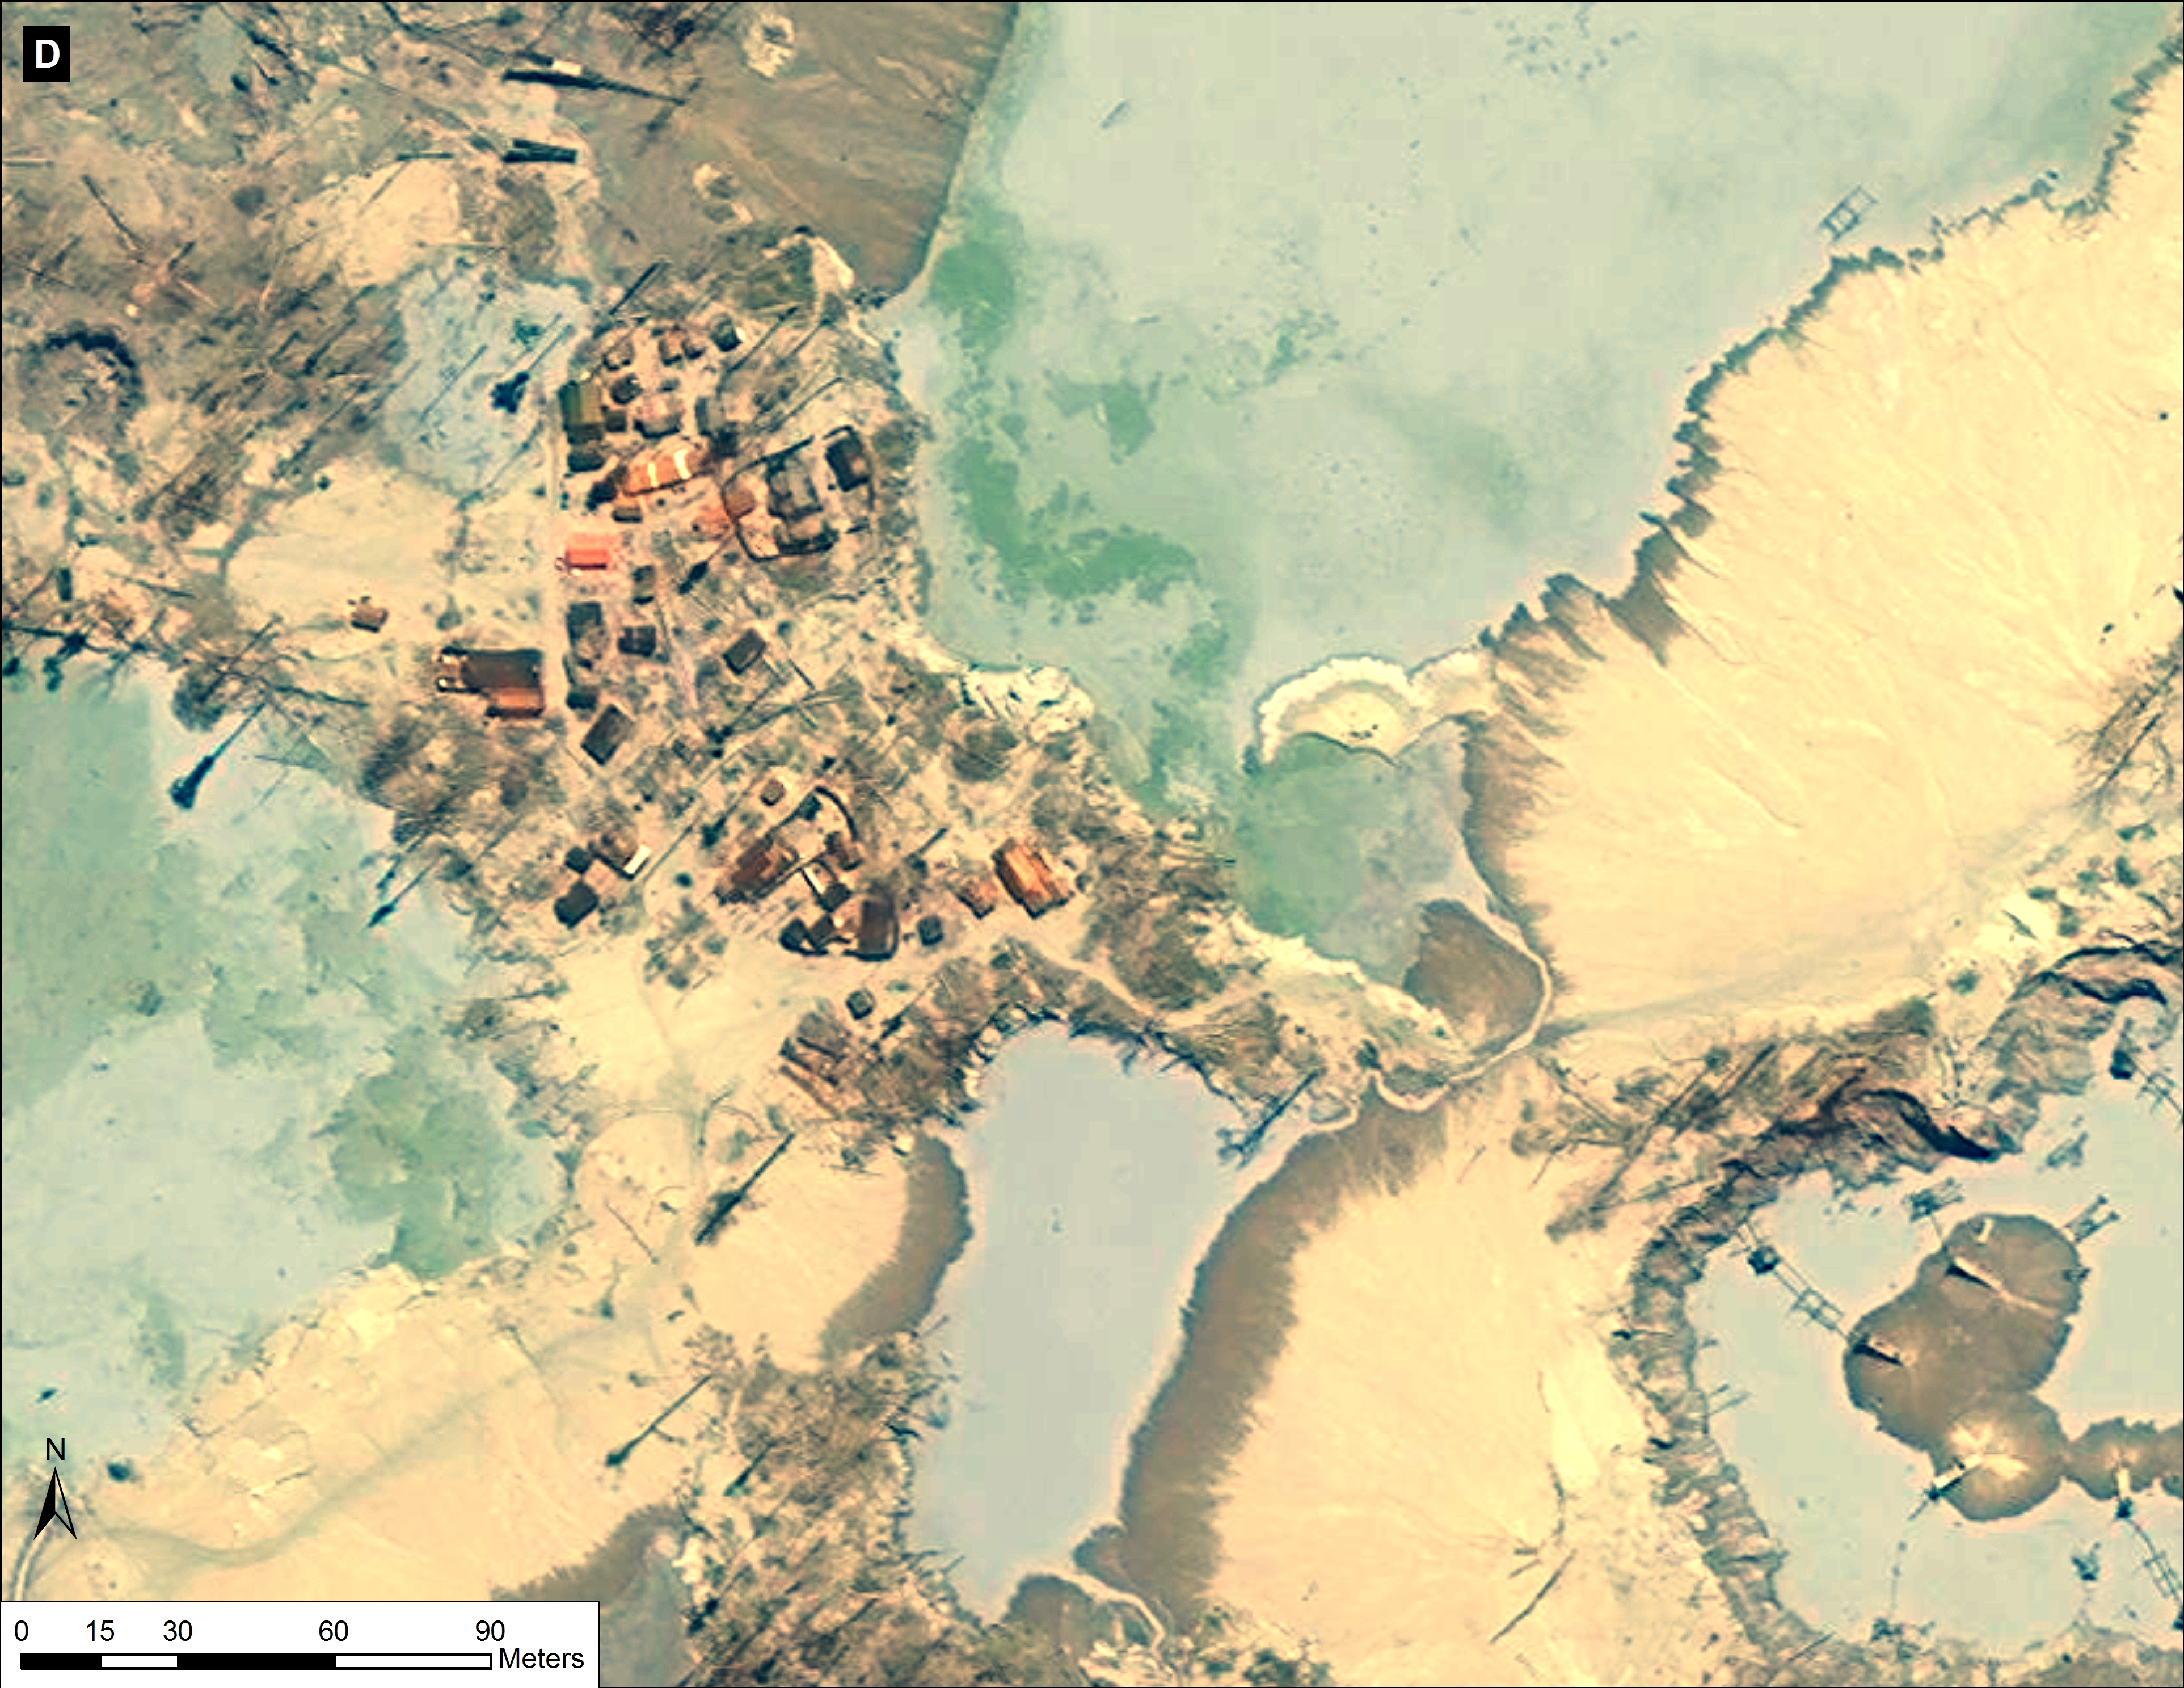
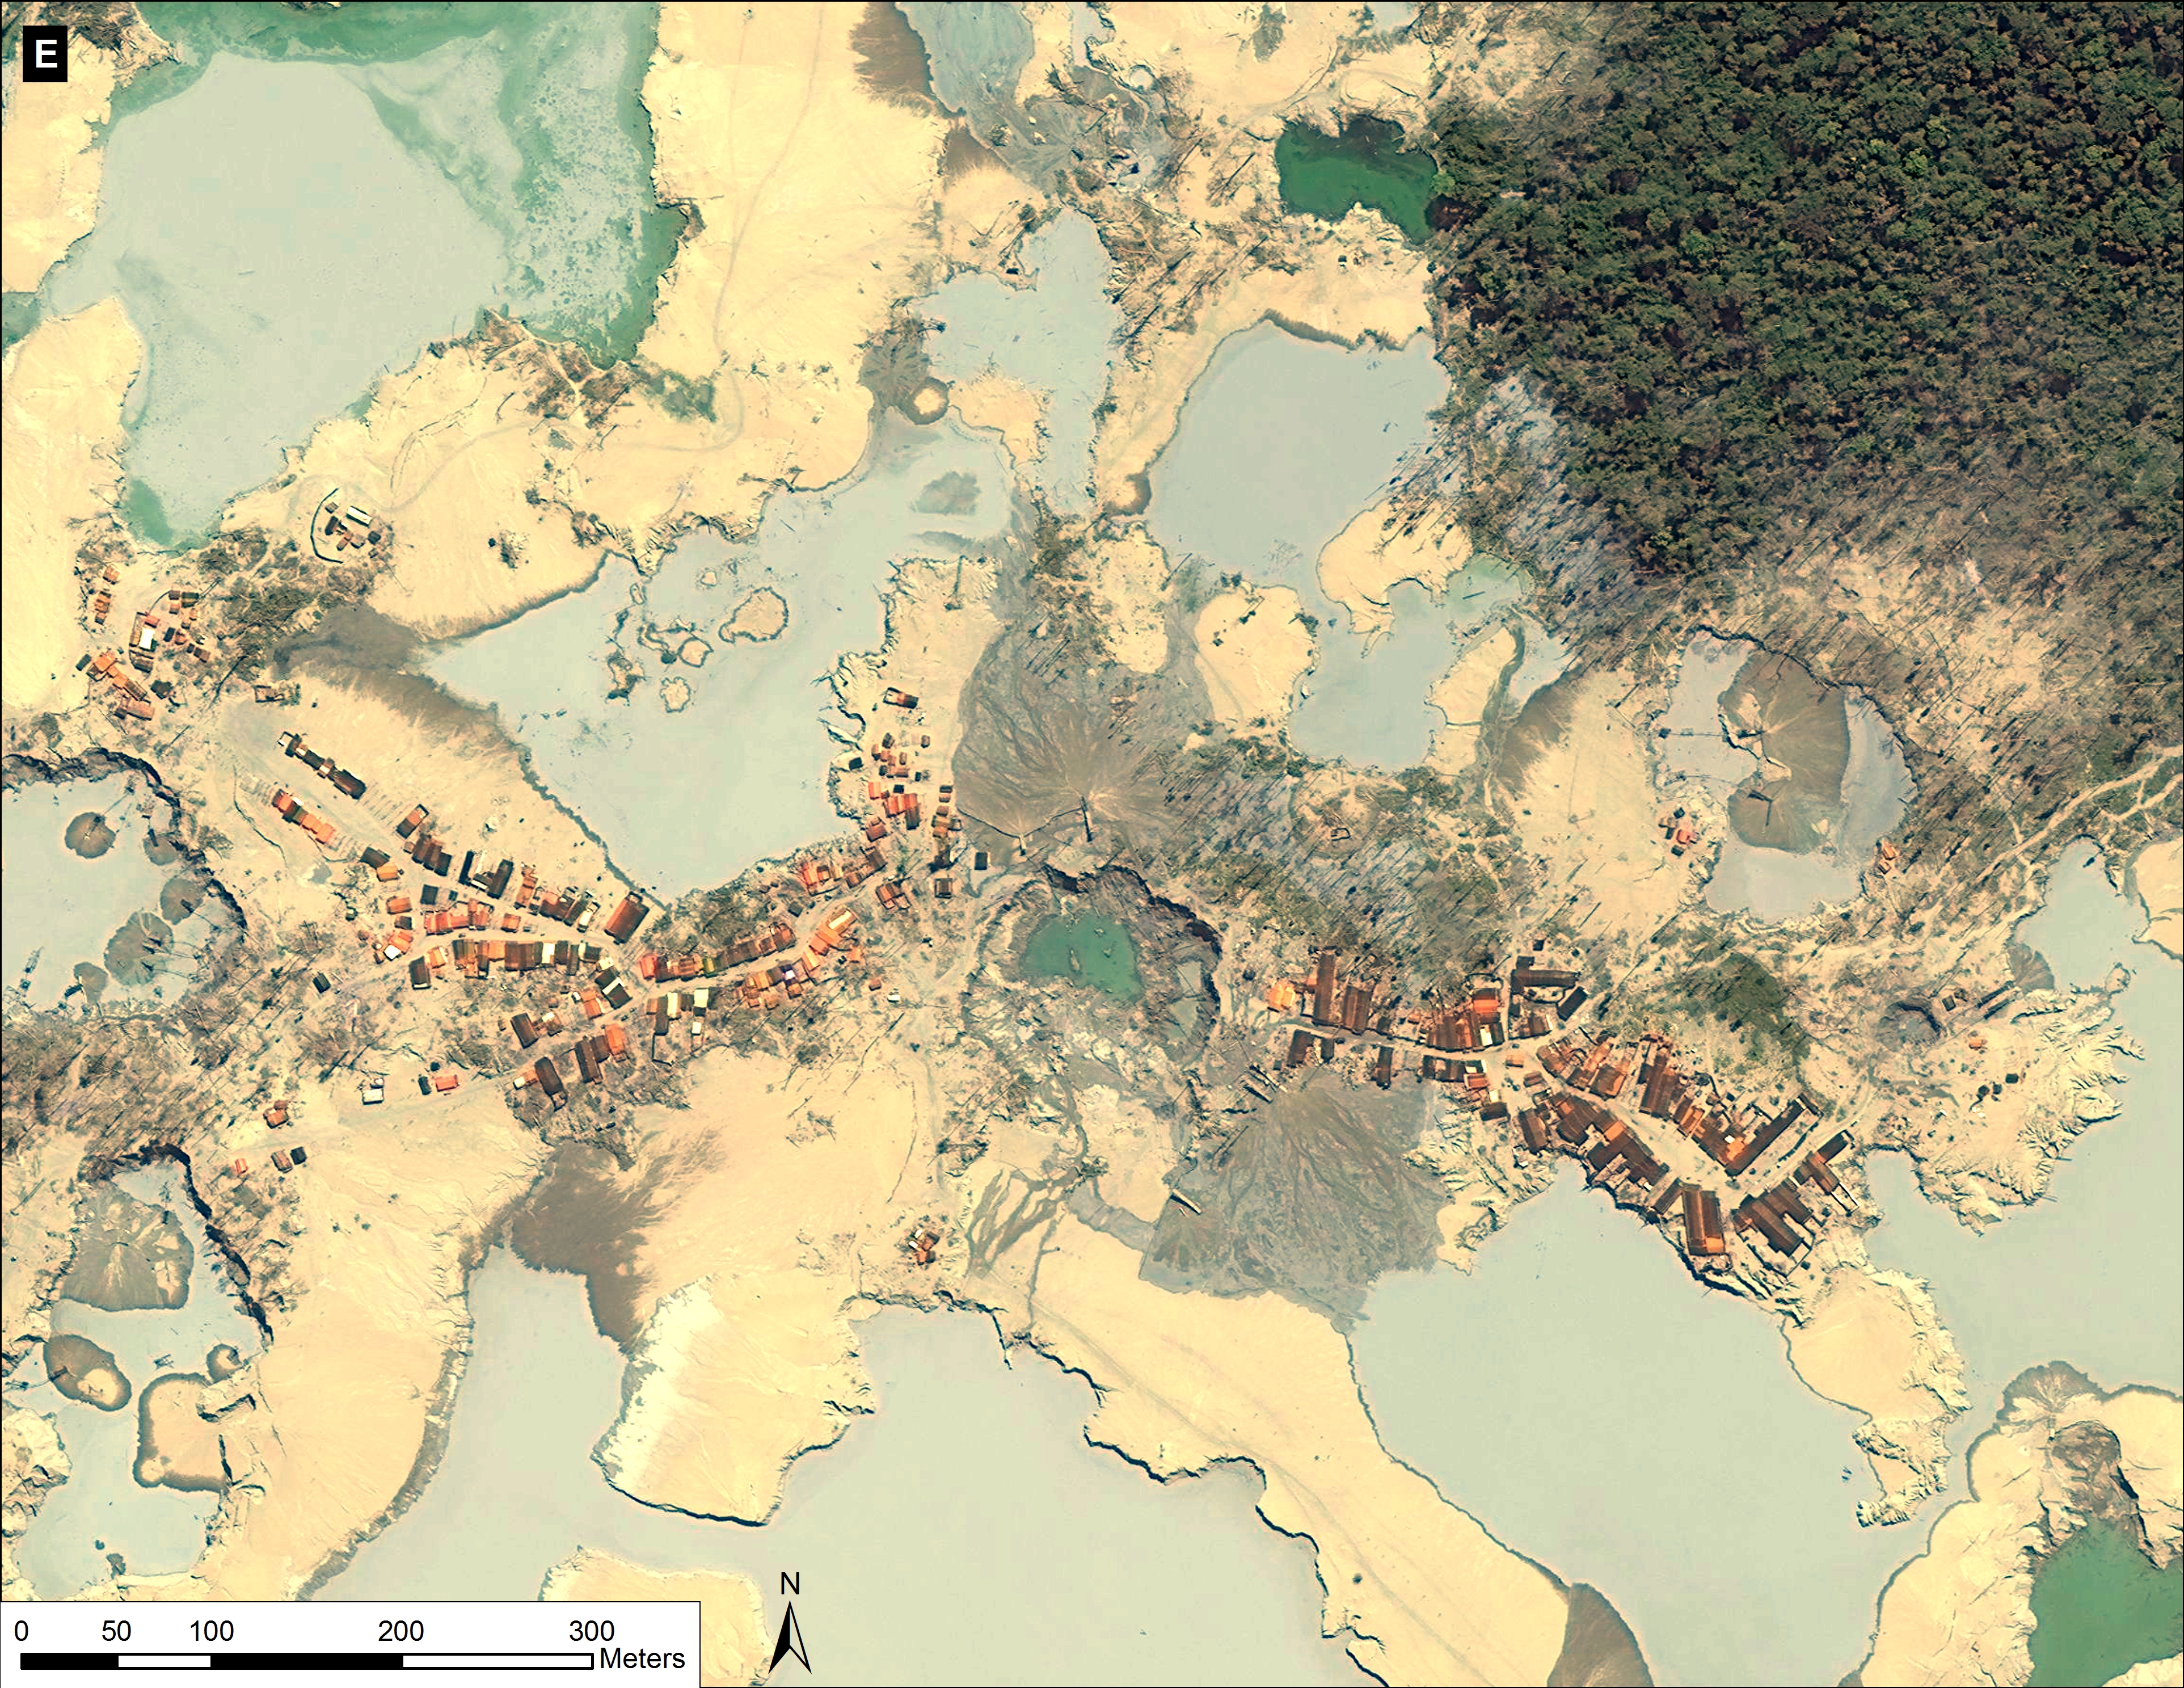
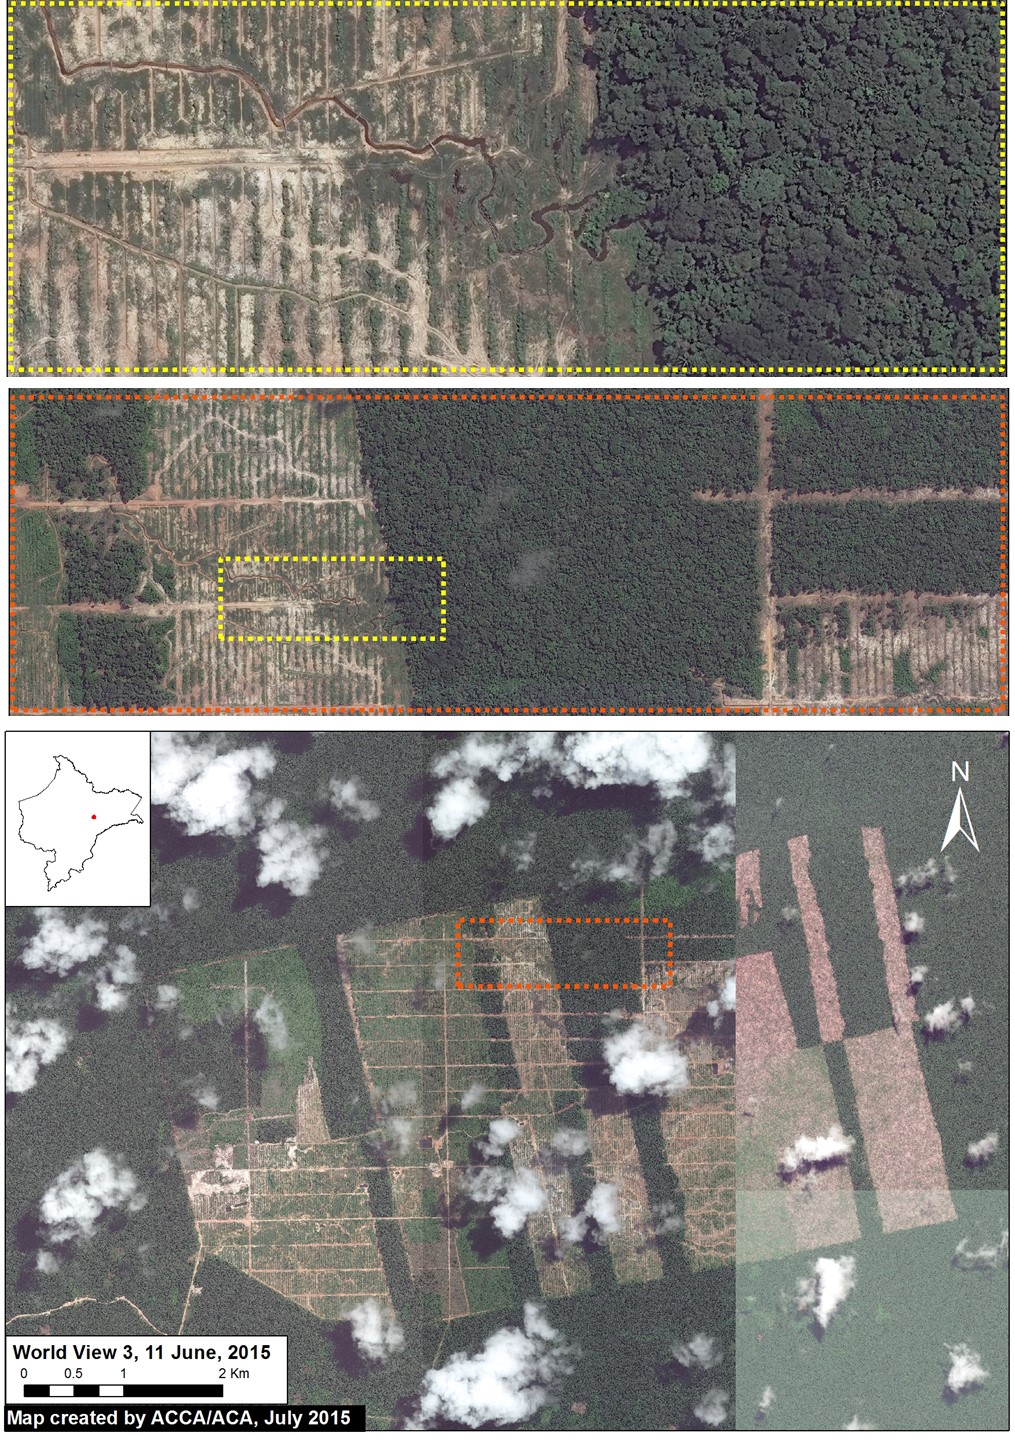
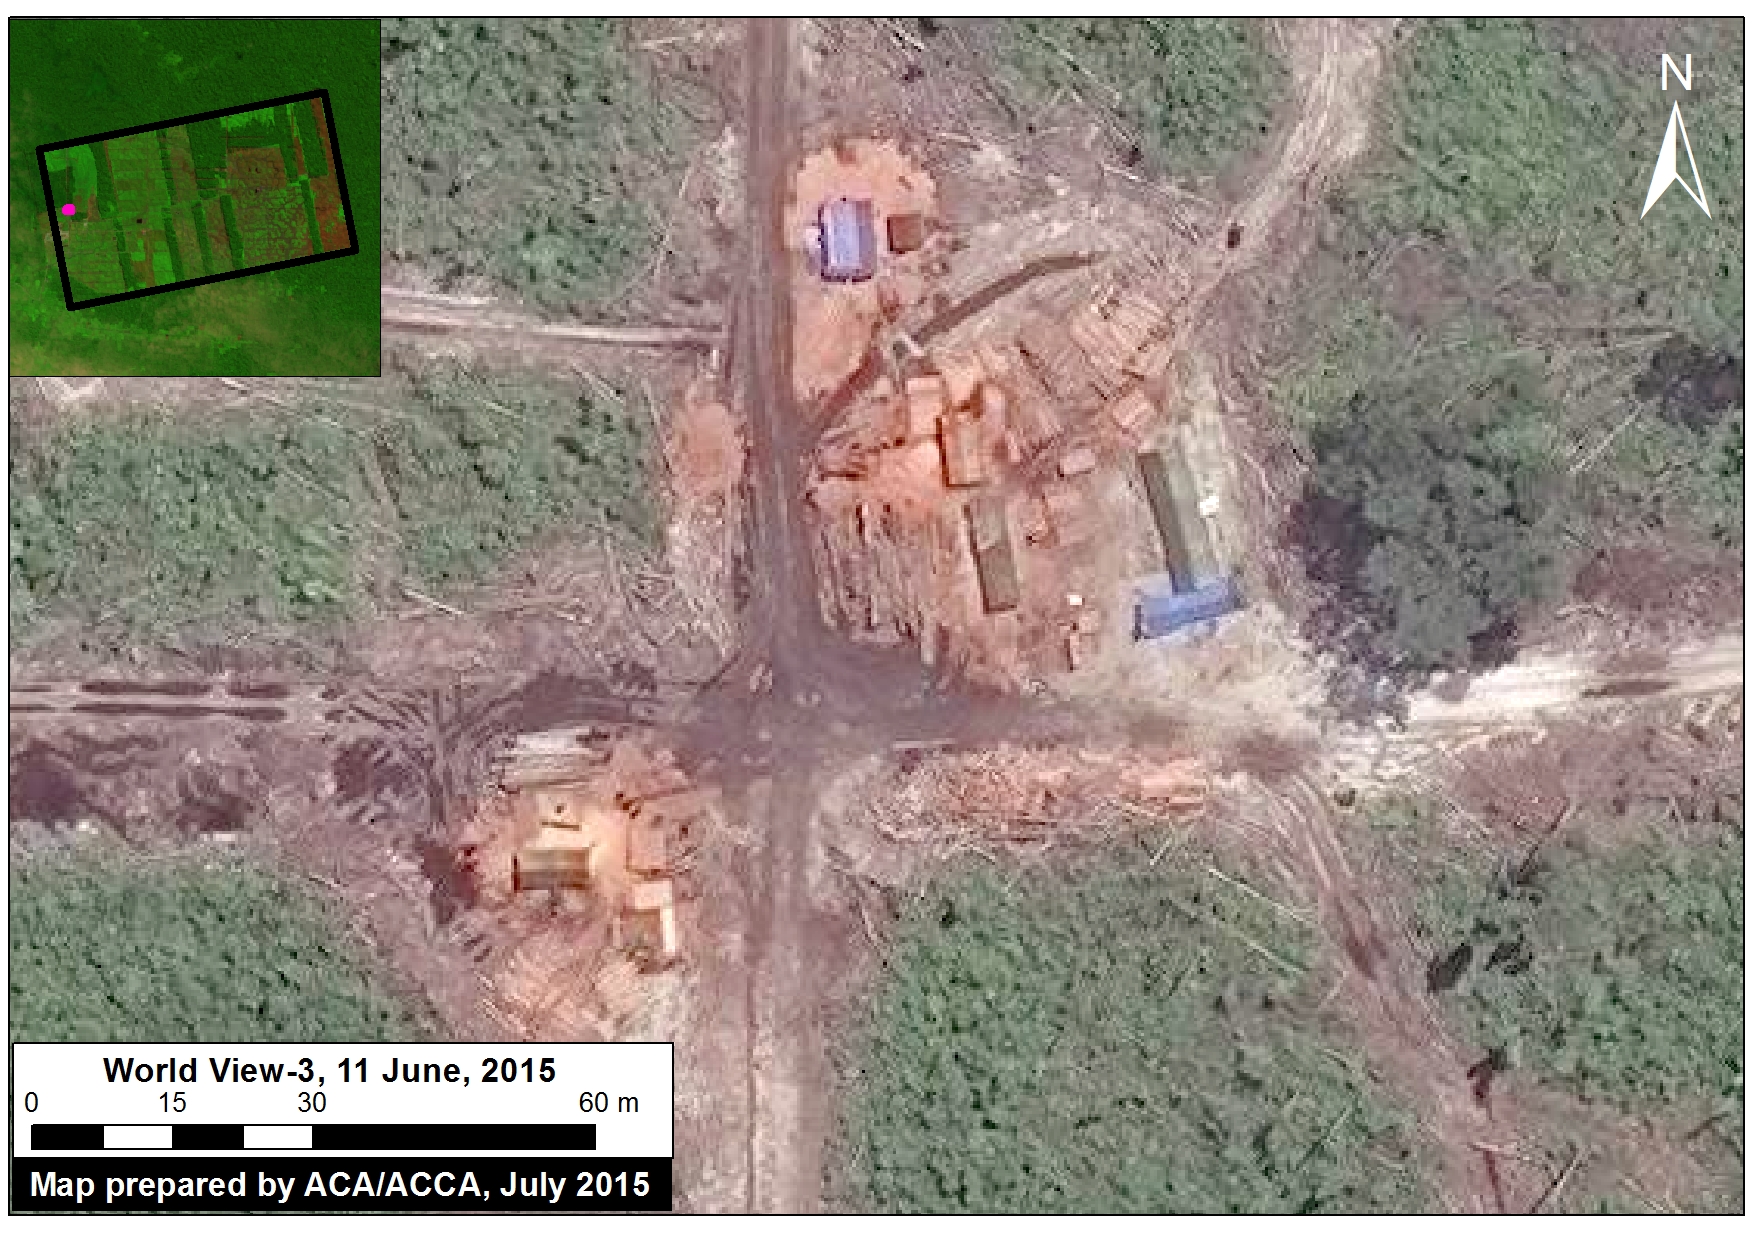
Image 10c. Coca density data (upper panel) in relation to a recent high resolution satellite image of the area (lower panel). Data: UNODC 2014, SERNANP, Worldview-2 from Digital Globe (NextView).
In the recent UNODC (United Nations Office on Drugs and Crime) report “Monitoreo de Cultivos de Coca 2014” [Coca Crop Monitoring 2014], it was reported that the Loromayo sector (coca zone San Gabán) has a medium to high density of coca cultivation, with a recent increase of 5.9% since 2013. Therefore, we conculde that coca cultivation is one of the major drivers of the observed deforestation.
Image 10c displays the most recent UNODC coca density data (upper panel) in relation to a recent high resolution satellite image of the area (lower panel). Deforestation is rapidly expanding in the vicinity of the Park boundary. Unfortunately, in this image, a few clouds cover the small area where the deforestation recently entered Park.
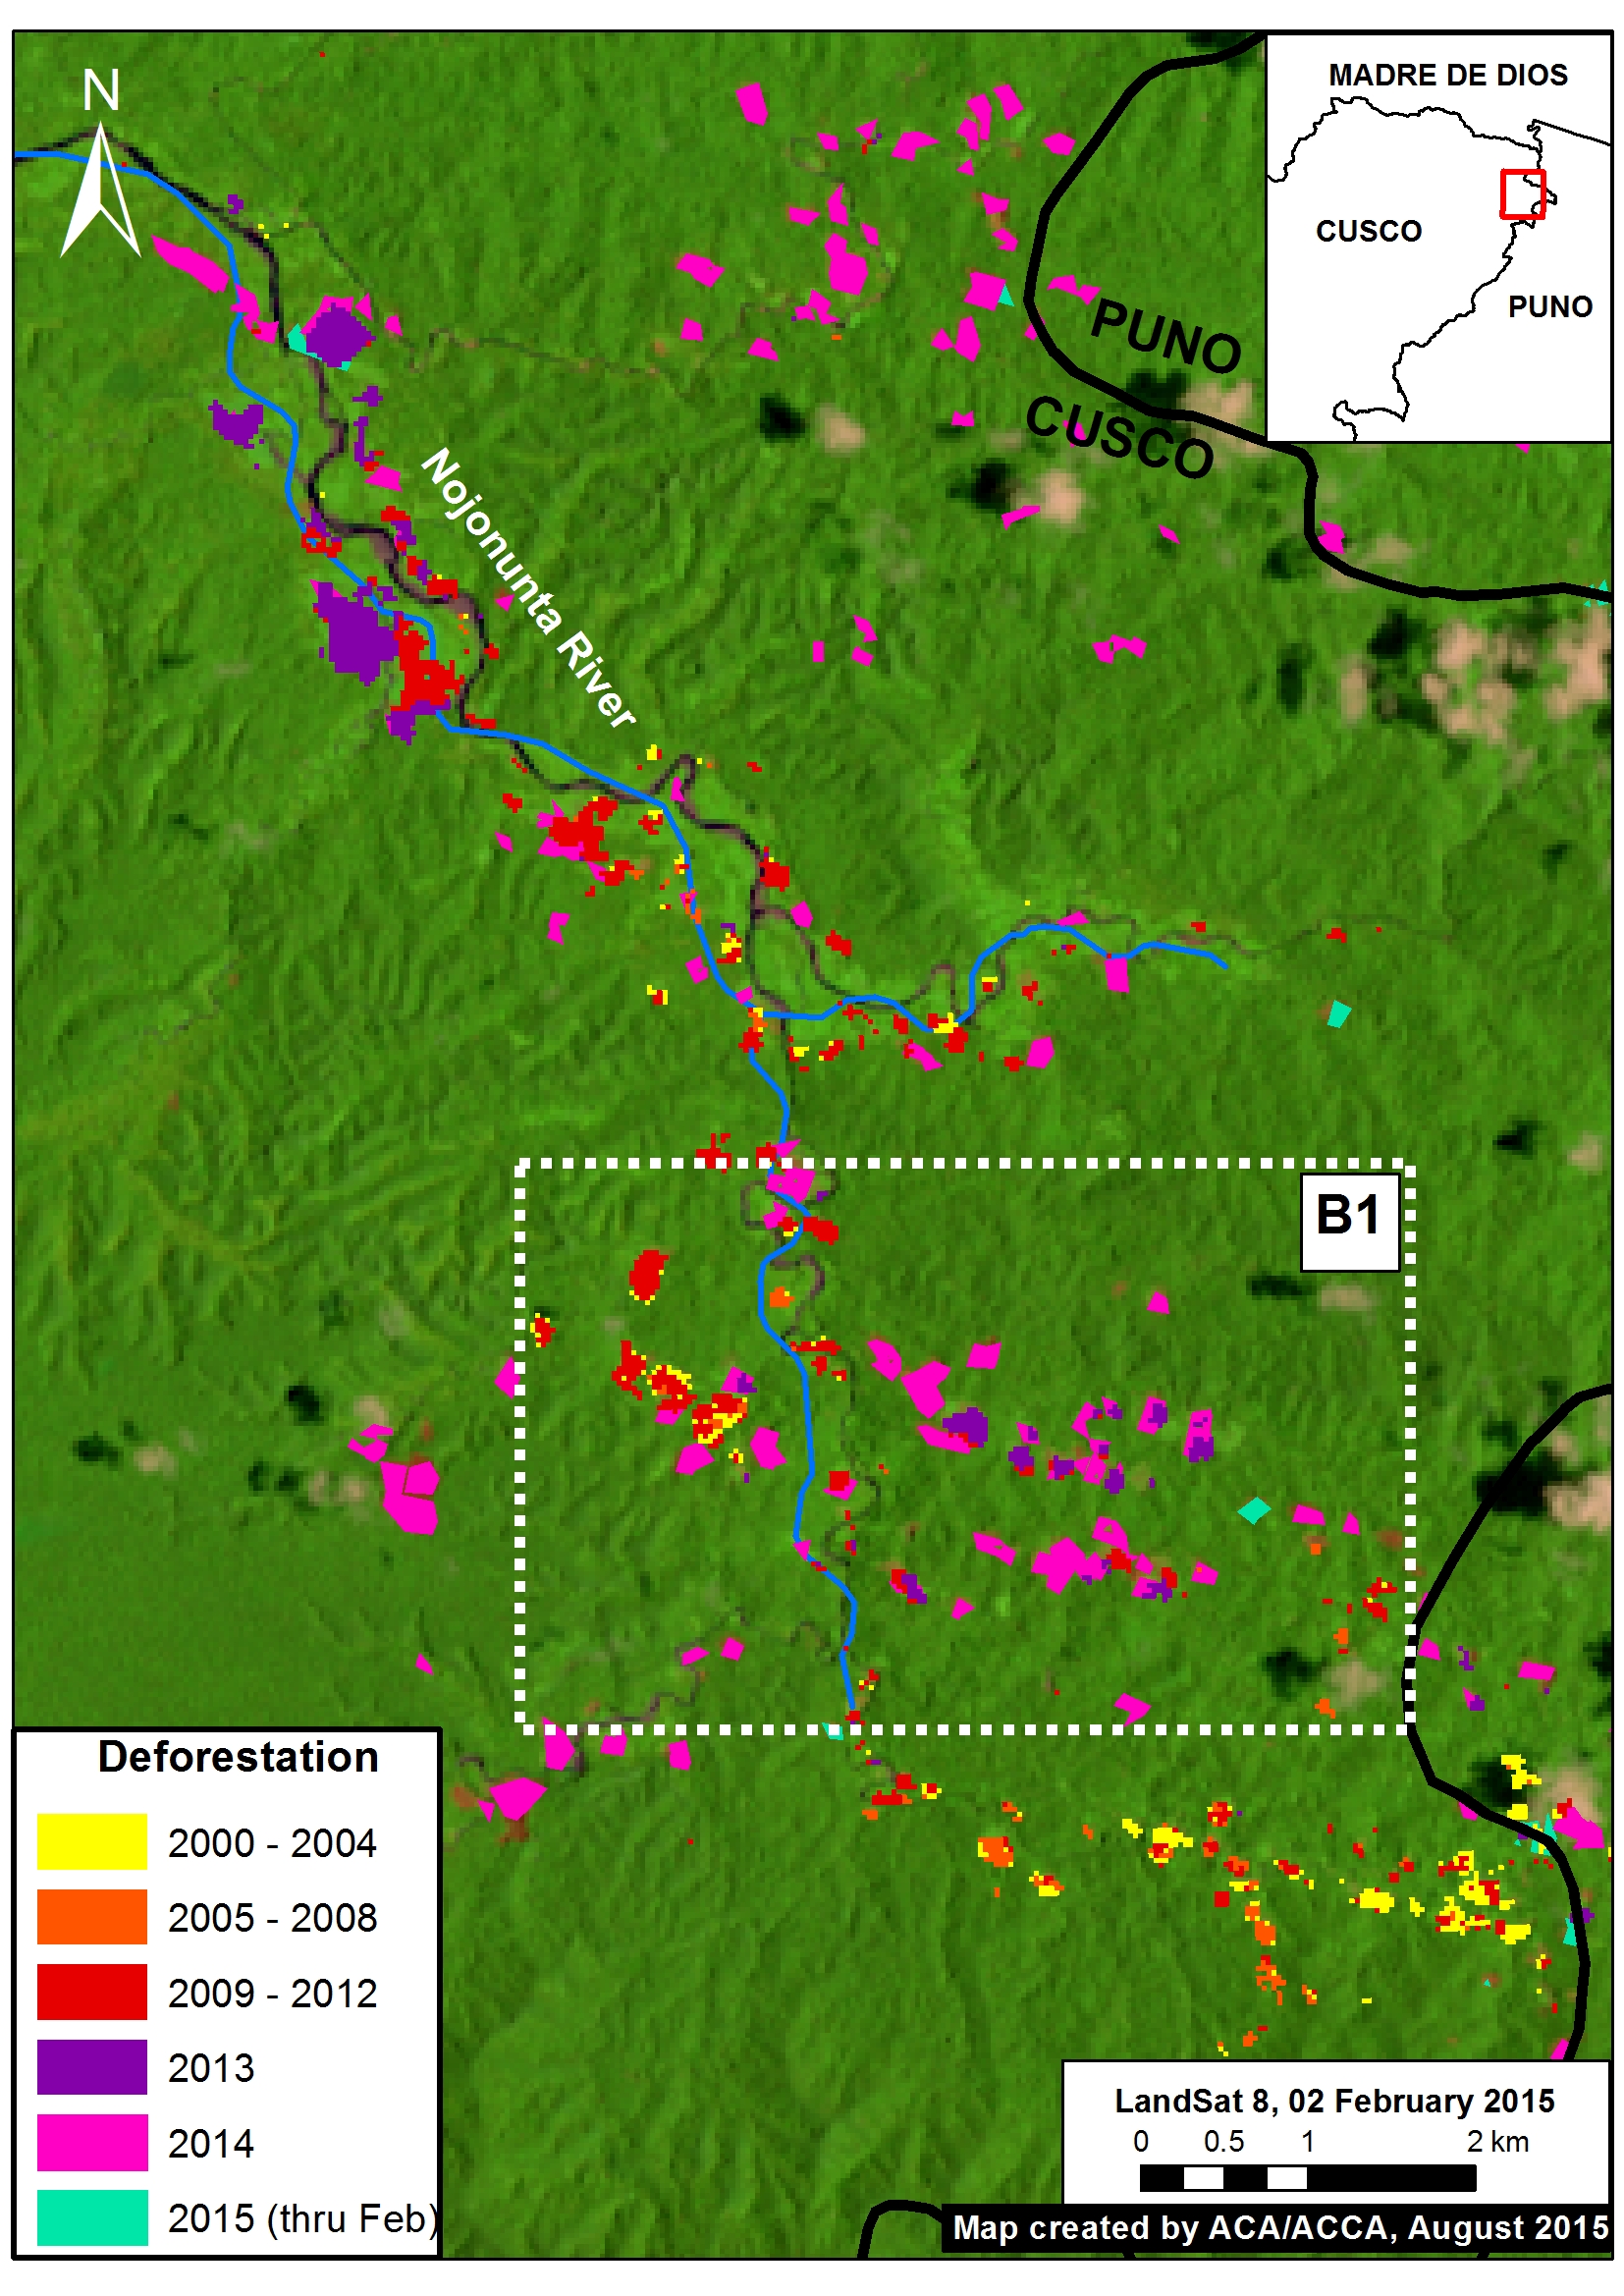
Zoom B: Sector Colorado (Southeastern section of Park)
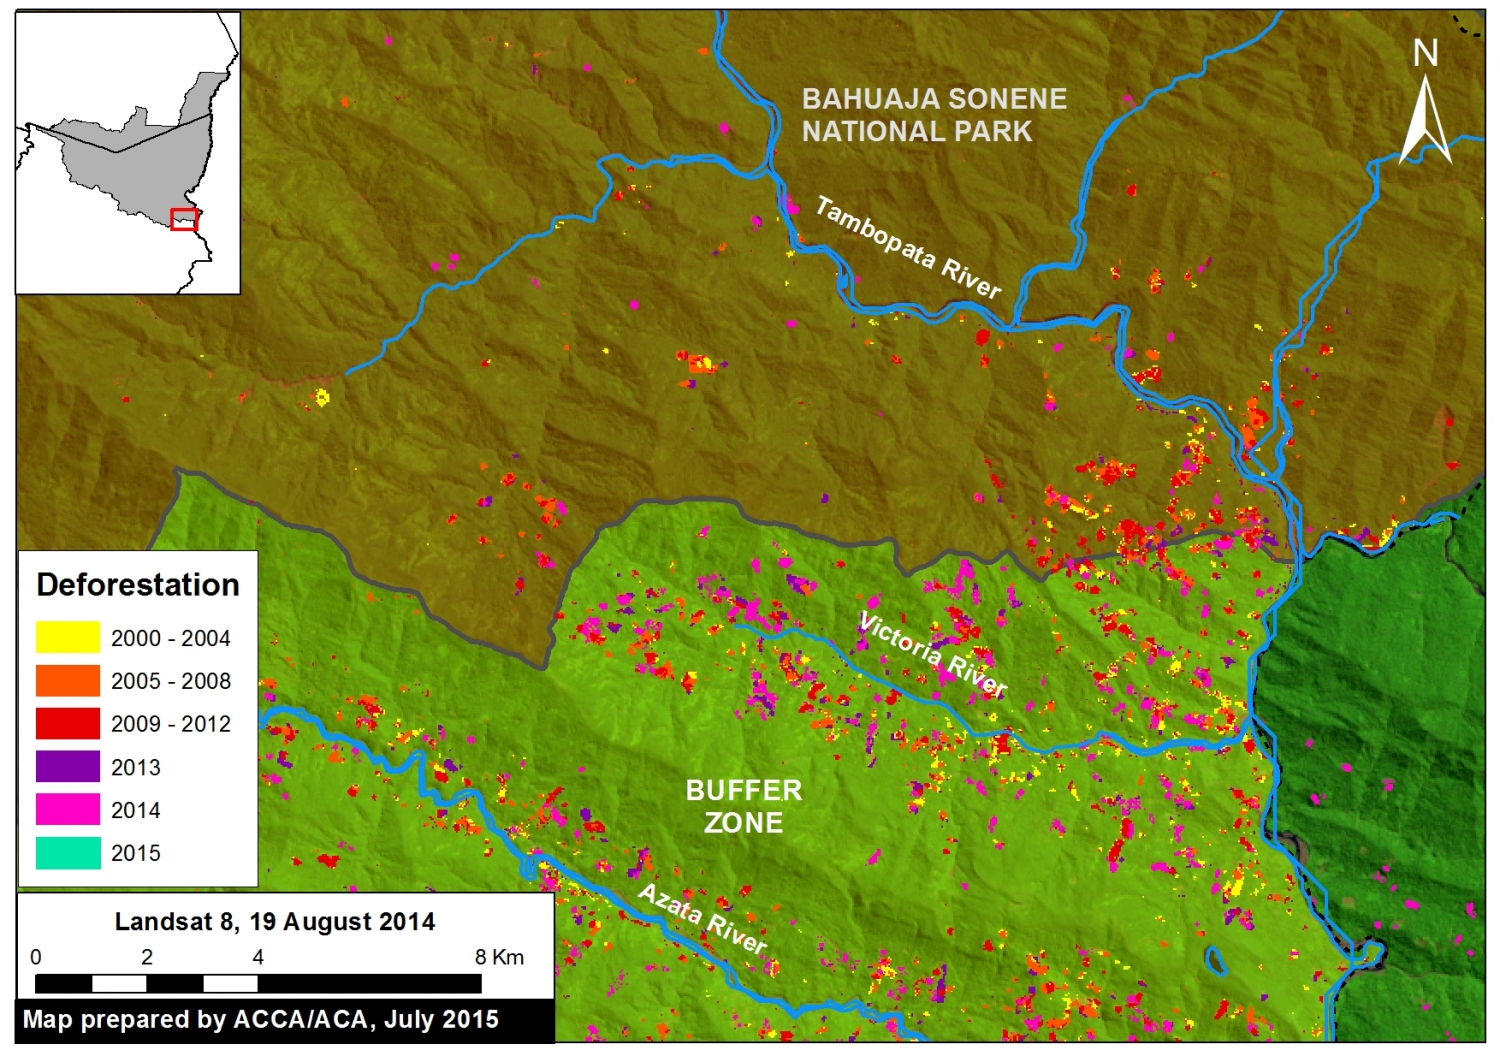
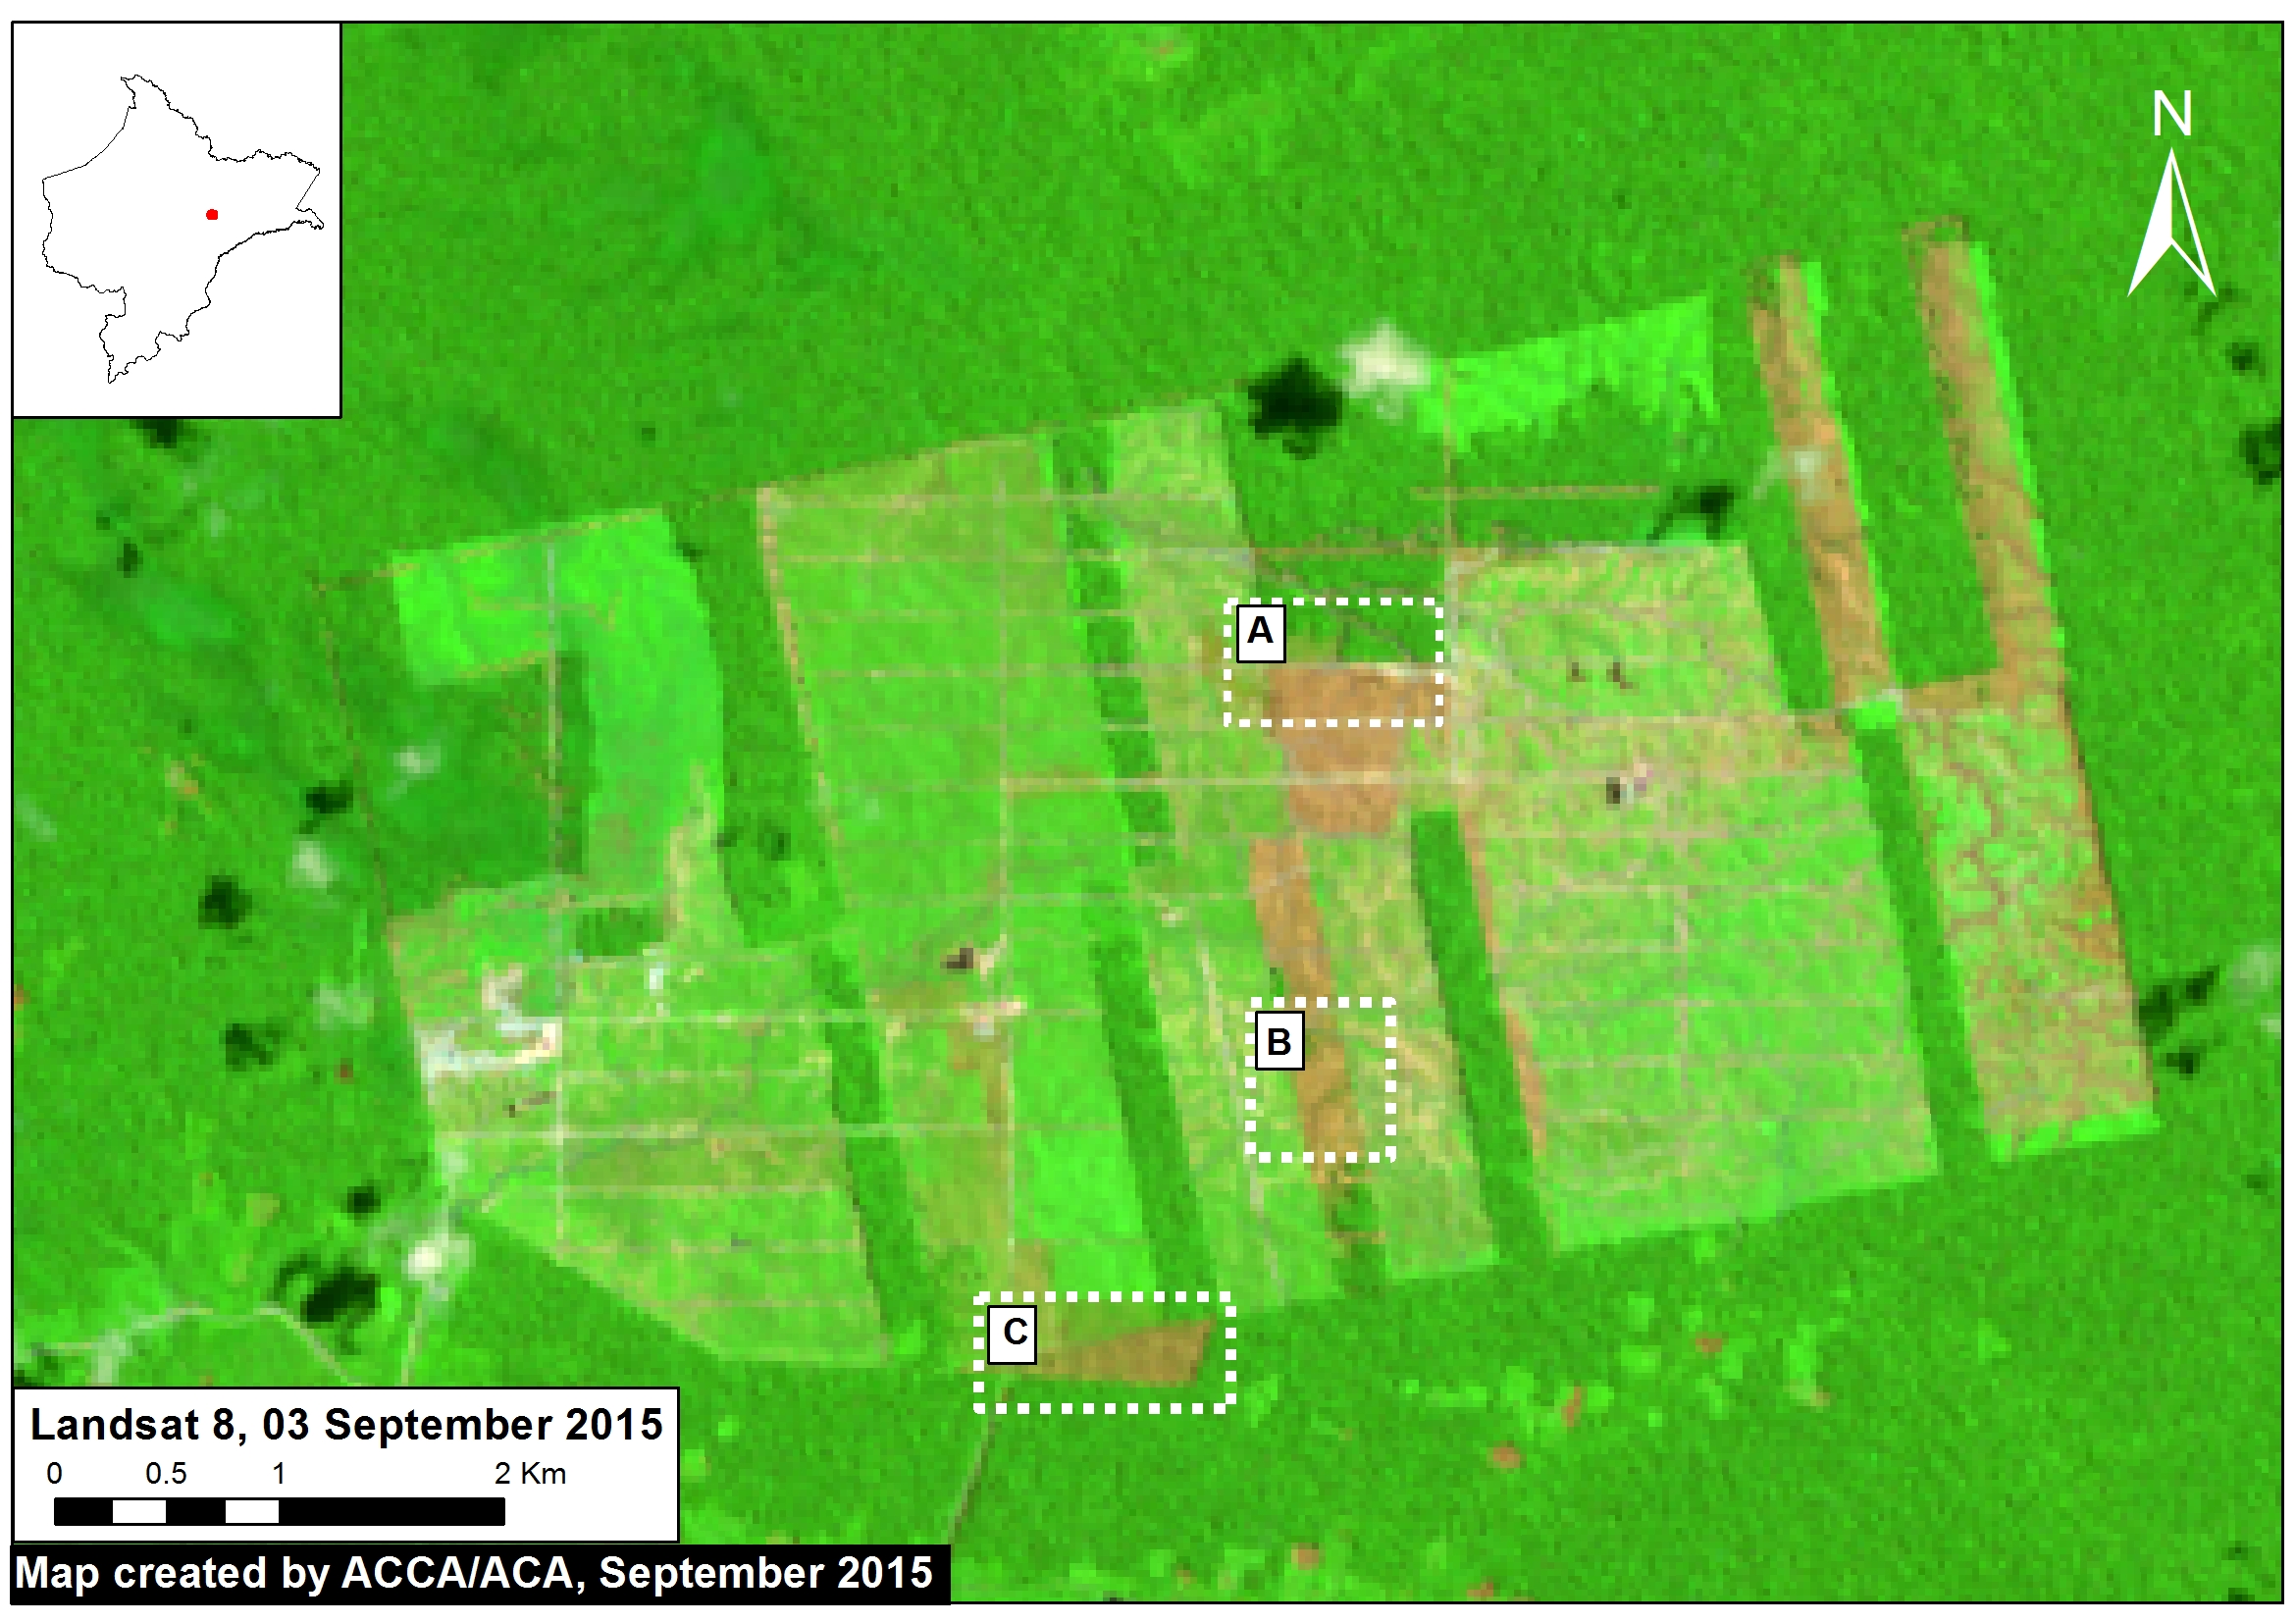
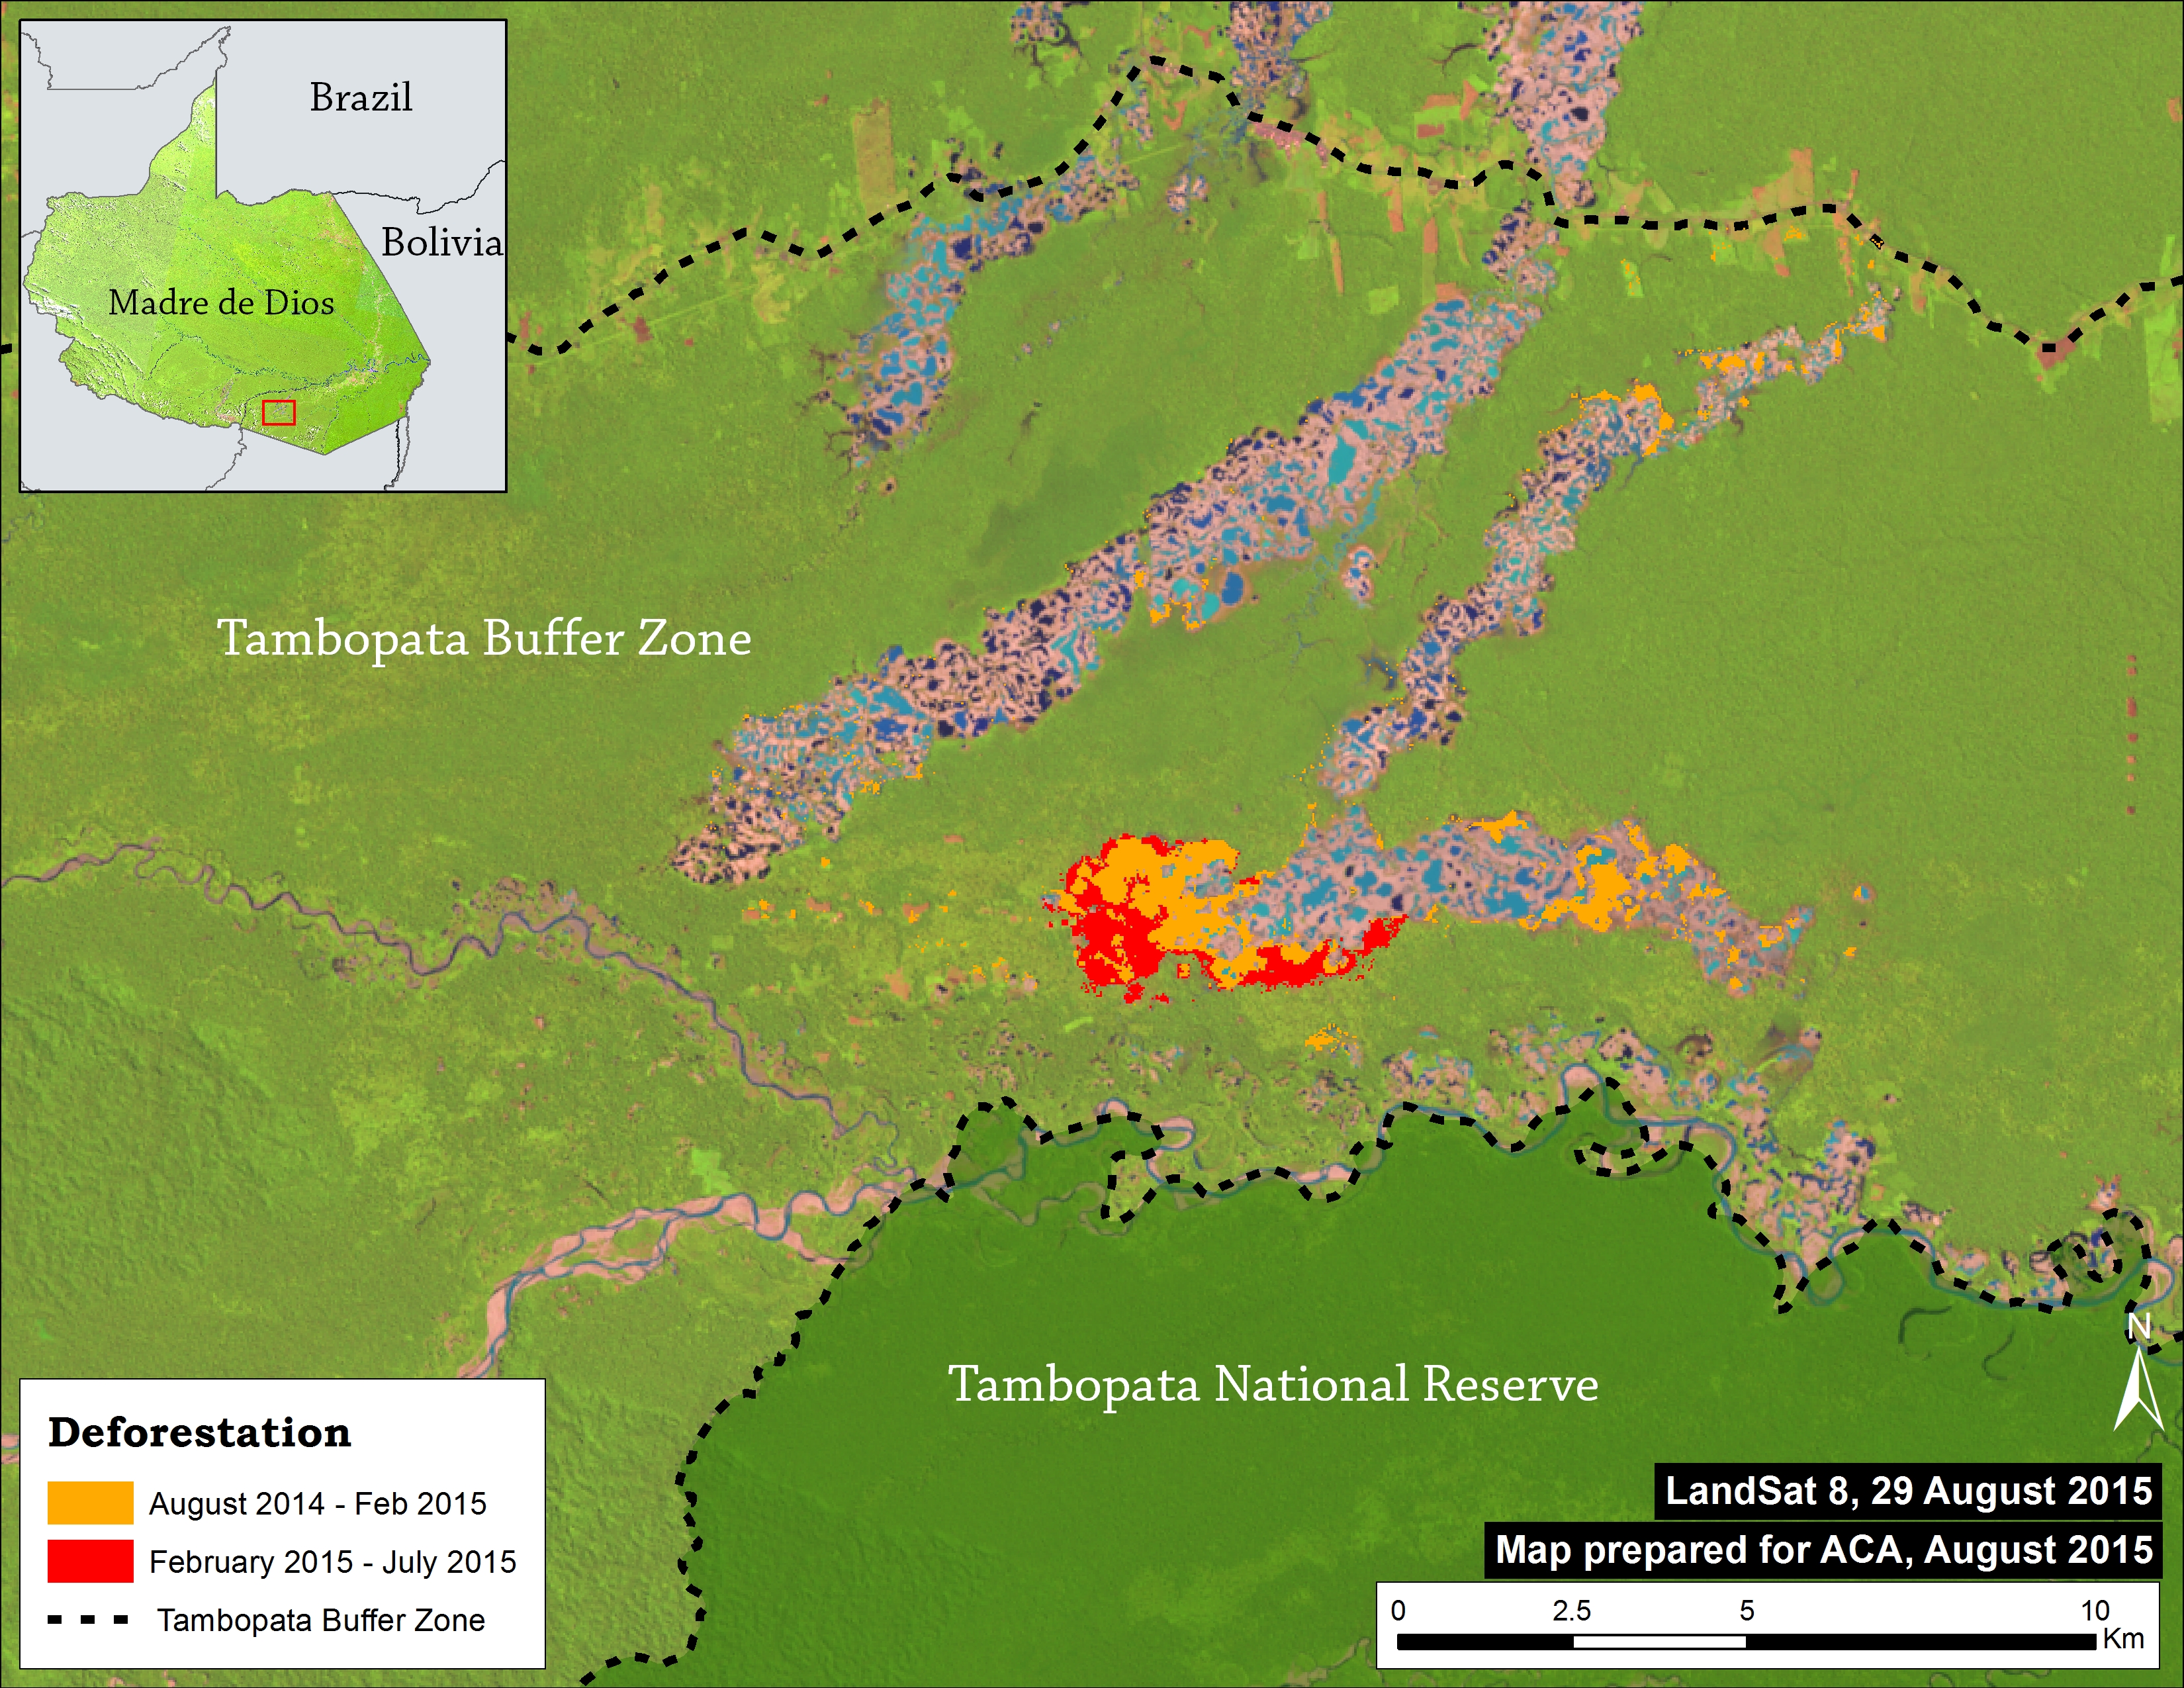
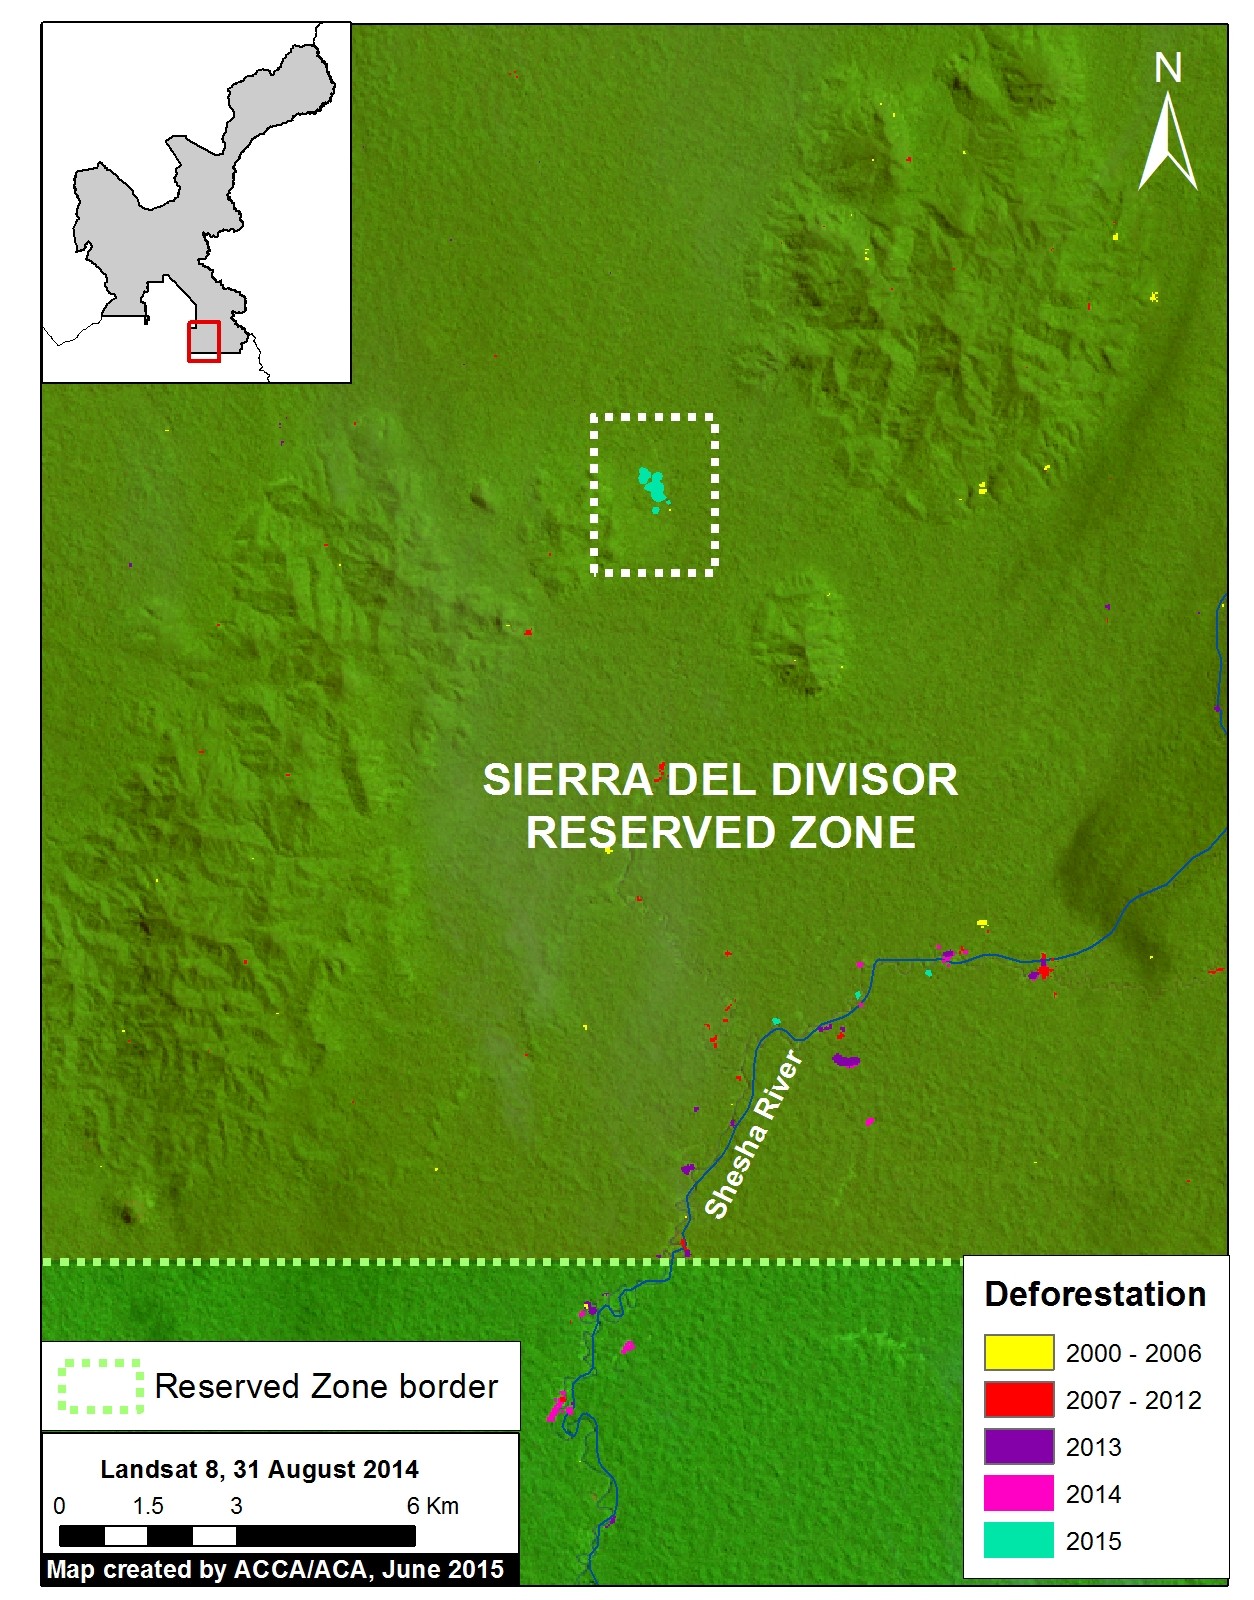
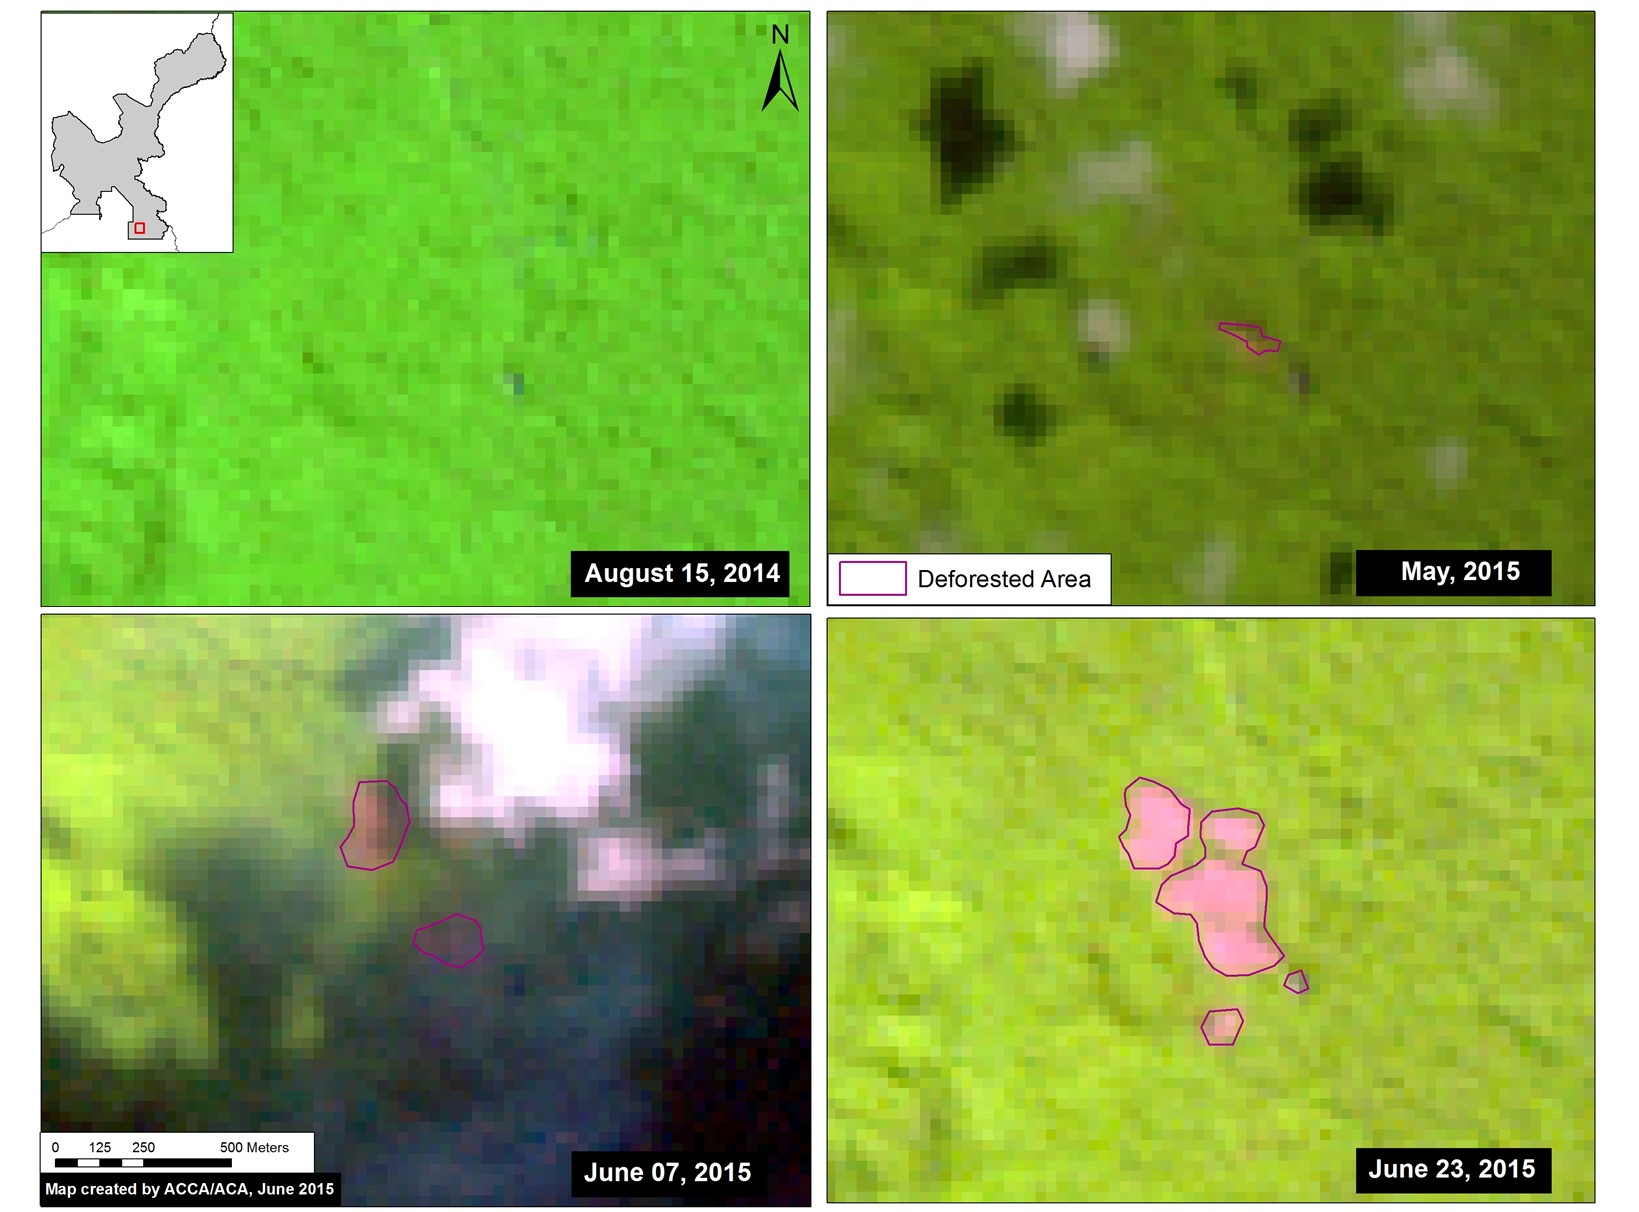
Image 10d. The expansion of deforestation in the Colorado sector of Bahuaja Sonene National Park. Data: SERNANP, USGS, IBC, PNCB.
As seen in Figure 10d, deforestation is well established and increasing in the sector Colorado, located in the southeast section of Bahuaja Sonene National Park, with the Region of Puno. Our analysis in this area extended from the upper Tambopata River to the Azata river.
We document the deforestation, since 2001, of 538 ha inside the Park and an additional 1,172 ha within the surrounding buffer zone. Similar to the sector Loromayo sector, there was a marked increase in deforestation since 2010, with a peak in 2014. More than half of the deforestation (53%, 287 ha) occurred since 2010, with a maximum of 81 ha in 2014. Not much data is yet available for 2015.
Sector Colorado: Presence of Coca Cultivation Inside the Park
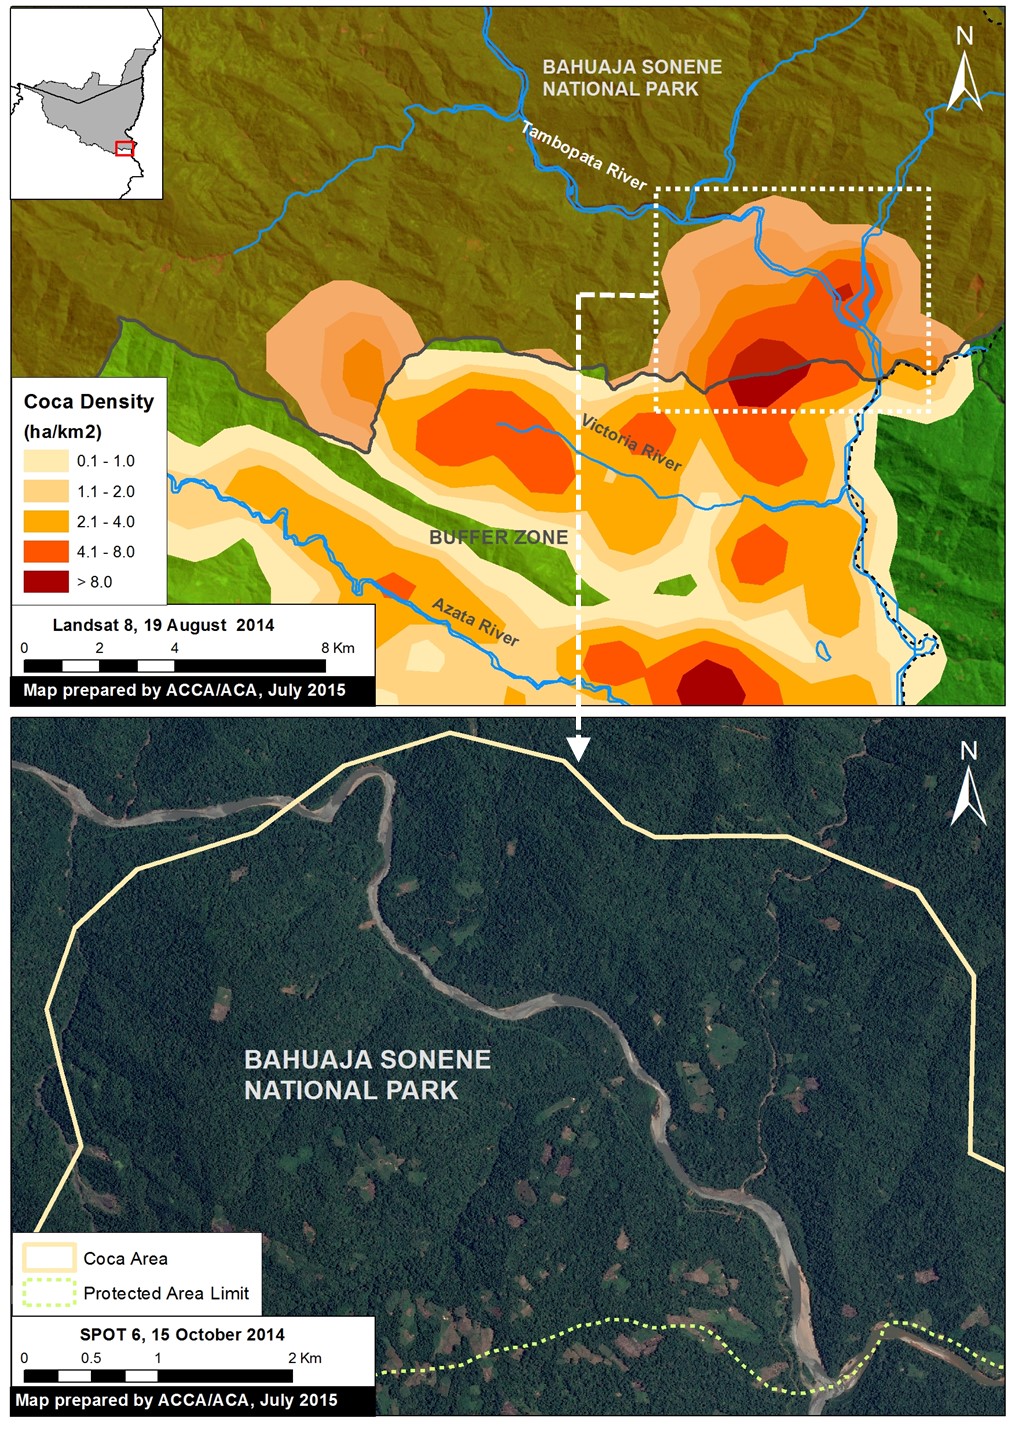
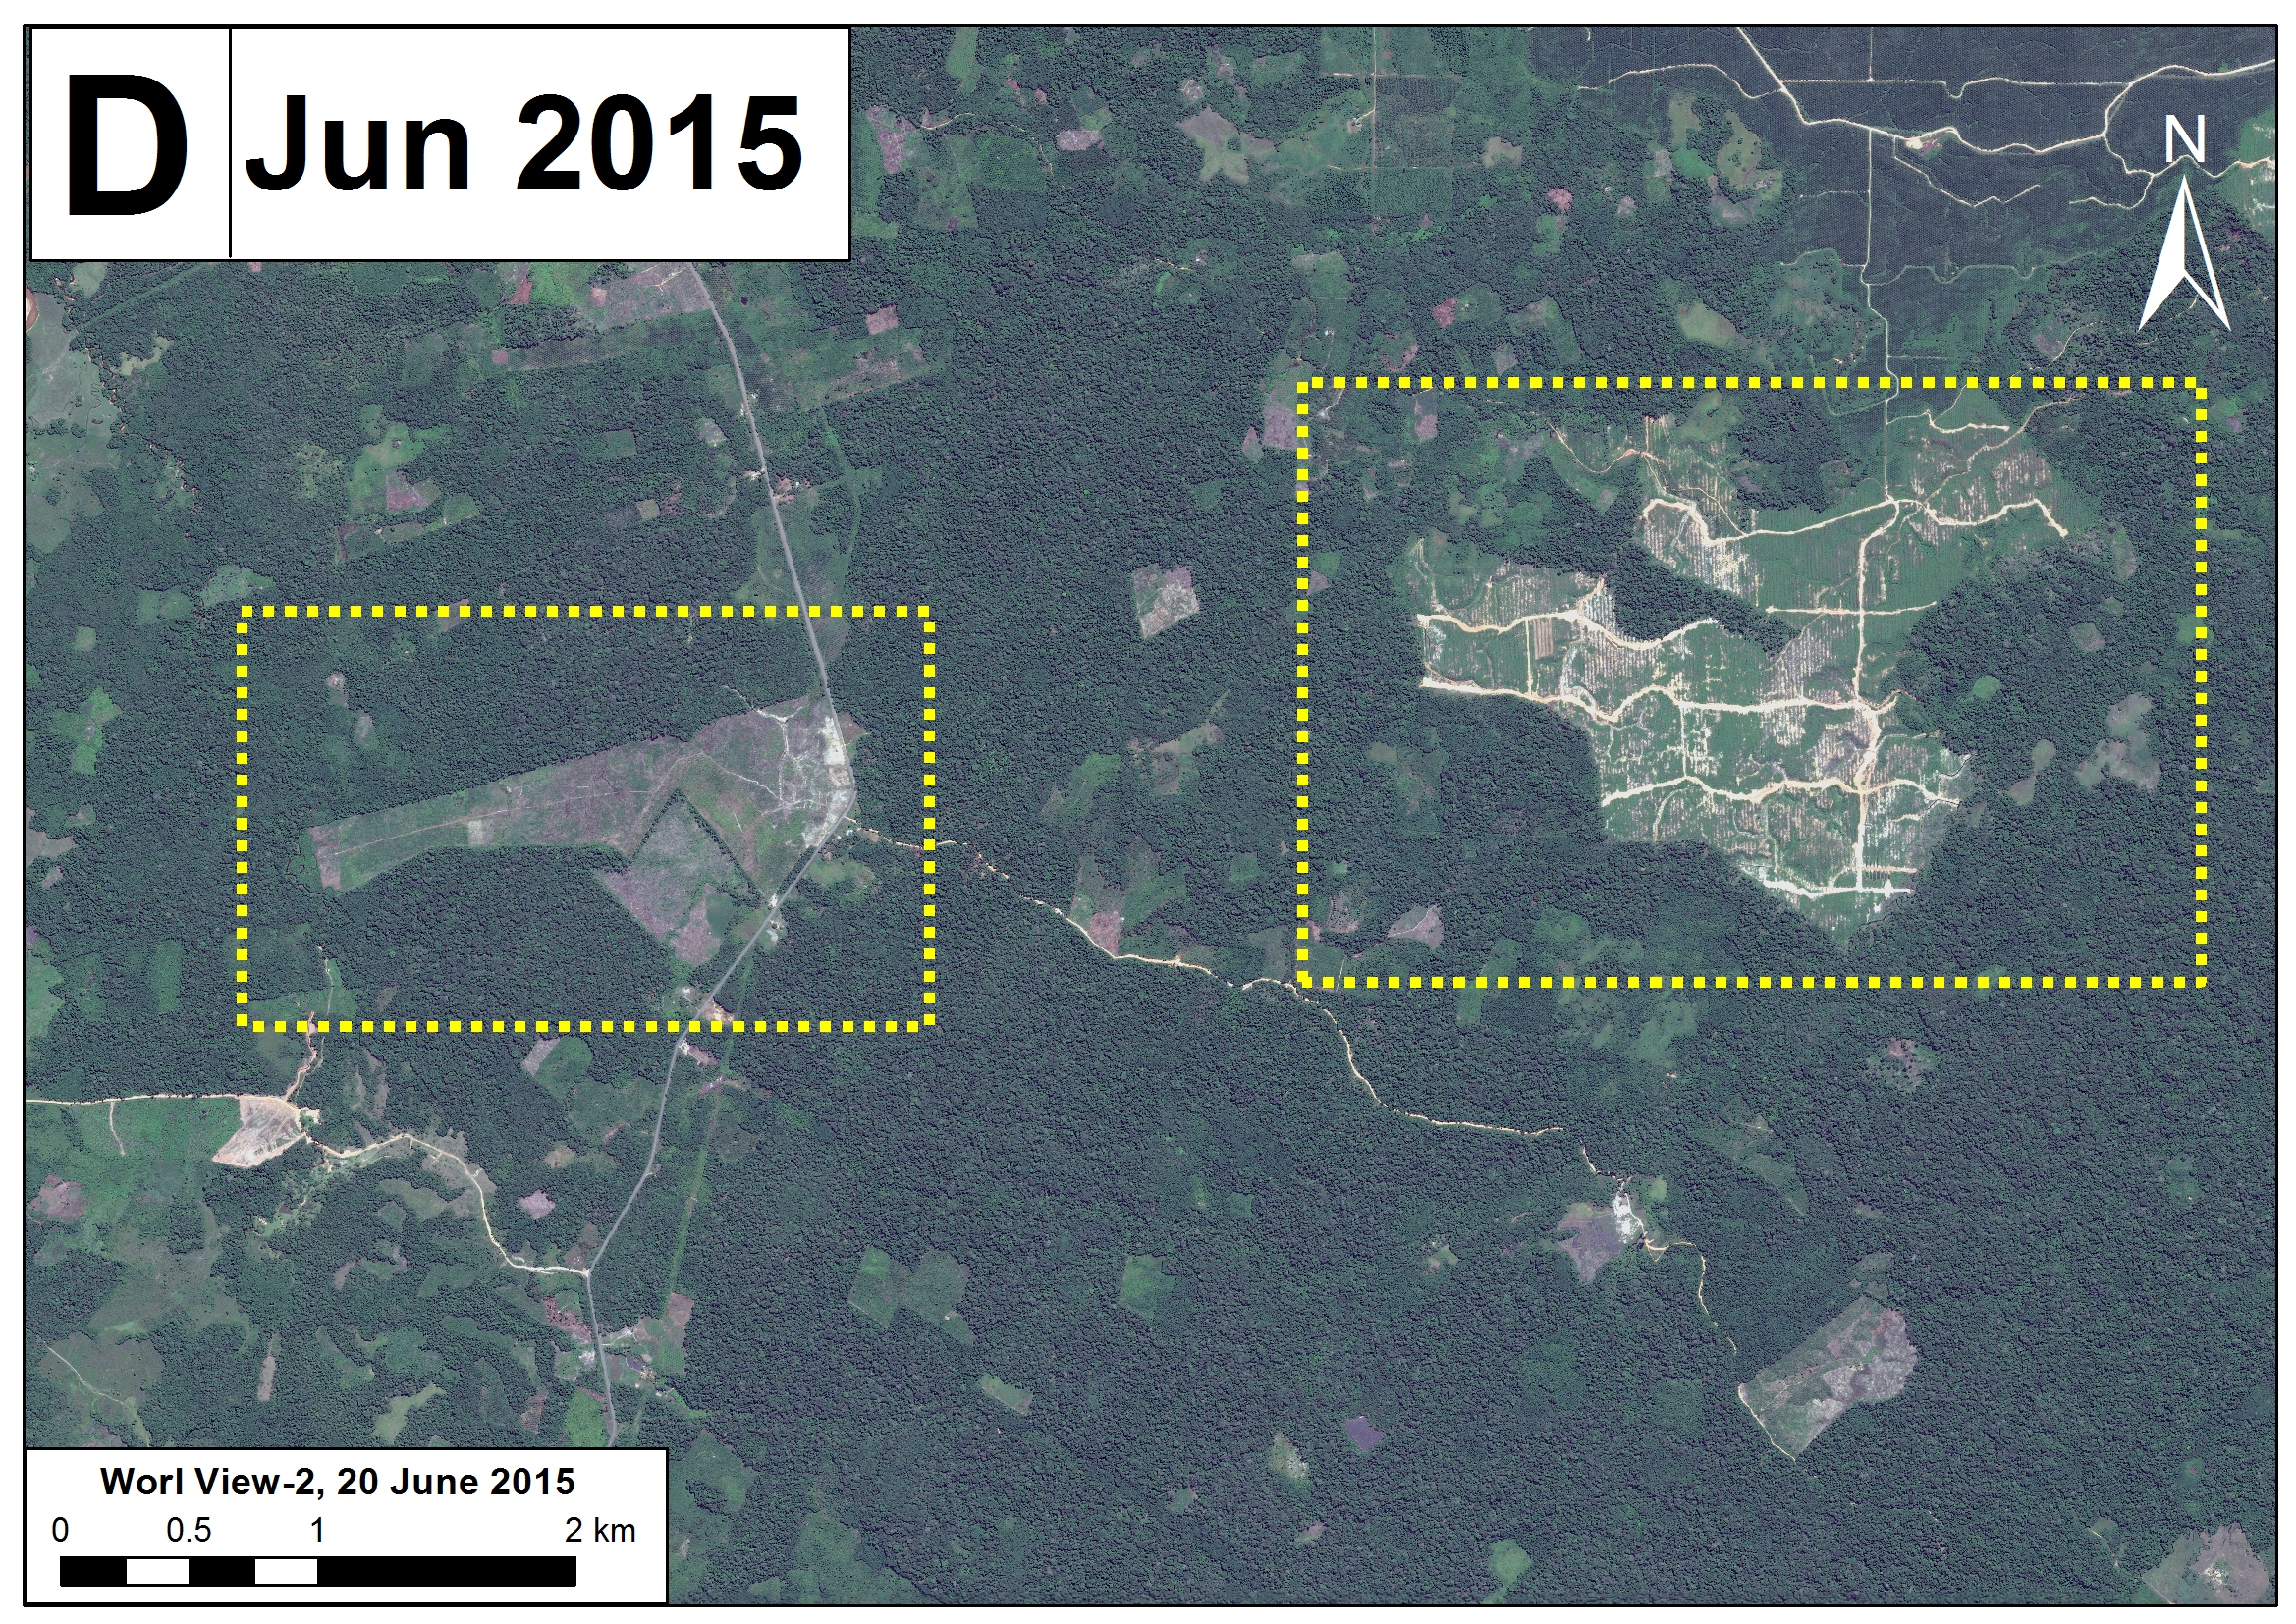
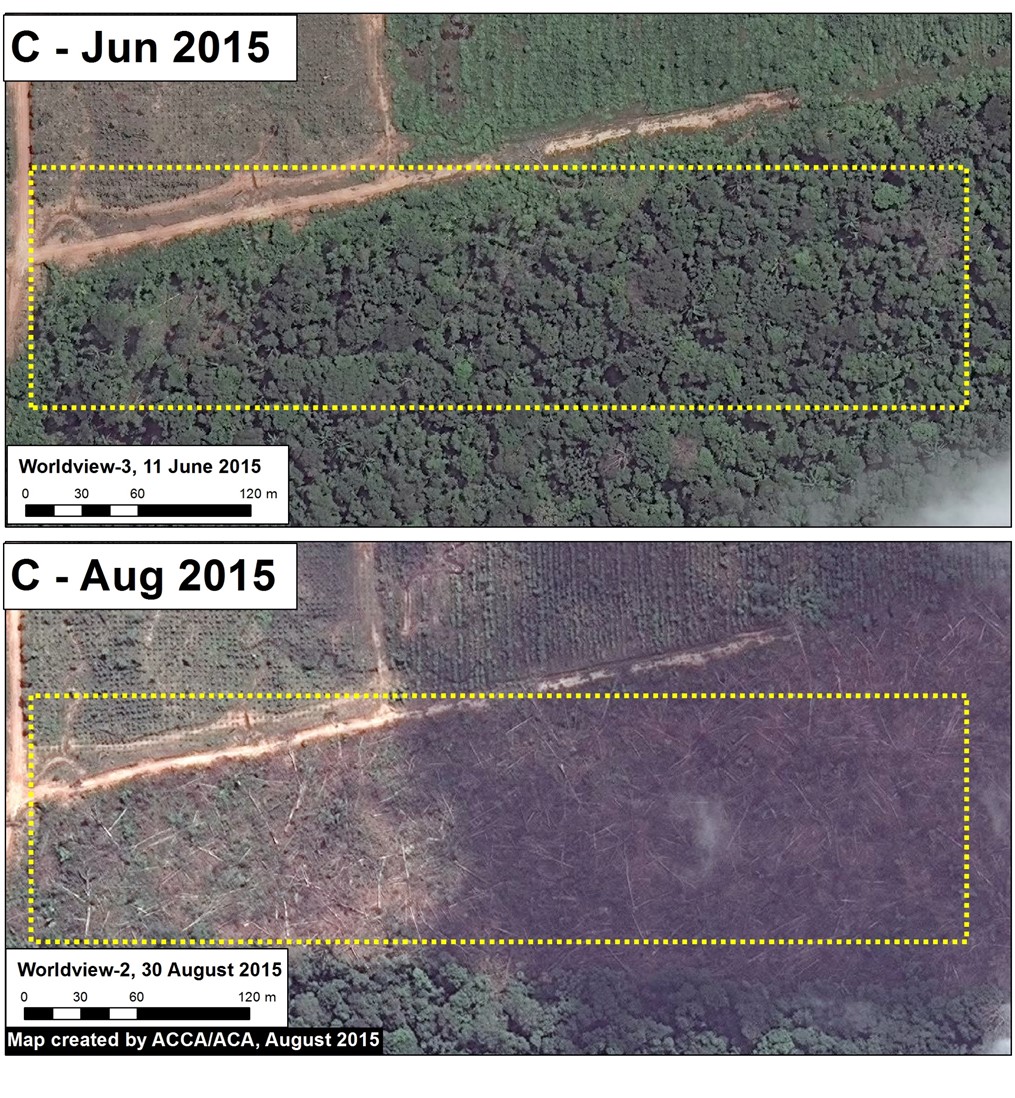
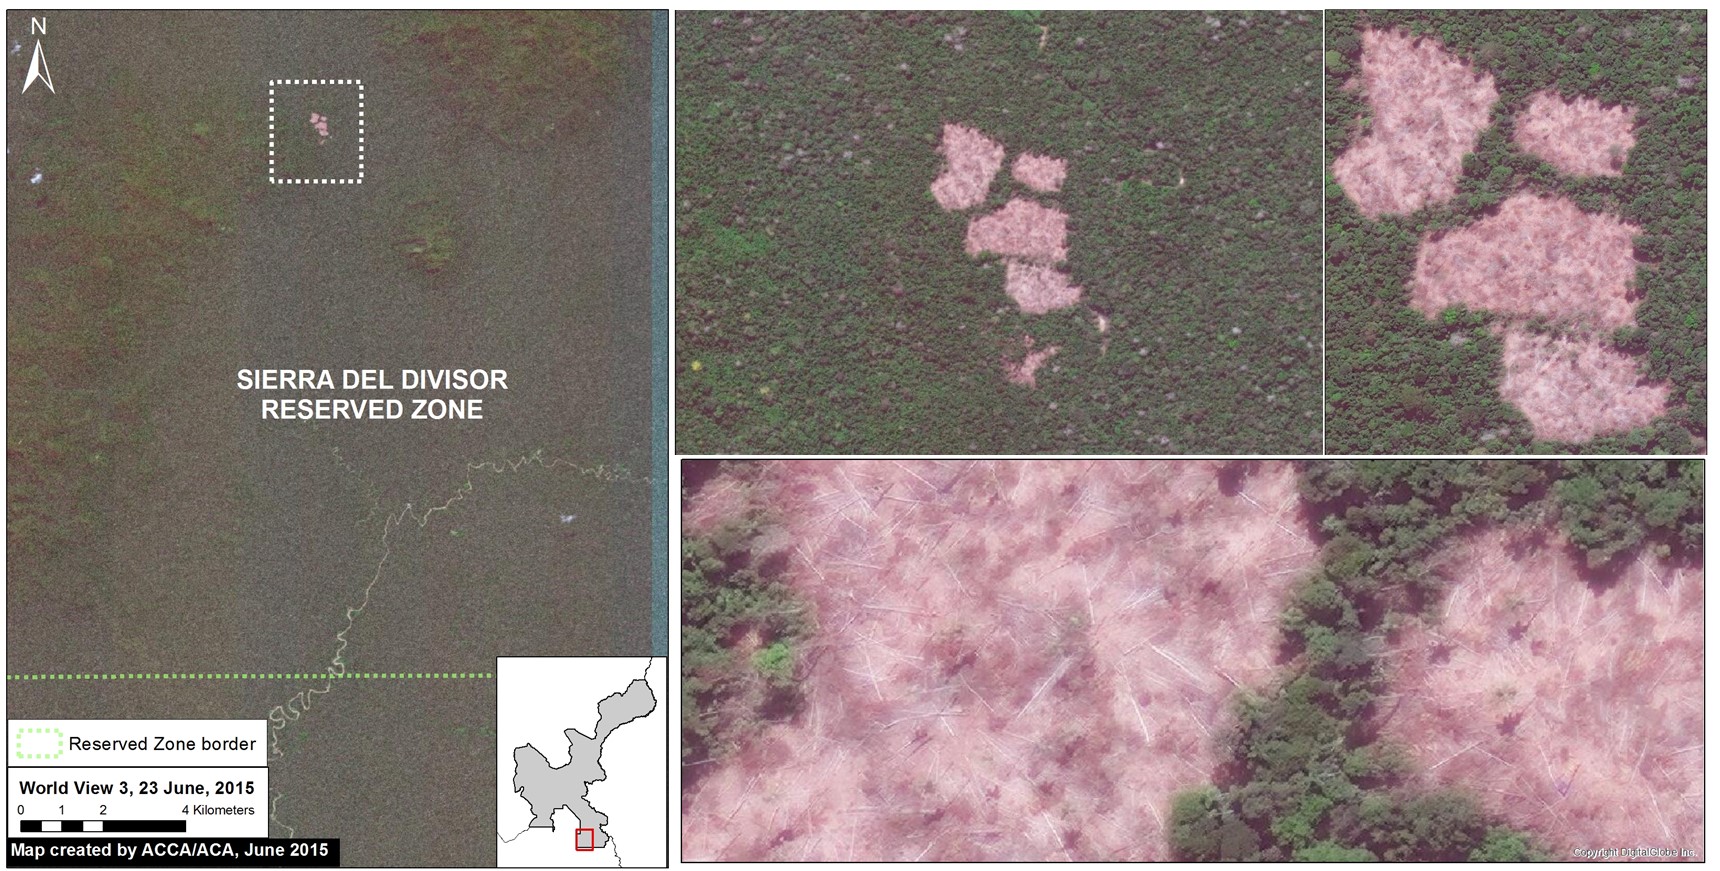
Image 10e. Coca density data (upper panel) in relation to a recent high resolution satellite image of the area (lower panel). Data: UNODC 2014, SERNANP, SPOT6 from Airbus.
According to a recent report by the Wildlife Conservation Society (WCS), the deforestation in the Colorado sector was a result of the advance of agriculture and livestock cultivation in the area. Moreover, according to the recent UNODC report noted above, this sector (coca zone Inambari-Tambopata) also has a high density of coca, with 108 ha on the interior of Bahuaja Sonene National Park and 1,610 ha in the buffer zone, likely making it one of the major drivers of the observed deforestation.
Image 10e displays the UNODC coca density data (upper panel) in relation to a recent high resolution satellite image of the area (lower panel).
SERNANP Response
In response to this article, SERNANP (the Peruvian protected areas agency) issued this statement:
“El sector denominado como Colorado es sector ubicado dentro del Parque Nacional Bahuaja Sonene, que actualmente se encuentra zonificado como Zona de Recuperación; dicha zonificación se otorga a aquellas zonas que por actividades antrópicas han sido afectadas y que necesitan estudios complementarios para determinar su zonificación definitiva.”
[The sector named ‘Colorado’ is a sector located within the Bahuaja Sonene National Park, which currently is zoned as a ‘Restoration Zone.’ Said zoning is extended to those zones which have been affected due to anthropic activities and require supplementary studies so as to determine their definitive zoning designation.]
Debemos señalar que en este sector se han detectado severas plagas que afectan los cultivos de frutos como la naranja y café, desencadenando que la población asentada en la zona de amortiguamiento del Parque se vean forzada a reemplazar estas plantaciones por el cultivo de coca en algunos casos.
[We should note that severe pests have been detected in this sector which affect the cultivation of fruit such as oranges and coffee; this has lead the population settled in the park’s buffer zone to have no choice but to replace these crops with the cultivation of coca in some cases.]
Esta situación ha sido identificada y advertida oportunamente por el jefe del Parque Nacional Bahuaja Sonene a las entidades pertinentes para iniciar su erradicación; no obstante, el SERNANP también ha emprendido un trabajo conjunto con las autoridades locales y el comité de gestión del área natural protegida para combatir esta amenaza, lo cual figura en el Plan Maestro 2015-2019 del área en mención. Ahí se contemplan estrategias como la construcción de un puesto de control y vigilancia para monitorear permanentemente esta situación.
[The head of the Bahuaja Sonene National Park has identified and issued a warning about this situation in a timely manner to the relevant entities so as to initiate its eradication work; notwithstanding, SERNANP has also undertaken joint work with local authorities and the management committee of the natural protected area to combat this threat, which figures in the 2015-2019 Master Plan of the area in question. The latter contains strategies such as the construction of a checkpoint and guard post for permanently monitoring this situation.]
Asimismo, se vienen promoviendo mesas de diálogo y el desarrollo de actividades económicas sostenibles que reemplacen los cultivos ilícitos y que garanticen la calidad de vida de la población de Colorado.”
[Likewise, dialogue roundtables and the development of sustainable economic activities have been promoted that can replace the illicit crops and guarantee quality of life for the population of Colorado.]
Citation
Finer M, Novoa S (2015) Bahuaja Sonene National Park – Increasing Deforestation Within and Around the Southern Section (Puno, Peru). MAAP: Image #10. Link: https://www.maapprogram.org/2015/07/image-10-bahuaja/
References
UNODC. Monitoreo de cultivos ilícitos Perú 2014. p 29. (Lima, 2015).