The first MAAP report, published in March 2015, took a detailed look at the escalating gold mining deforestation in the Peruvian Amazon.
The following 198 reports, over the past 8.5 years, continued to examine the most urgent deforestation-related issues across the Amazon.
For our 200th report, we provide our rapid assessment of the current state of the Amazon.
Overall, the situation is dire, with the Amazon nearing two critical deforestation-induced tipping points. The first is the widely feared conversion of moist rainforests to drier savannahs, due to decreased moisture recycling across the Amazon (see MAAP #164). The second is the more newly feared conversion of the Amazon as a critical carbon sink buffering global climate change, to a carbon source fueling it (see MAAP #144).
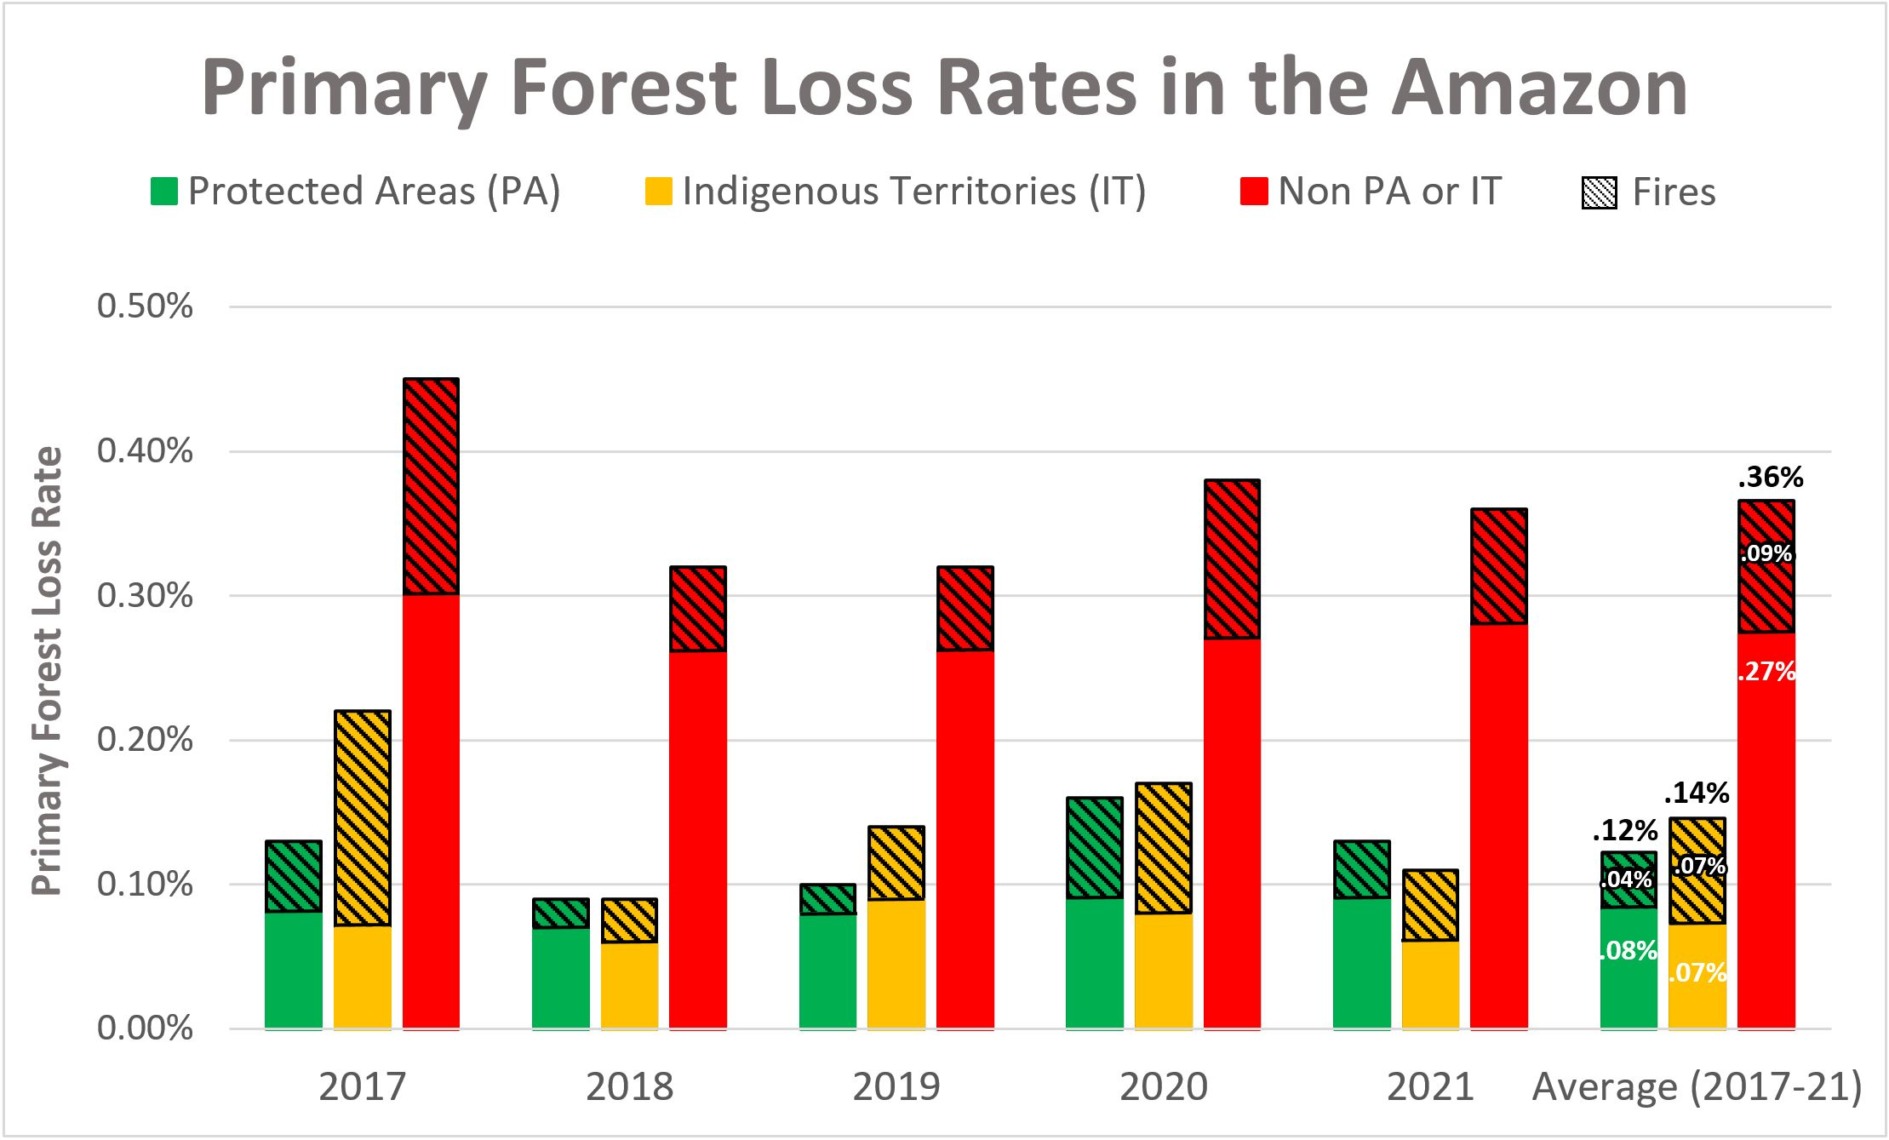
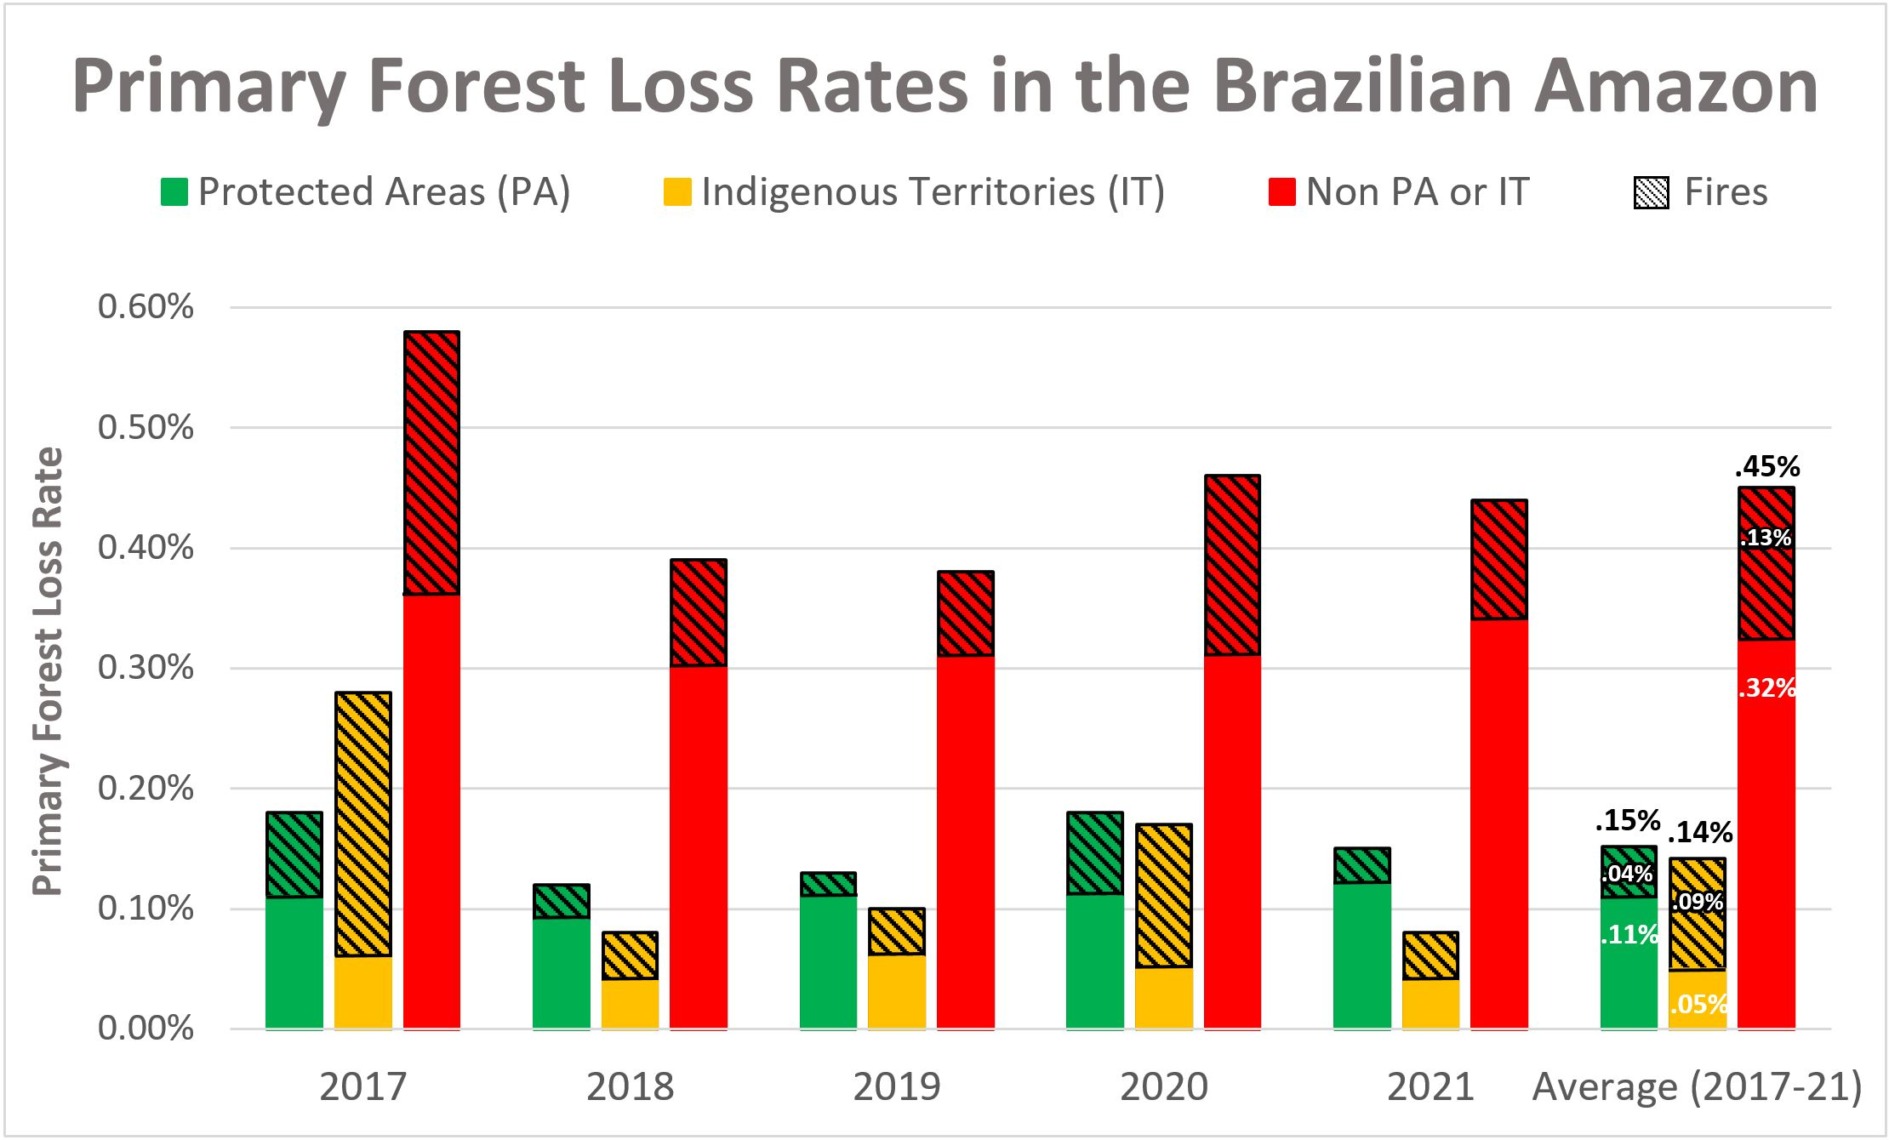
There is cause for hope, however. It is possible in the long term to protect the core Amazon, as nearly half is now designated as protected areas and indigenous territories, both of which have much lower deforestation rates than surrounding areas (see MAAP #183). Also, new NASA data reveals the Amazon is still home to abundant carbon reserves in these core areas (see MAAP #160 and MAAP #199).
Also on the positive news front, we recently reported a major reduction (over one-half) in primary forest loss between the current year 2023 and last year 2022 across the Amazon, especially in Brazil and Colombia (MAAP #201).
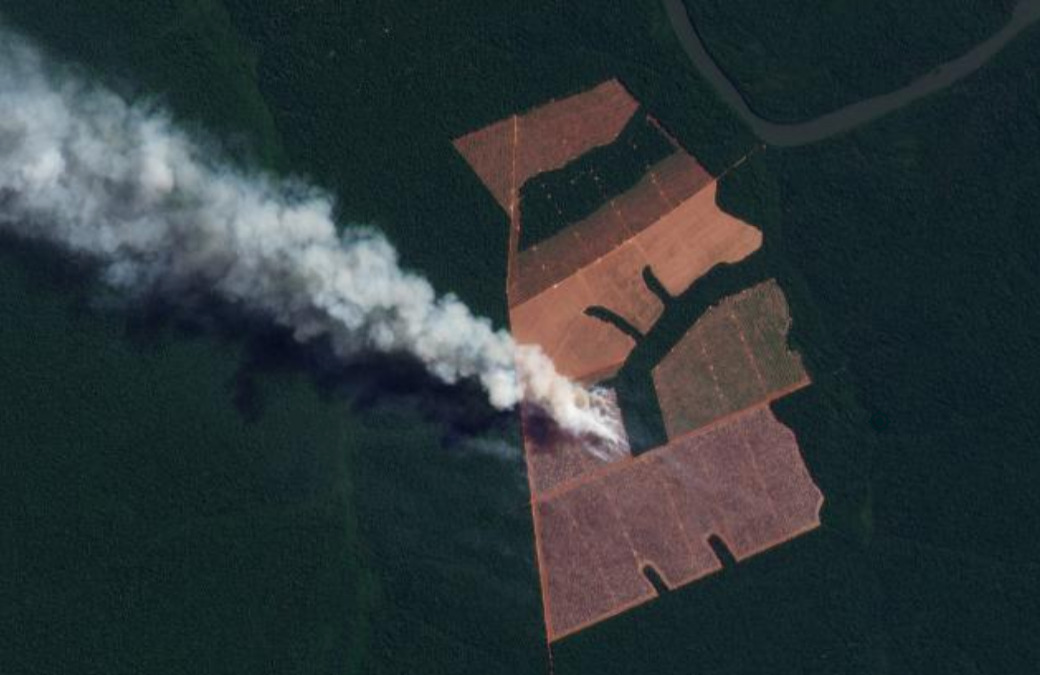
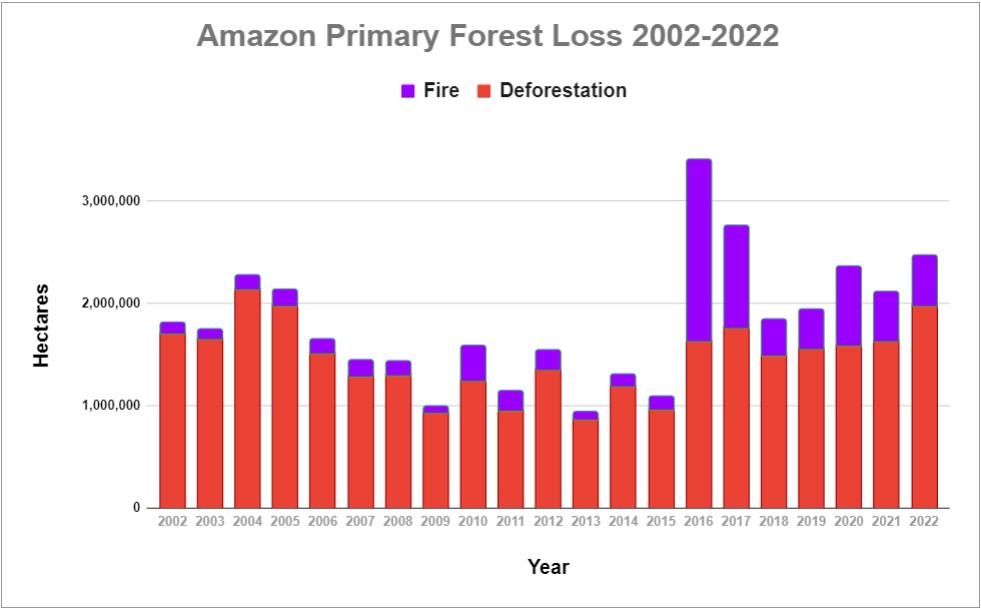
Much is made about Amazon fires in the media, but over the past several years we have revealed that the vast majority of major fires across the Amazon (namely, in Brazil, Bolivia, Peru, and Colombia) are actually burning recently deforested areas (MAAP #168). It is only during intense dry seasons that some of these fires escape and become actual forest fires.
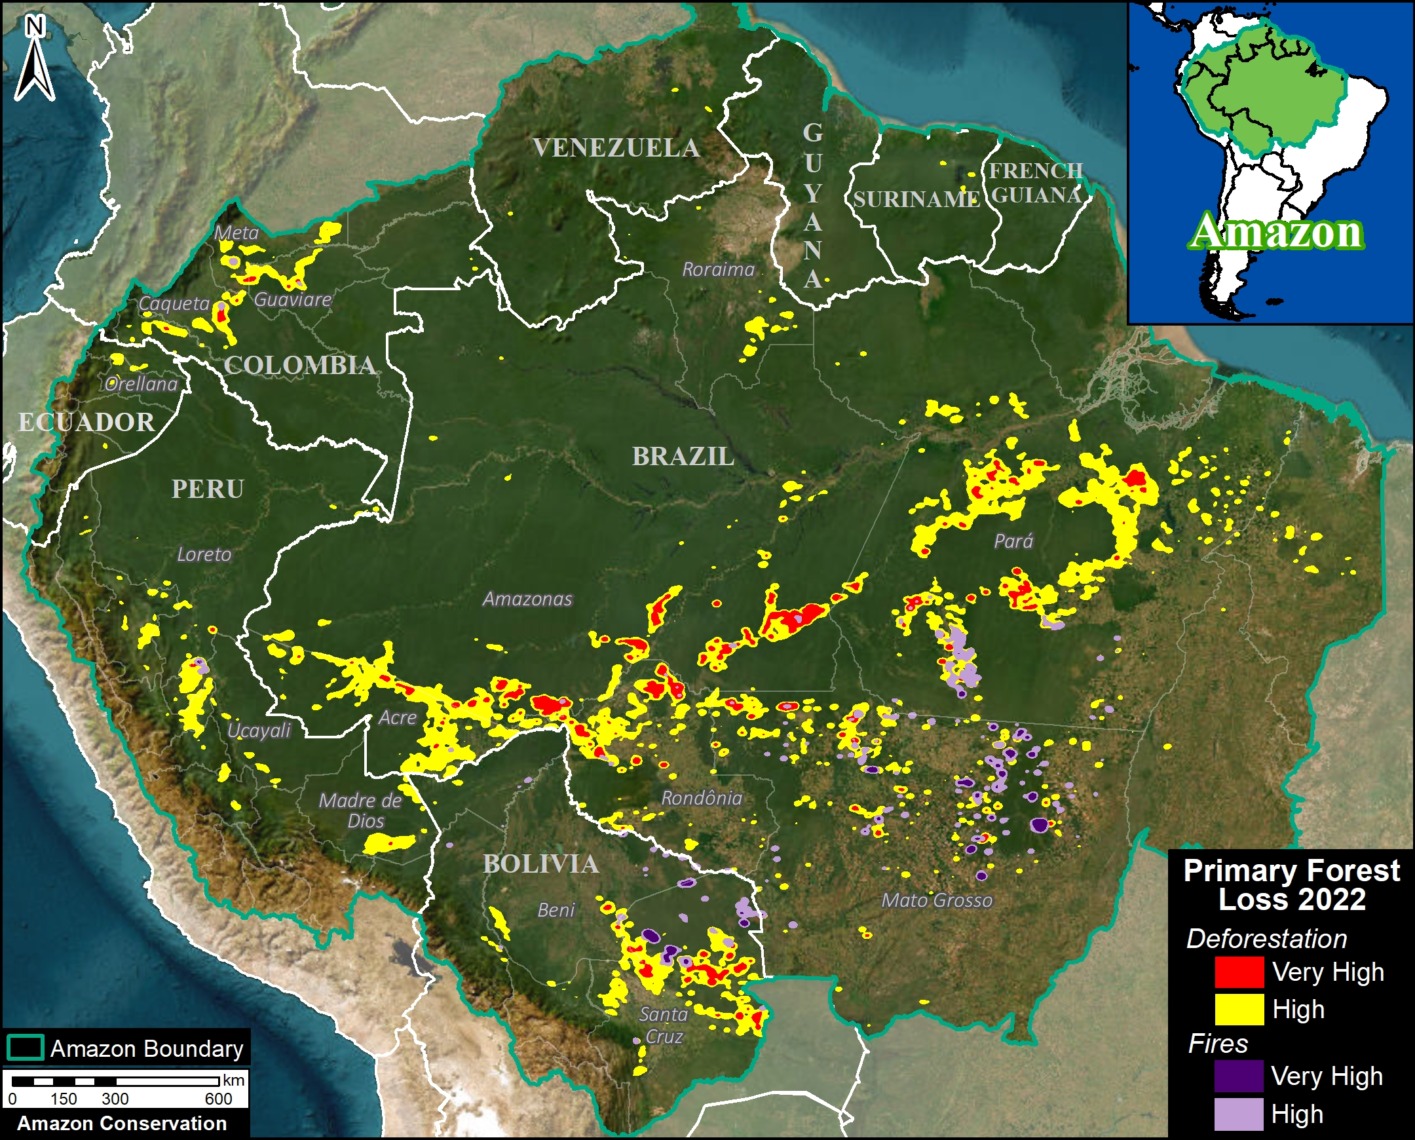
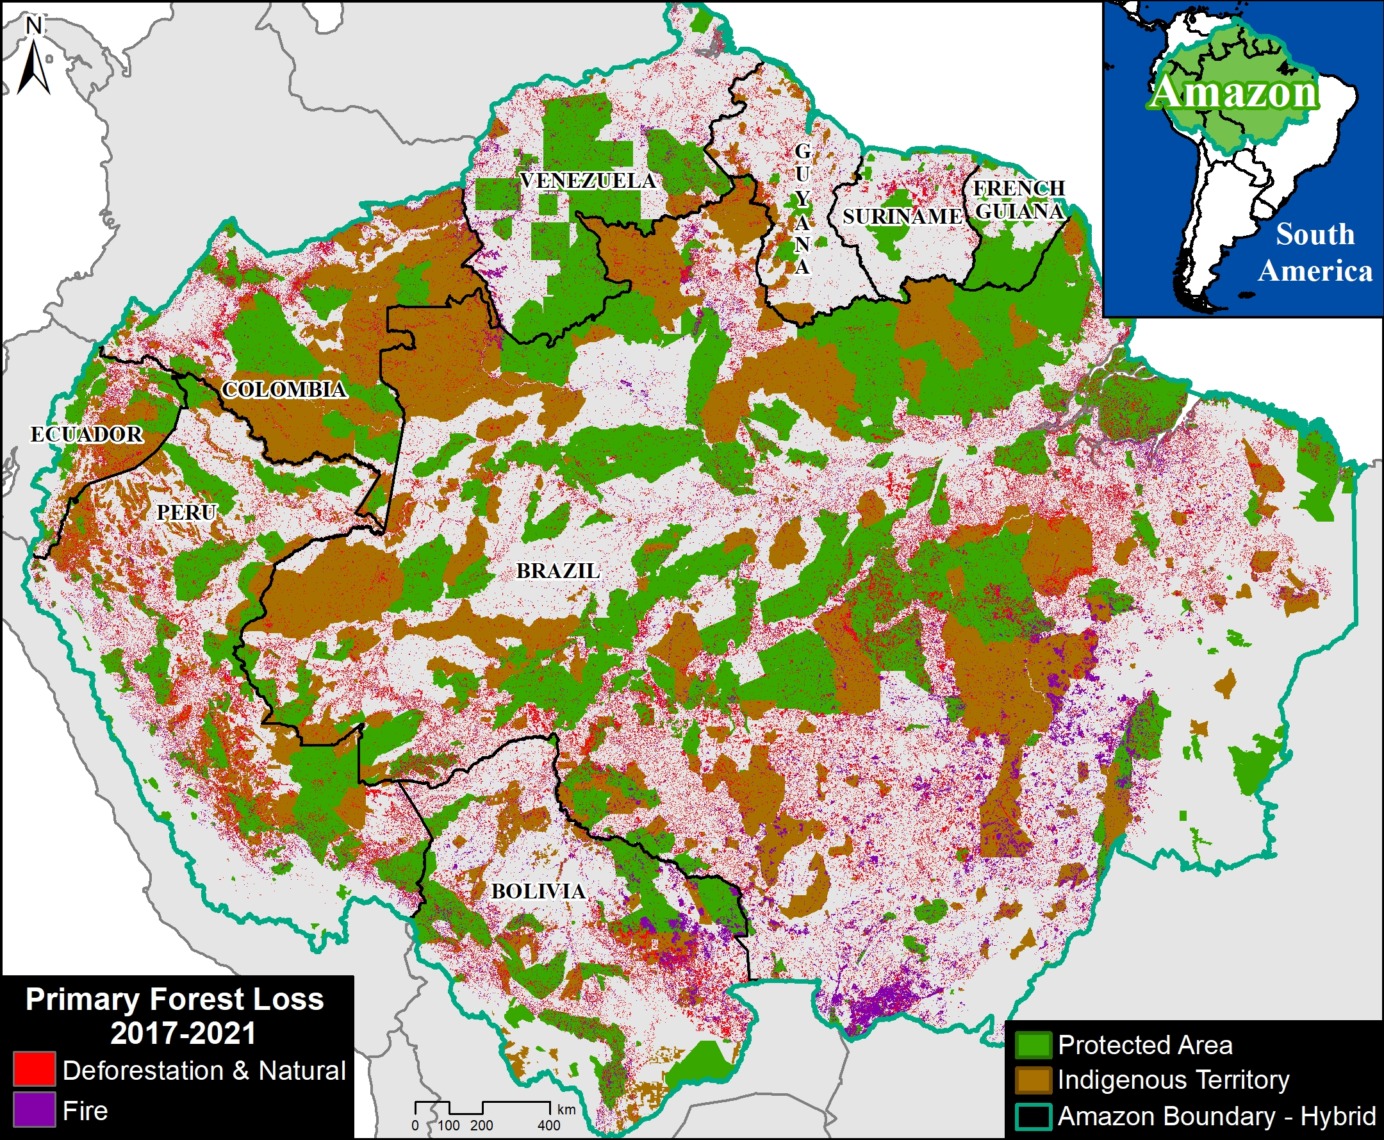
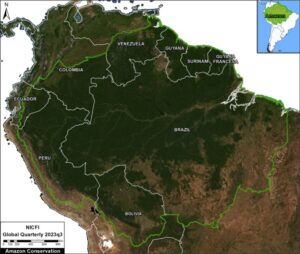
Figure 1 shows the most recent cloud-free view of the entire Amazon biome. On the positive, one can clearly see the core Amazon still stands. On the negative, however, the expanding deforestation around the edges is evident.
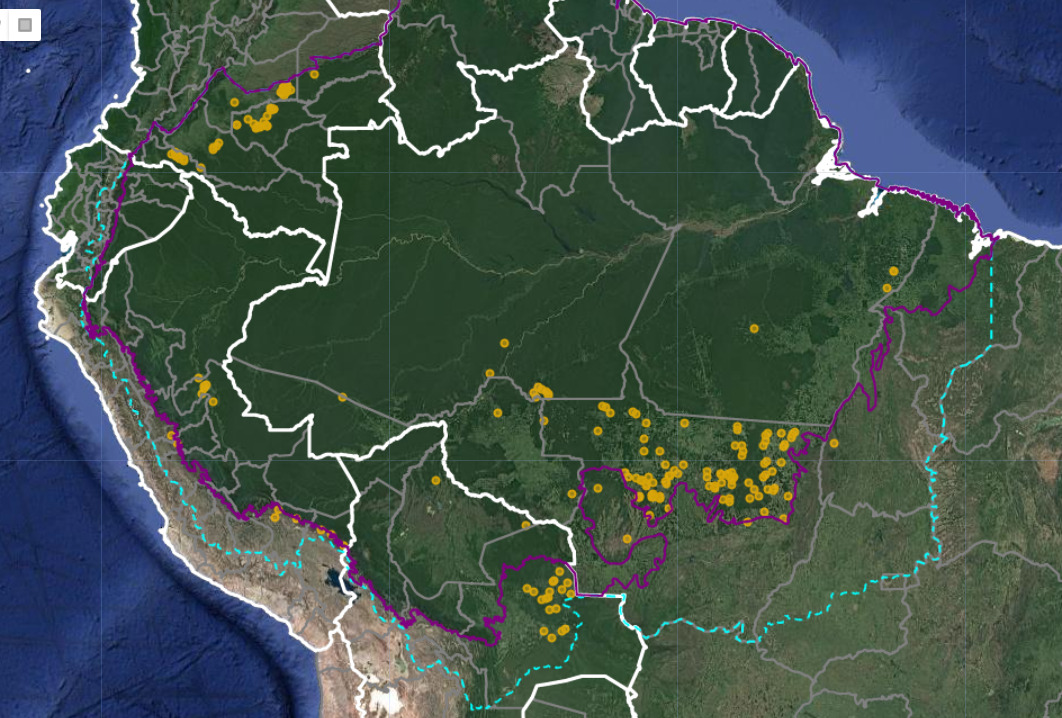
Major Deforestation Fronts – 2023
In this section, we review the current major deforestation fronts across the Amazon.
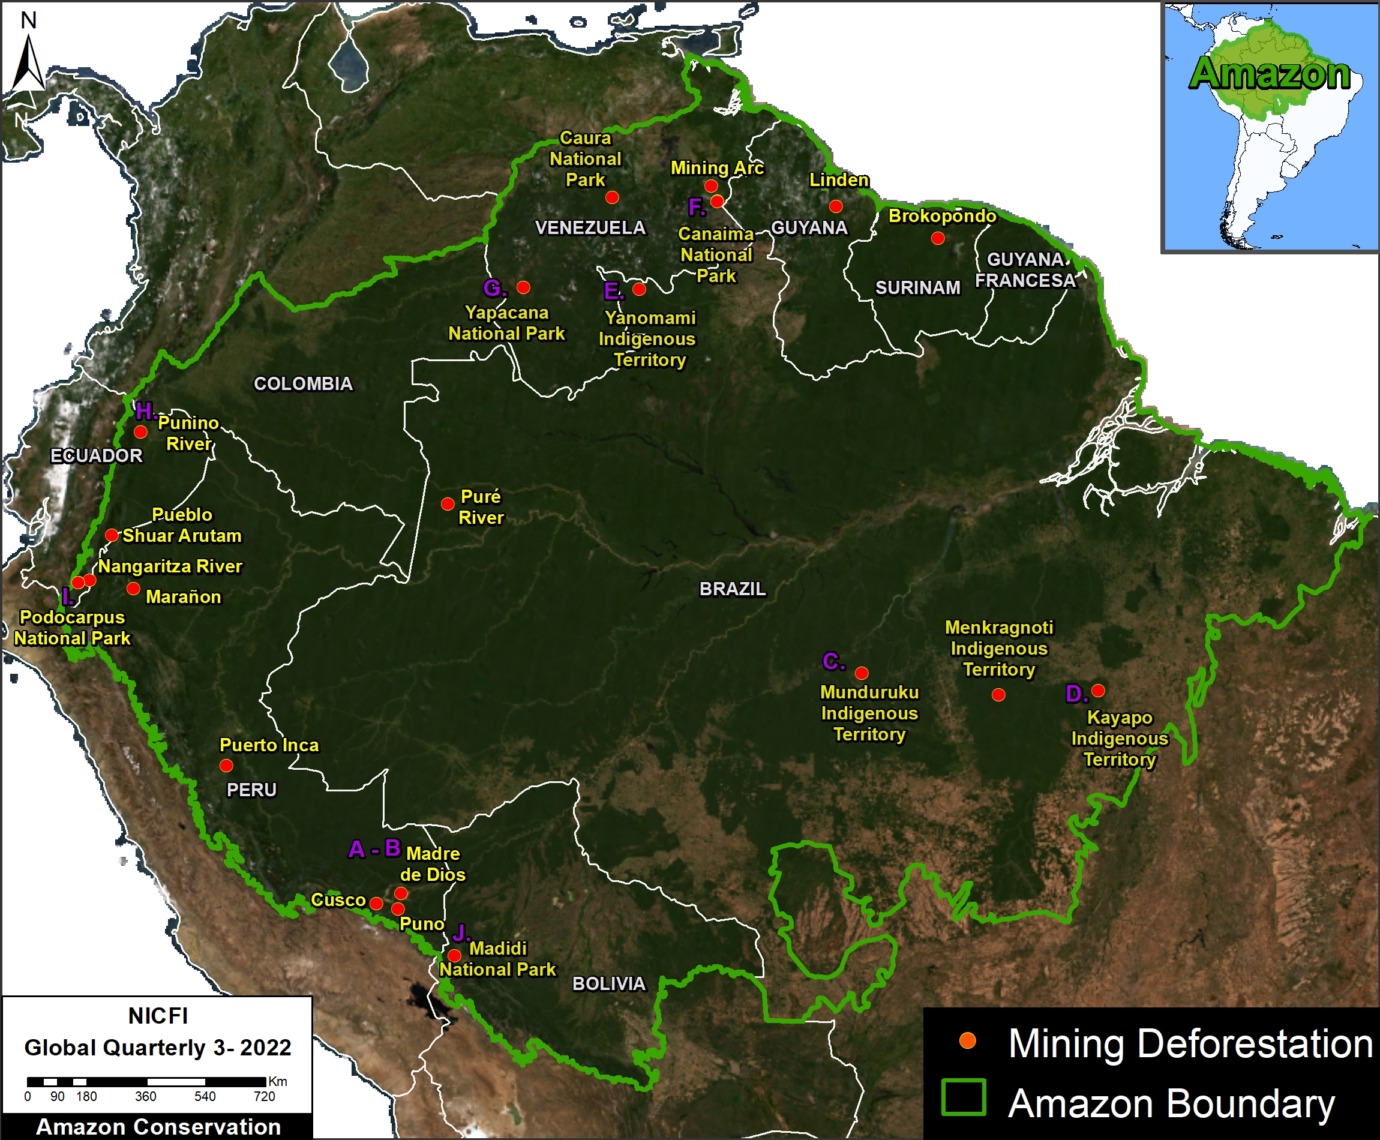
Figure 2 indicates these fronts (insets A-H) in relation to deforestation hotspot data over the past 8 years during MAAP’s active monitoring timeframe (2015-2022). Below we describe each deforestation area, by country. Common drivers across numerous Amazon countries include roads (MAAP #157), agriculture (MAAP #161), cattle, and gold mining (MAAP #178).
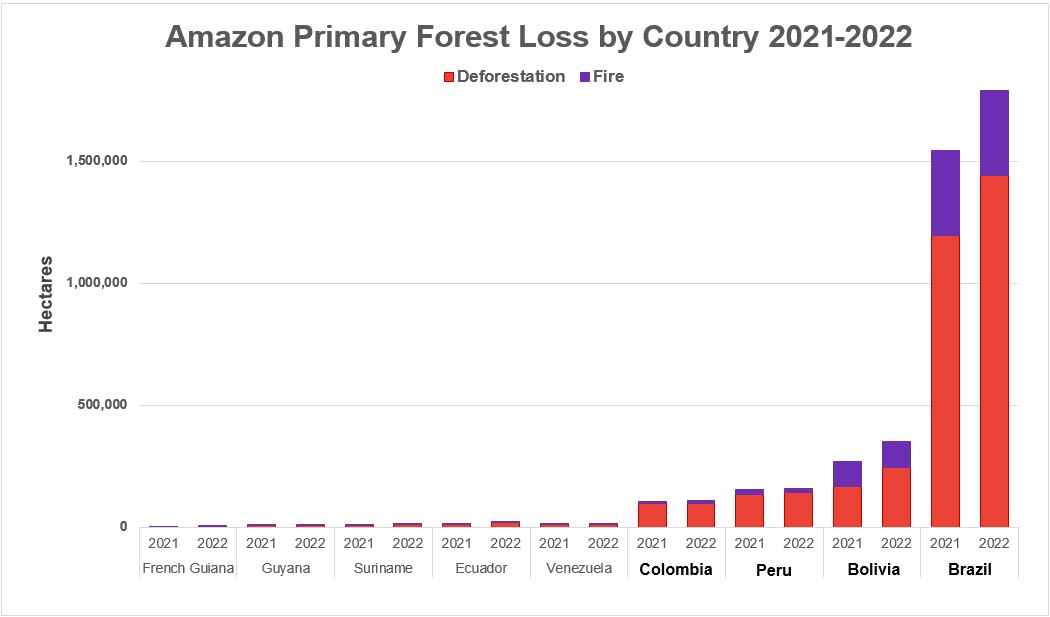
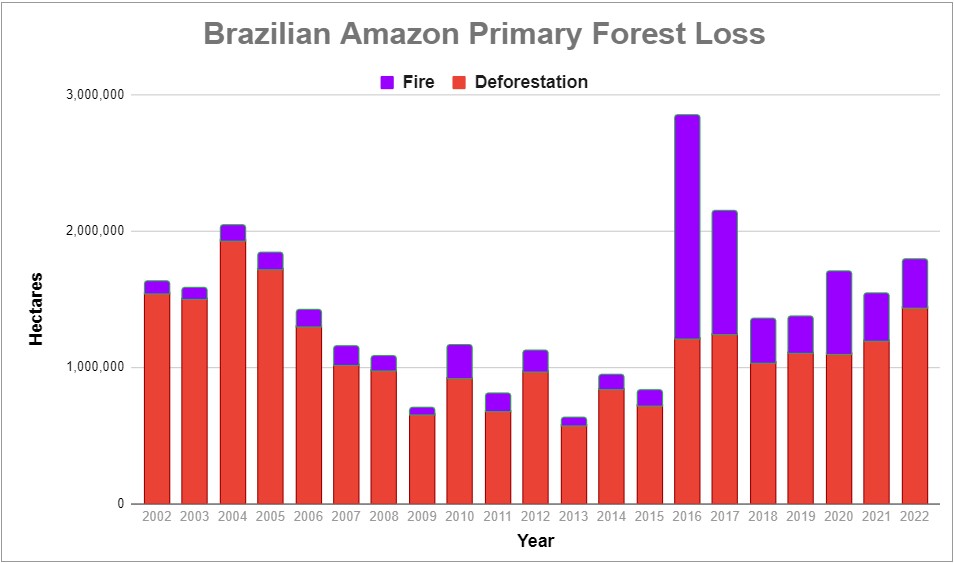
Also note that further below, in the Annex, we show the relative order of total Amazon primary forest loss by country over the past two years: Brazil by far the highest, followed by a middle pack of Bolivia, Peru, and Colombia, followed by lower levels in Venezuela, Ecuador, Suriname, Guyana, and French Guiana.

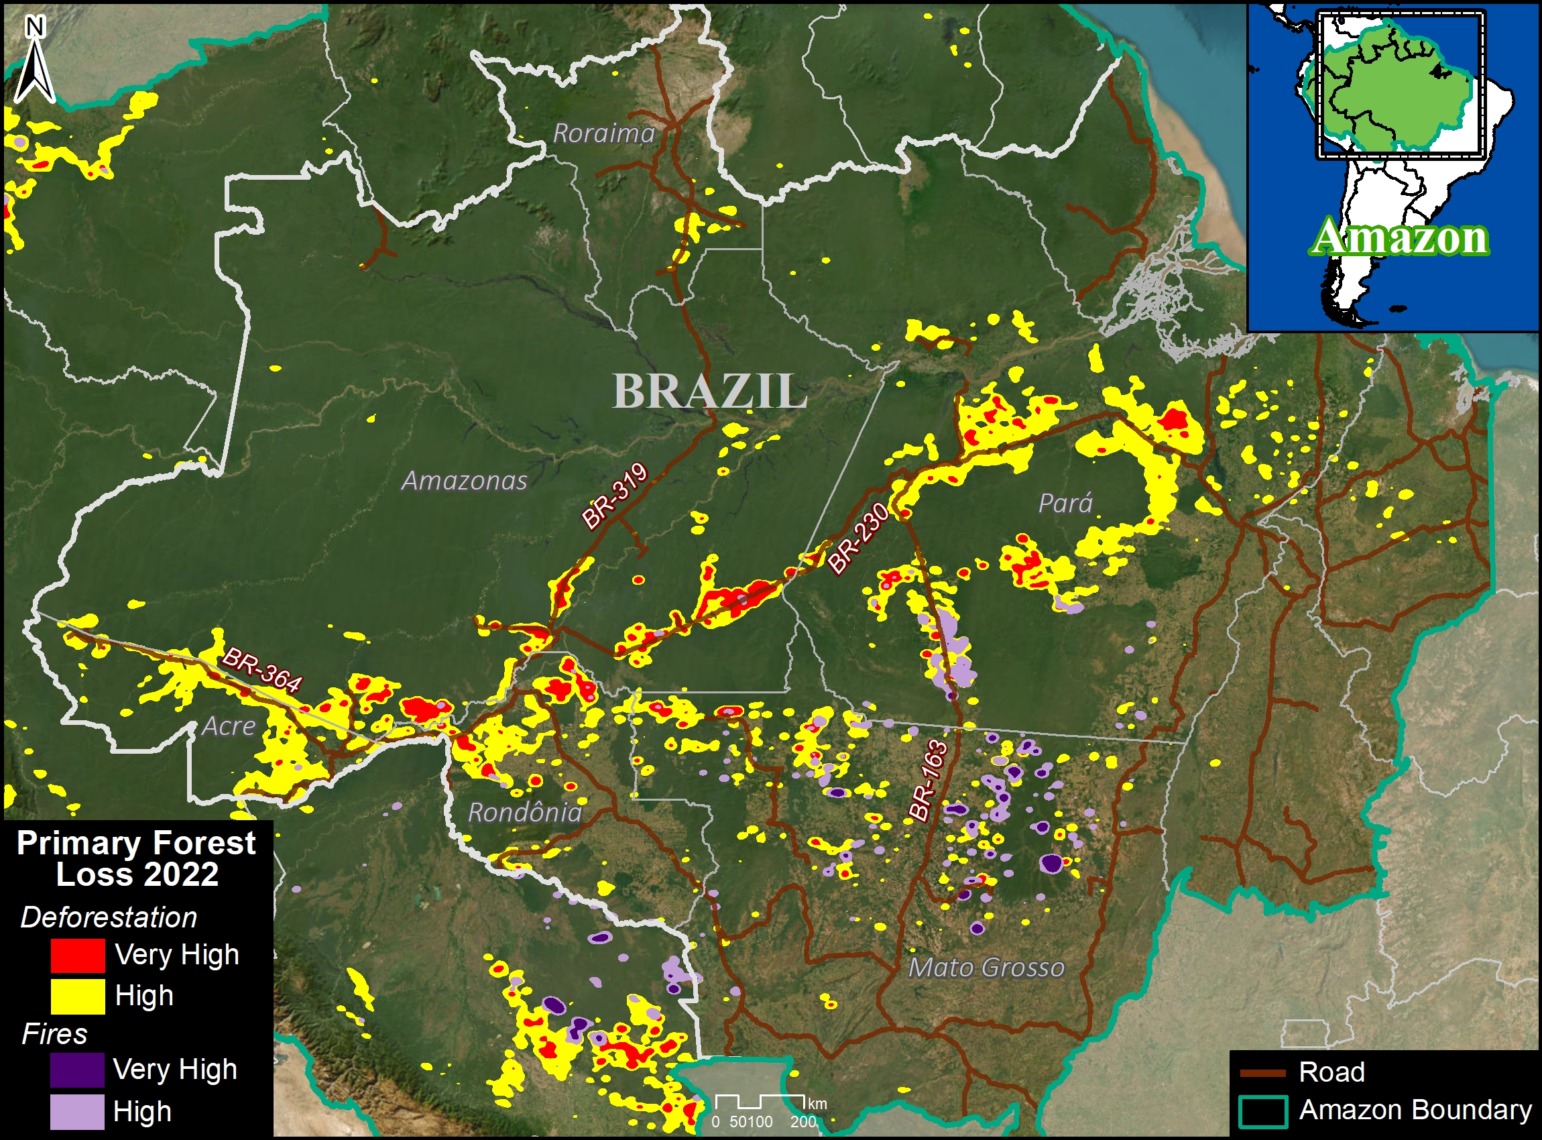
Brazilian Amazon

Brazil continues to be, by far, the leading source of Amazonian deforestation (MAAP #187), led by three major drivers: cattle pasture expansion near roads, soy plantations, and gold mining.
Deforestation for new cattle pasture is concentrated along the extensive road networks spanning the eastern and southern Brazilian Amazon (for example, Inset A).
Deforestation for expanding soy plantations is concentrated in the southeast Brazilian Amazon (Inset B; see MAAP #161).
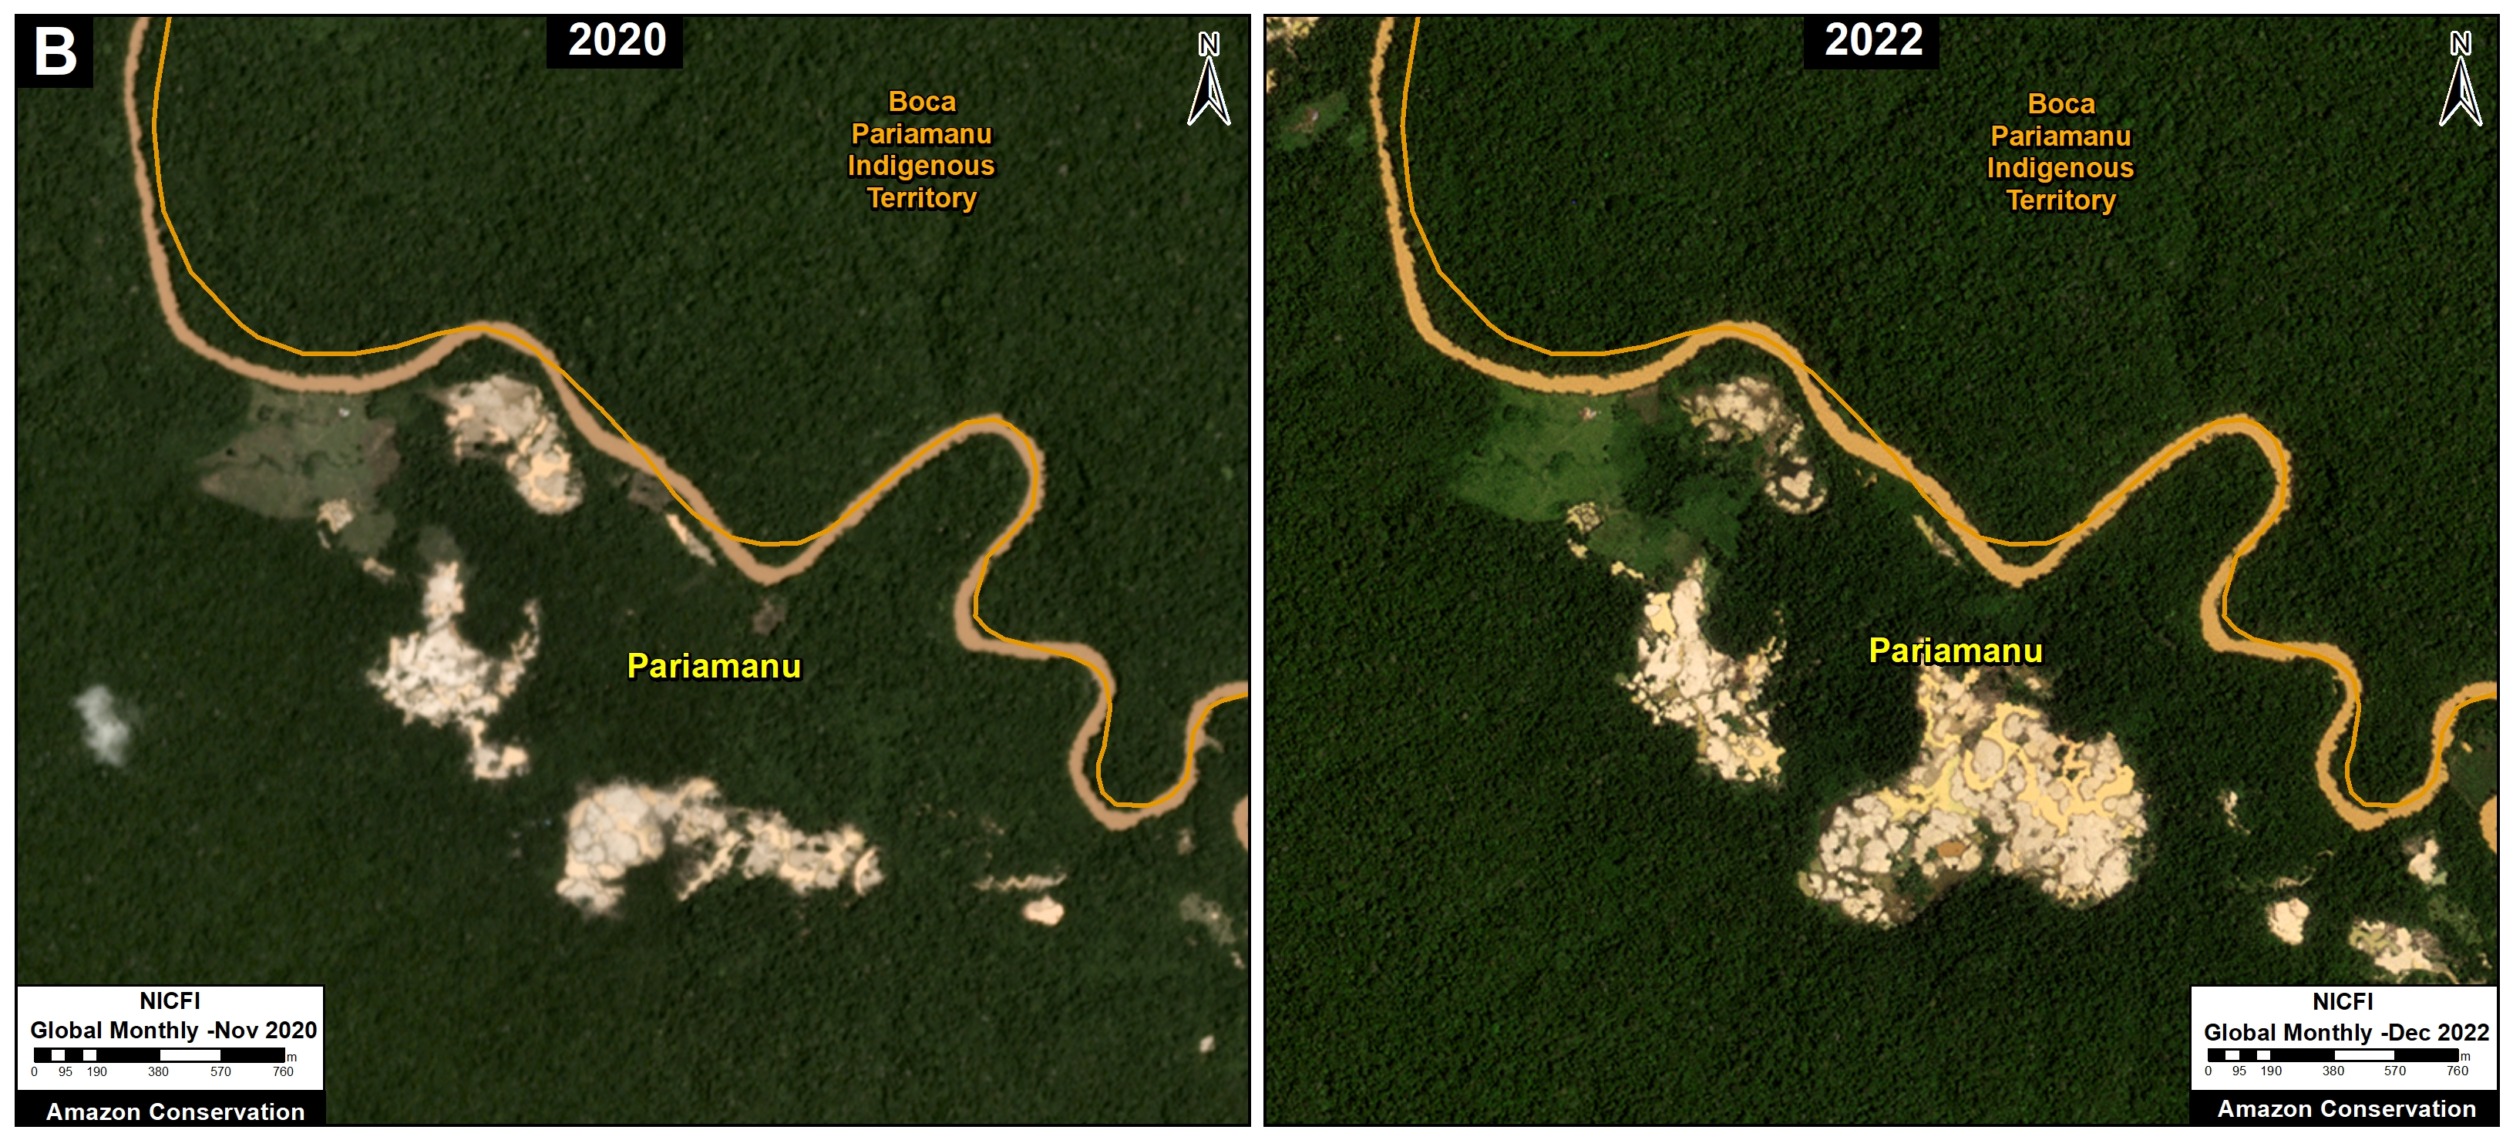
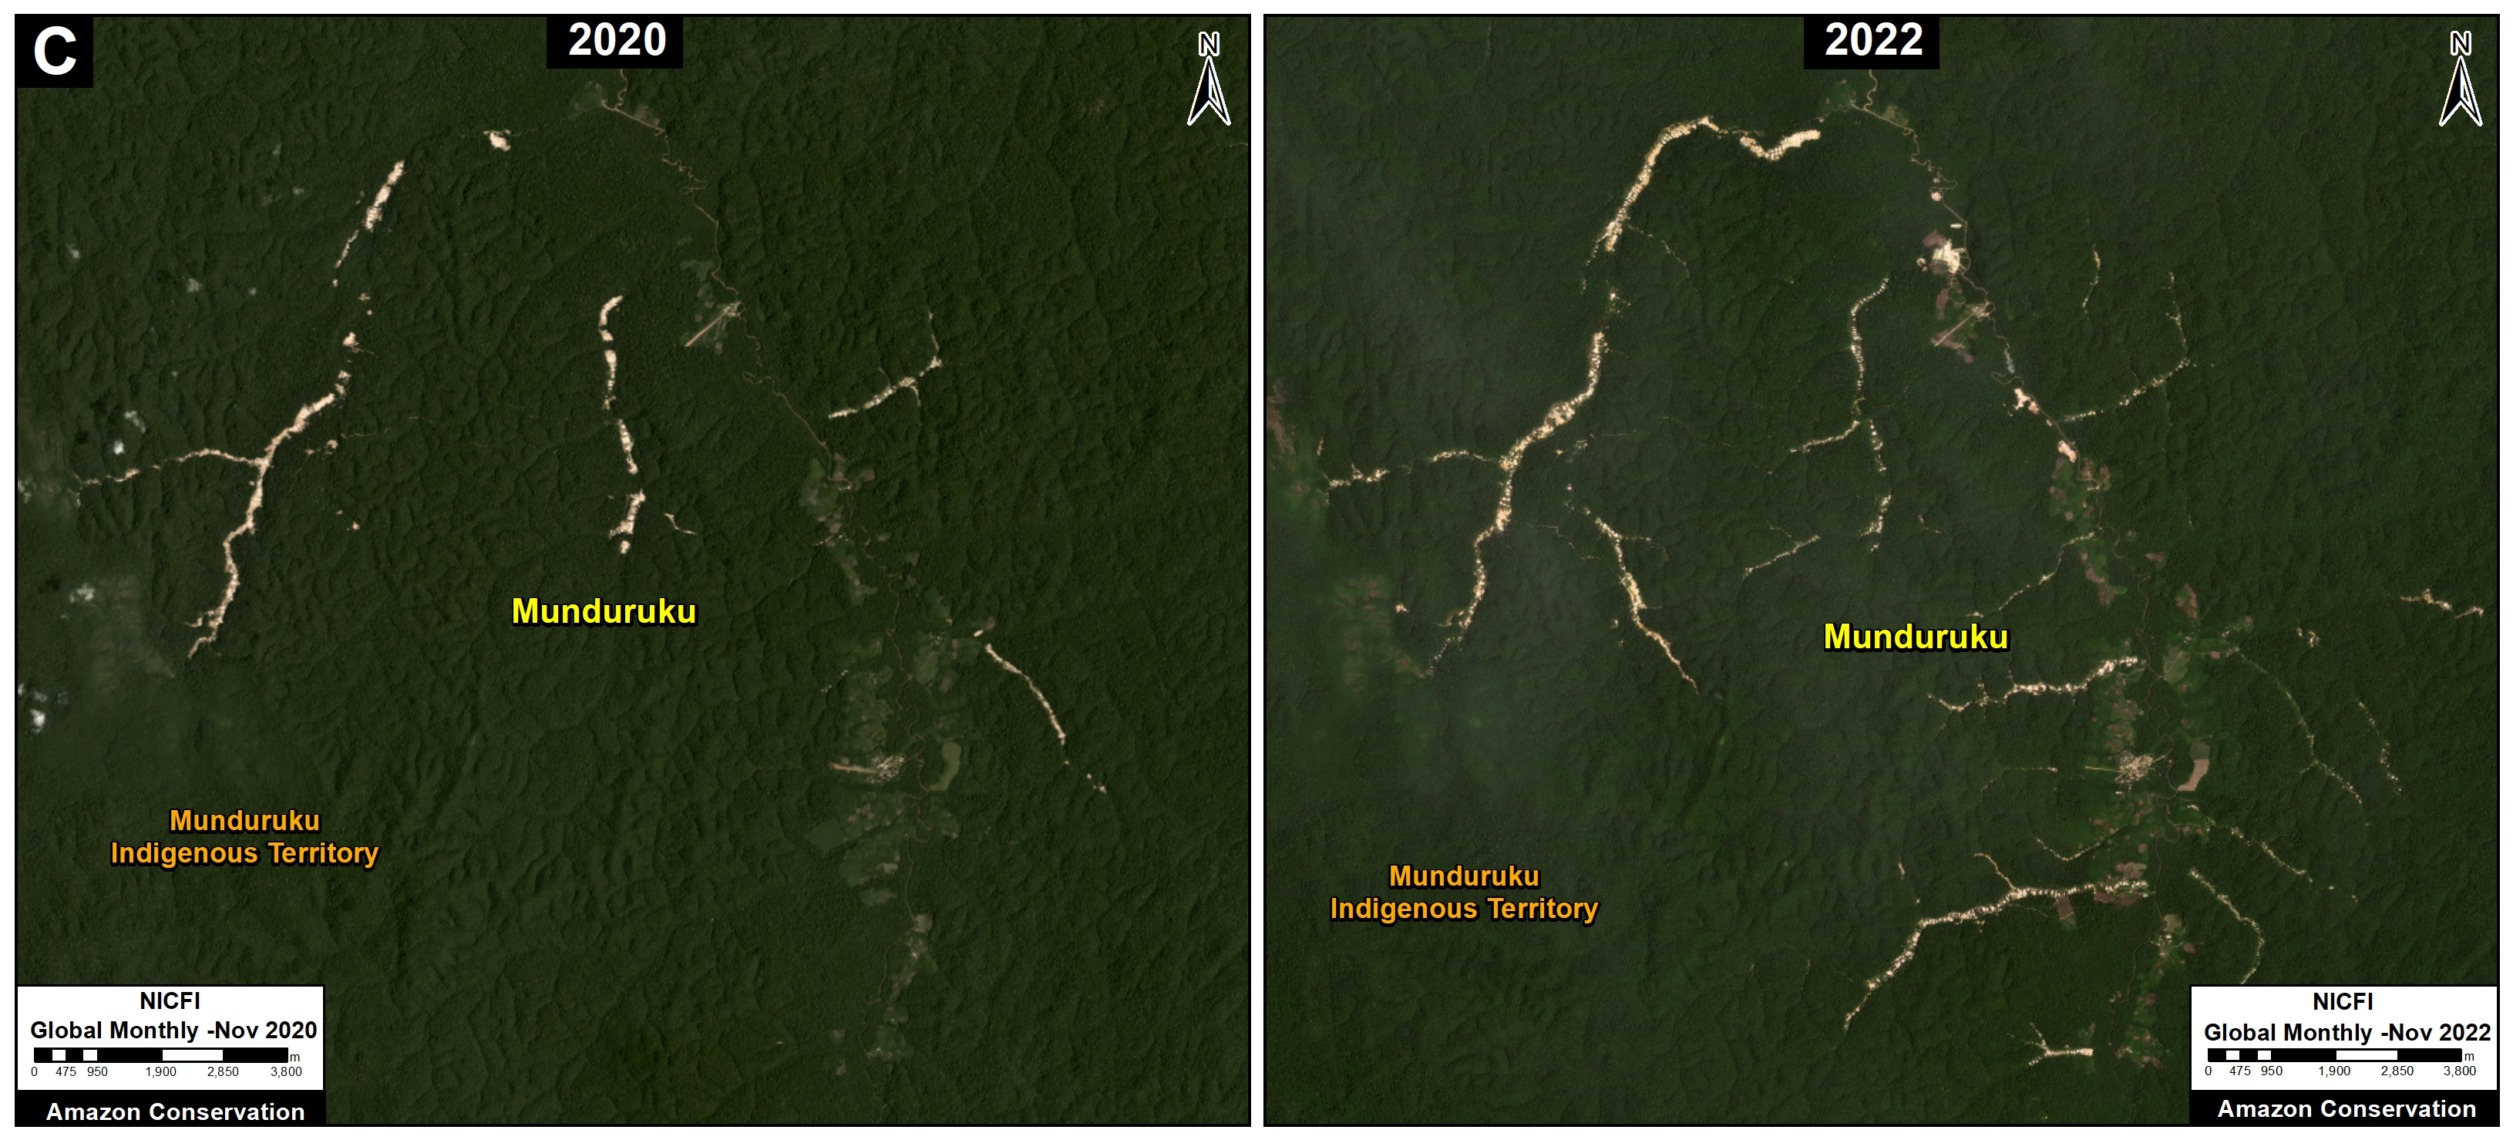
Gold mining deforestation impacts numerous sites, including several indigenous territories (for example, Inset C; see MAAP #178).
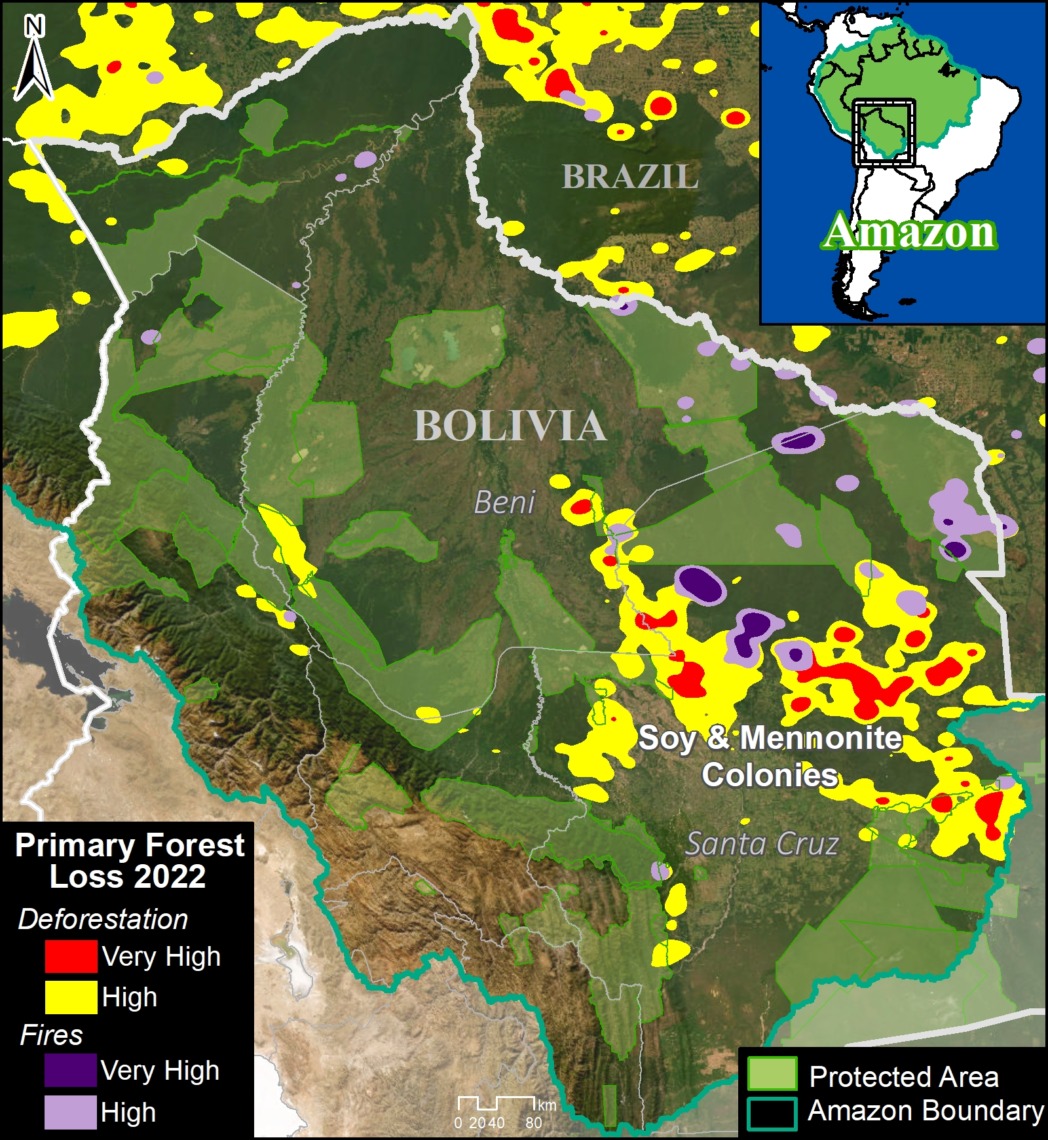
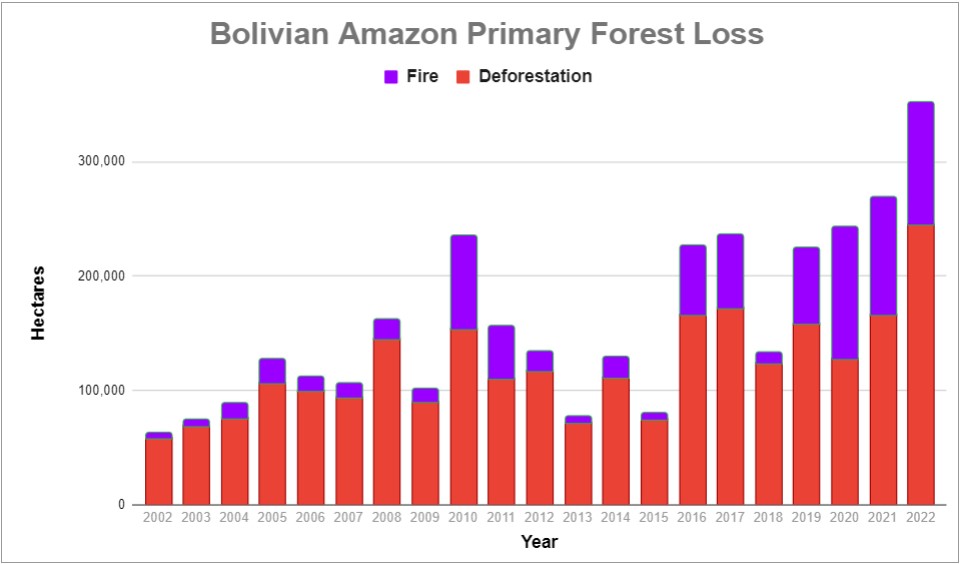
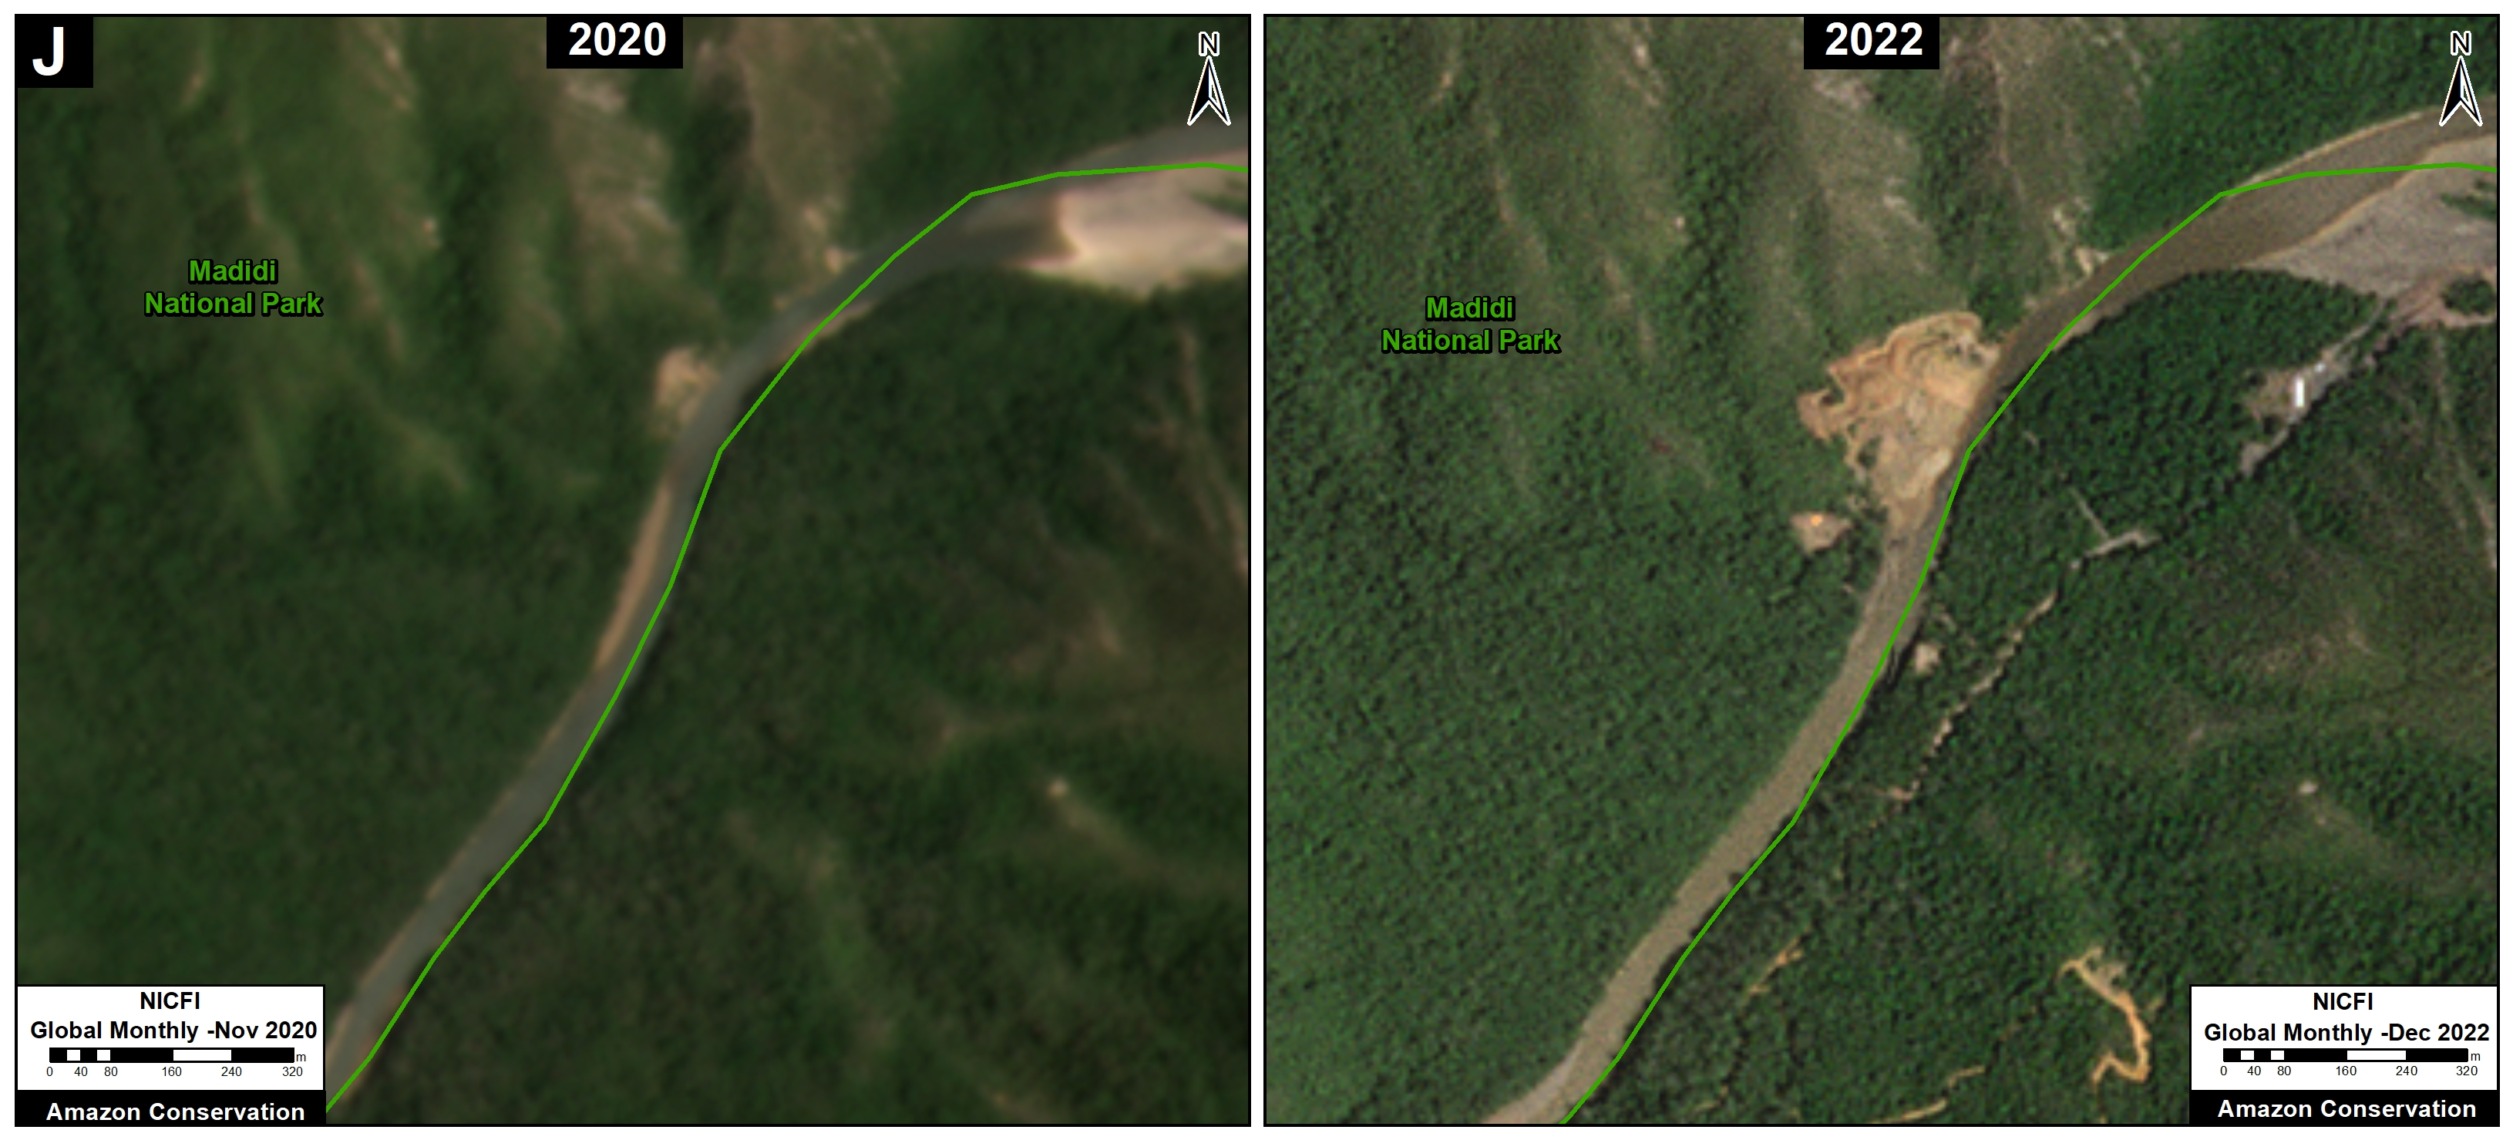
Bolivian Amazon

Bolivia has emerged as the clear second-leading source of Amazonian deforestation, with a major increasing trend over the past two years (MAAP #187).
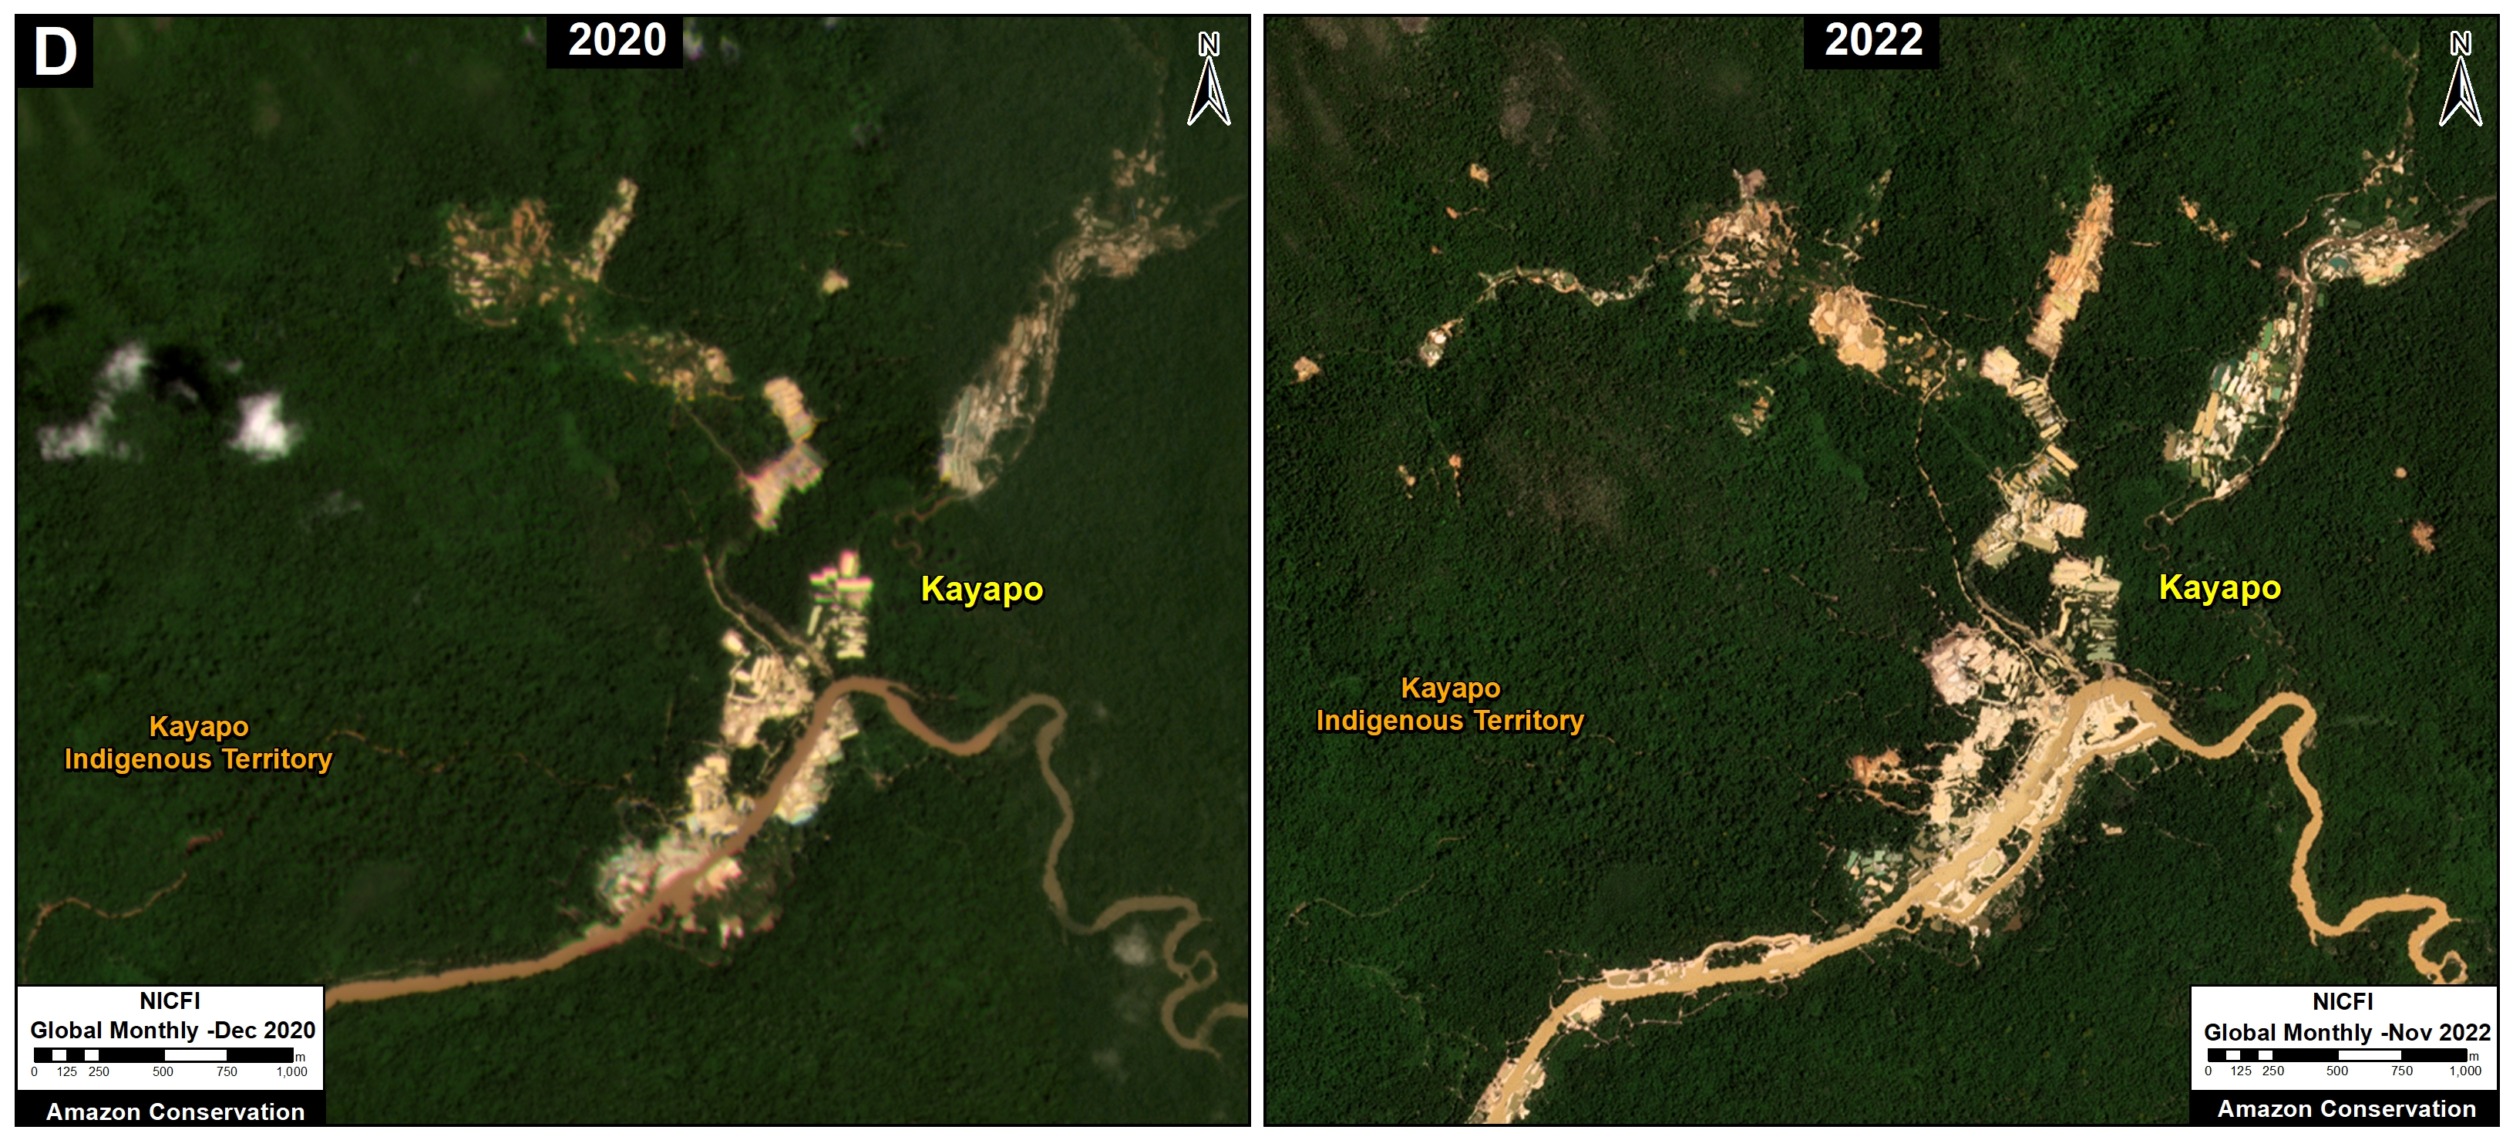
The deforestation is concentrated in the soy frontier located in the southeast (Inset D, see MAAP #179).
Note that, increasingly, this soy deforestation is carried out by Mennonite colonies (MAAP #180). We revealed that Mennonites caused the deforestation of over 210,000 hectares since 2001, including 33,000 hectares since 2017.
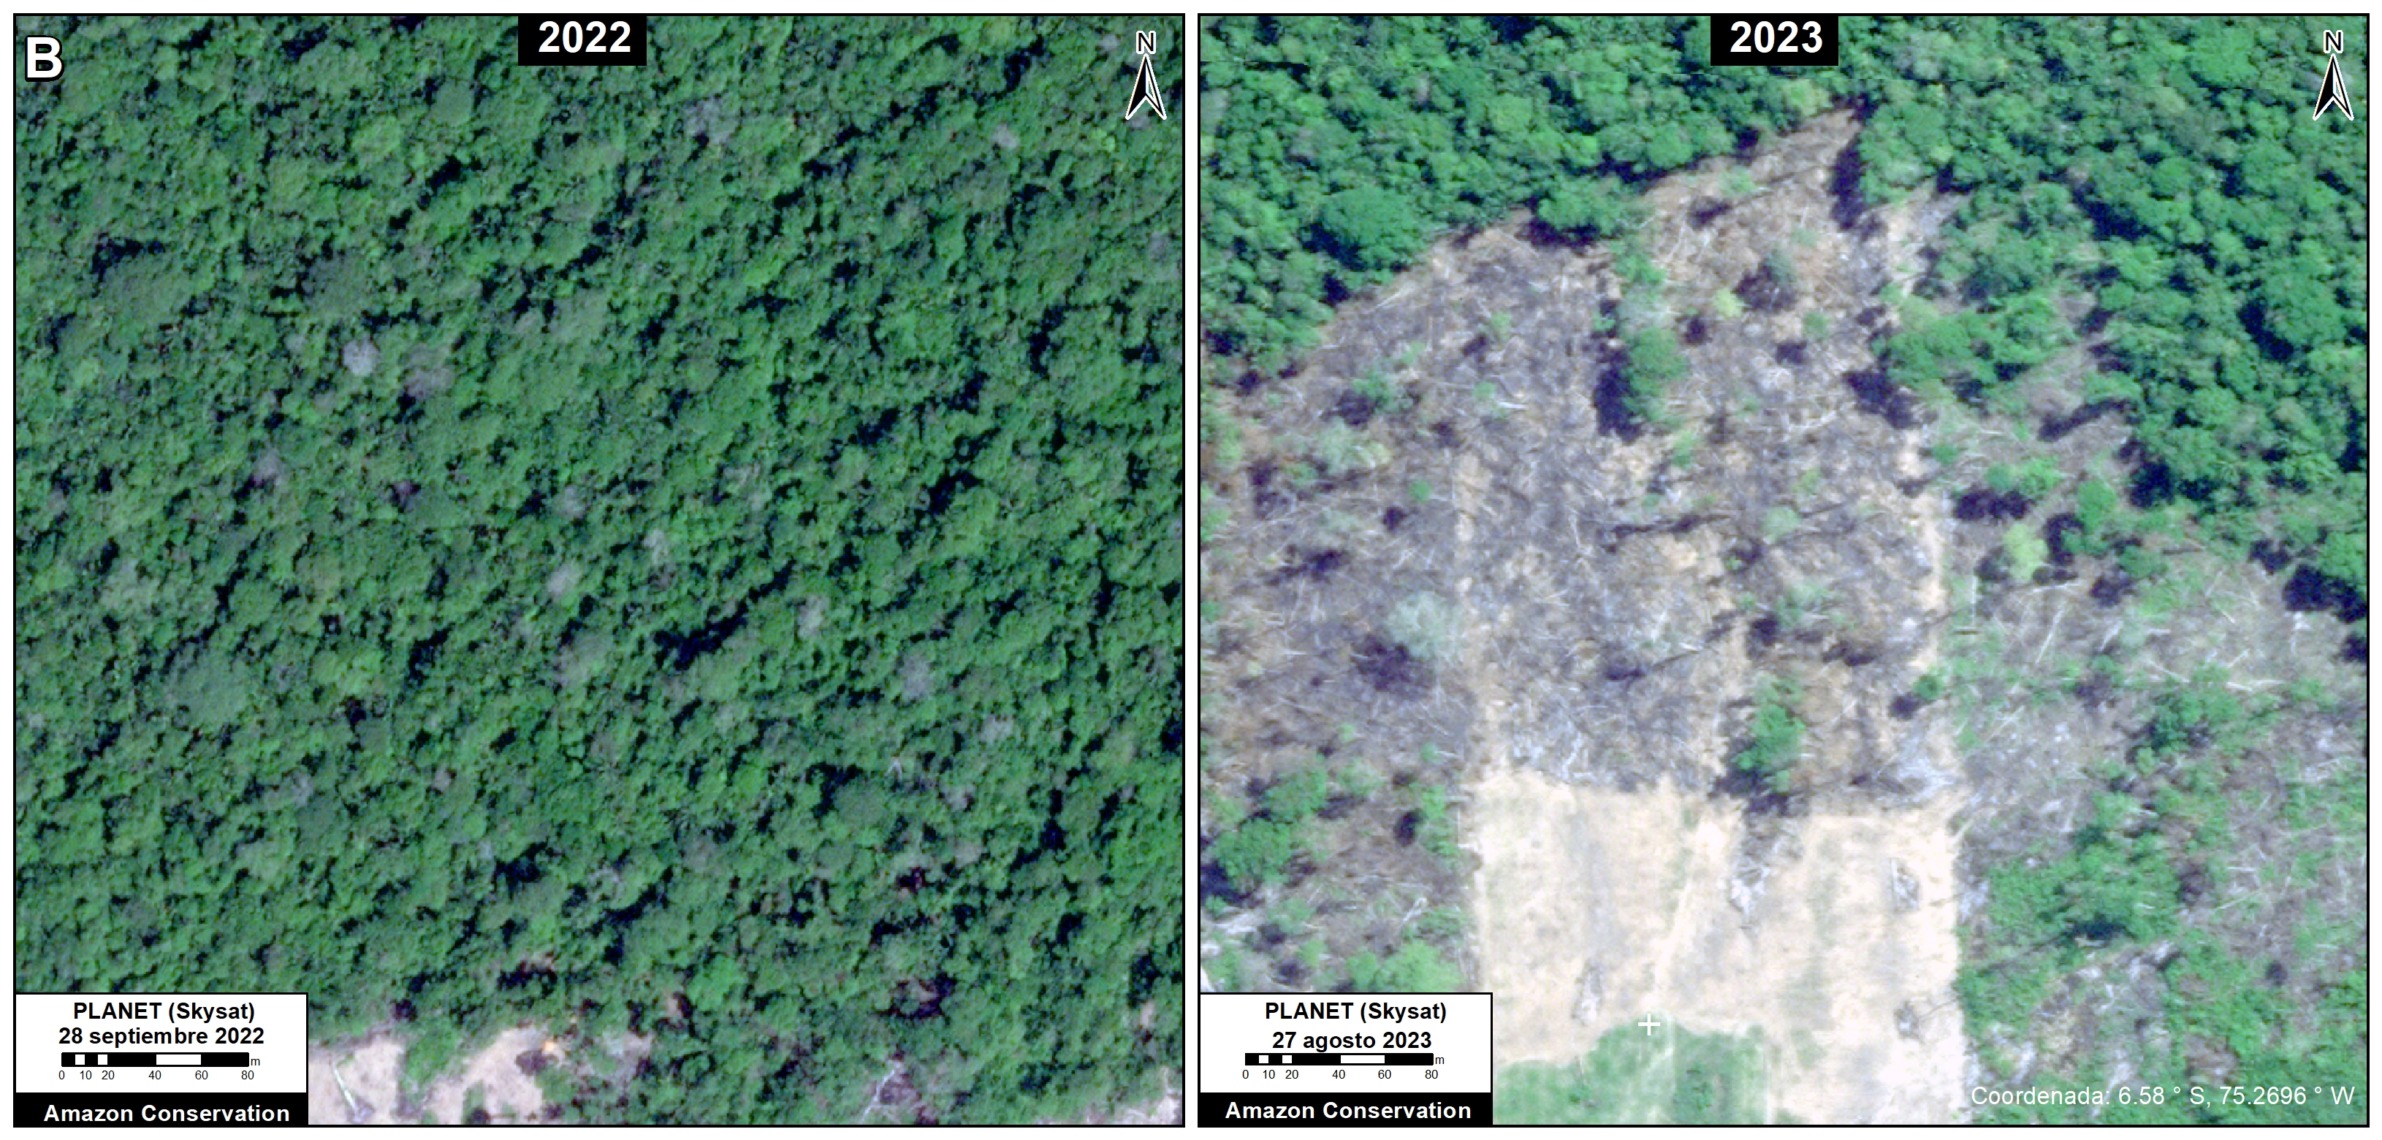
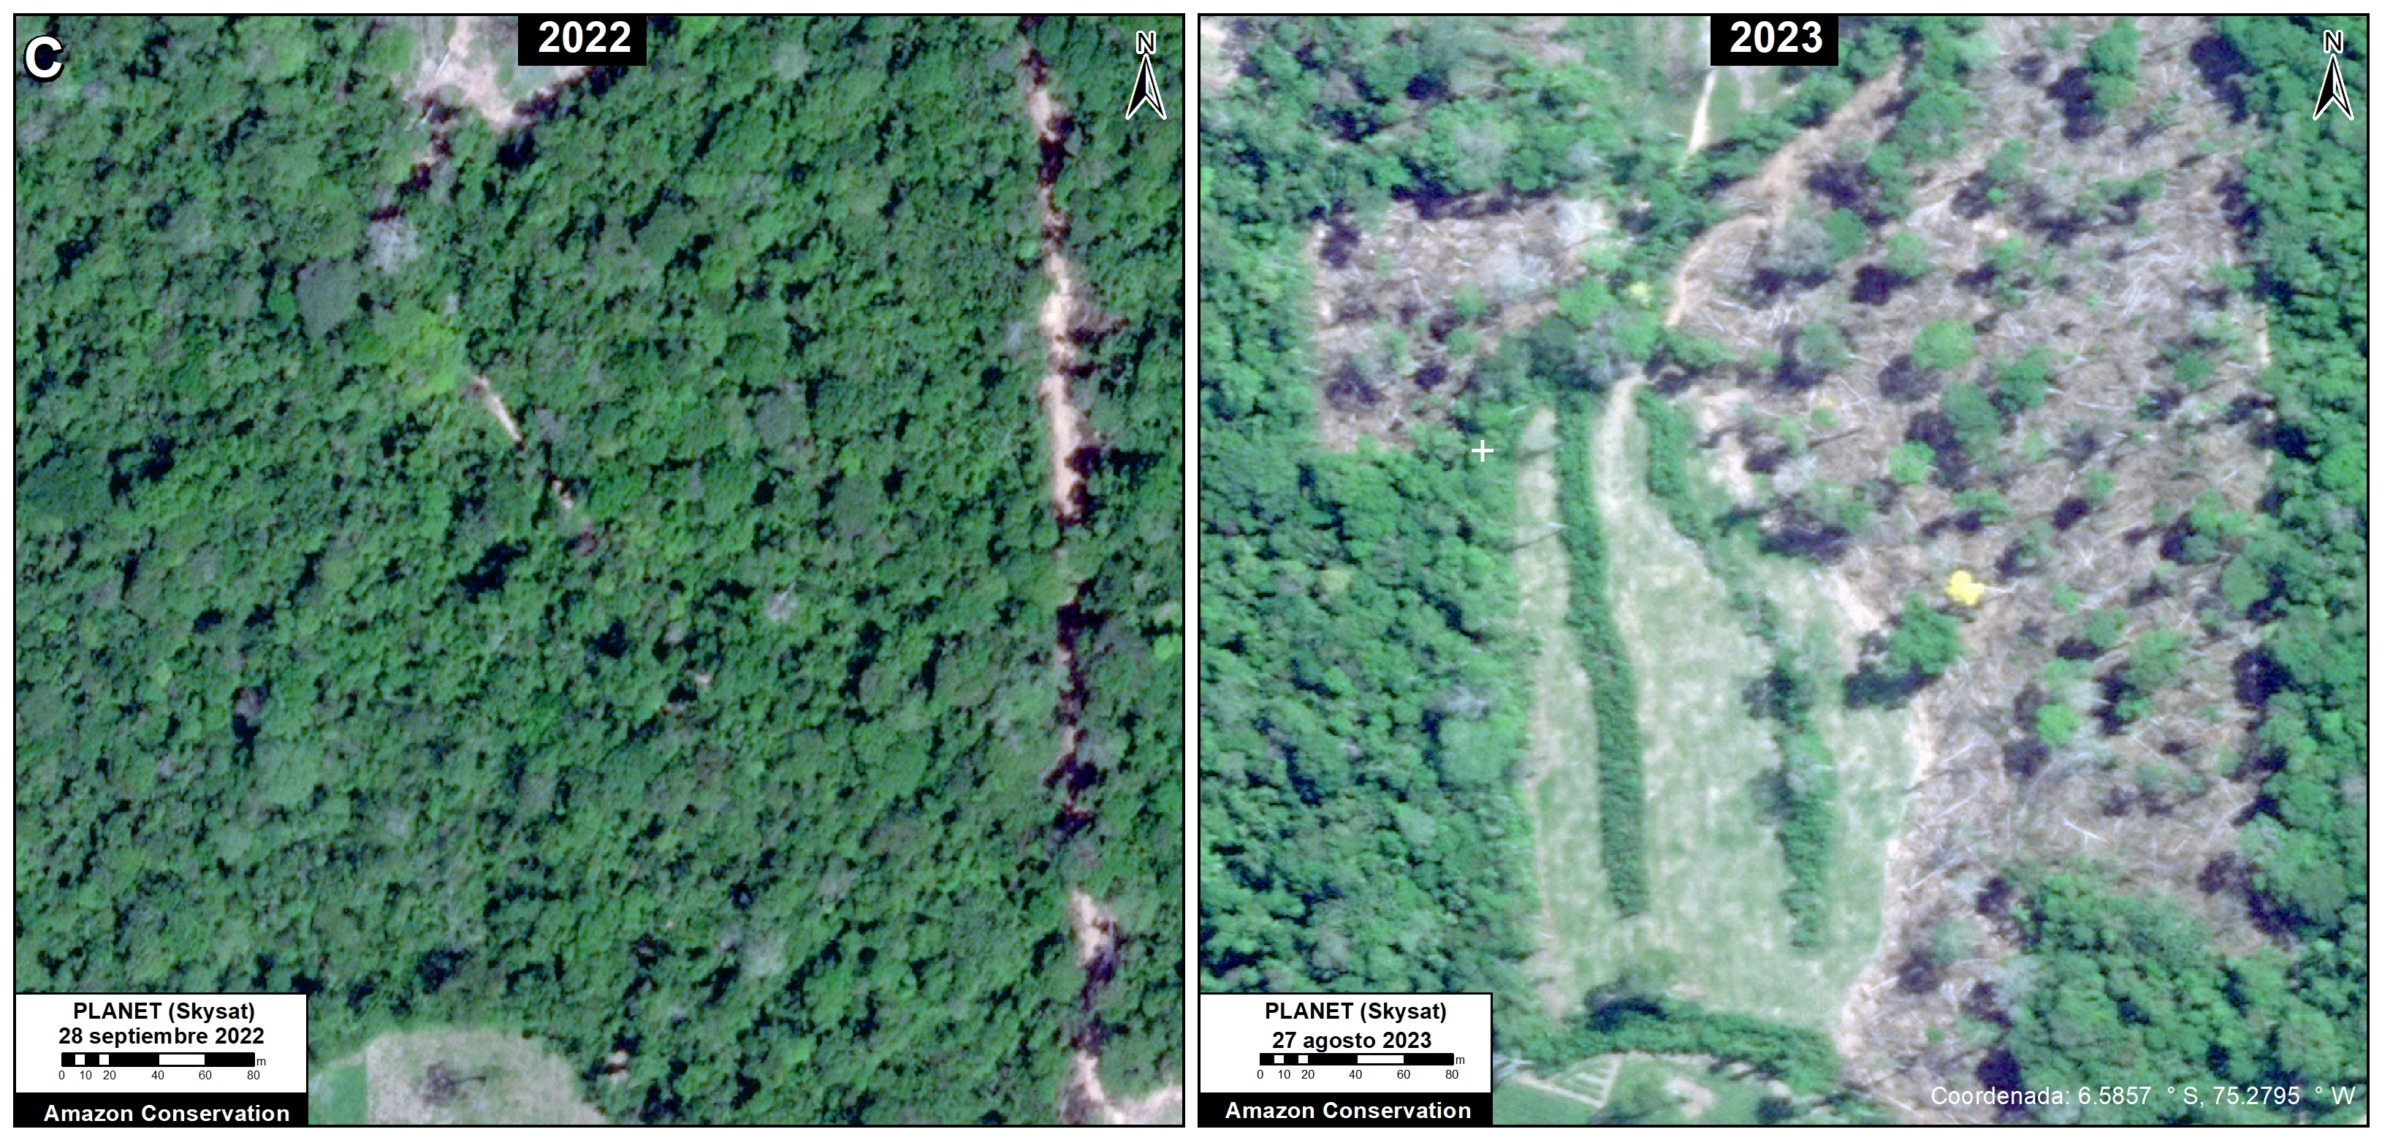
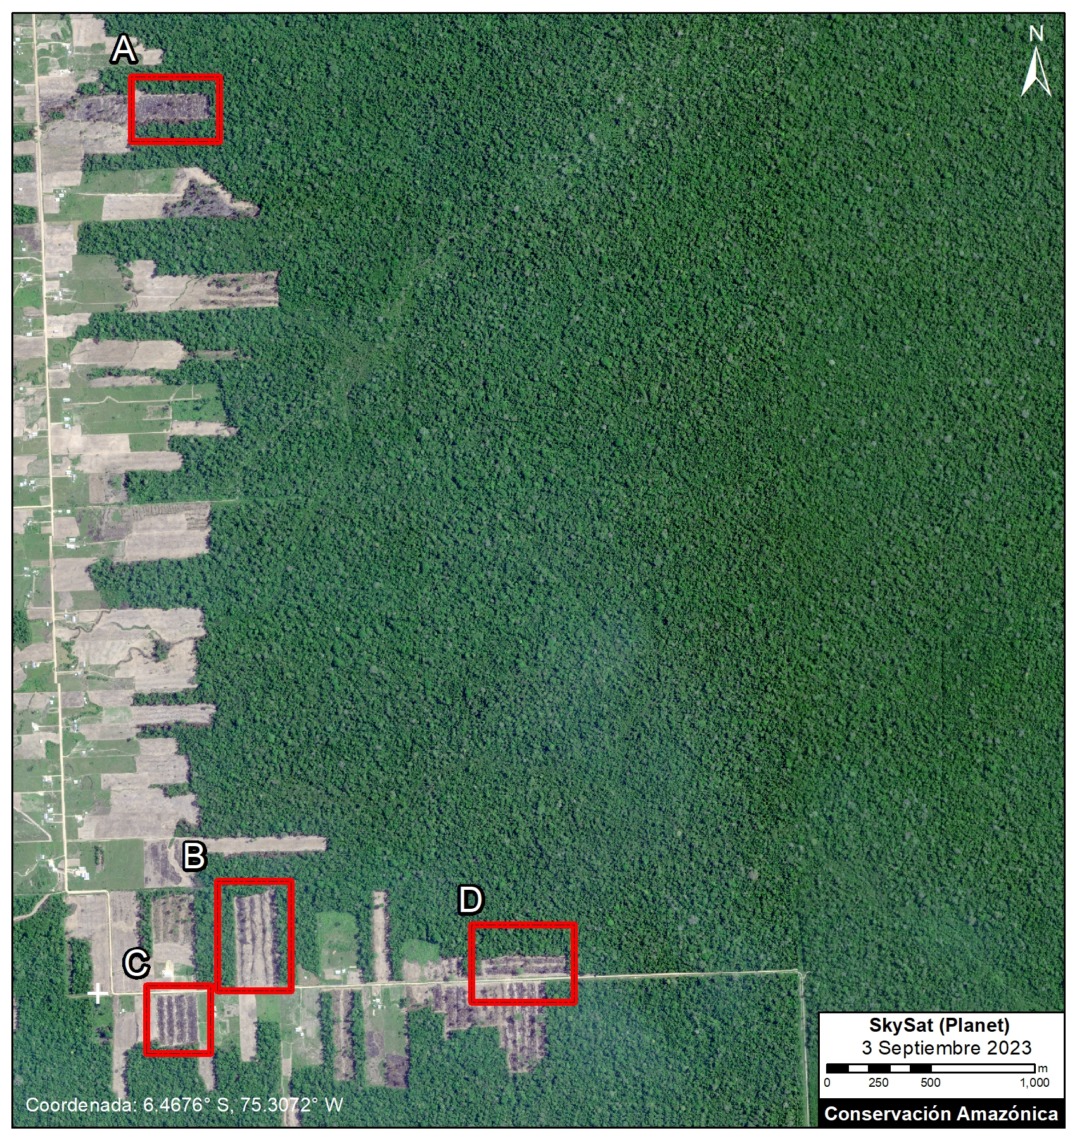
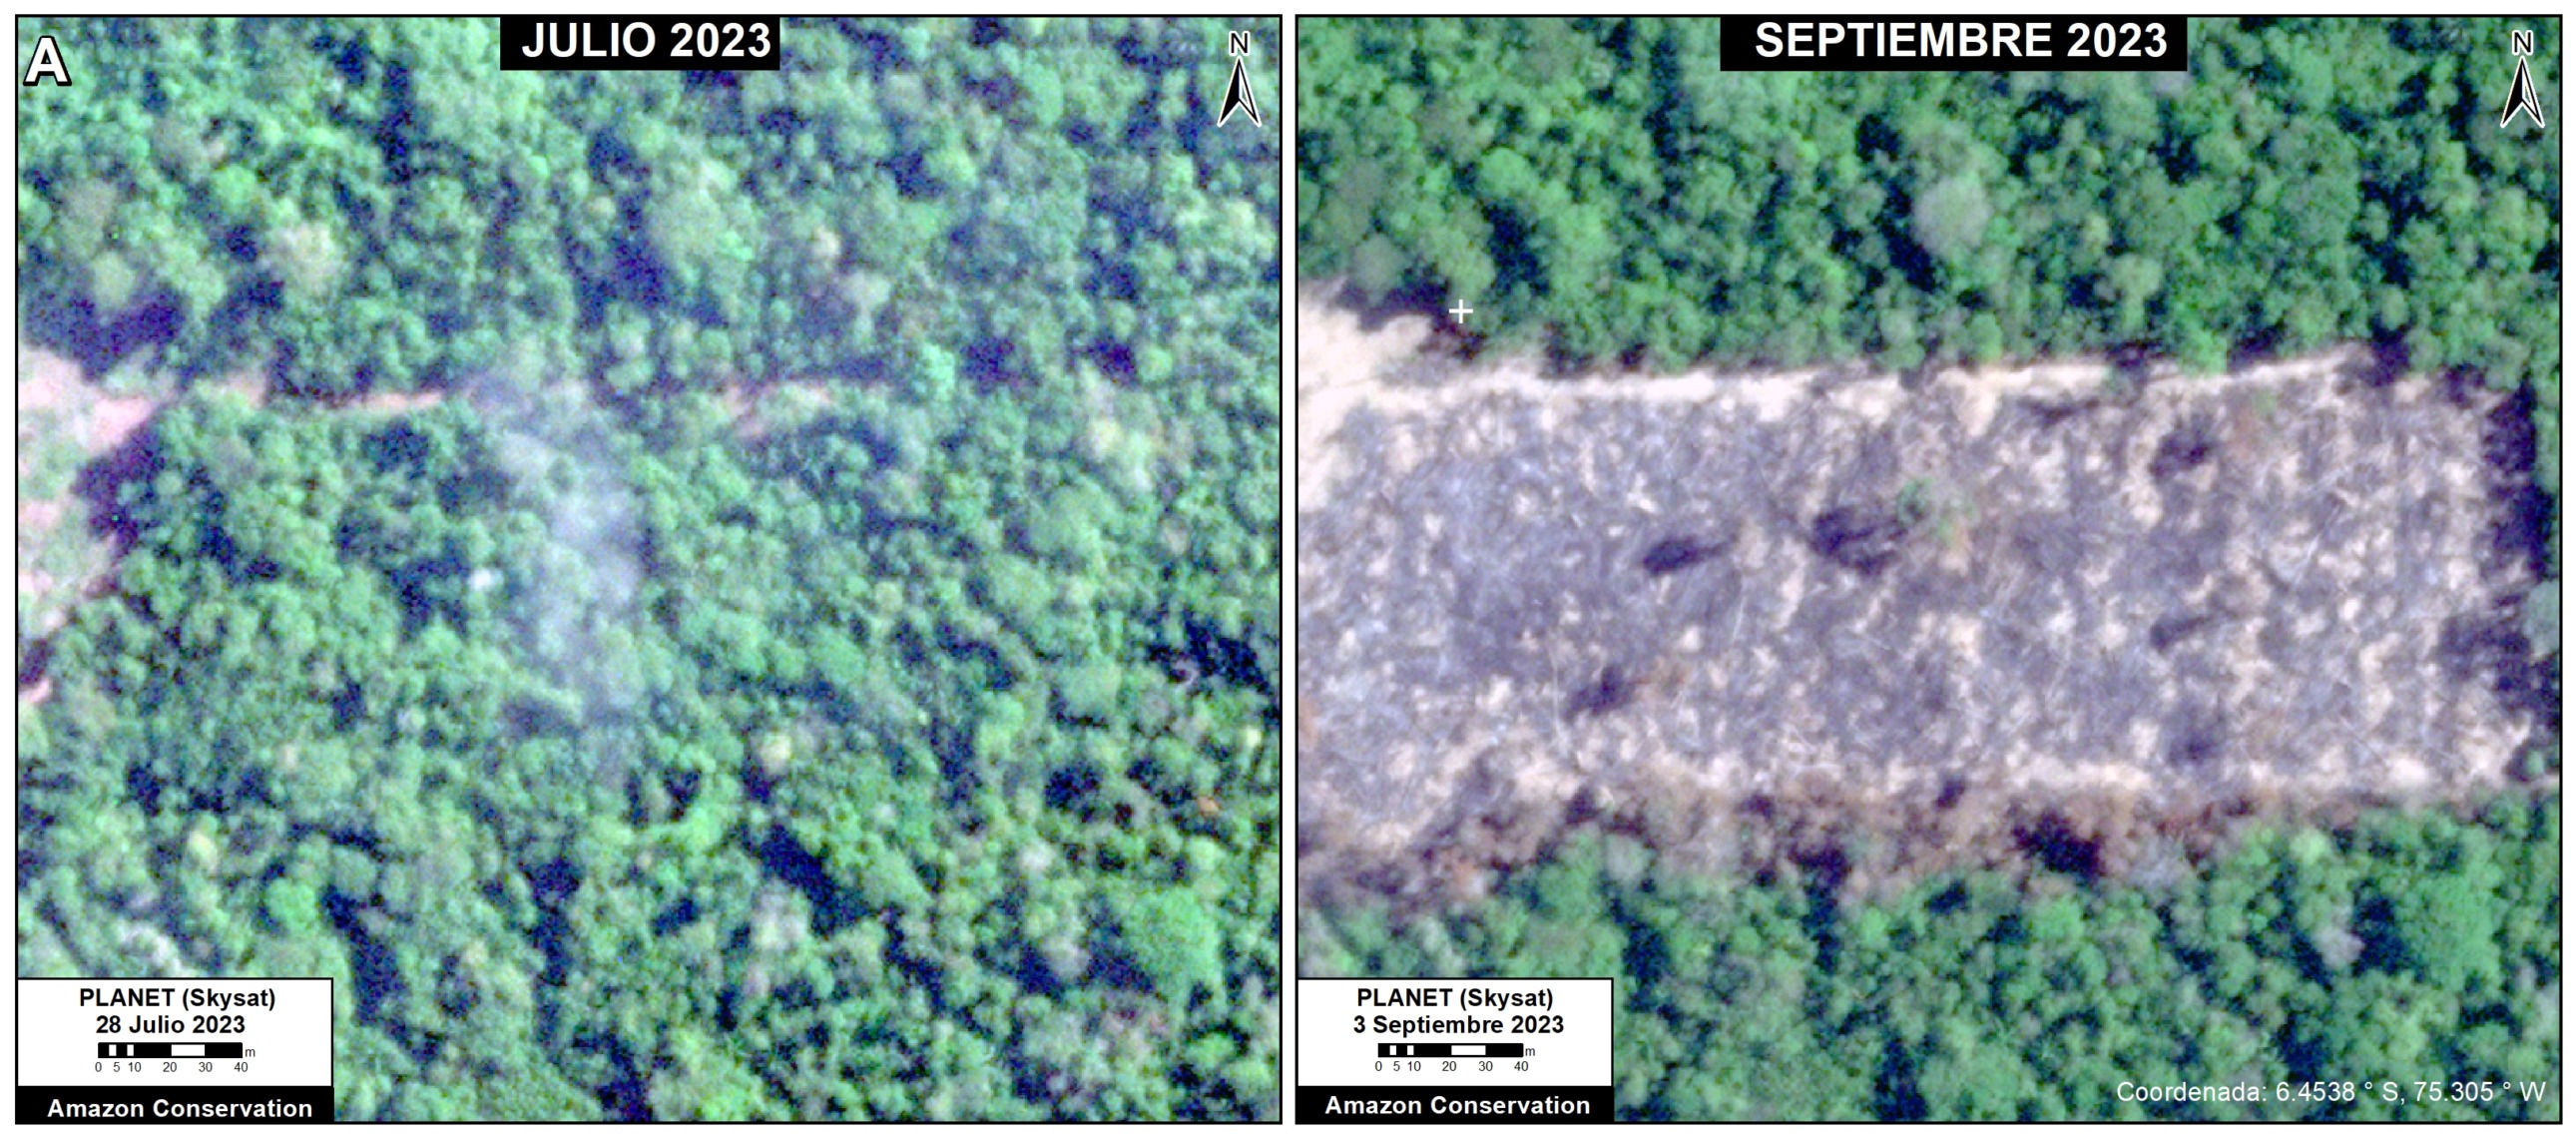
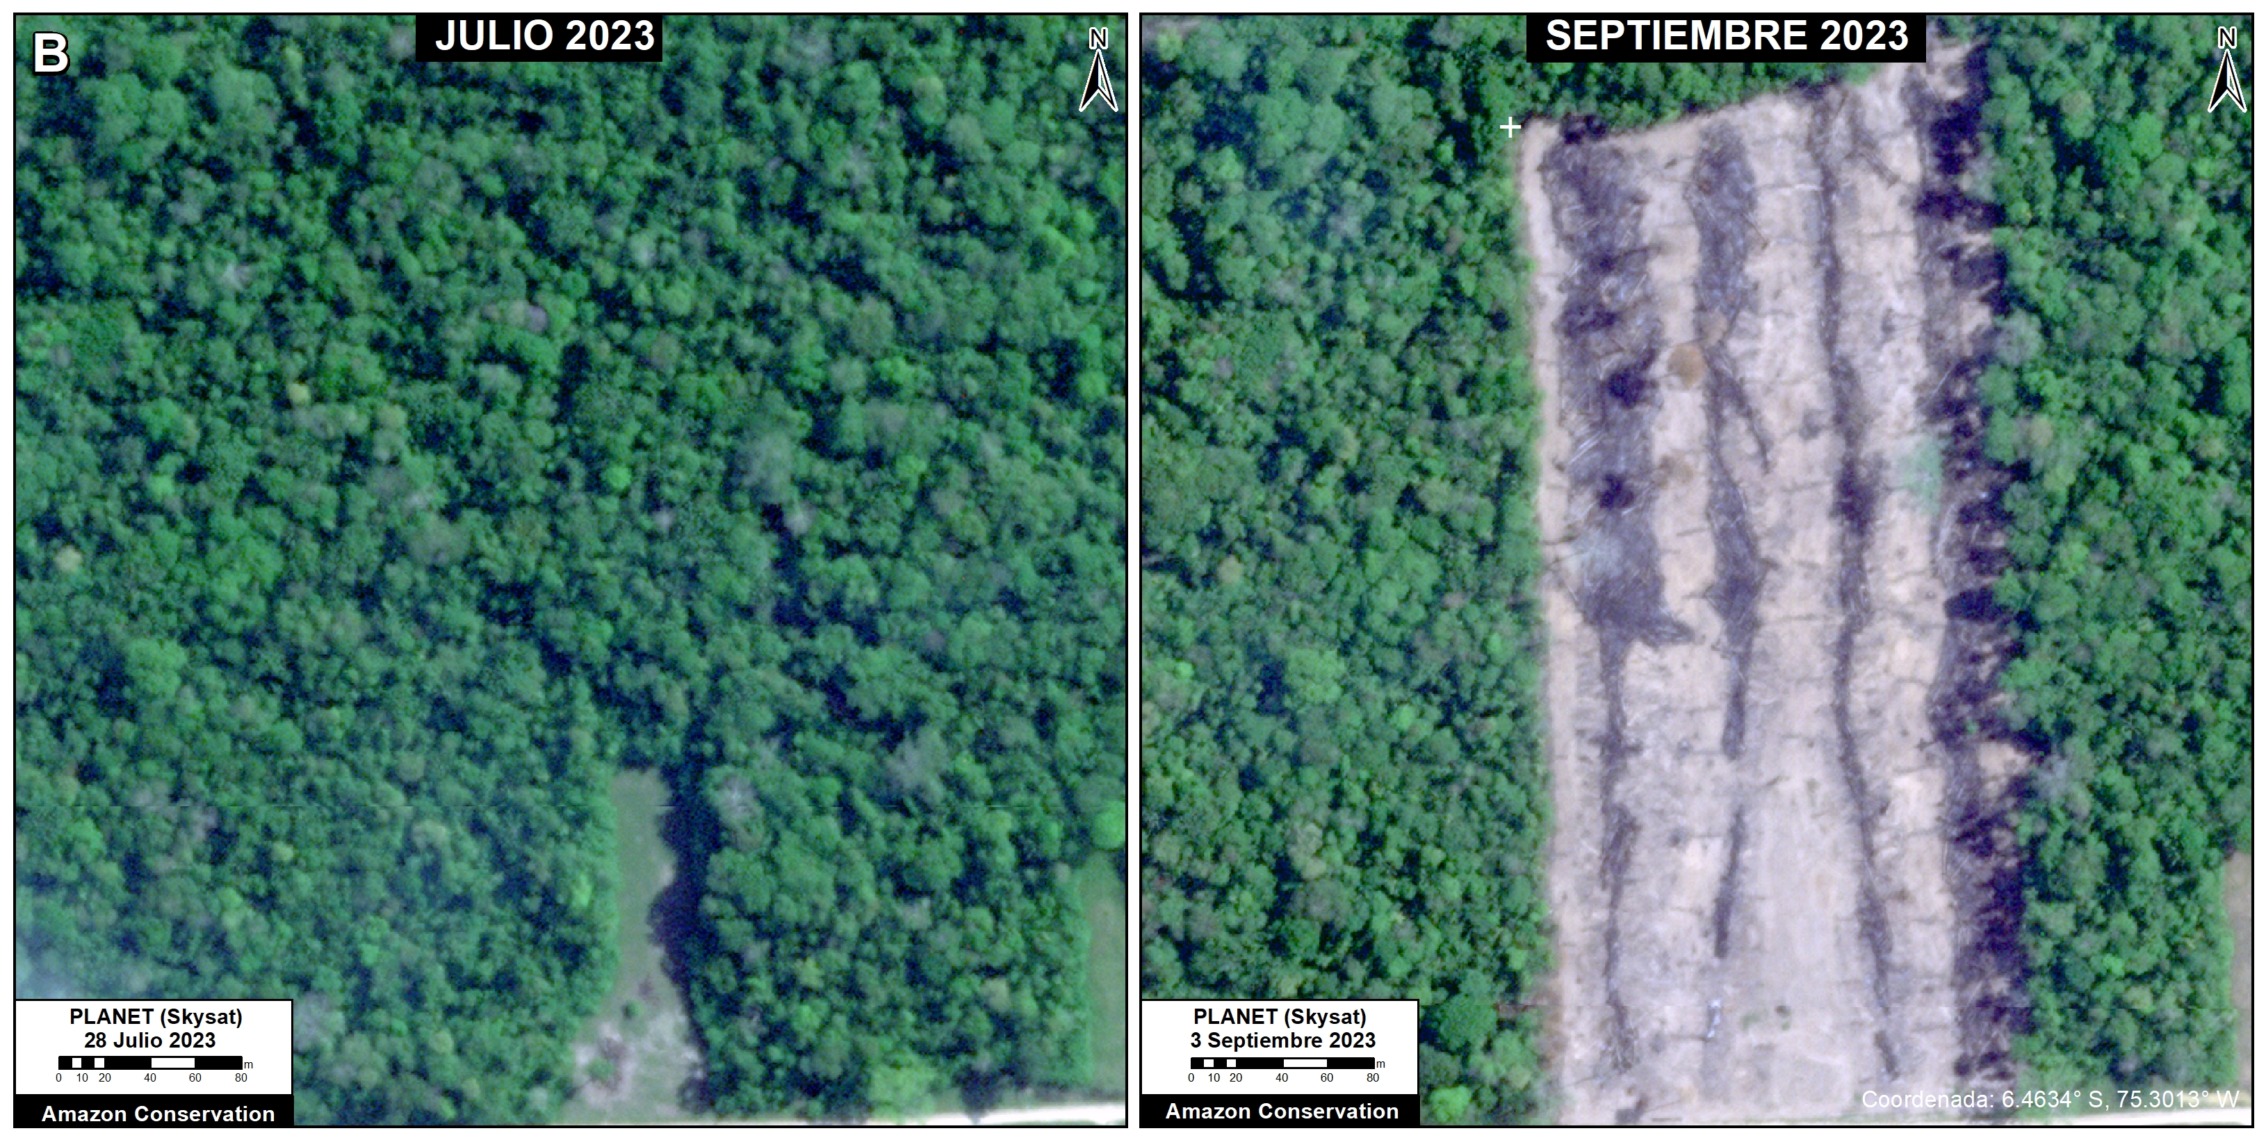
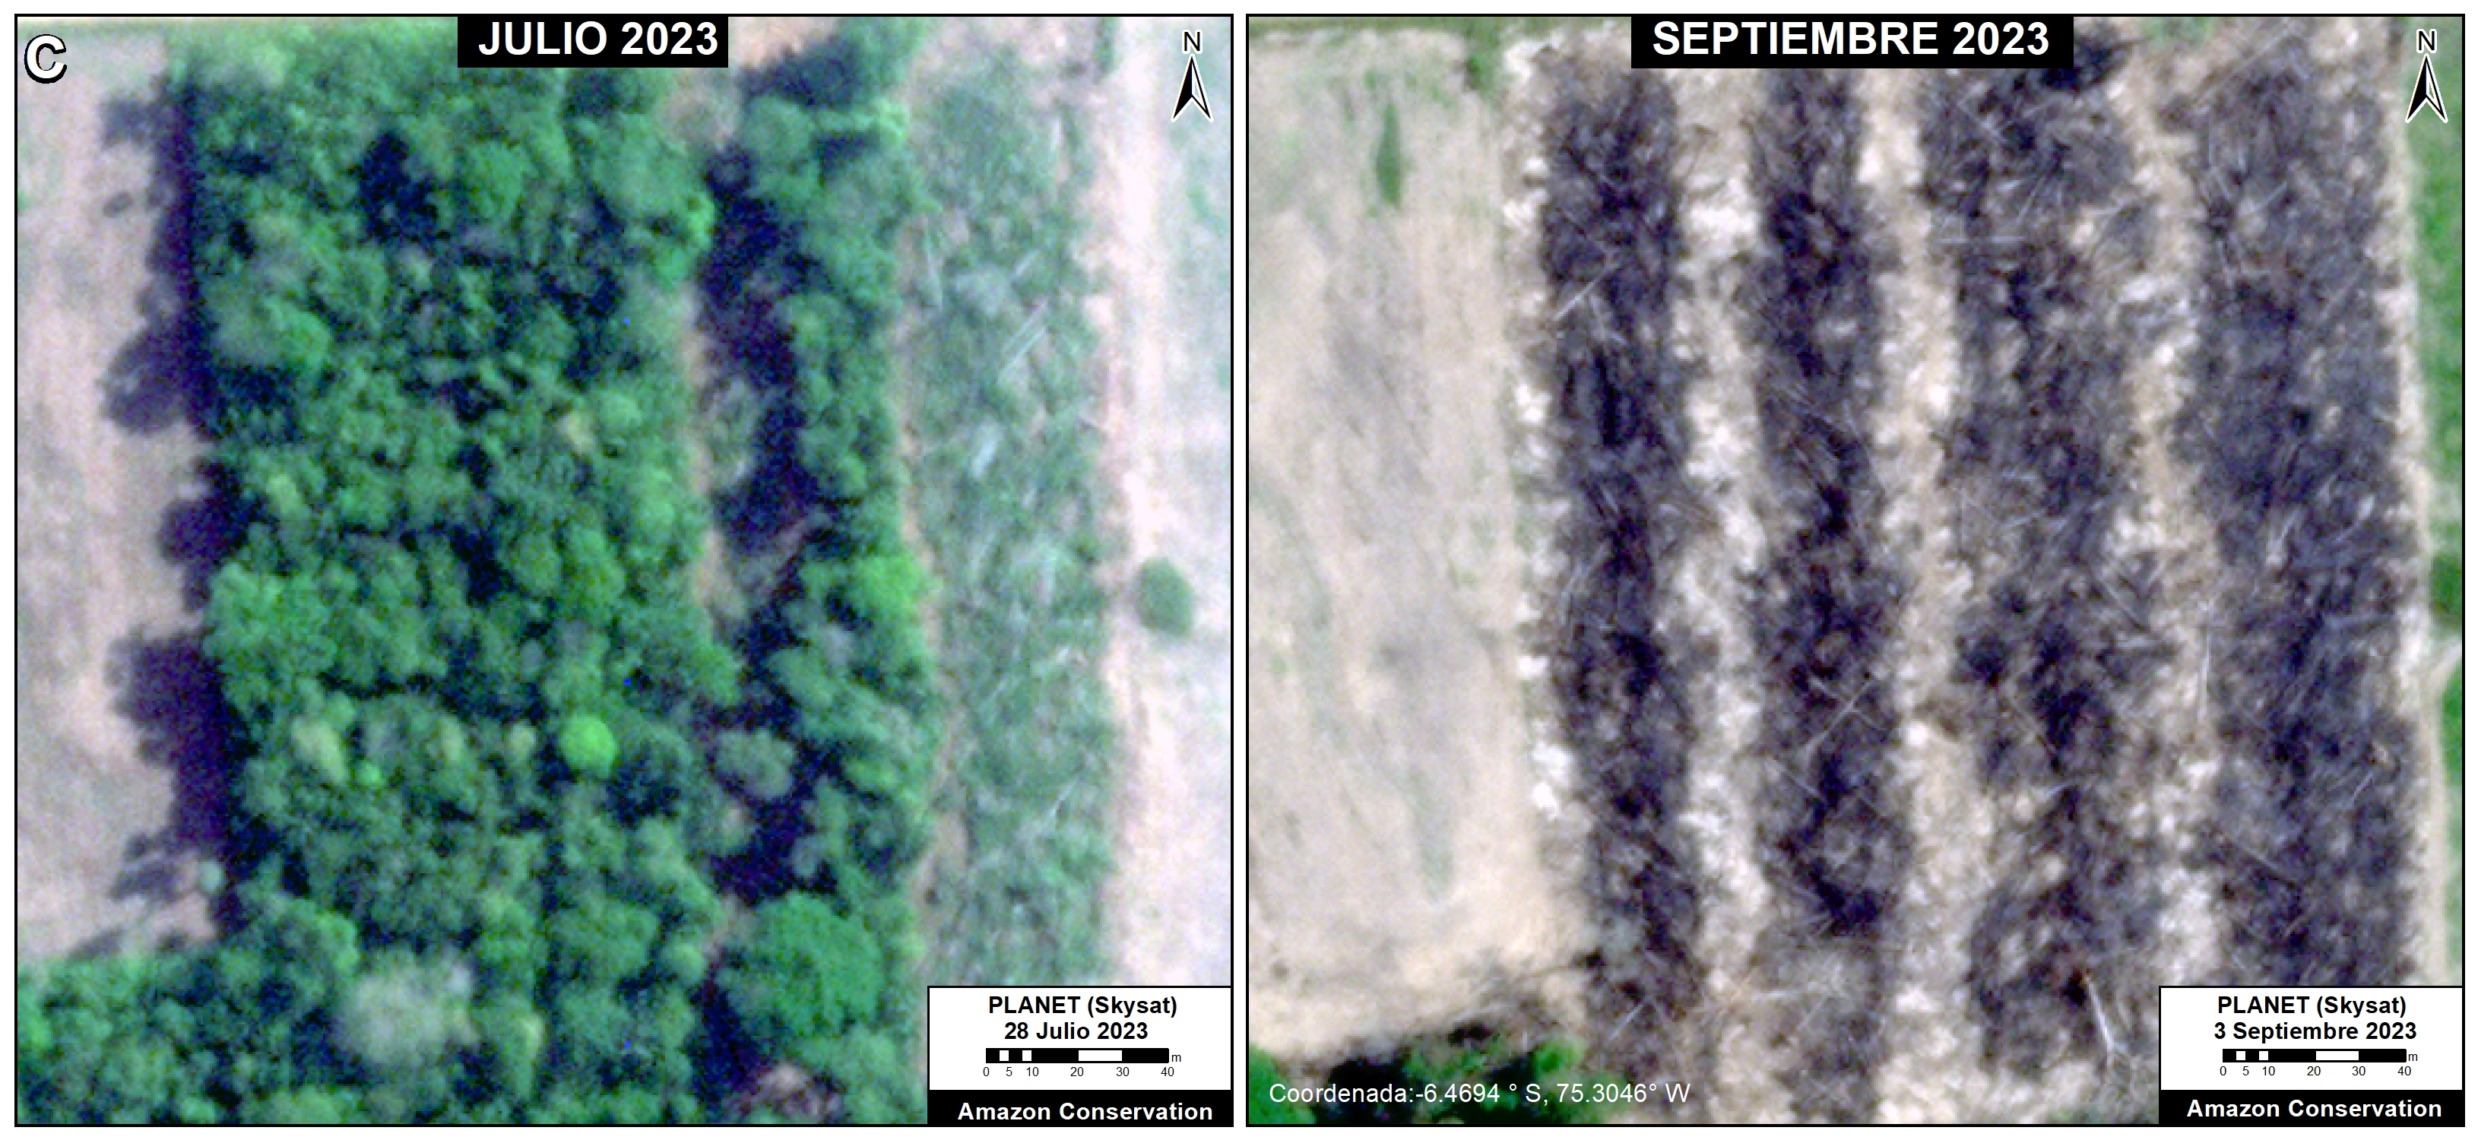
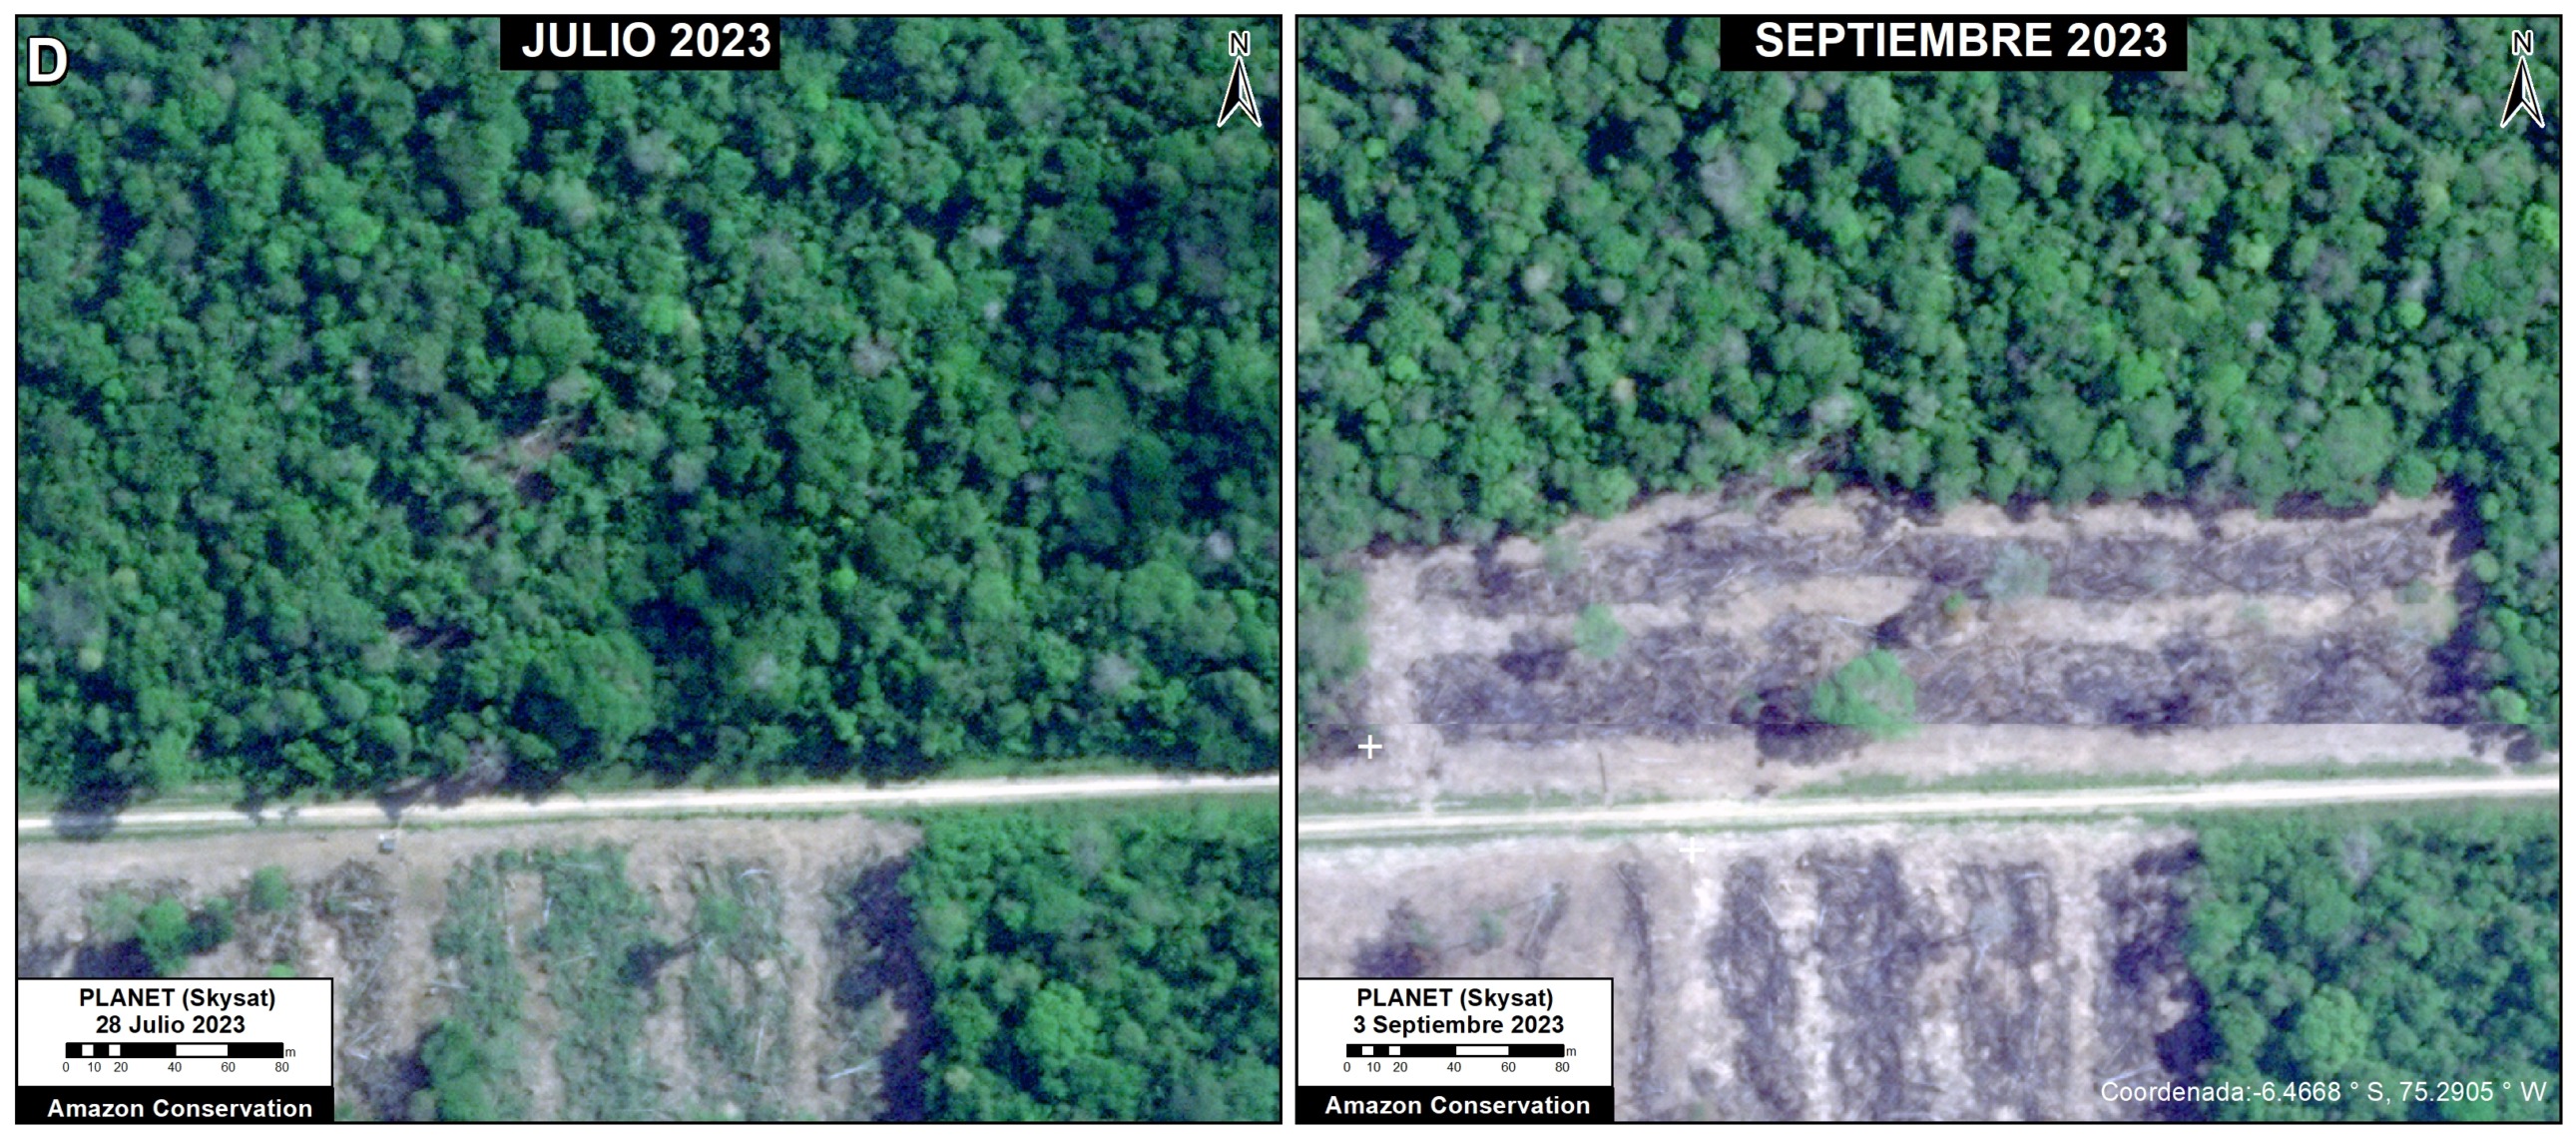
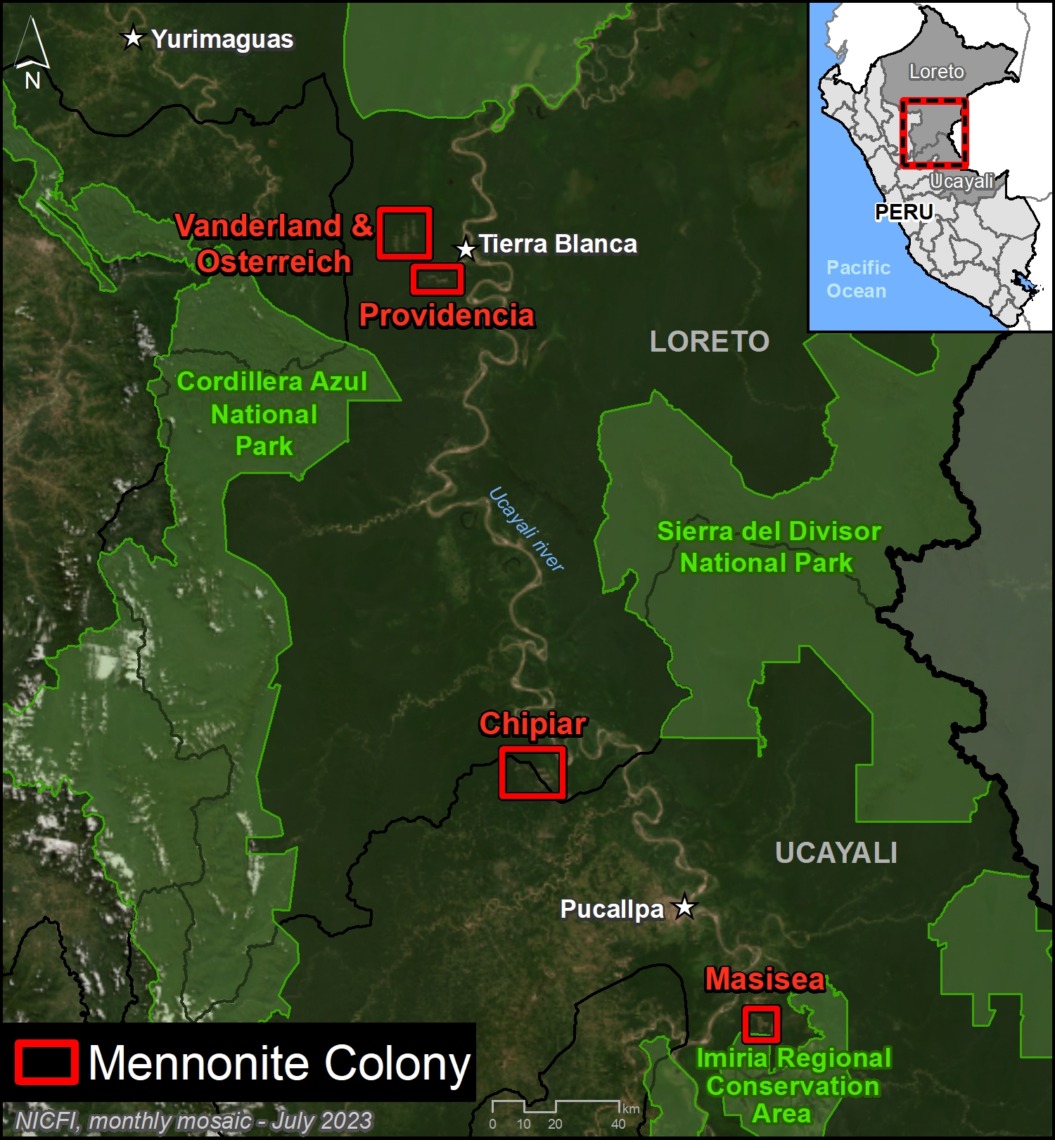
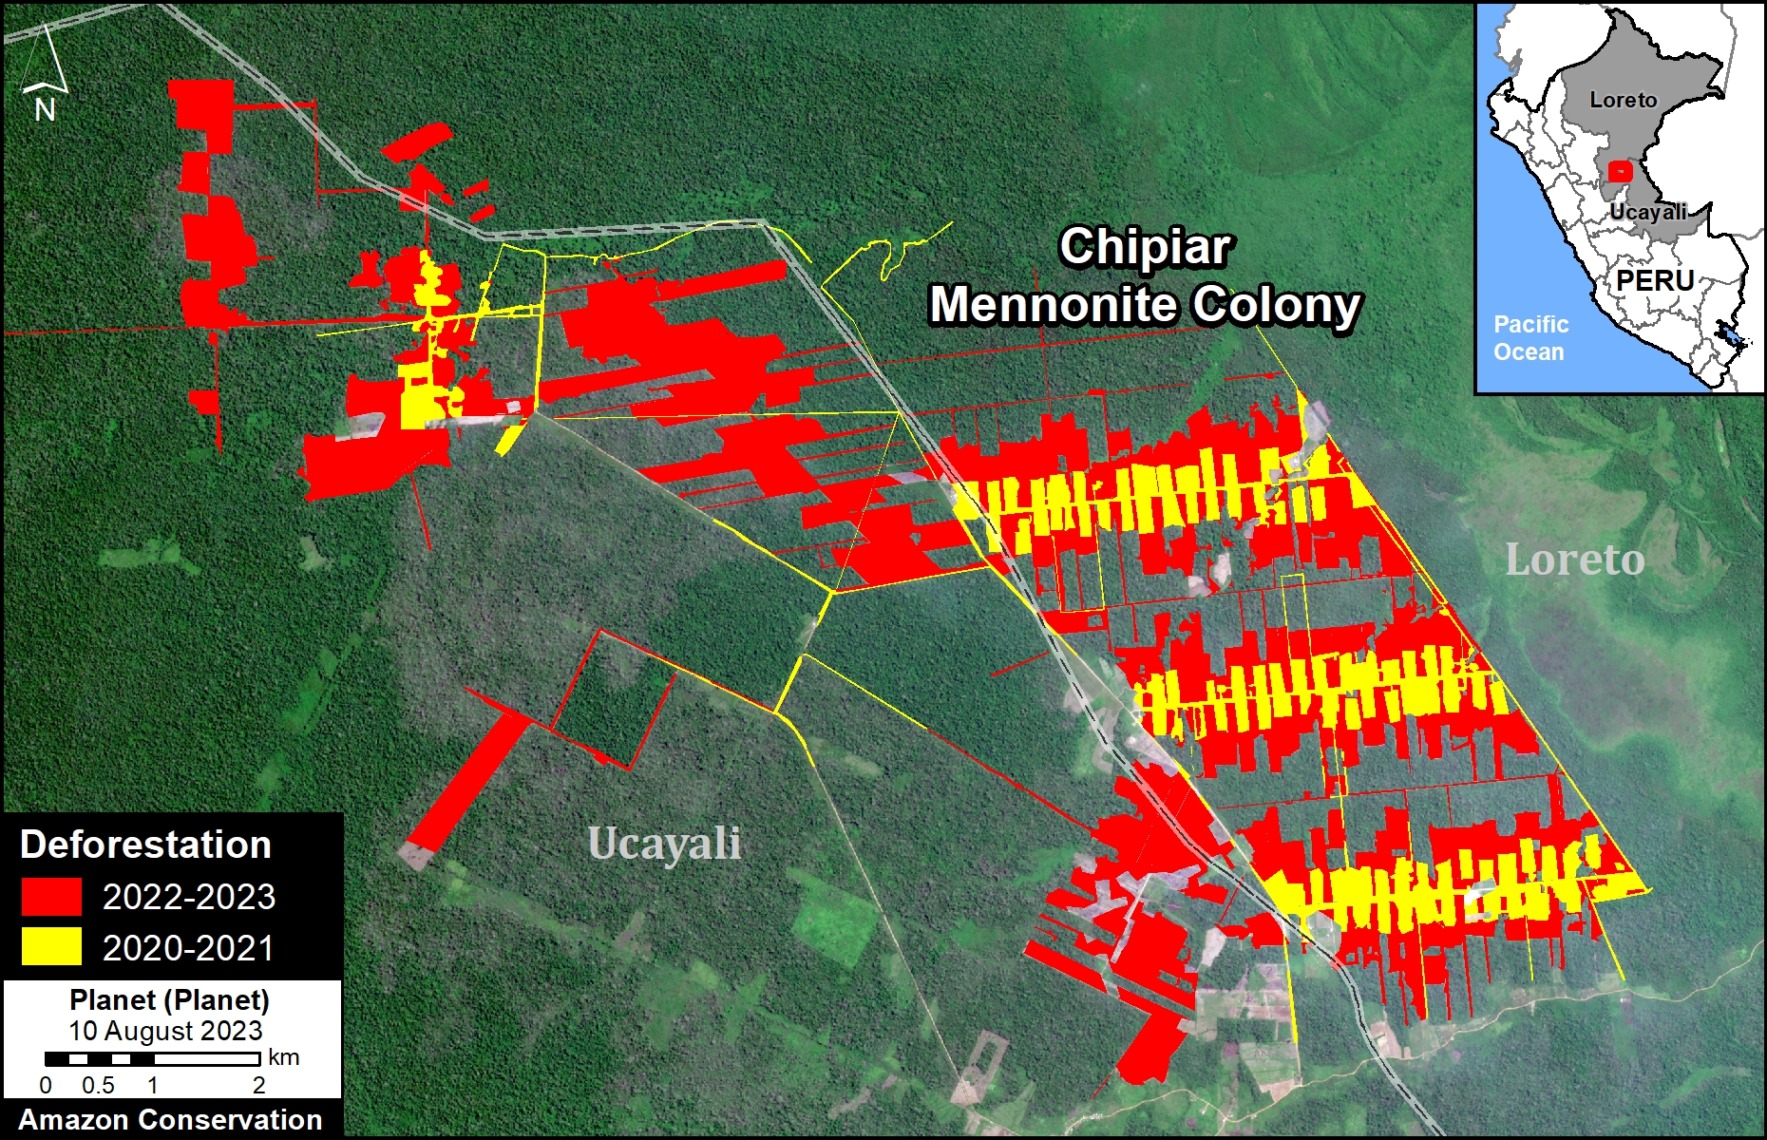
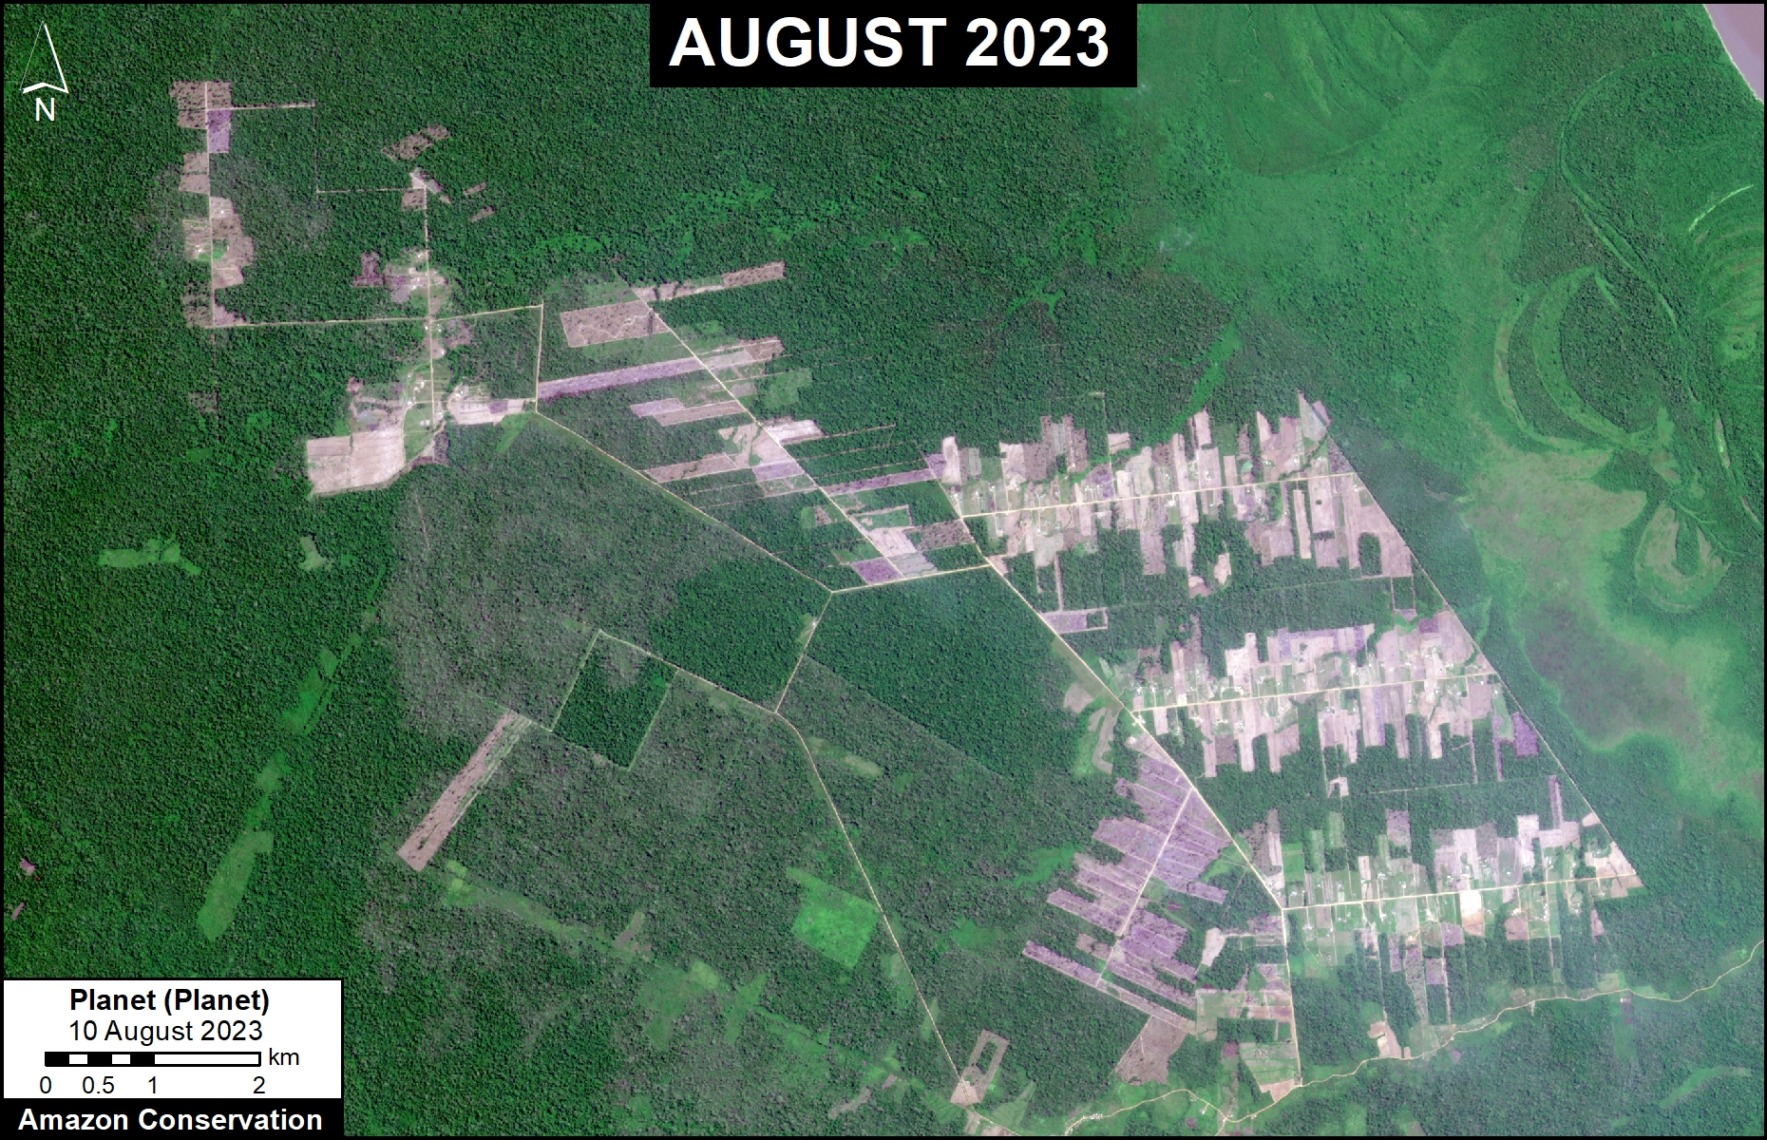
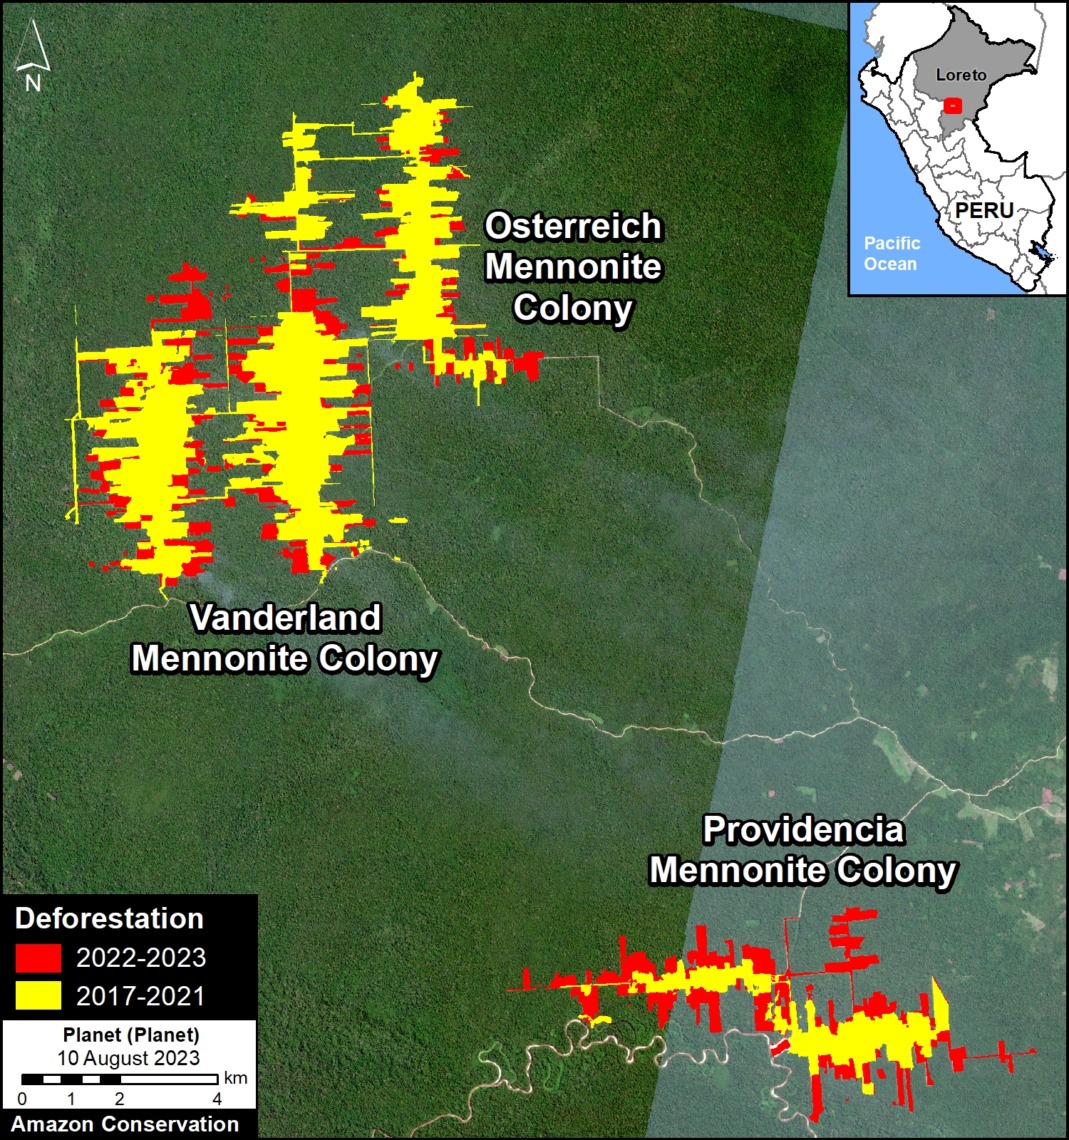
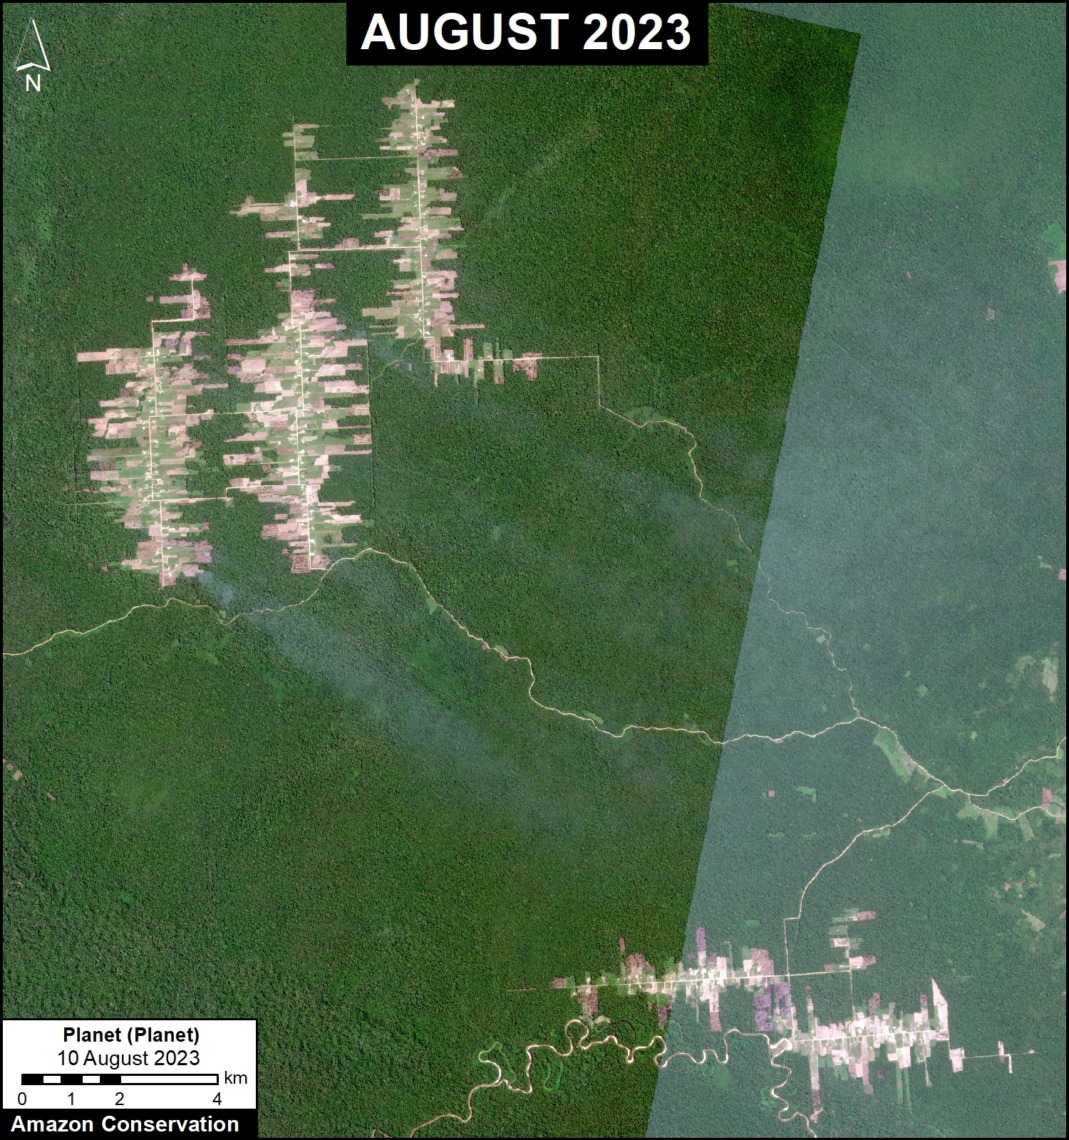
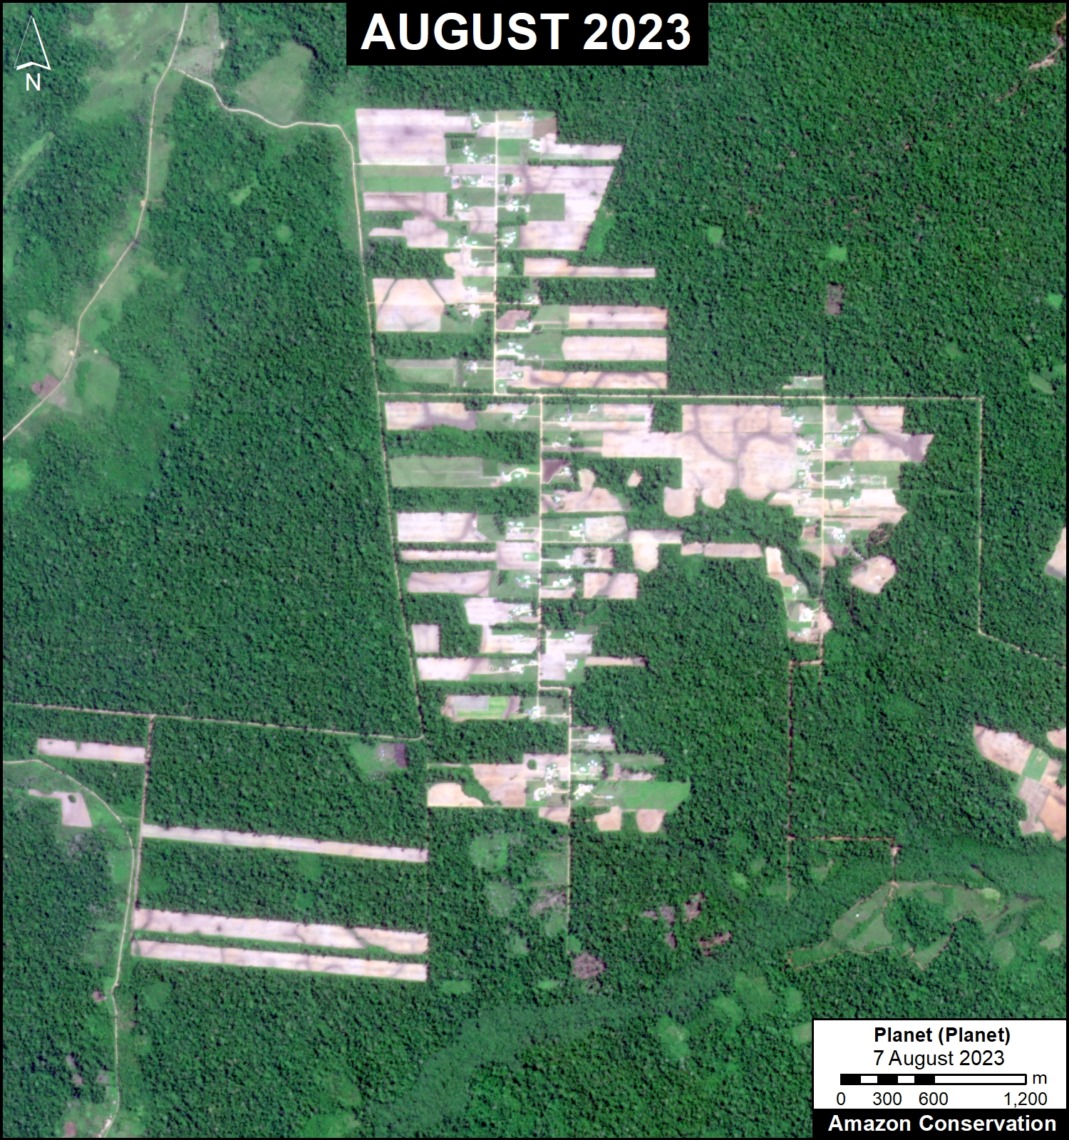
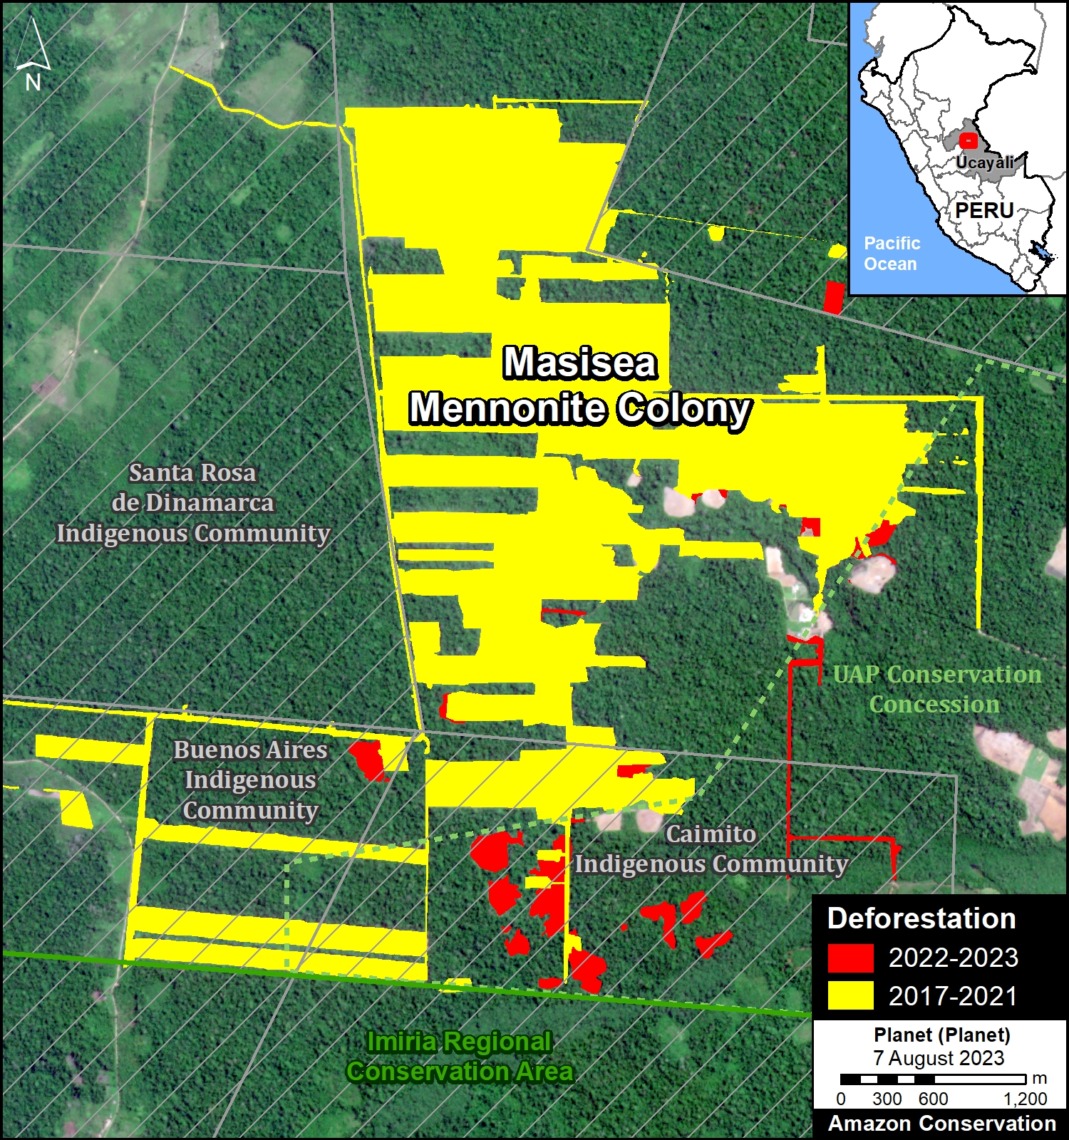
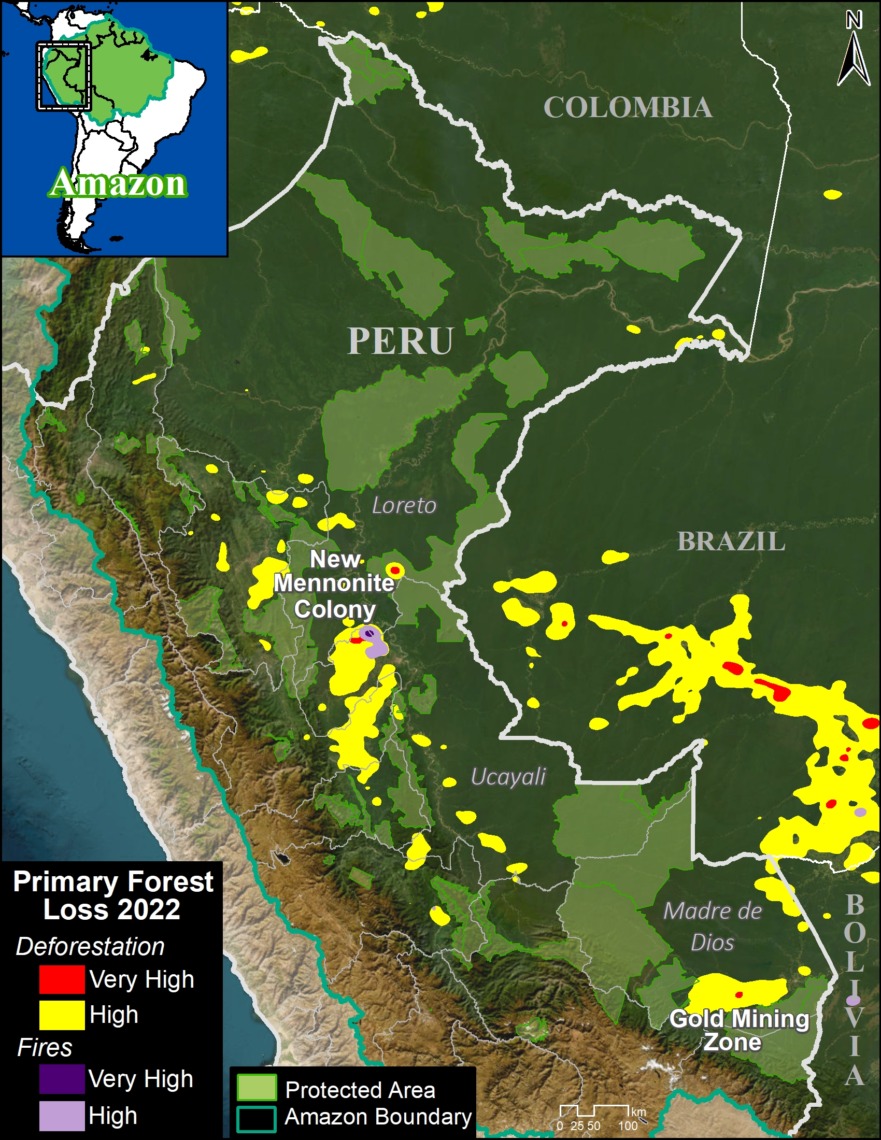
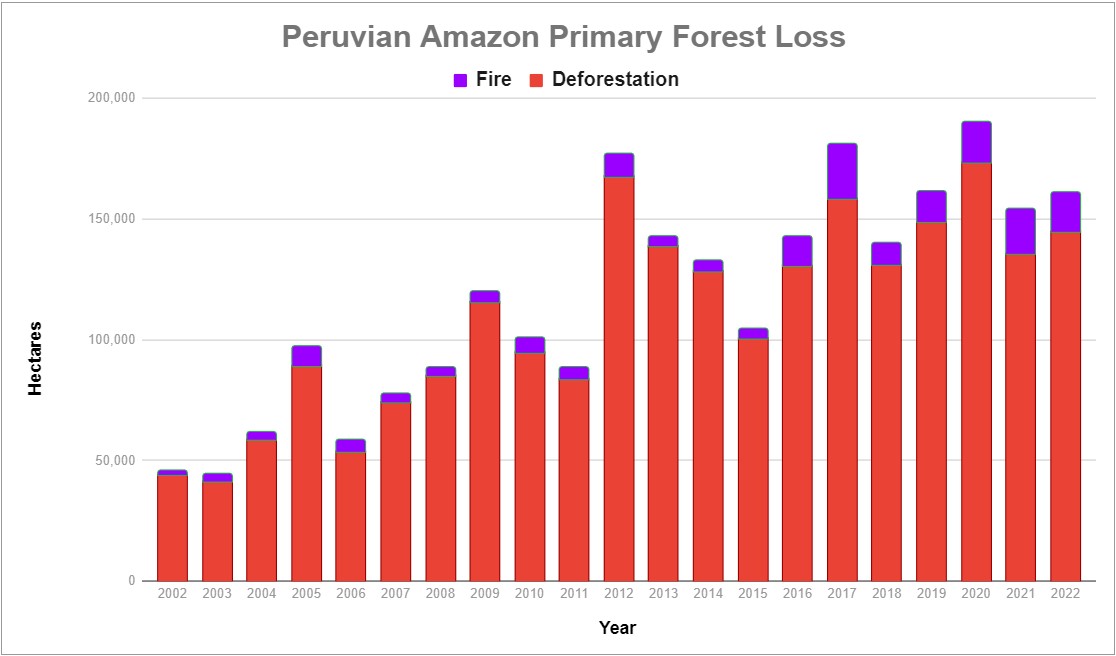
Peruvian Amazon

Peru is the third-leading source of Amazonian deforestation (MAAP #187).
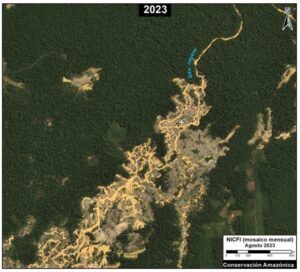
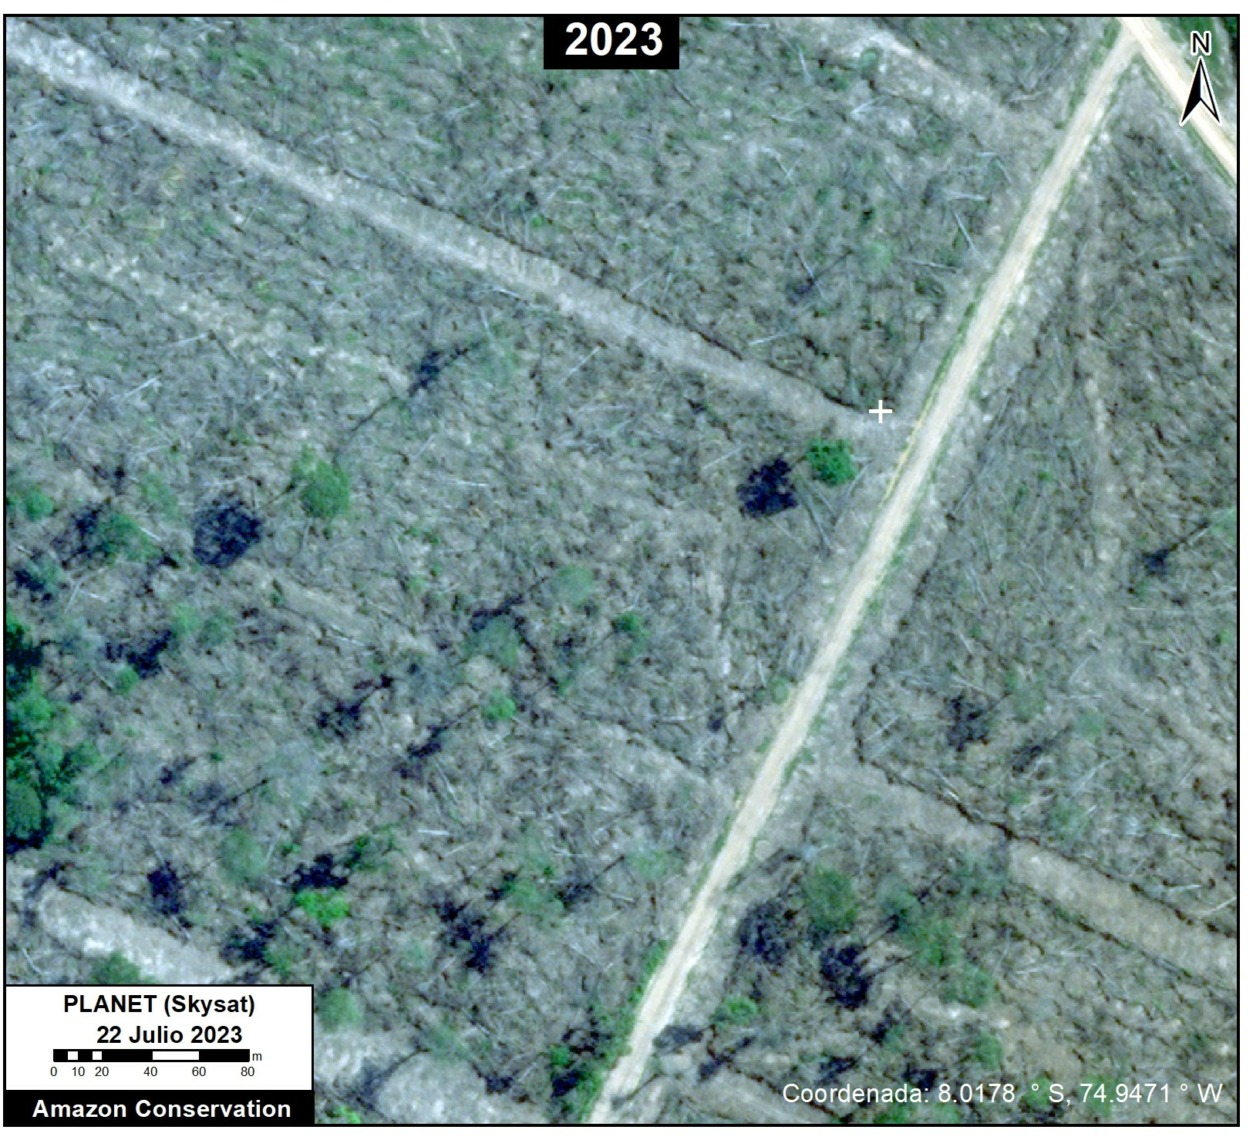
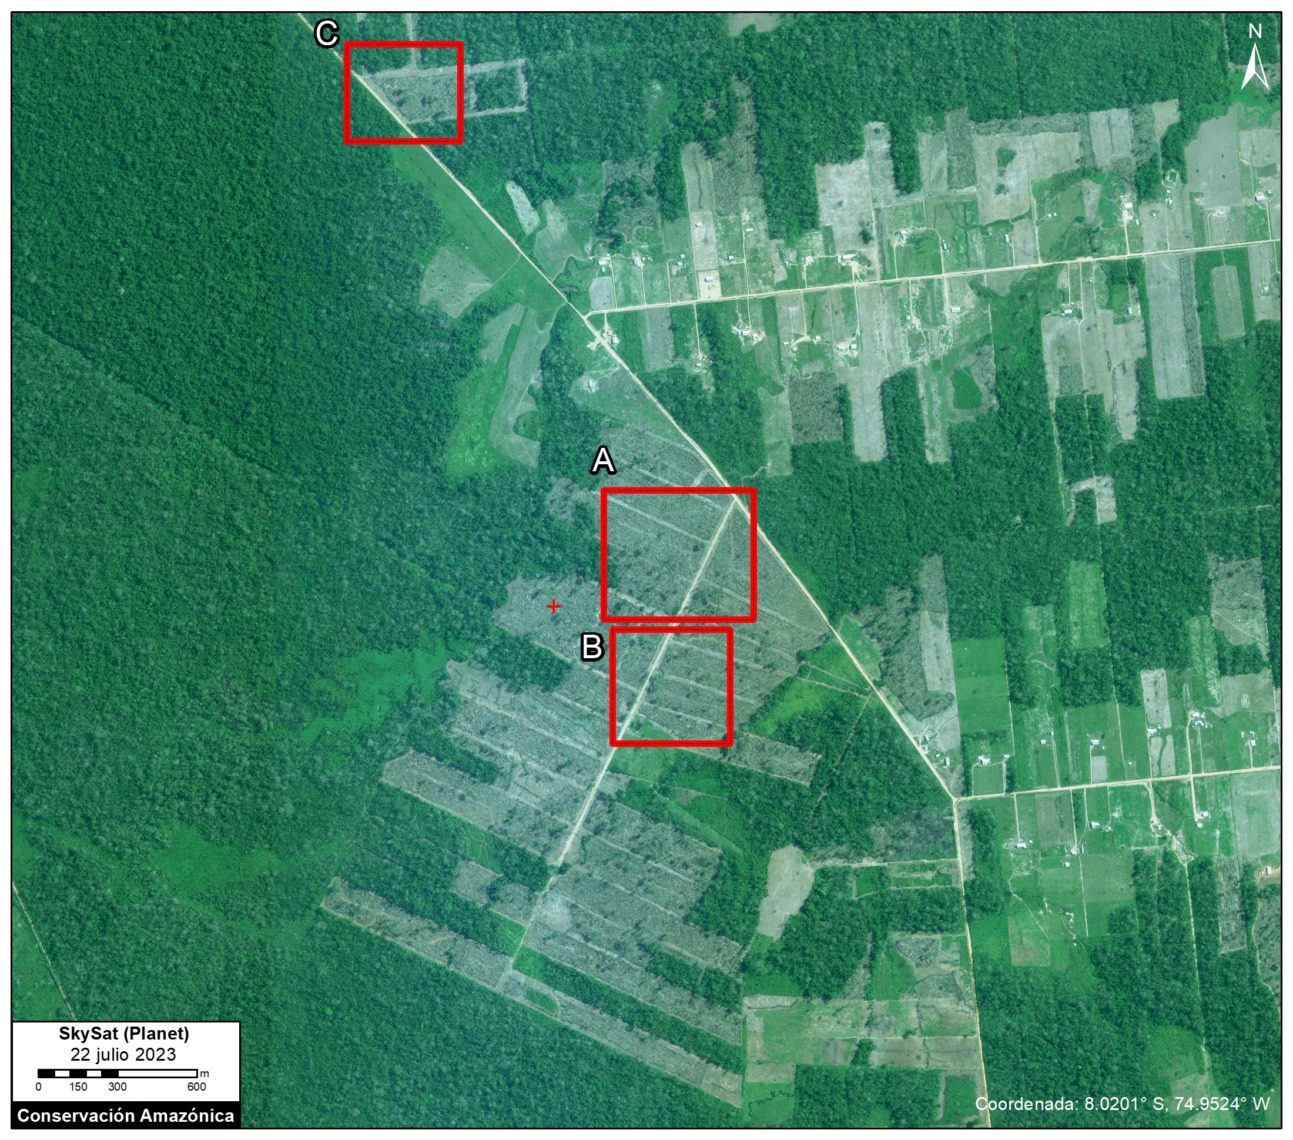
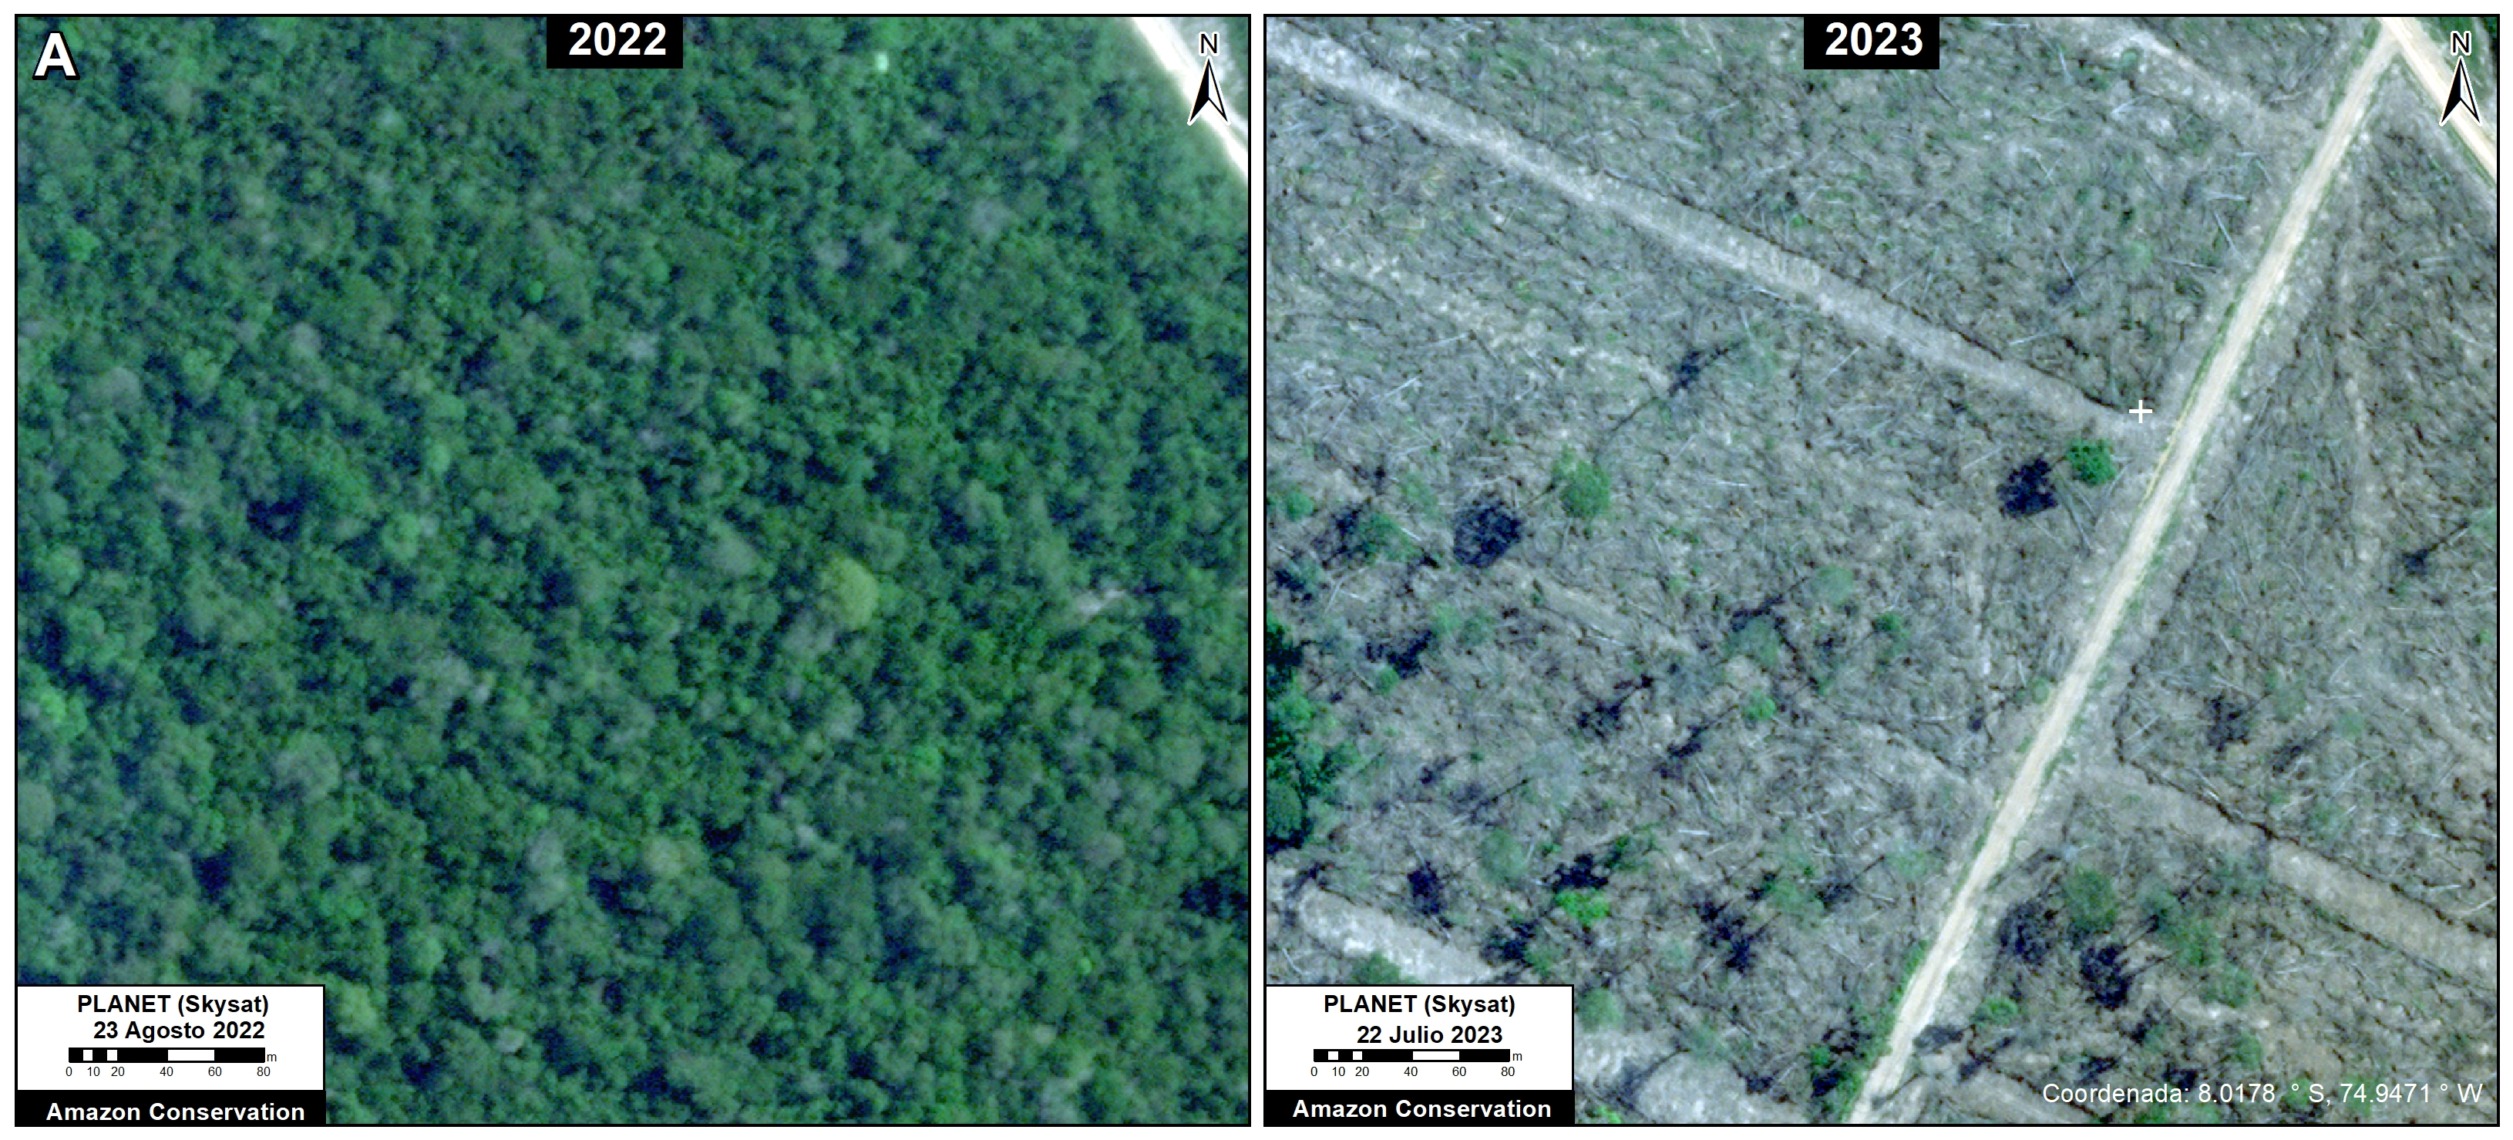
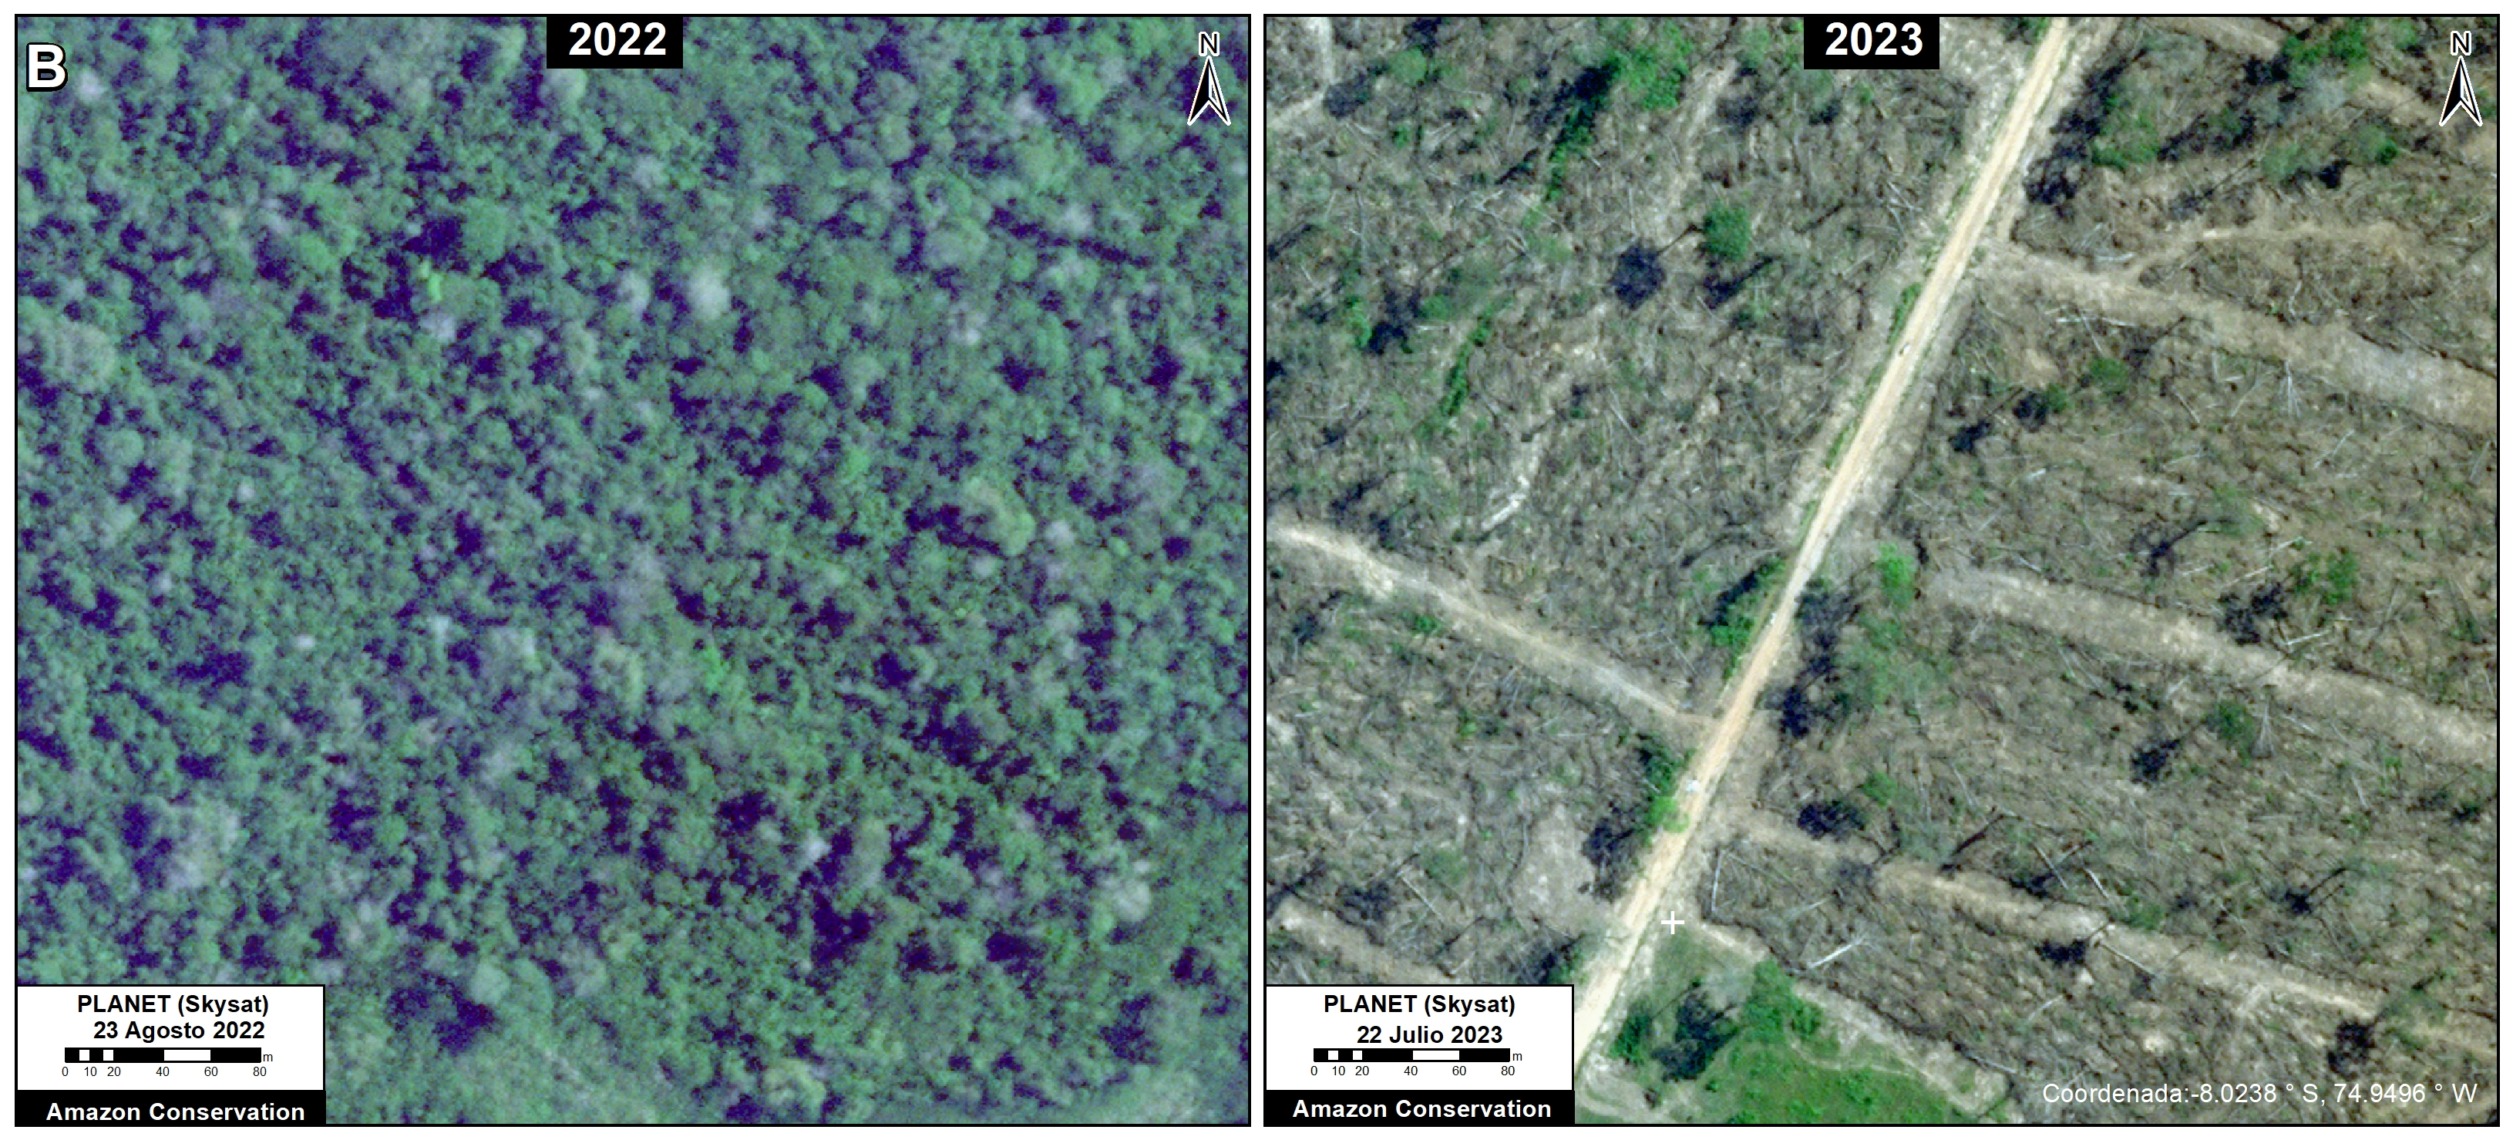
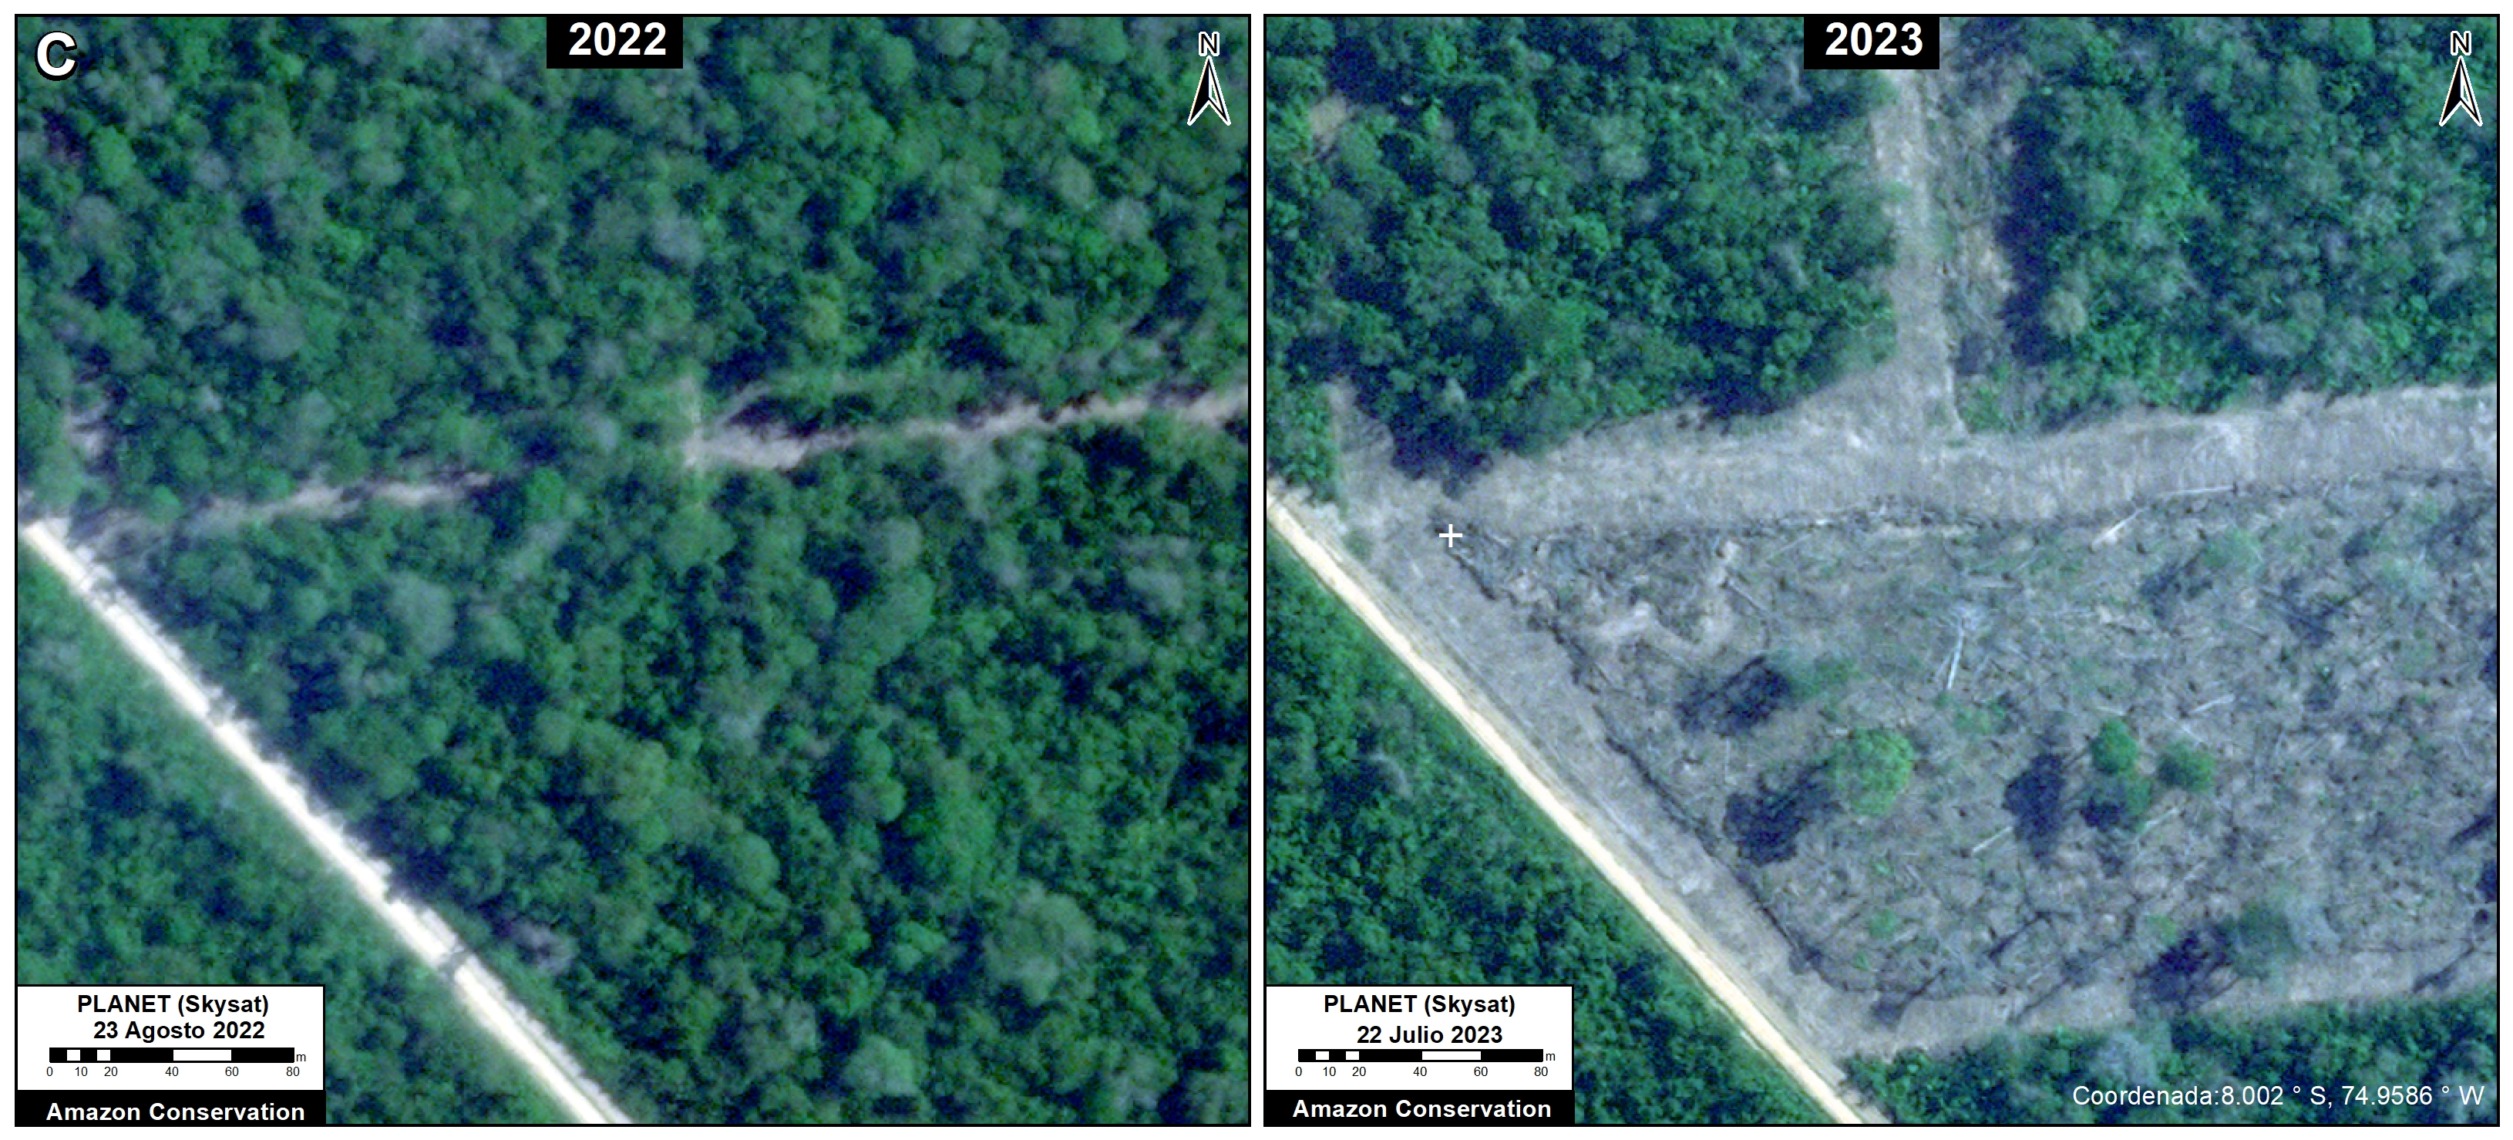
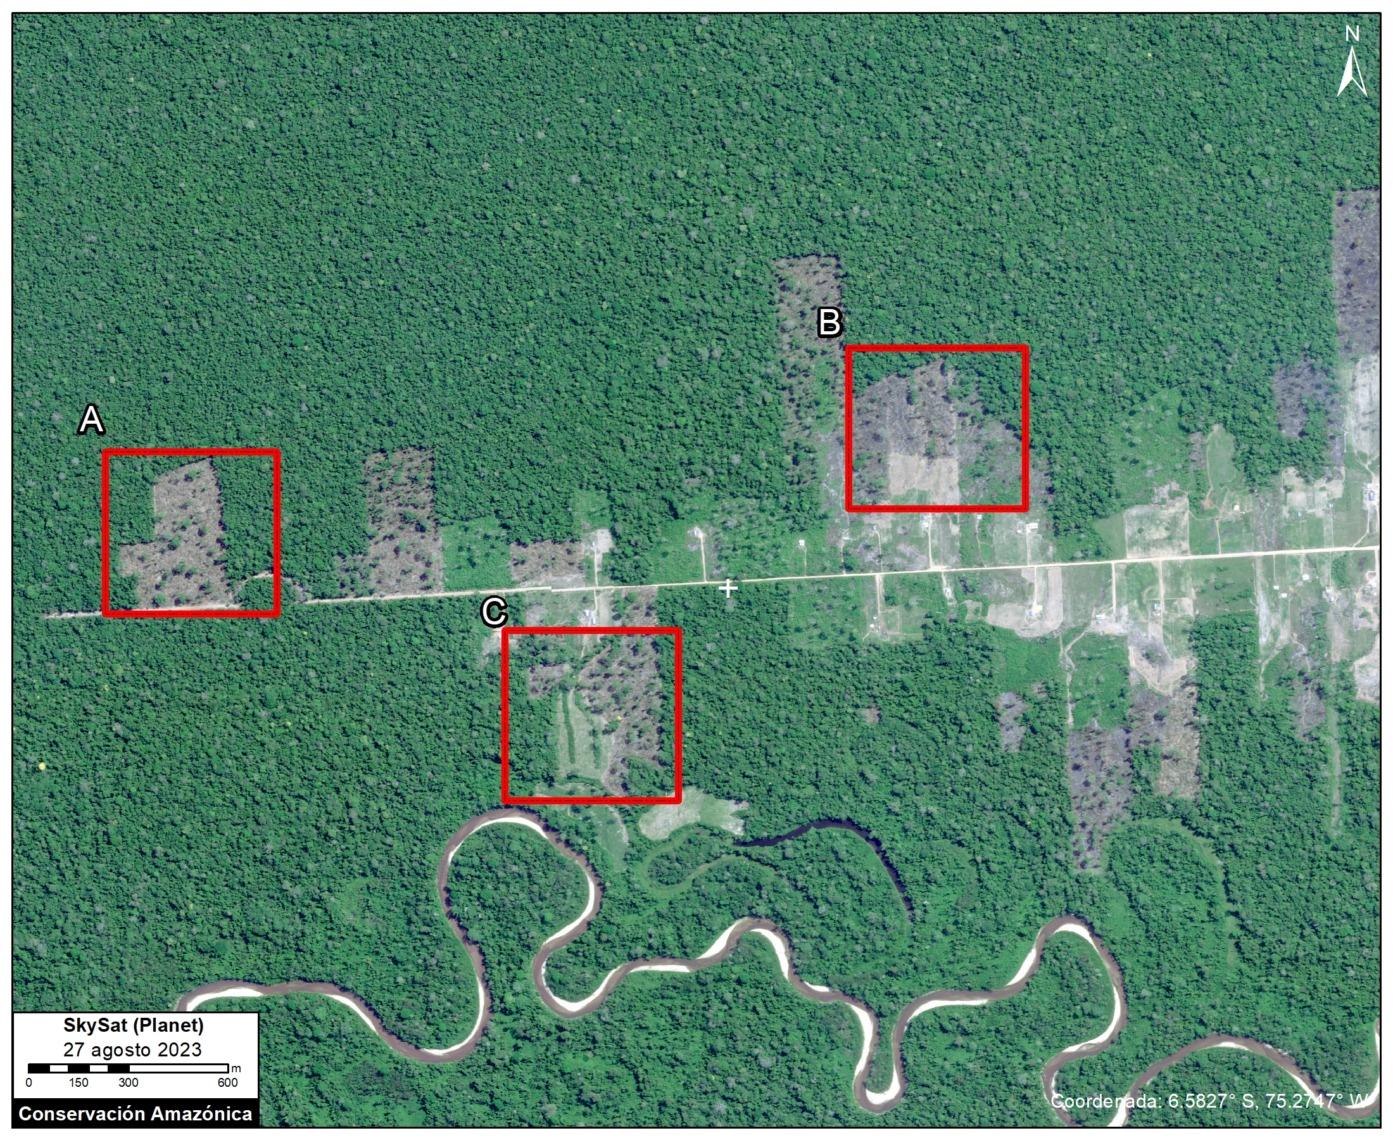
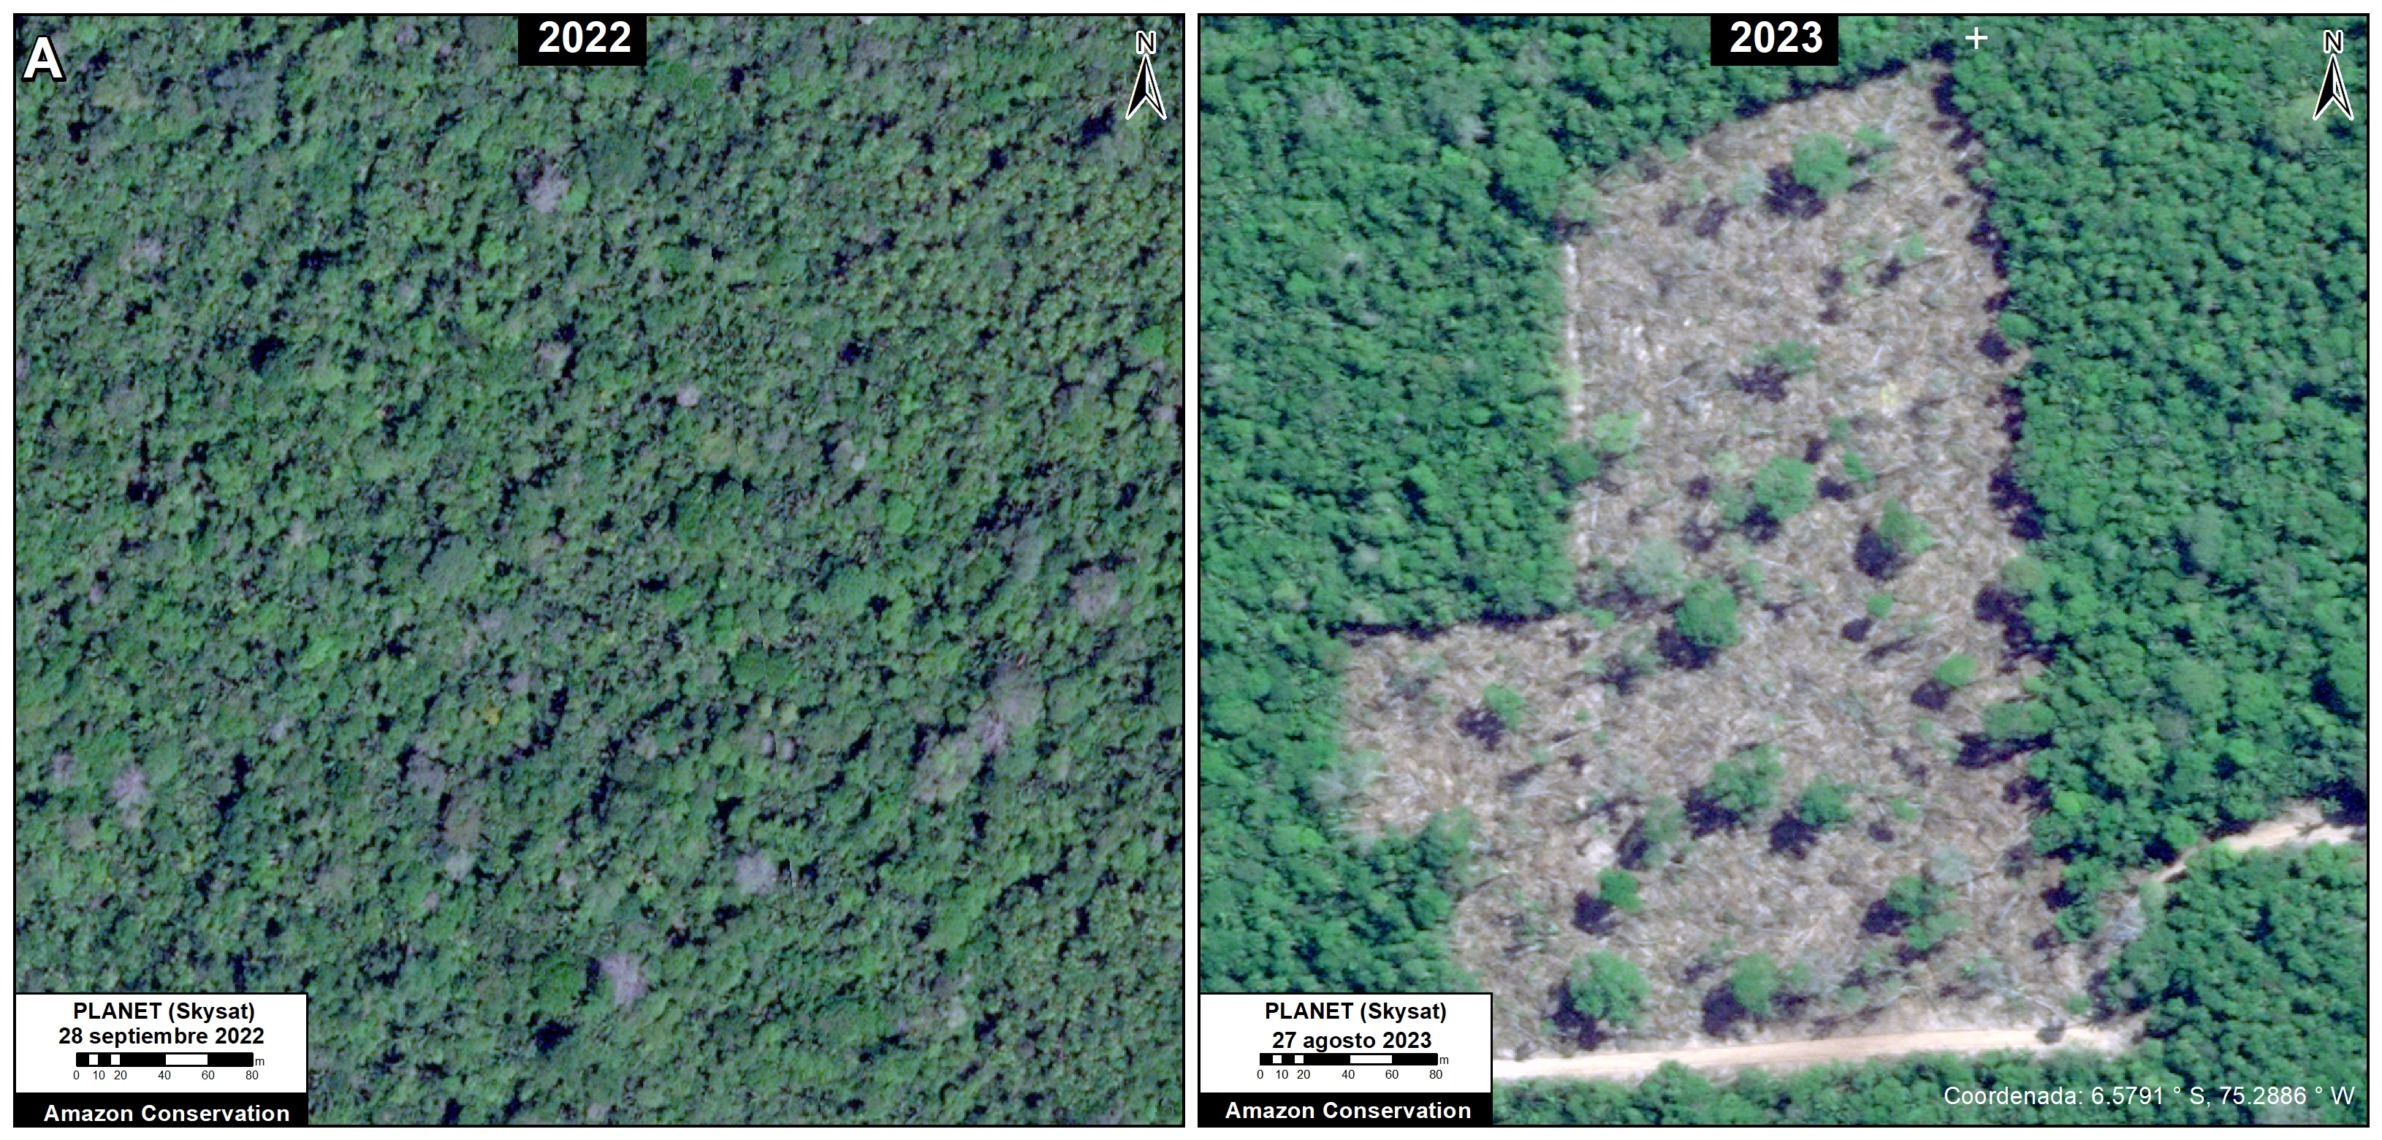
In the central Amazon, we have been highlighting the rapid deforestation for new Mennonite colonies (see MAAP #188). MAAP reports revealed, in real-time, Mennonite deforestation growing from zero in 2016, to 3,400 hectares in 2021, to 4,800 hectares in 2022, to 7,032 hectares in 2023.
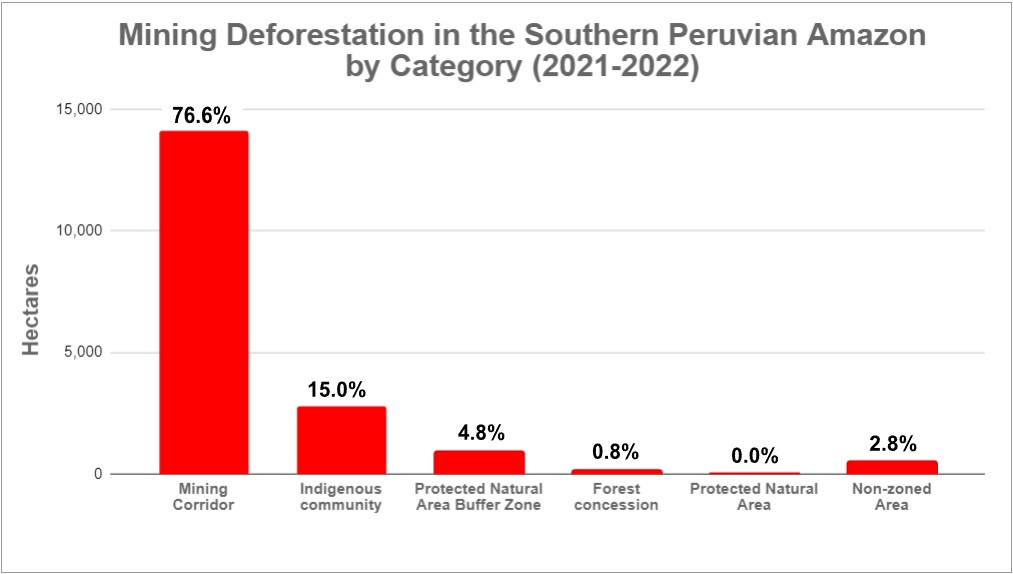
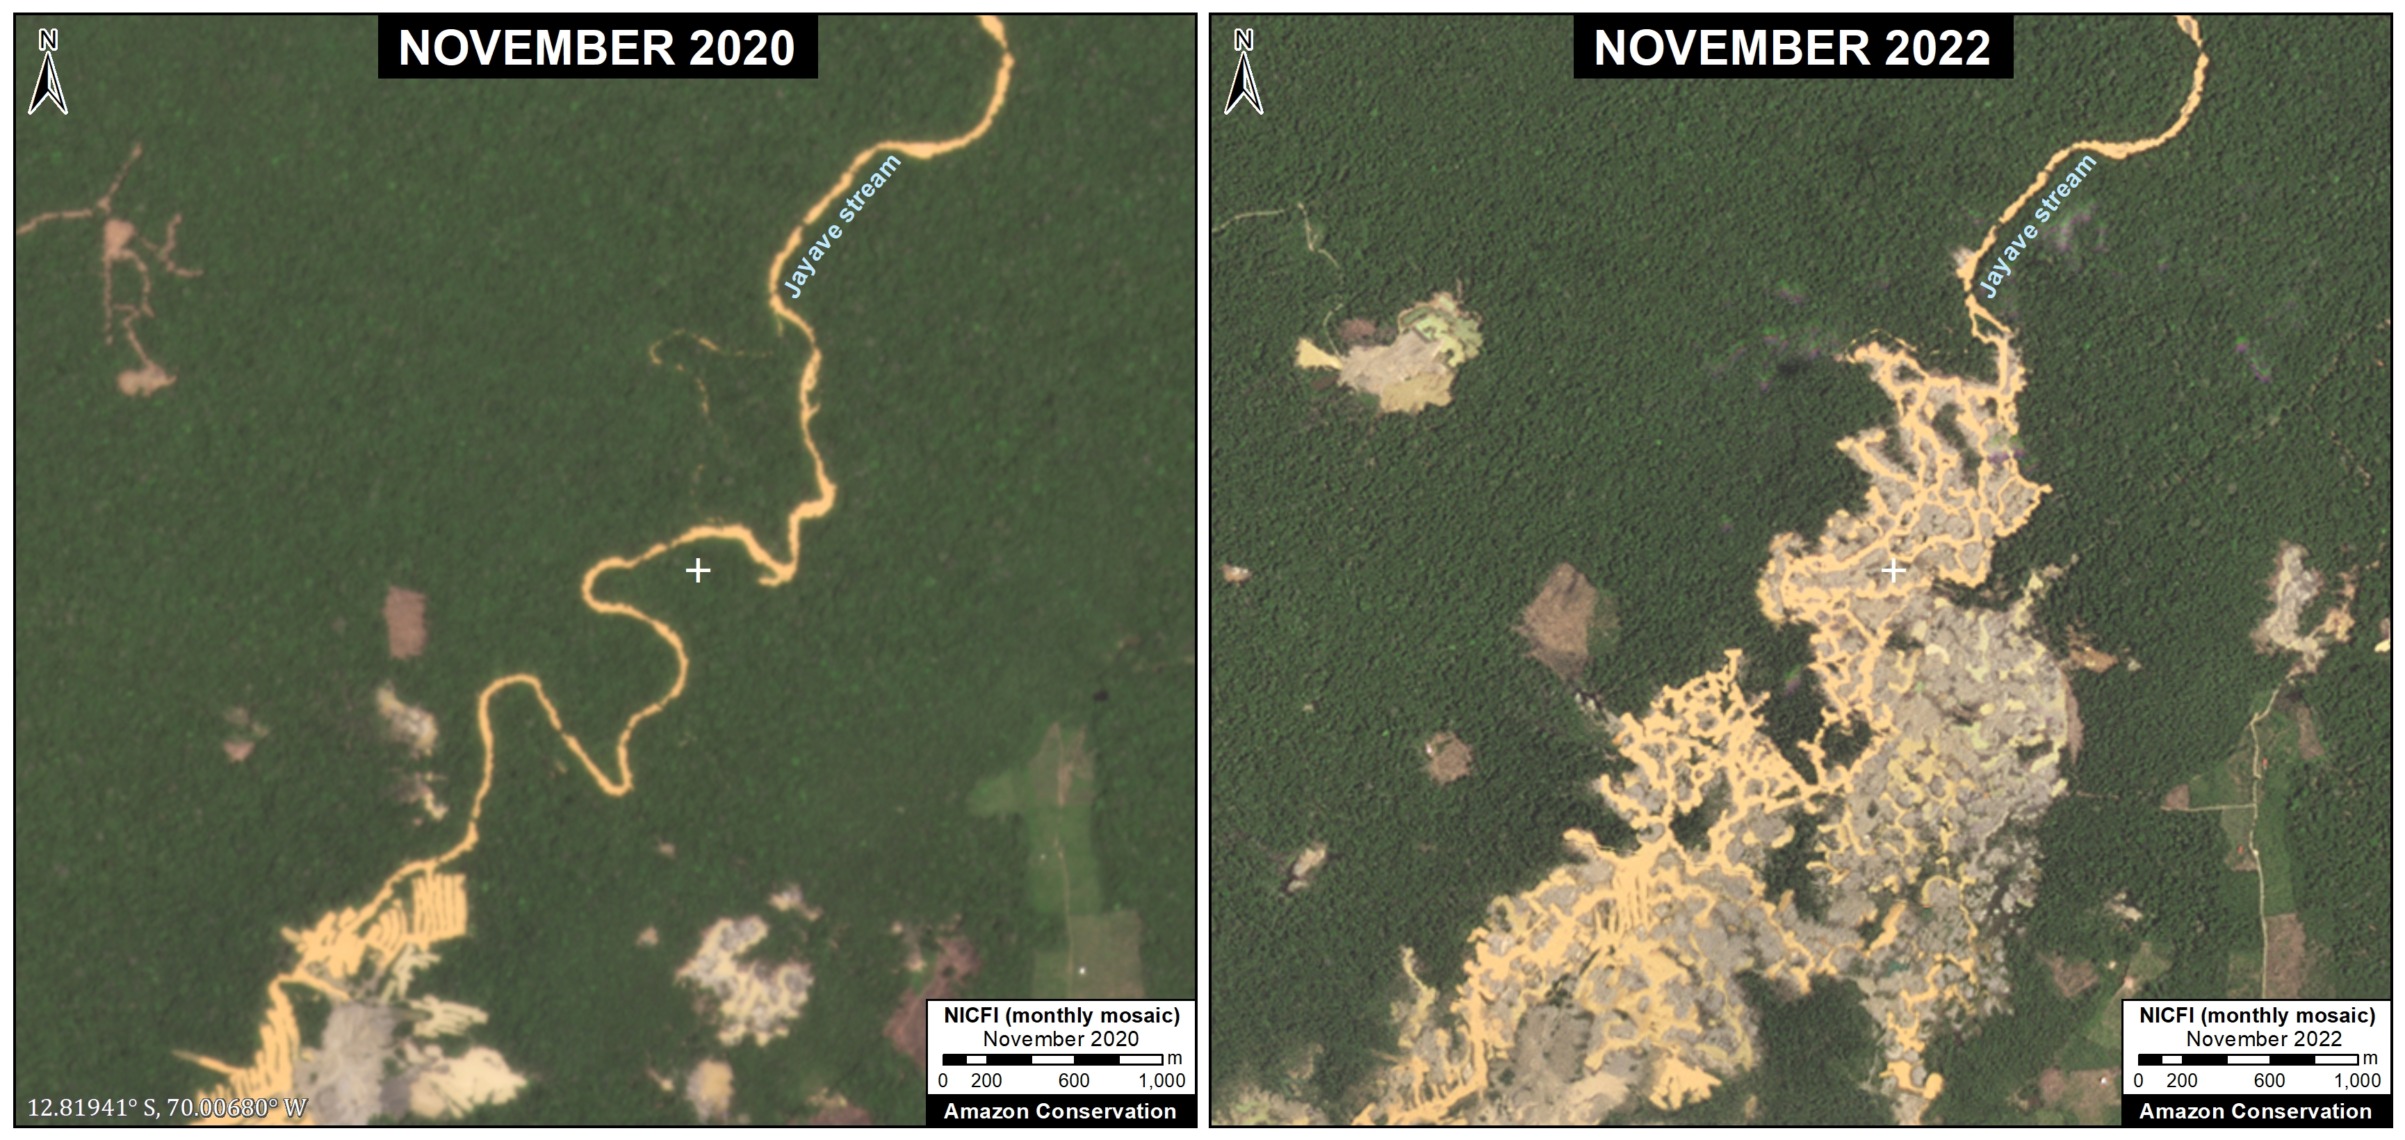
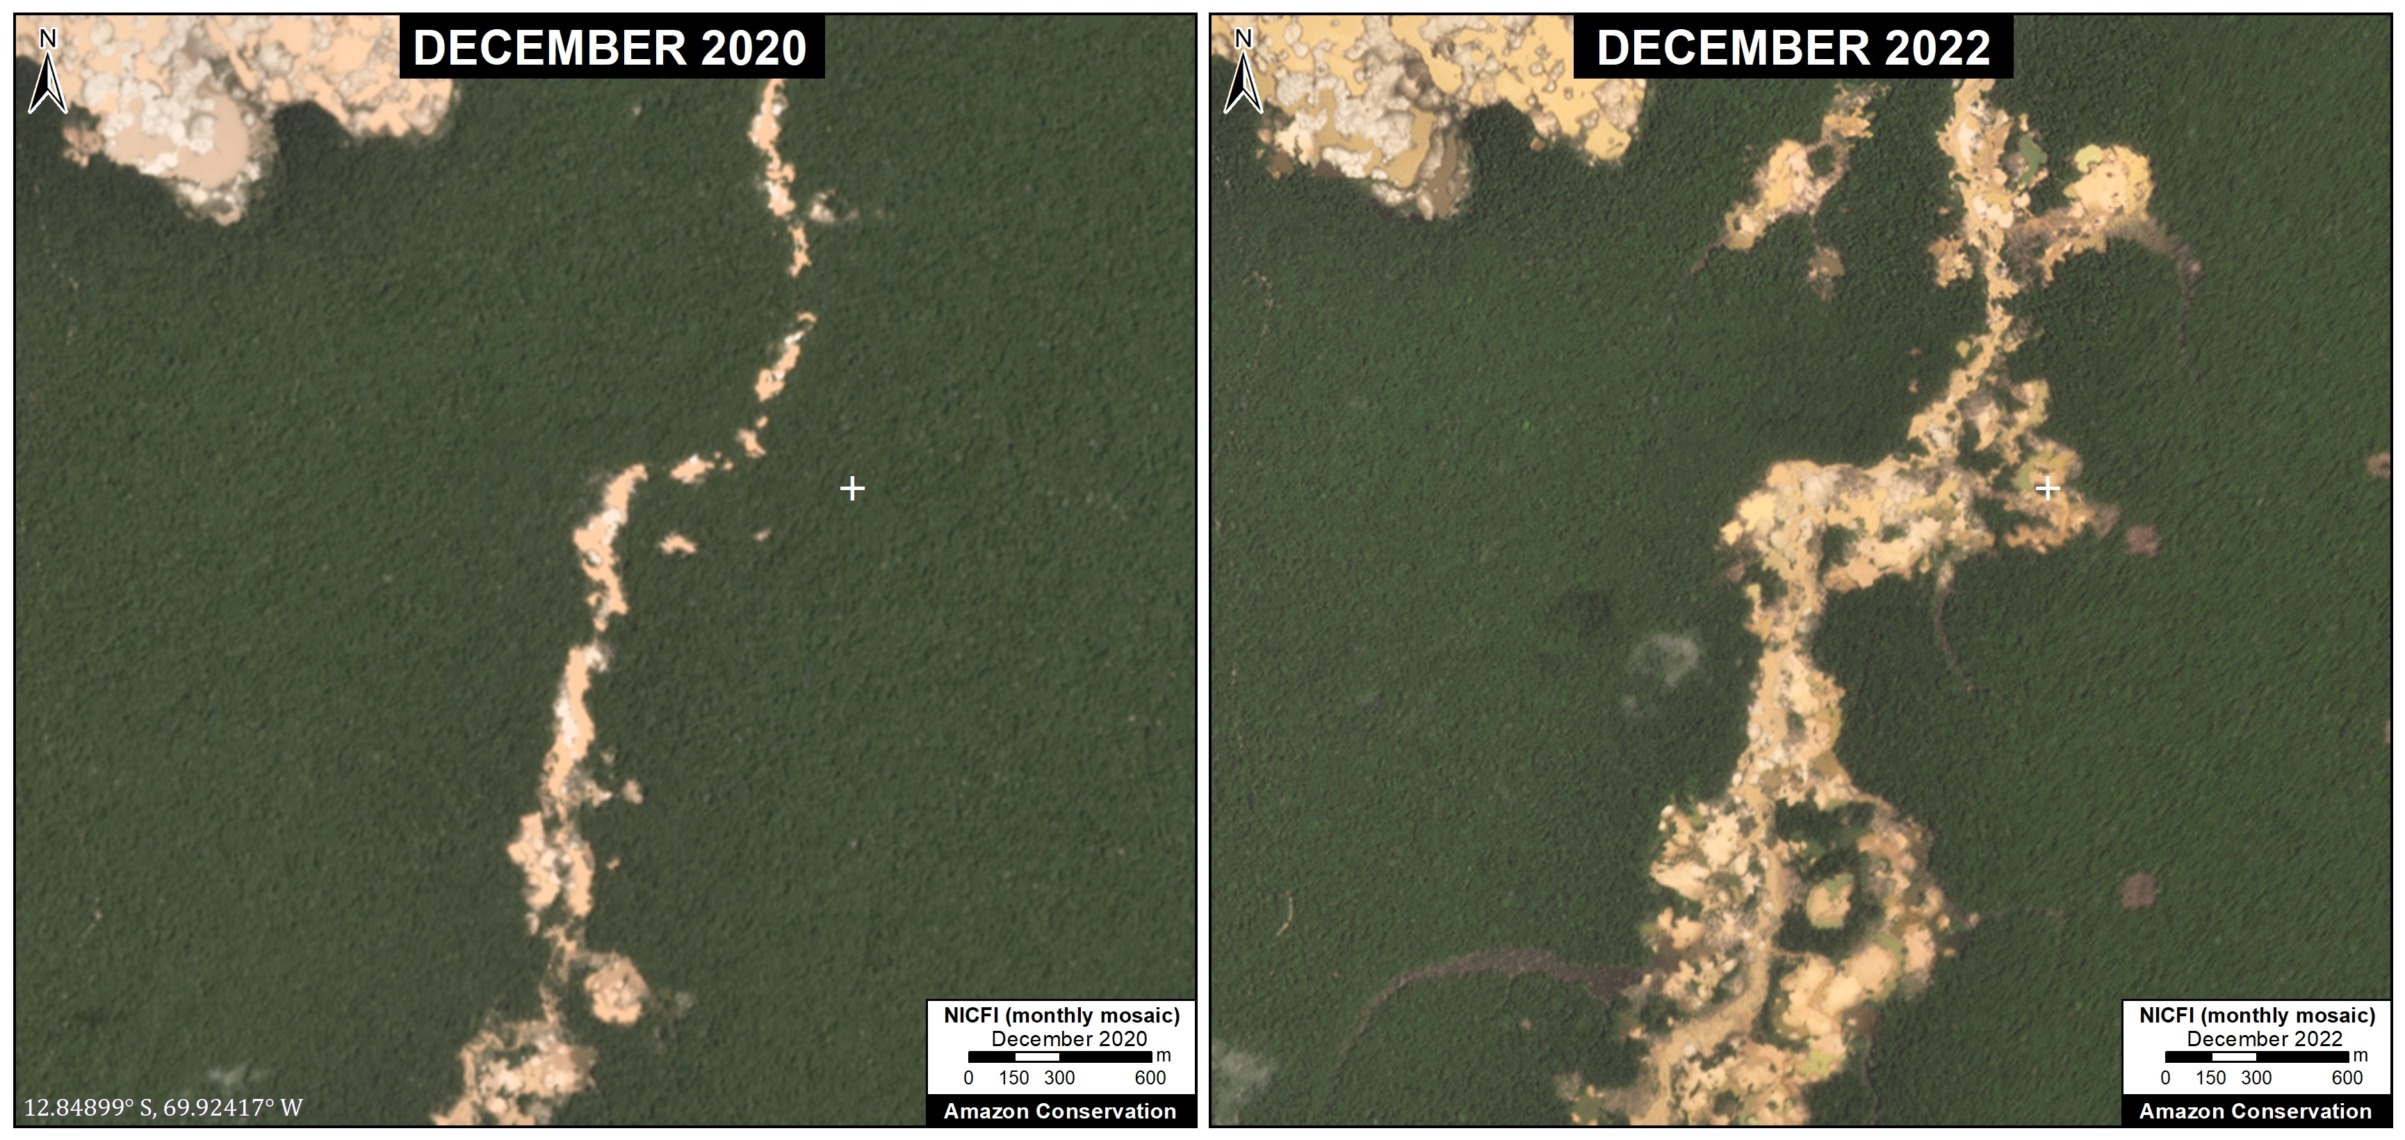
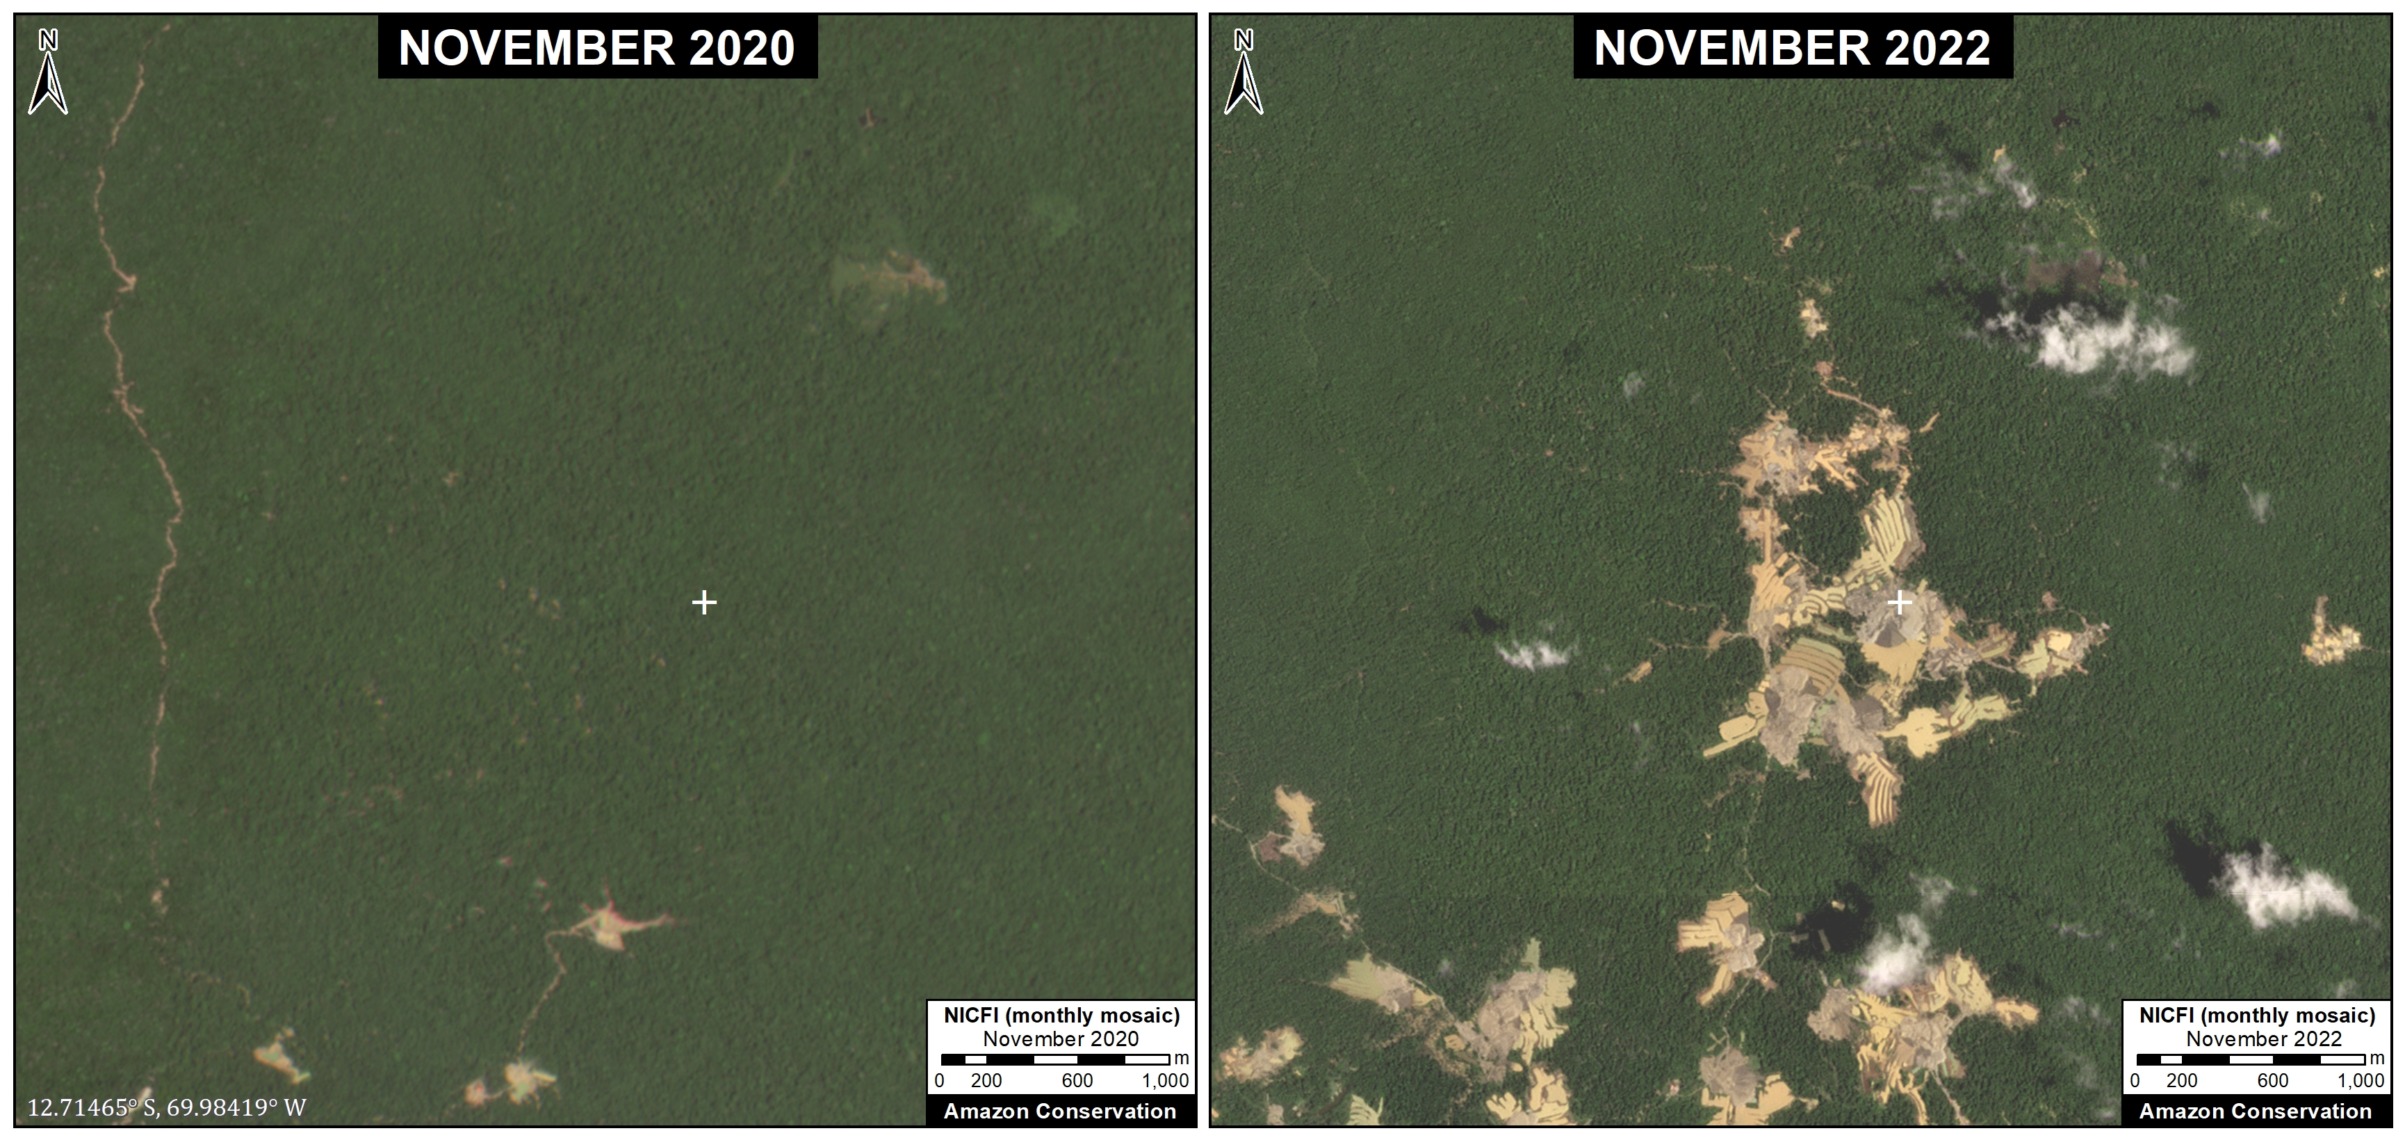
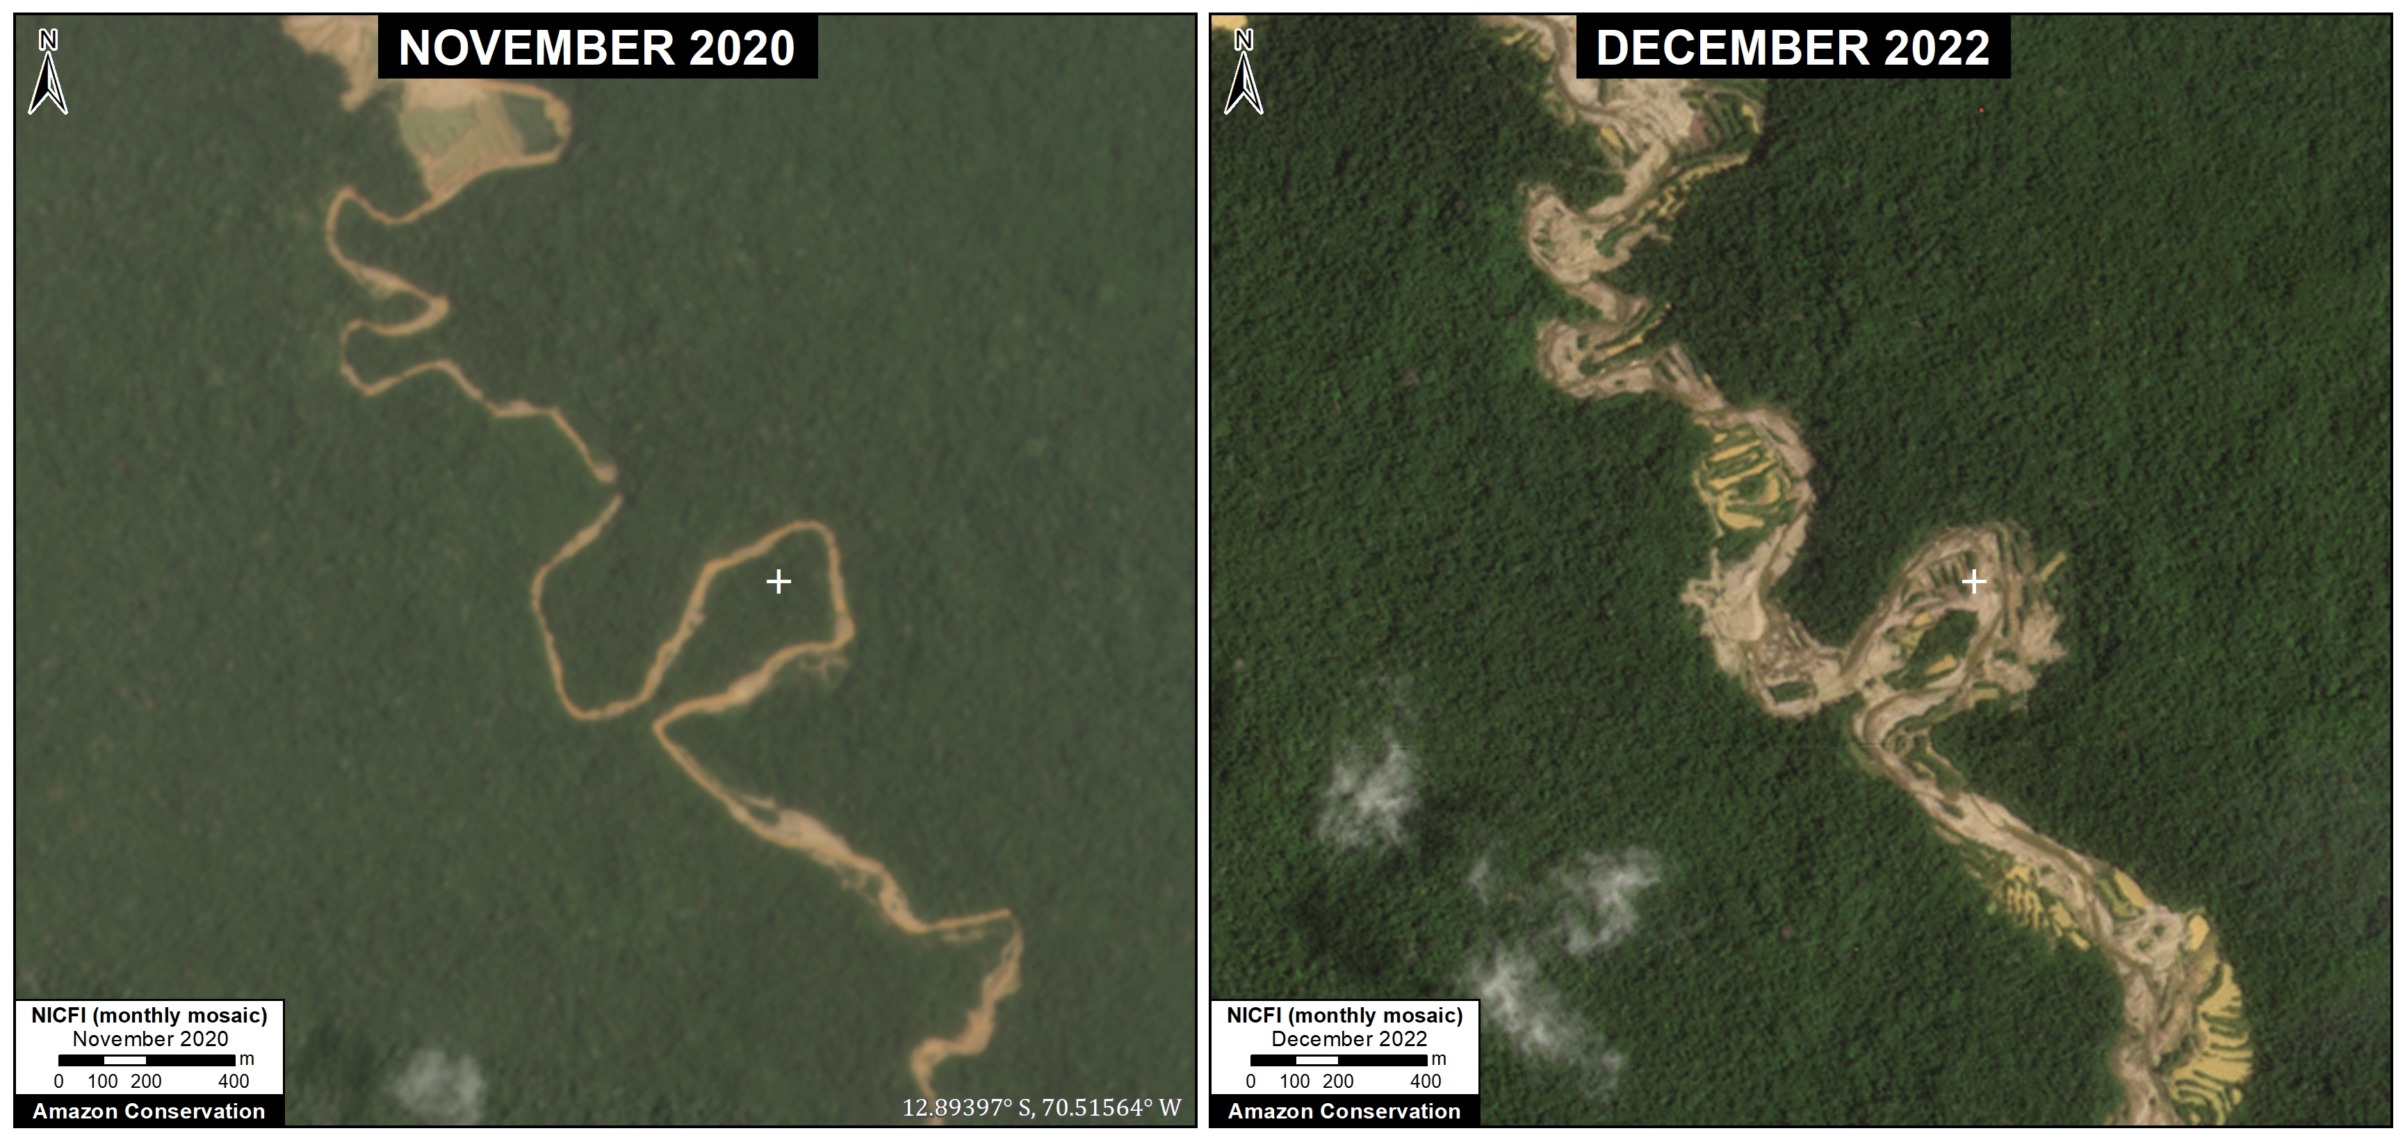
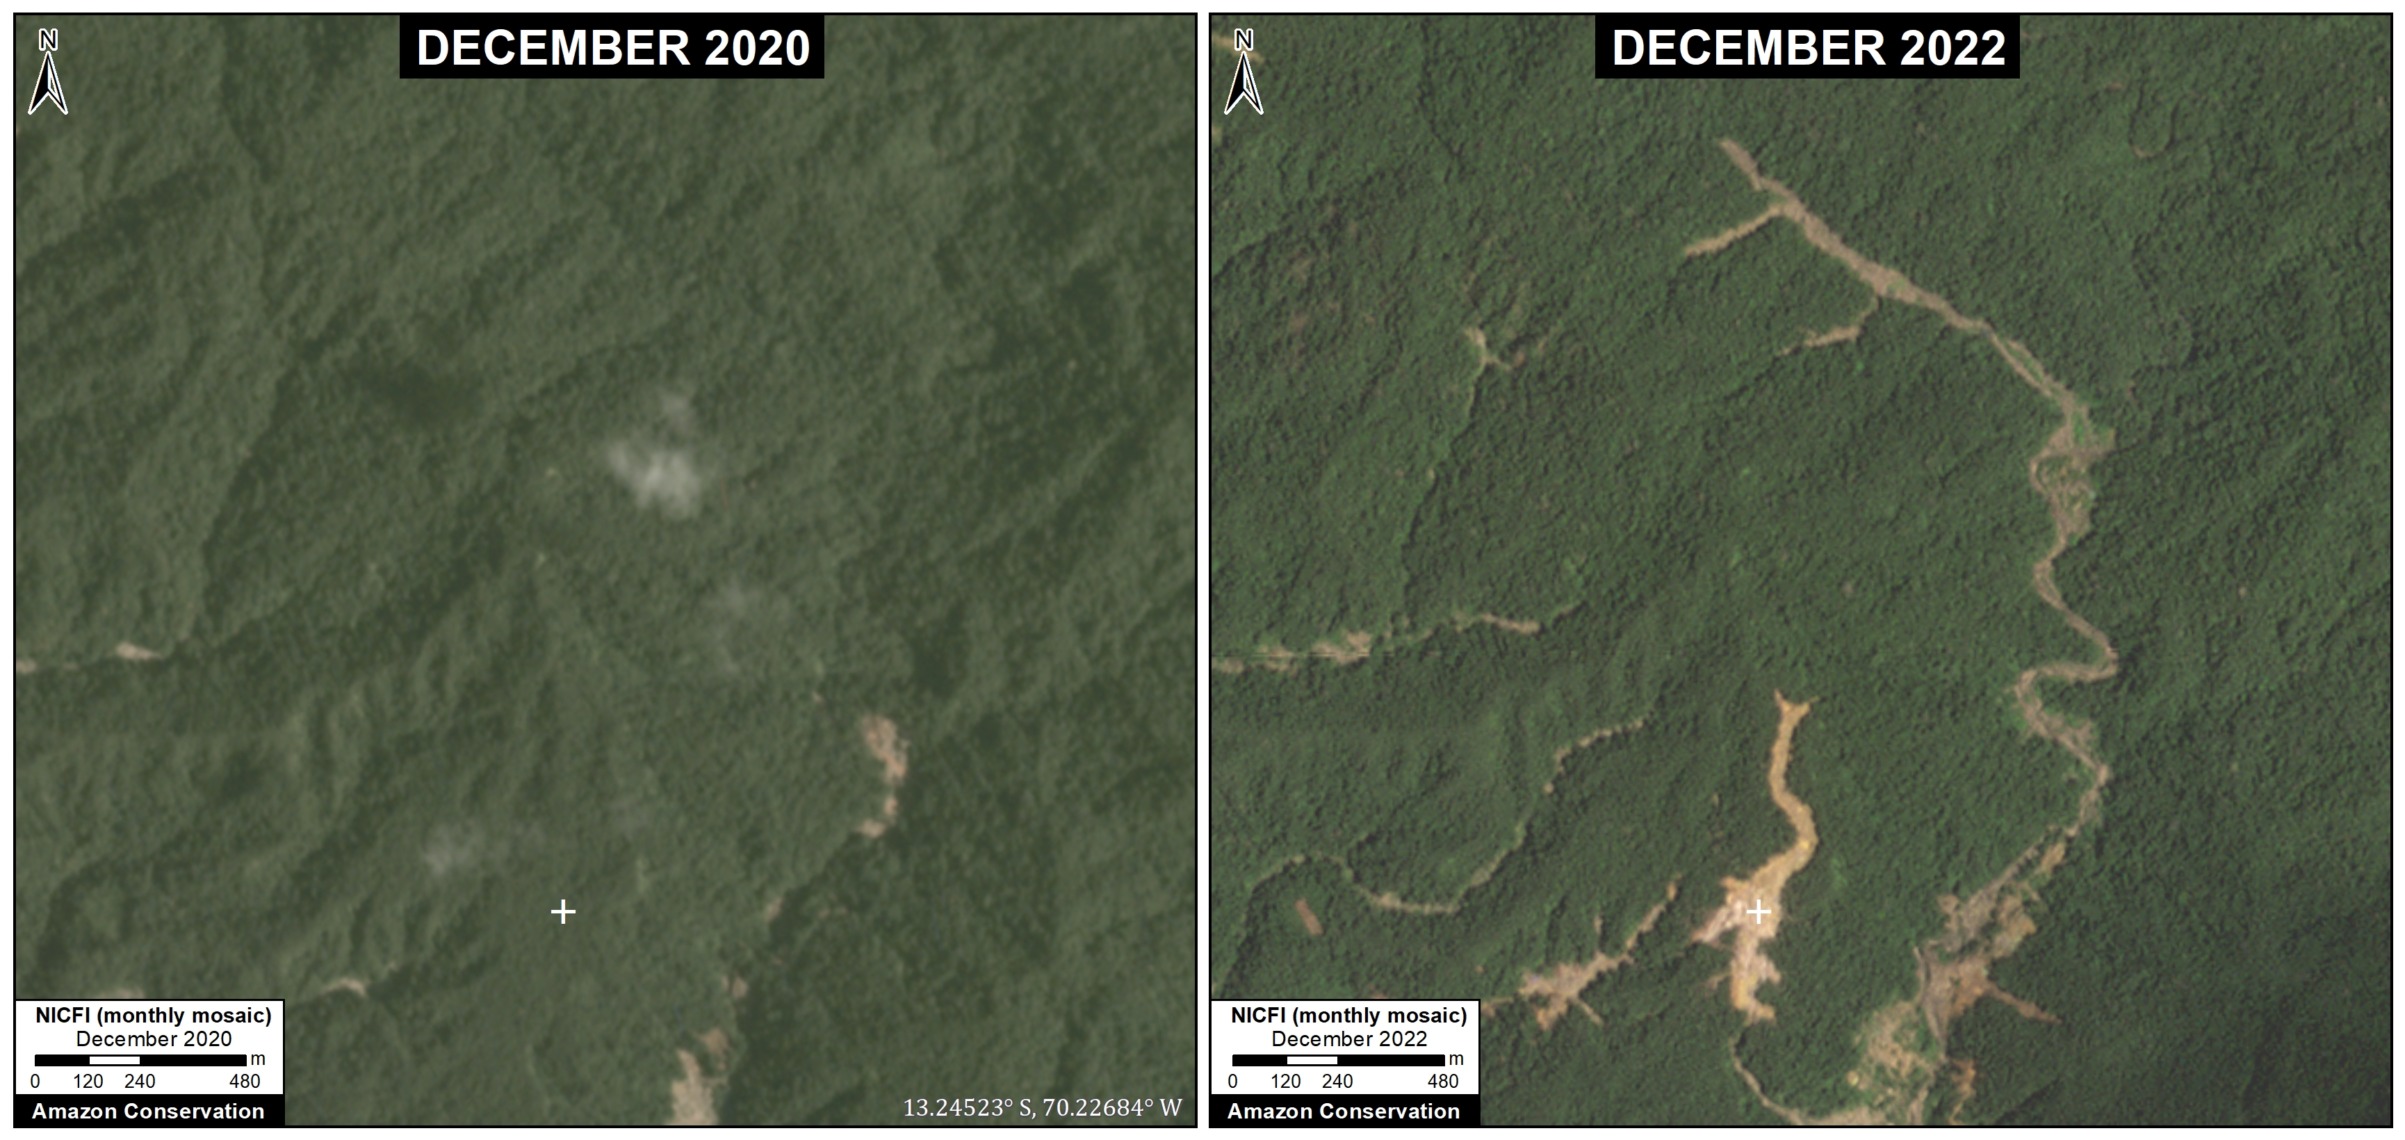
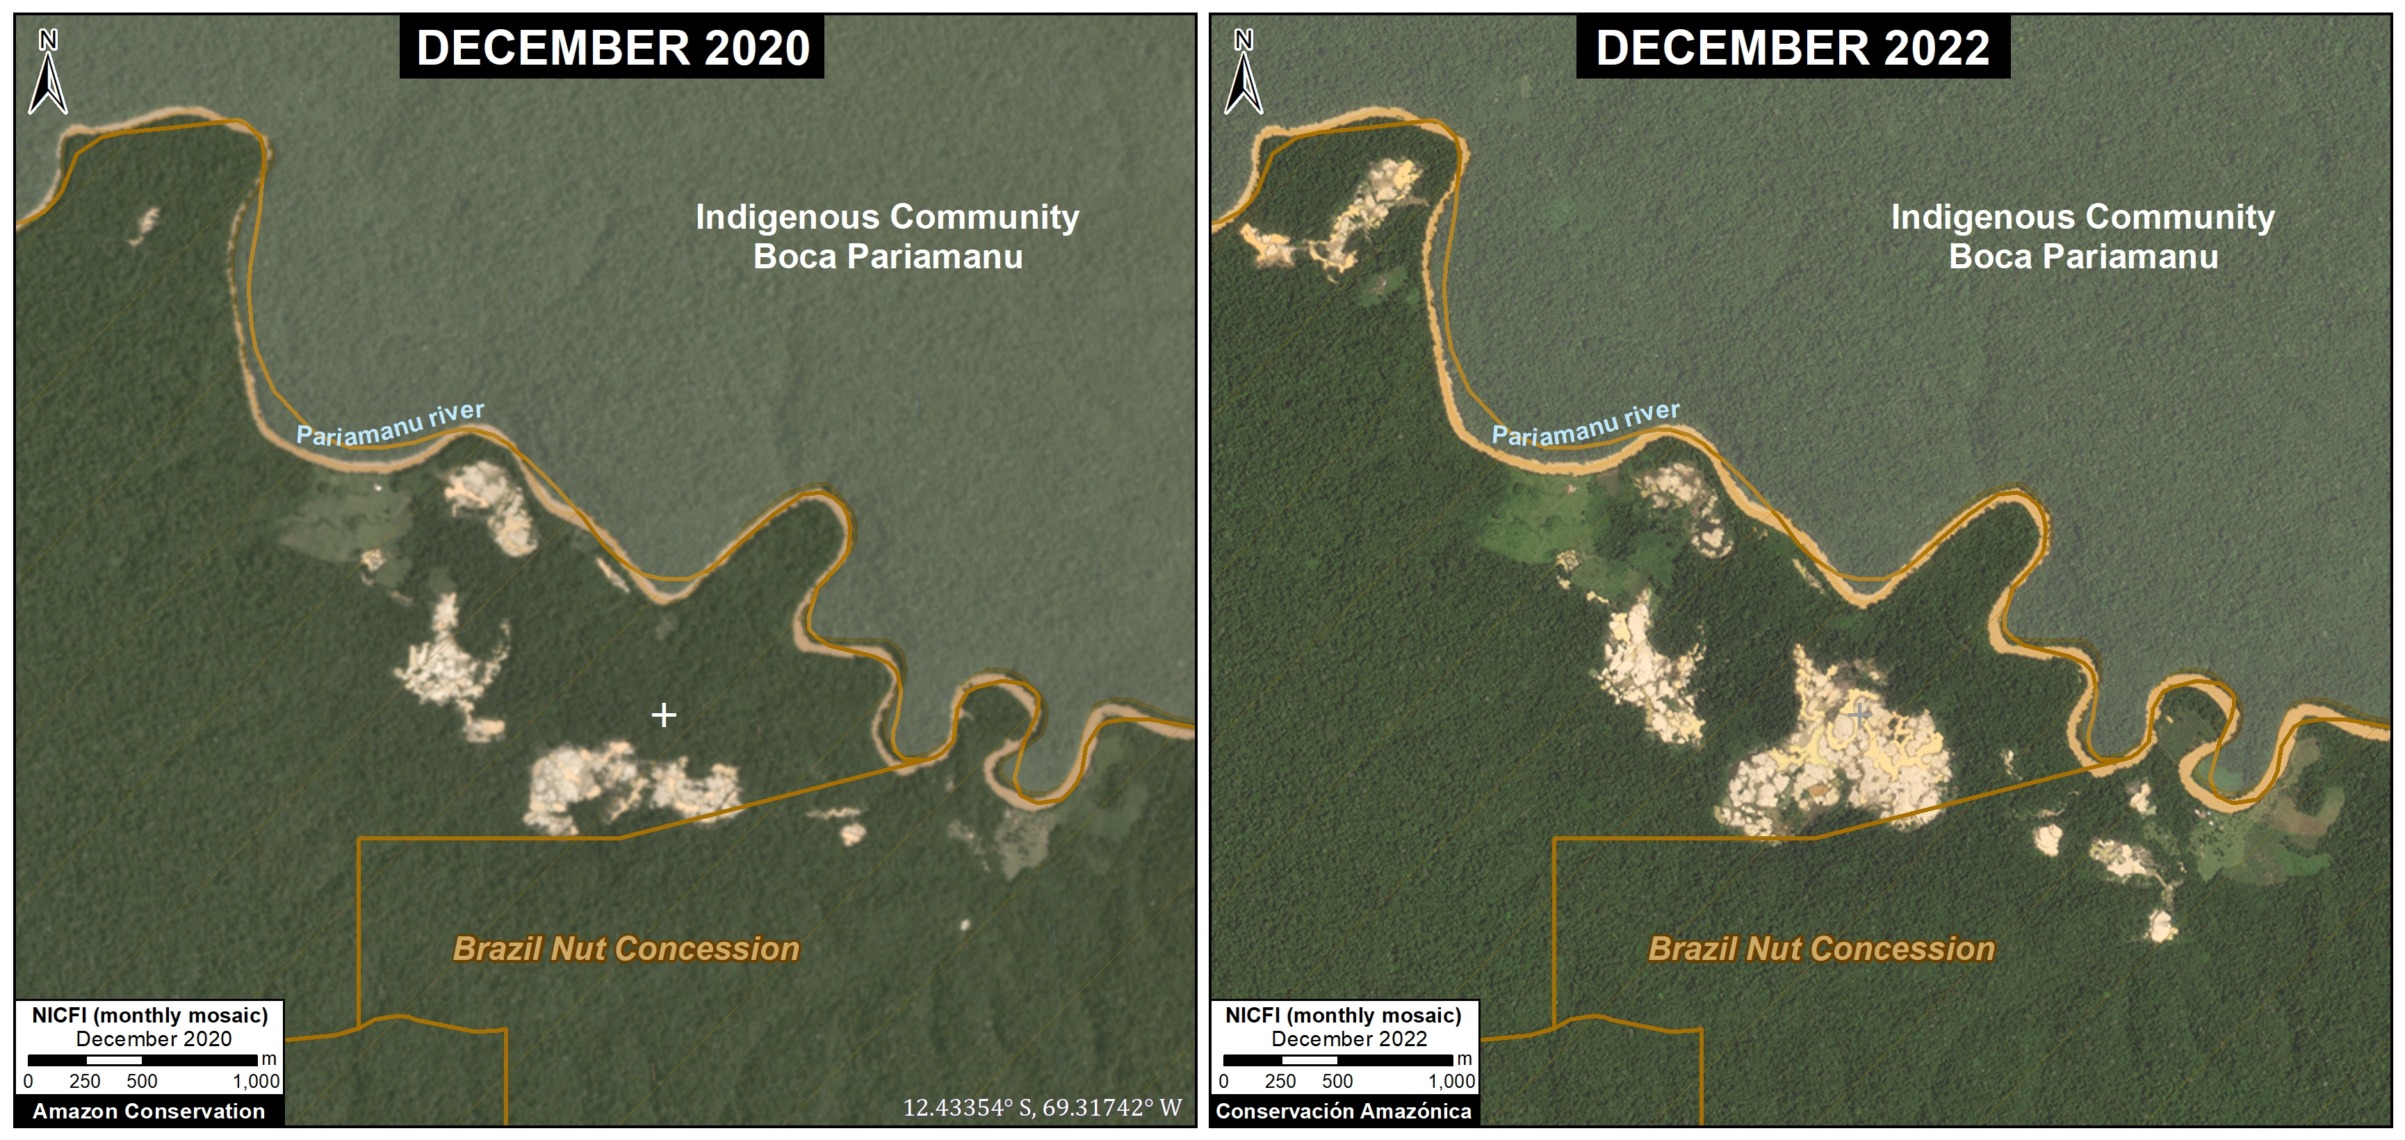
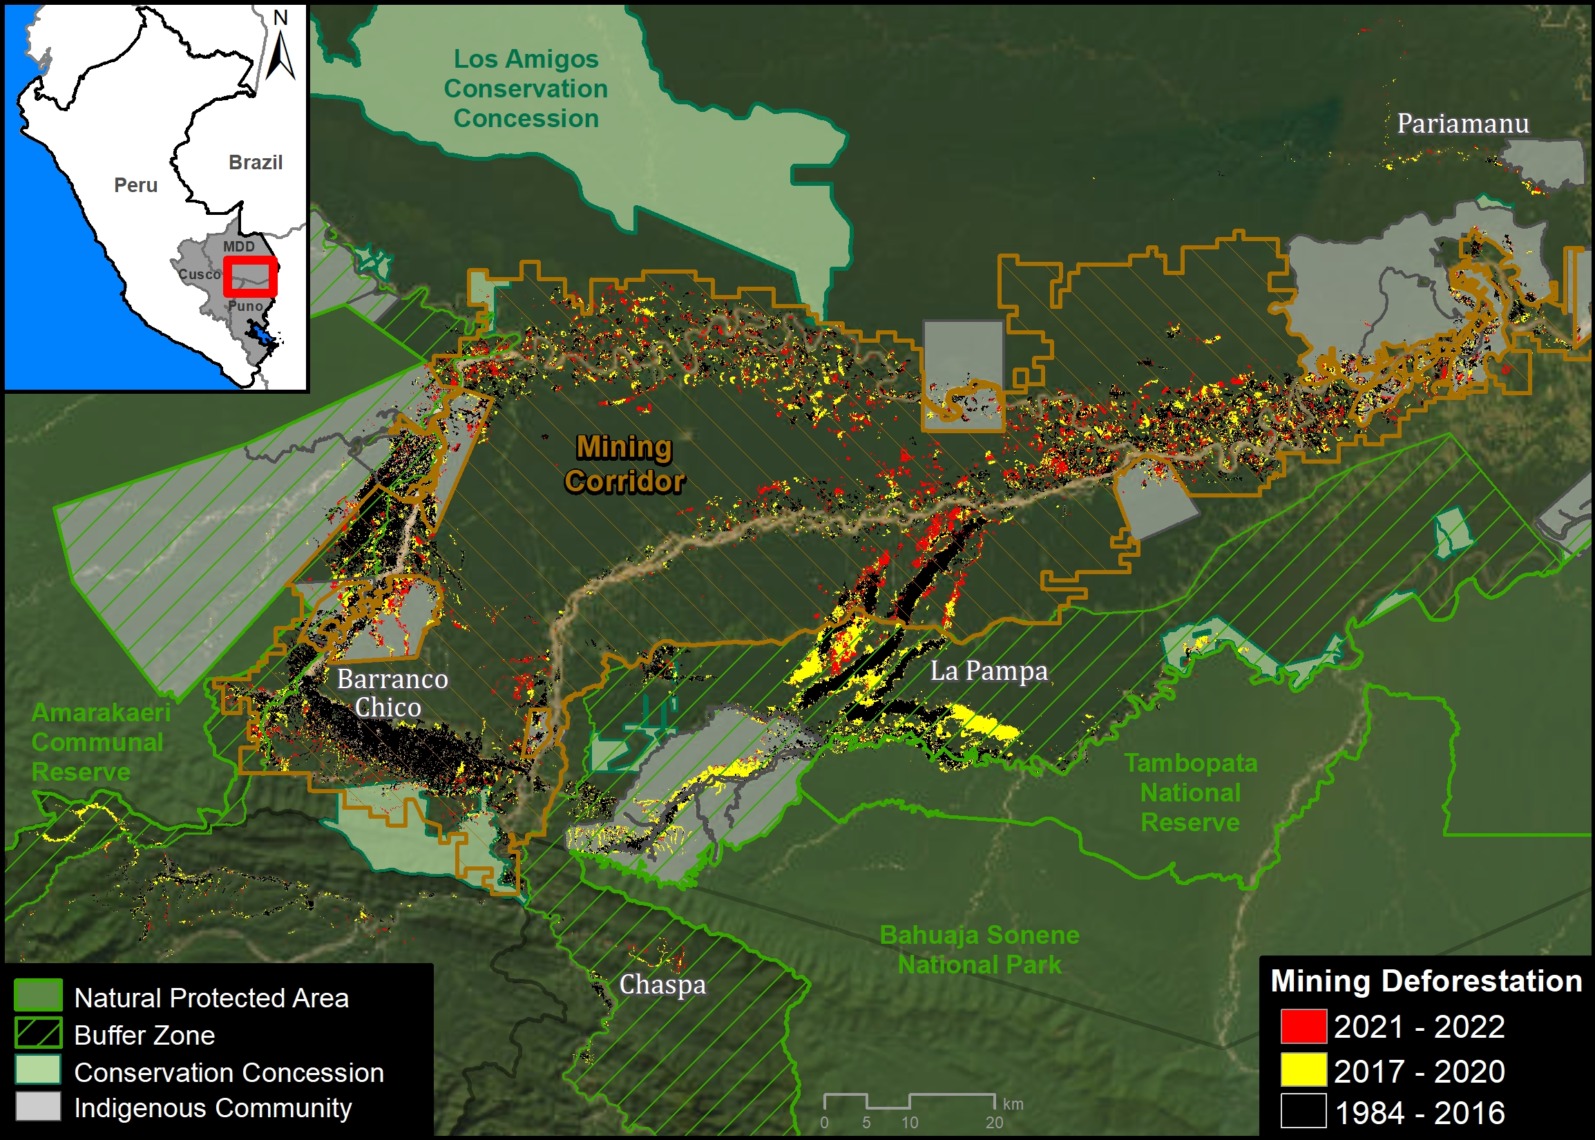
In the southern Amazon, gold mining deforestation continues to be a major cause of deforestation, primarily in indigenous communities, protected area buffer zones, and within the official Mining Corridor (MAAP #185). Most recently, we showed that gold mining has caused the deforestation on nearly 24,000 hectares between just 2021 and 2023 (MAAP #195).
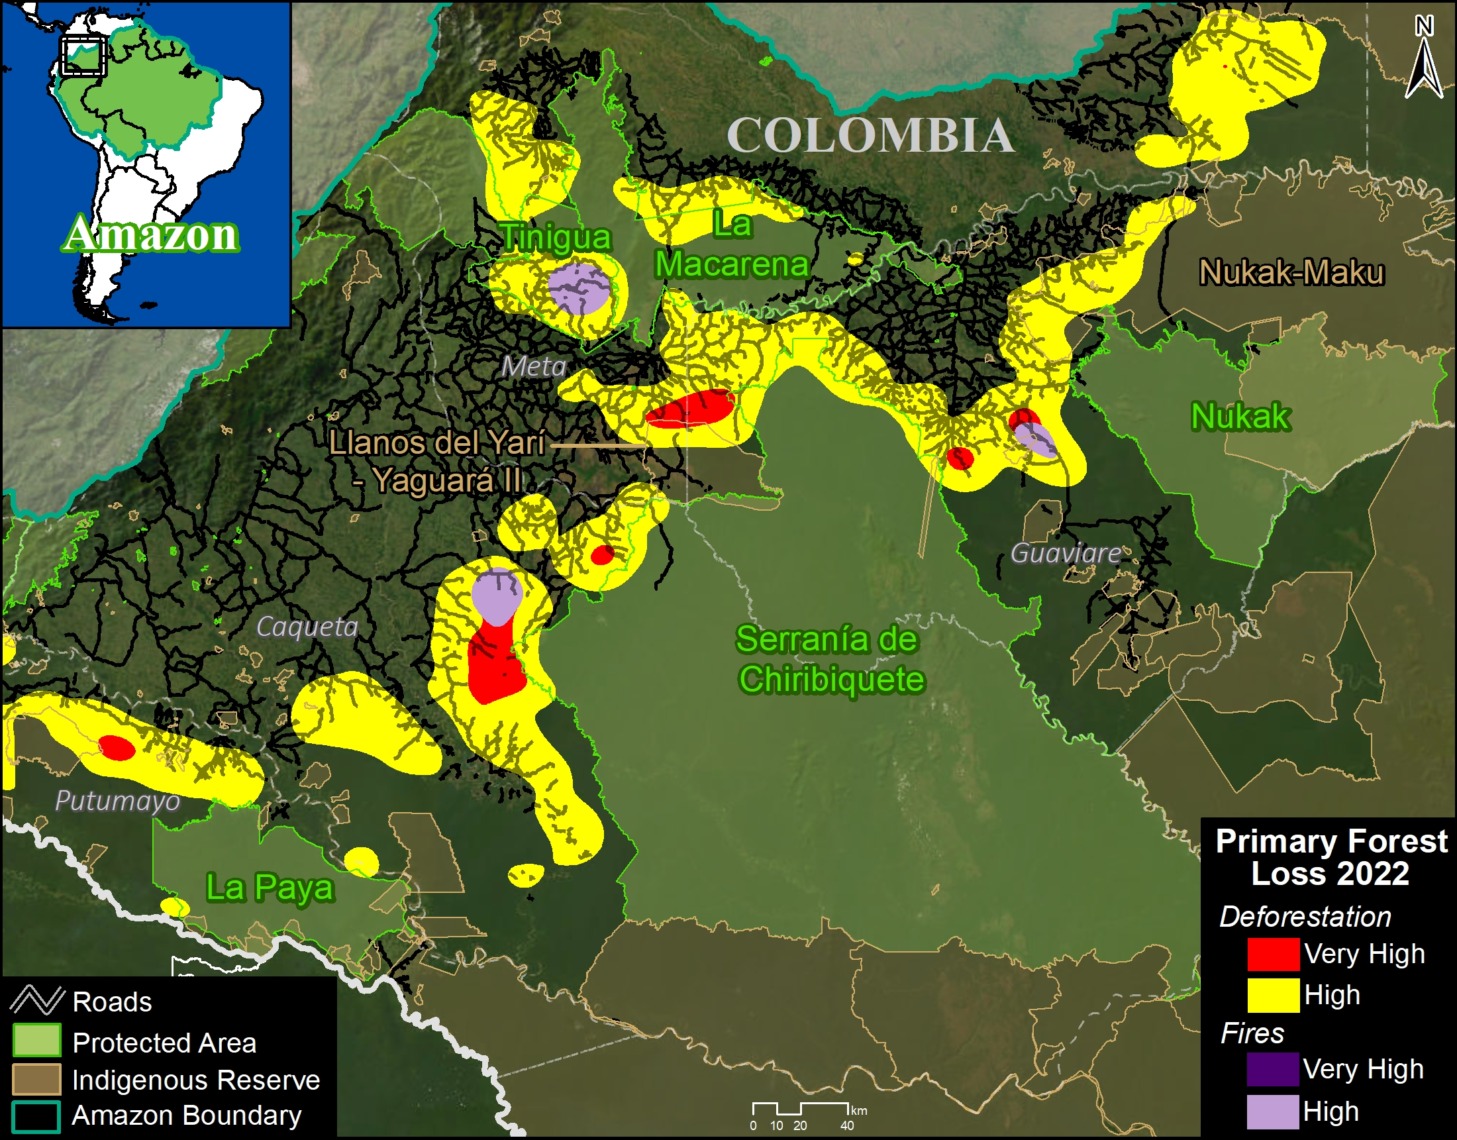
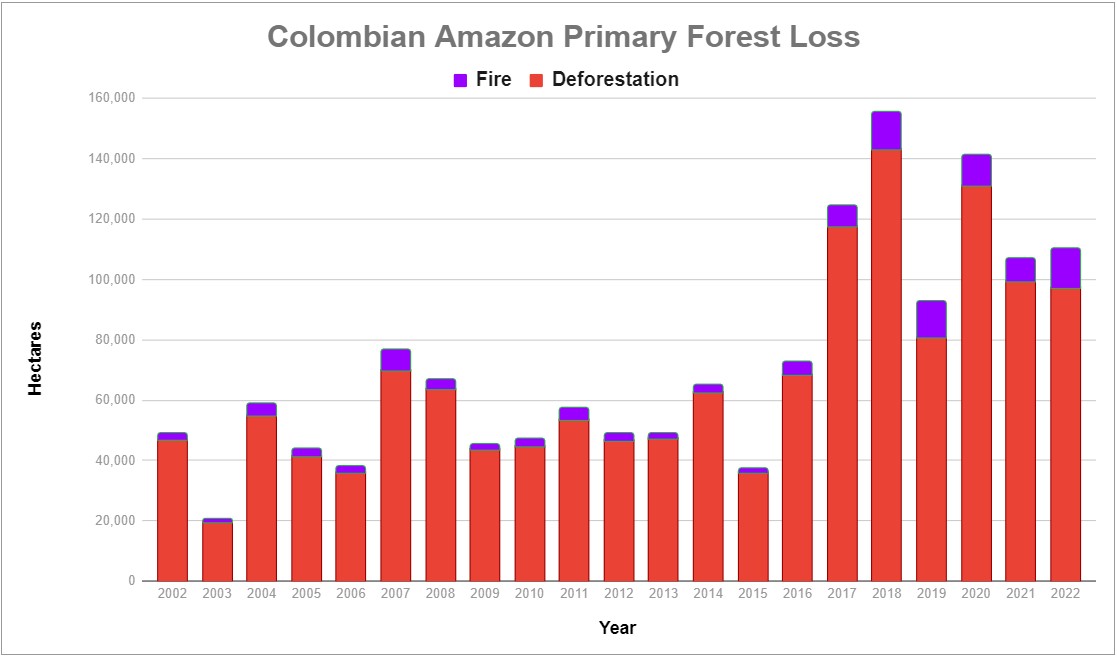
Colombian Amazon

Colombia is the fourth-leading source of Amazonian deforestation.
Deforestation in Colombia spiked following the 2016 peace agreement between the Colombian government and the FARC guerilla group (MAAP #120), but was the only country with a notable deforestation decrease in 2022 (MAAP #187).
Forest loss is concentrated in an “arc of deforestation” surrounding numerous Protected Areas (such as Chiribiquete, Tinigua, and Macarena National Parks) and Indigenous Reserves.
In Colombia, the major direct deforestation driver is cattle pasture, but this expansion is largely caused by land grabbing as a critical indirect driver. Coca plantations also continue to be an important direct driver in certain remote areas.
Both cattle and coca are impacting protected areas, especially Tinigua and Chiribiquete National Parks (cattle); and Macrarena National Park and Nukak National Nature Reserve (coca).
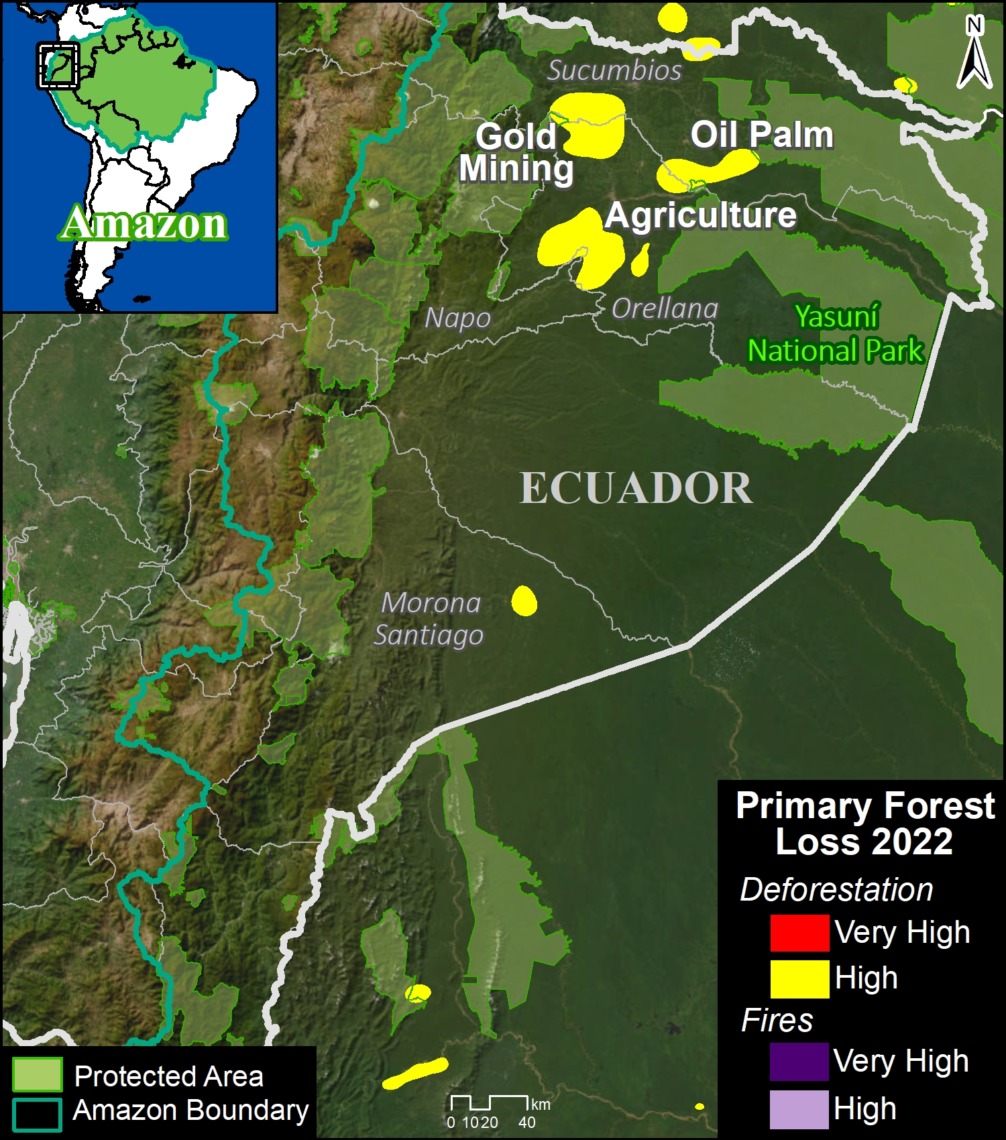
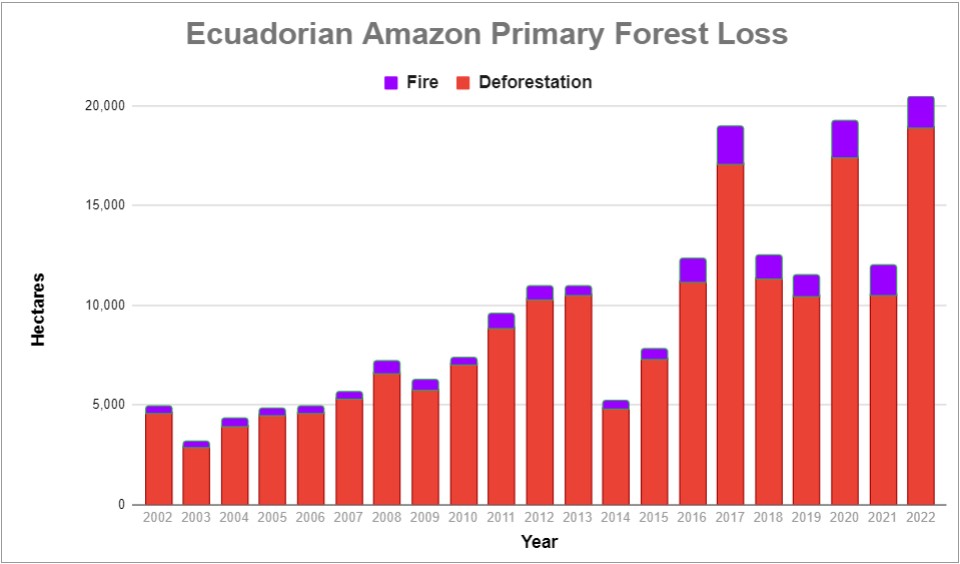
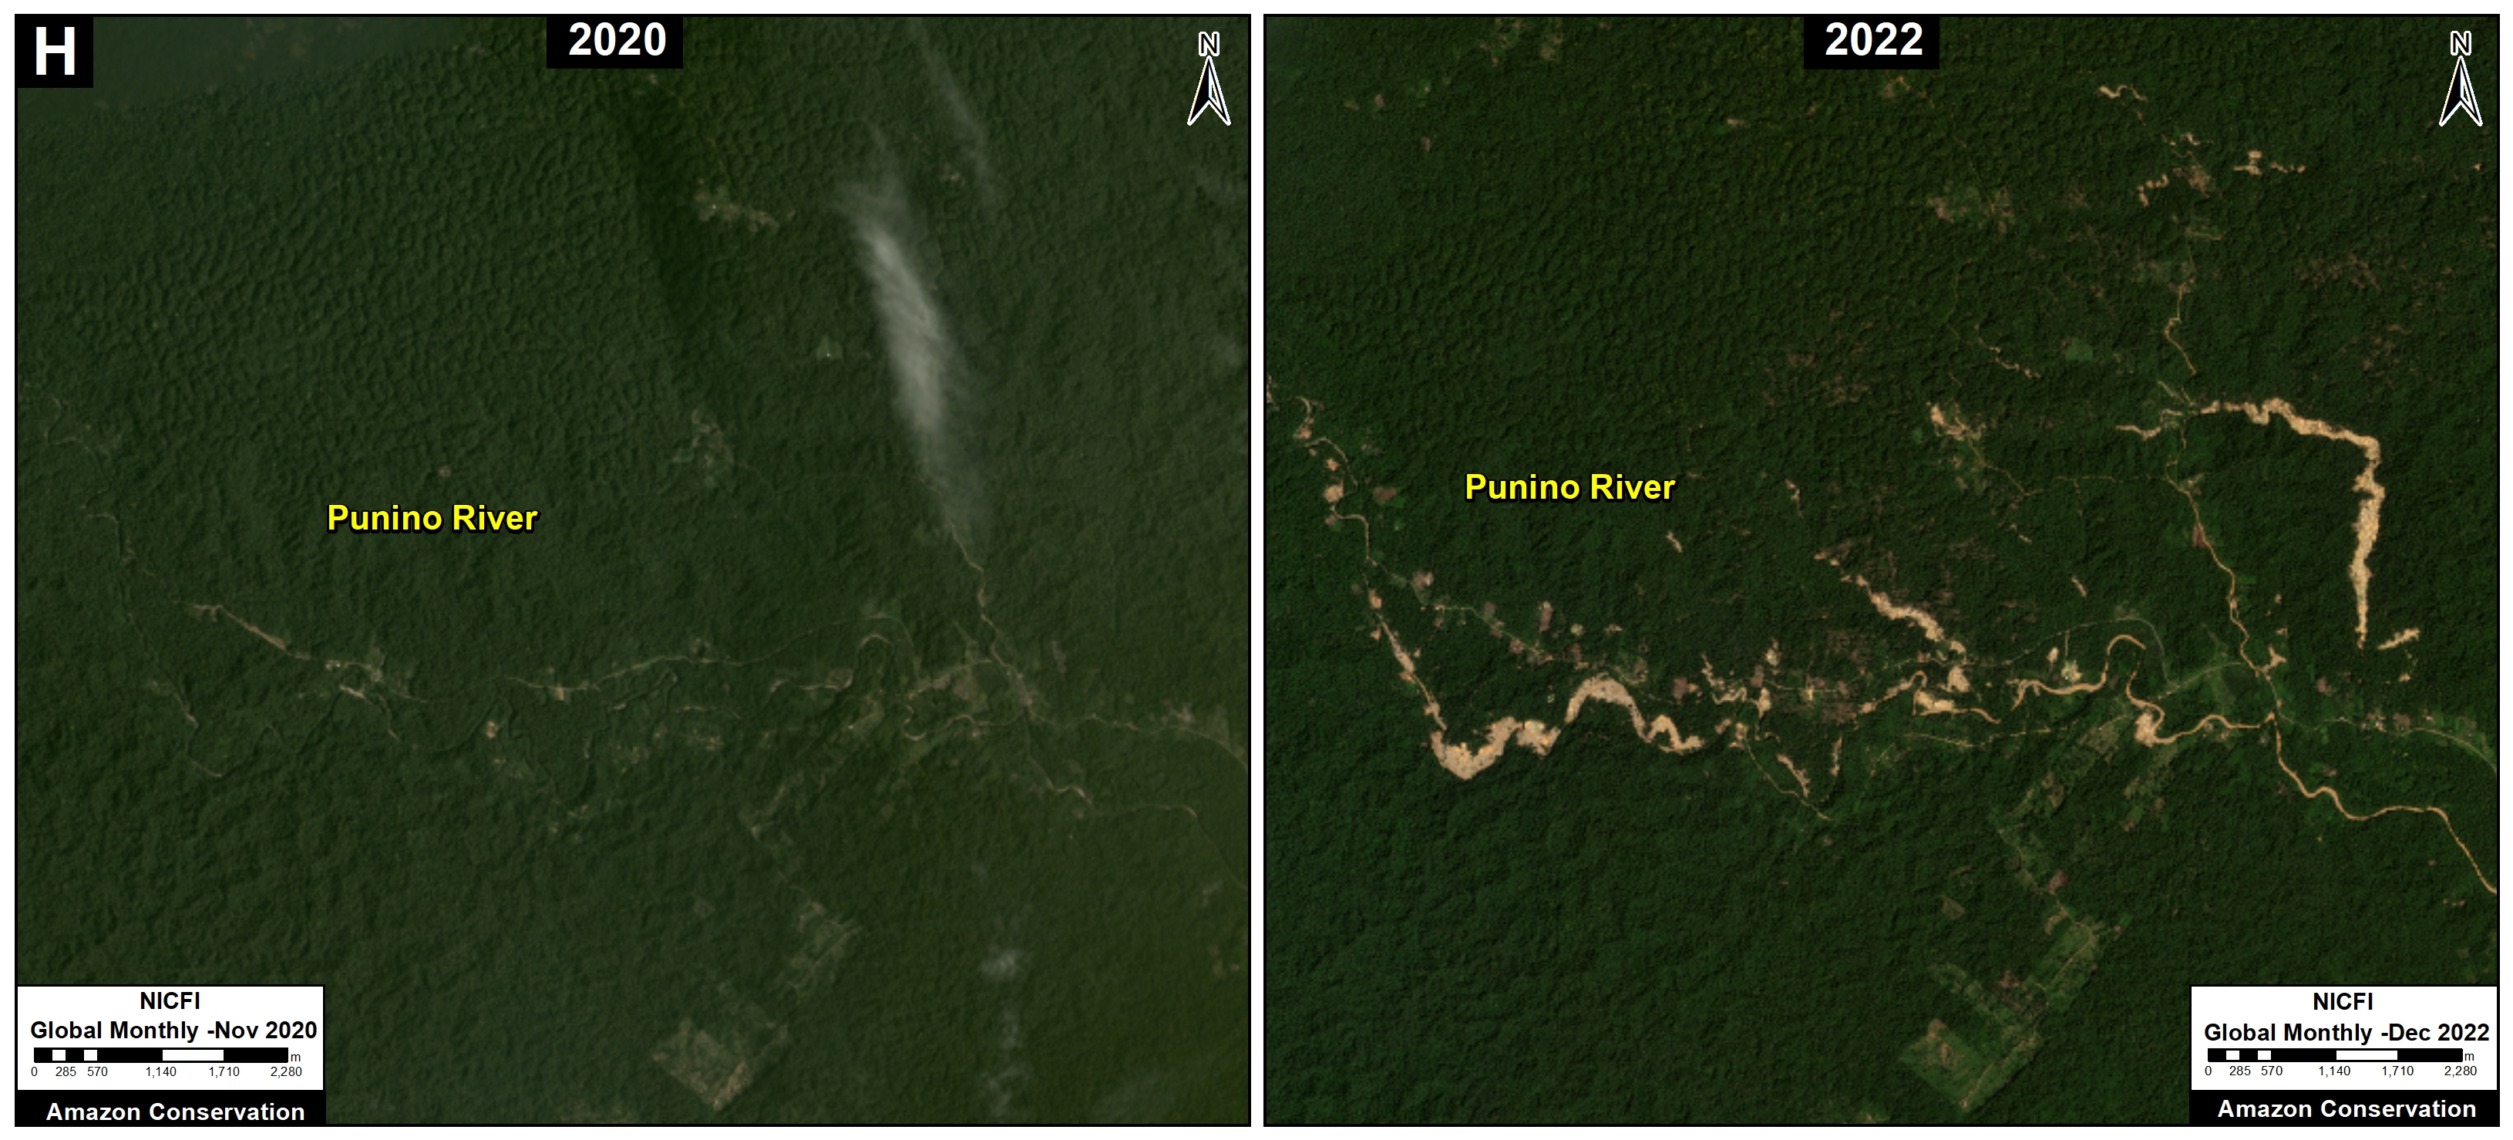
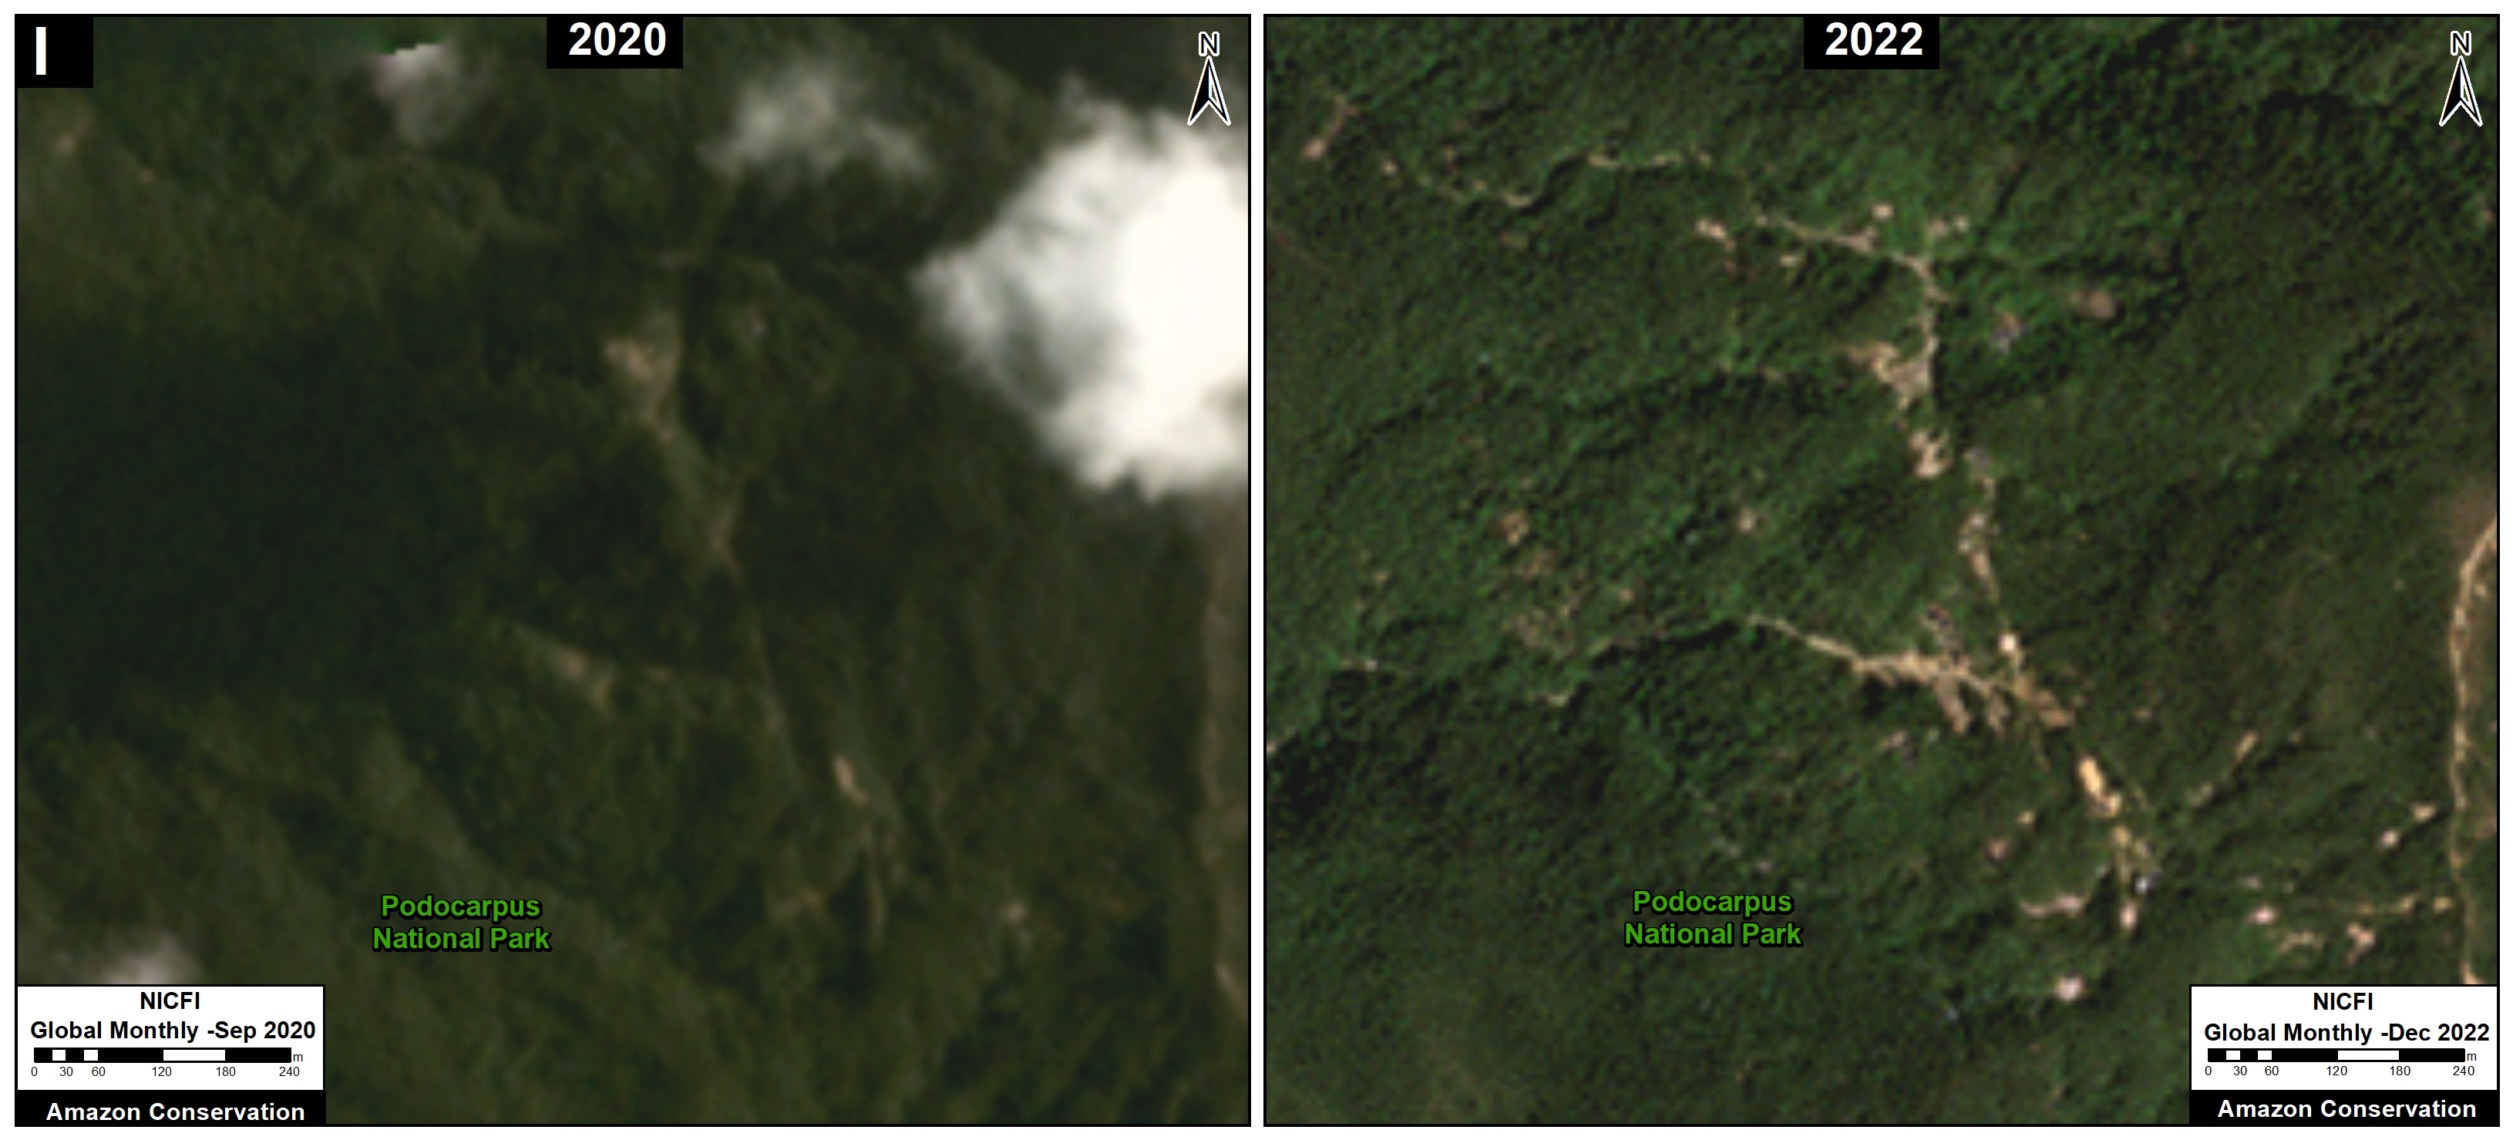
Ecuadorian Amazon

Although accounting for just 1% of total loss across the Amazon, deforestation in the Ecuadorian Amazon was the highest on record in 2022 (18,902 hectares), up a striking 80% since 2021.
There are several deforestation hotspots caused by gold mining (see MAAP #182), oil palm plantation expansion, and small-scale agriculture.
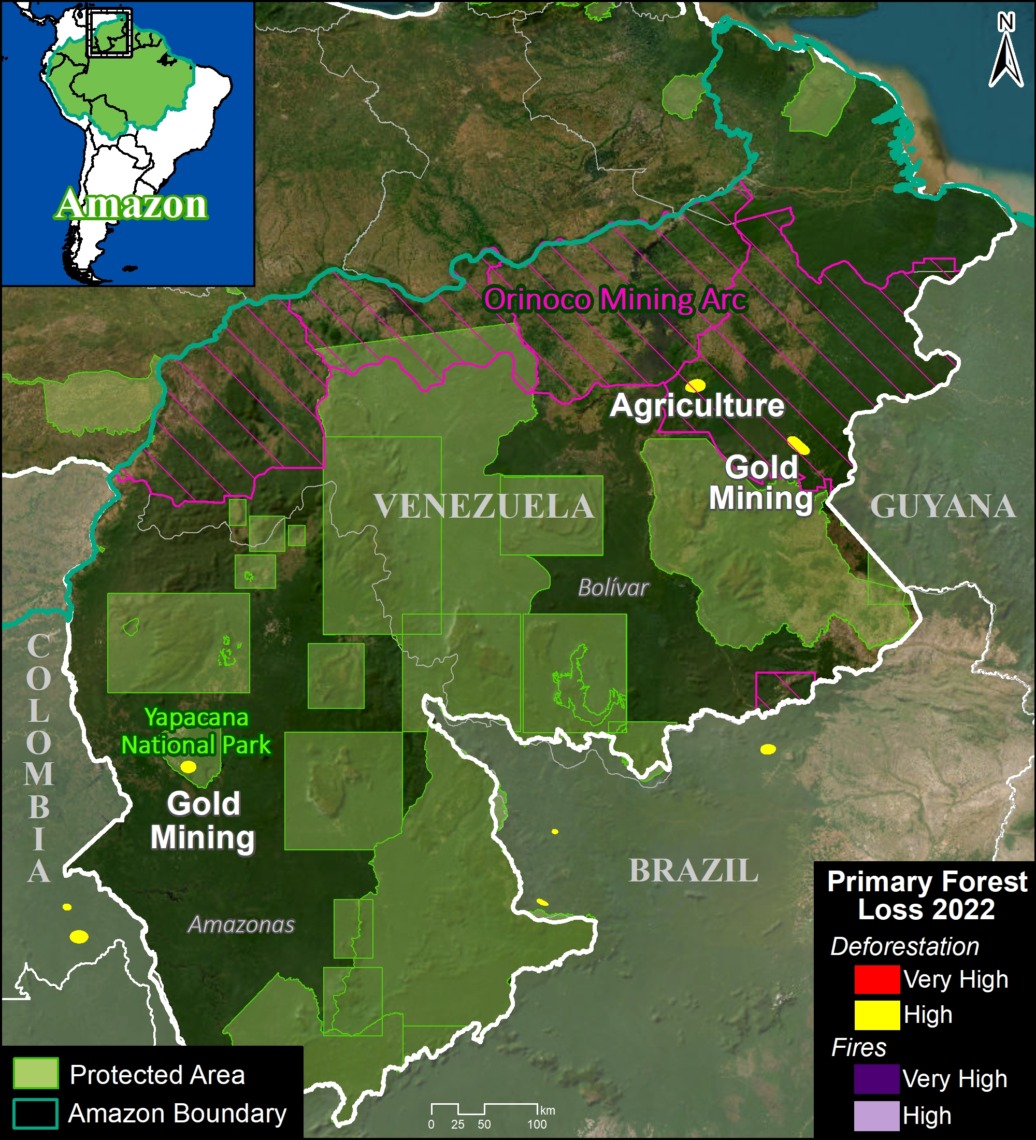
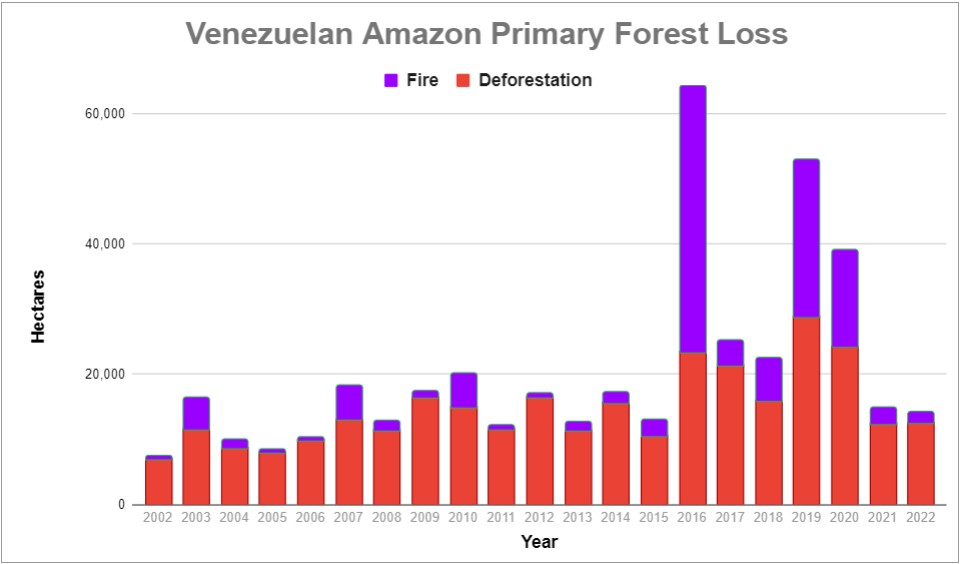
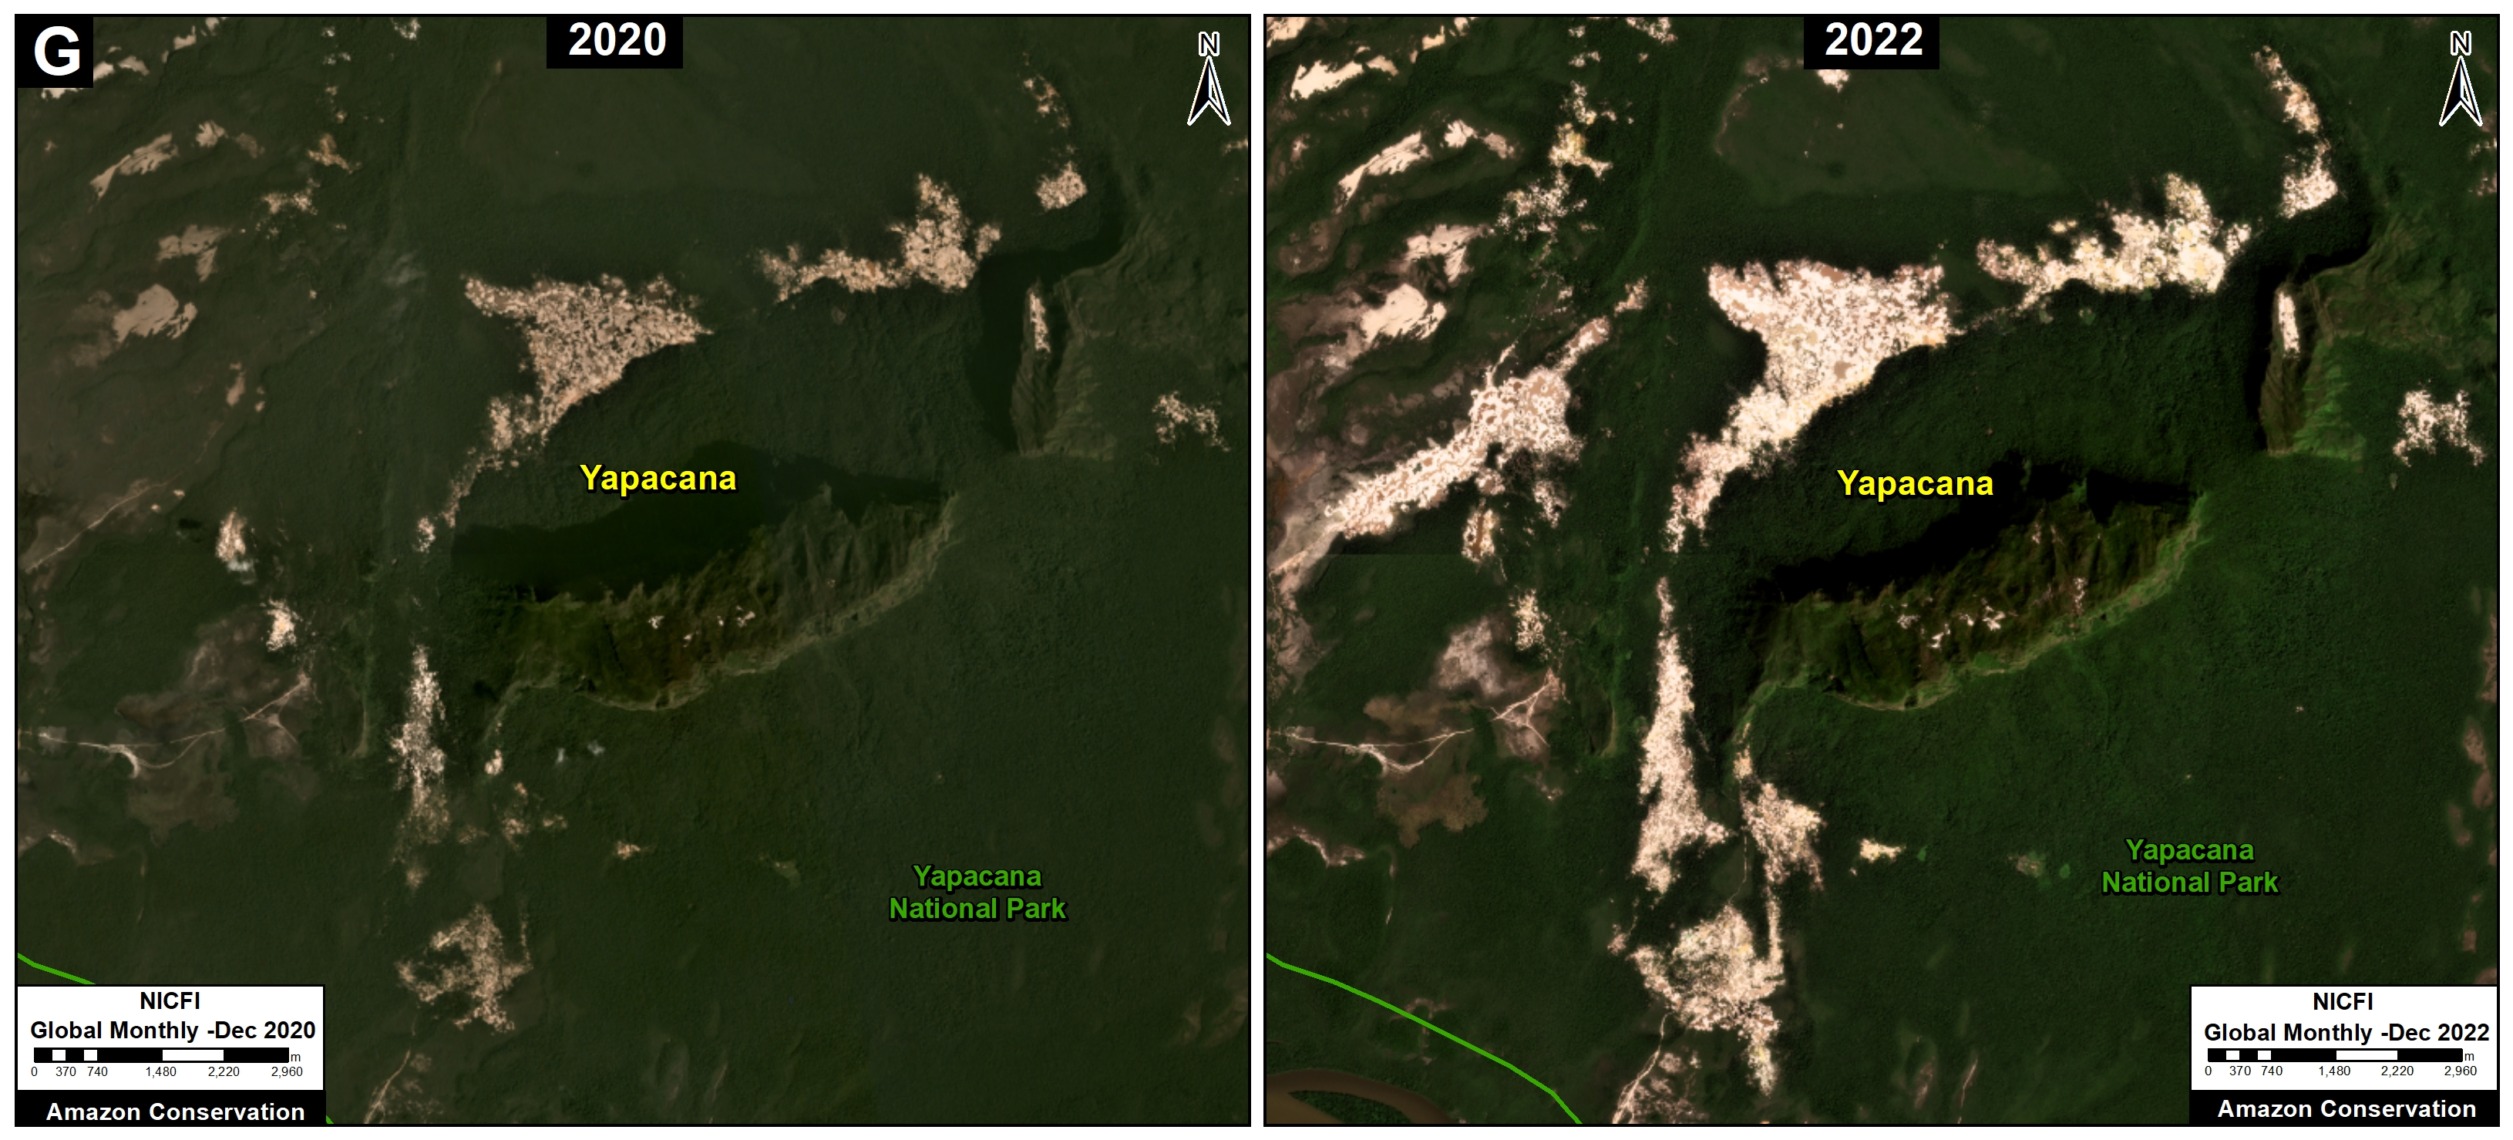
Venezuelan Amazon
There is a deforestation hotspot caused by gold mining in Yapacana National Park (see MAAP #173, MAAP #156, MAAP #169).
Annex: Amazon Primary Forest Loss (By Country), 2021-2022

Acknowledgments
We deeply thank the following funders for supporting MAAP over the past 10 years:
International Conservation Fund of Canada (ICFC)
Norwegian Agency for Development Cooperation (NORAD)
United States Agency for International Development (USAID)
MacArthur Foundation
Andes Amazon Fund (AAF)
Wyss Foundation
Erol Foundation
Global Forest Watch/World Resources Institute
Overbrook Foundation
Global Conservation
We also thank our key data providers:
Planet (optical satellite imagery)
University of Maryland (automated forest loss alerts)
Global Forest Watch (portal featuring integrated forest loss alerts)
NICFI monthly mosaics
CLASlite (our original forest loss detection tool)
Citation
Finer M, Mamani N, Novoa S, Ariñez A (2023) State of the Amazon in 2023. MAAP: 200.