MAAP #26: Deforestation Hotspots in the Peruvian Amazon, 2015

Thanks to the newly launched GLAD alerts (developed by the University of Maryland and Google1, and presented by Global Forest Watch), we now have weekly access to high-resolution forest loss data across Peru. Here in MAAP #26, we analyze the first batch of this data to better understand deforestation patterns in the Peruvian Amazon in 2015. In the coming weeks and months, we will use this map as a base for investigating major hotspots of forest loss in the country.

Kernell_2015a_v1_en
Image 26a. Kernel density map for forest loss in the Peruvian Amazon in 2015. Data: Hansen et al 2016 (ERL).

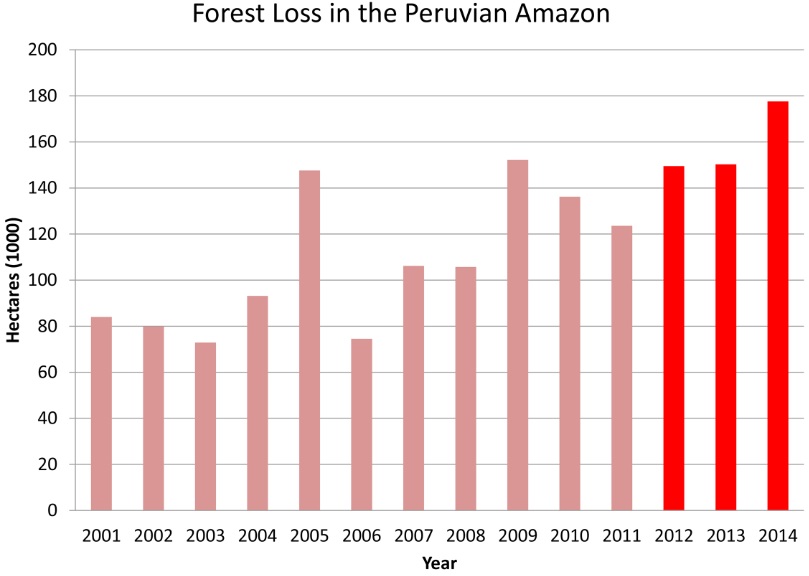
According to the GLAD alert data, total estimated forest loss in Peru in 2015 was 158,658 hectares (392,050 acres). If confirmed, that represents the second highest total on record, behind only 2014 (177,500 hectares).

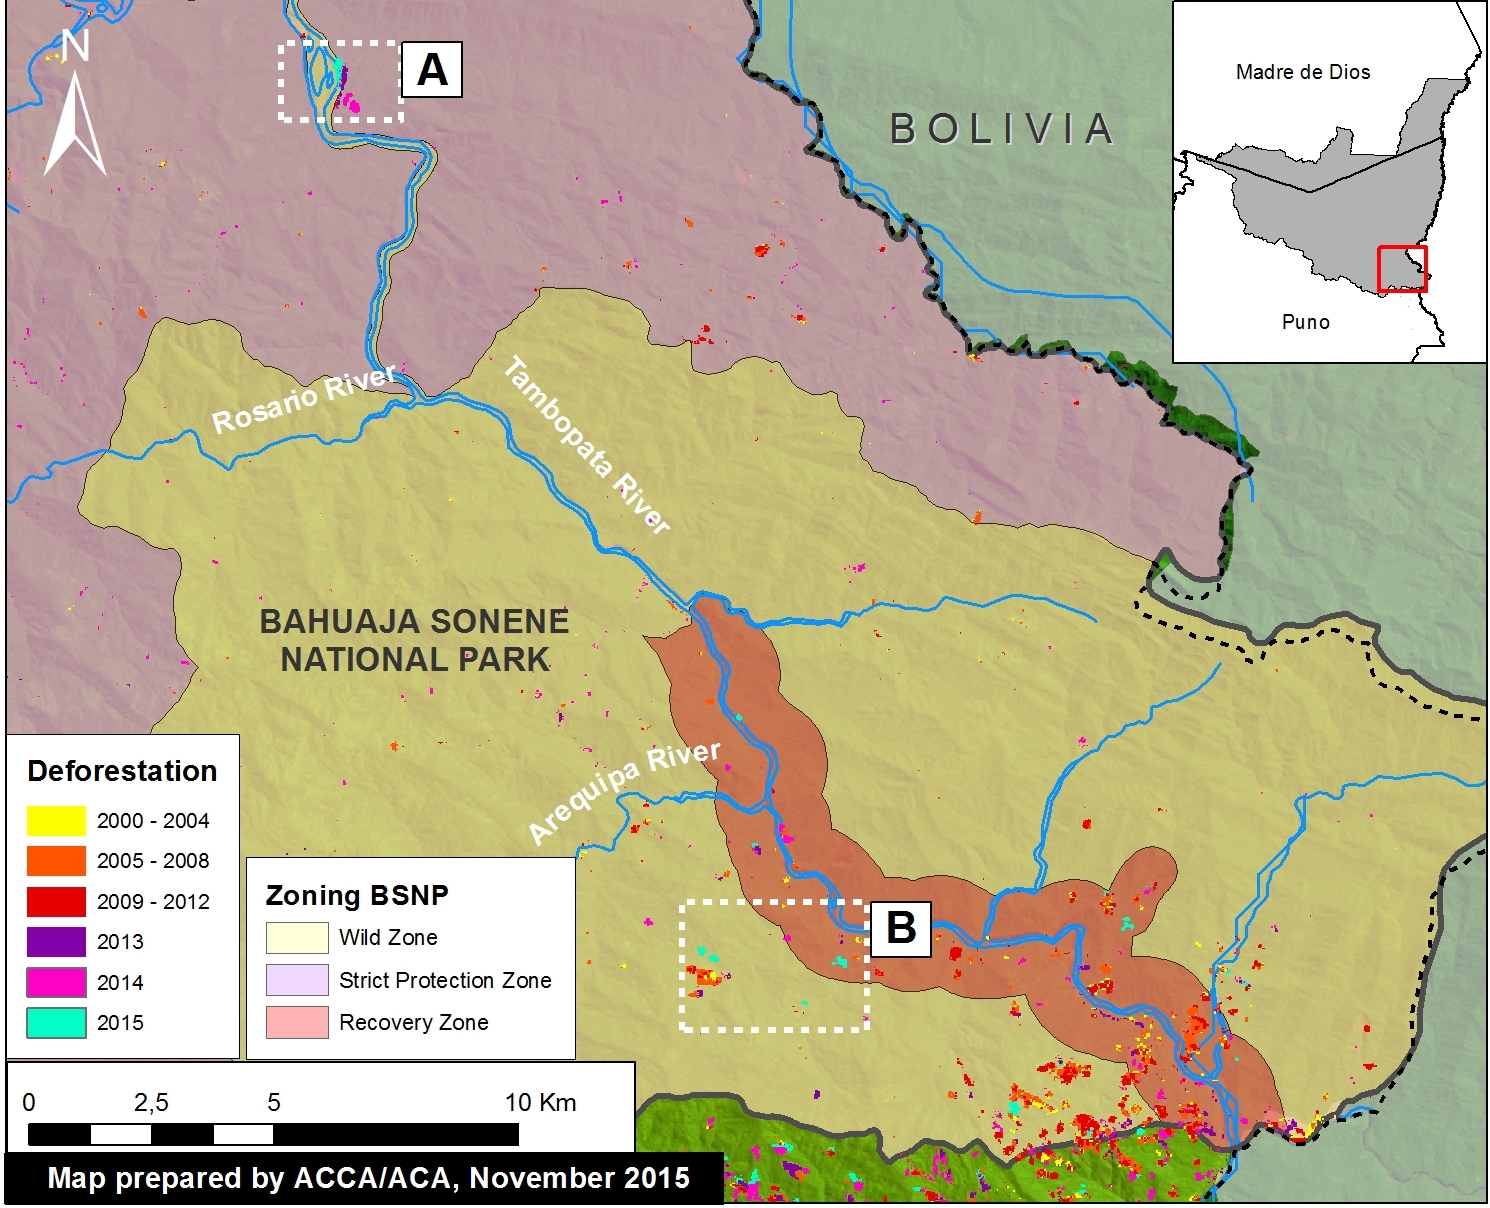
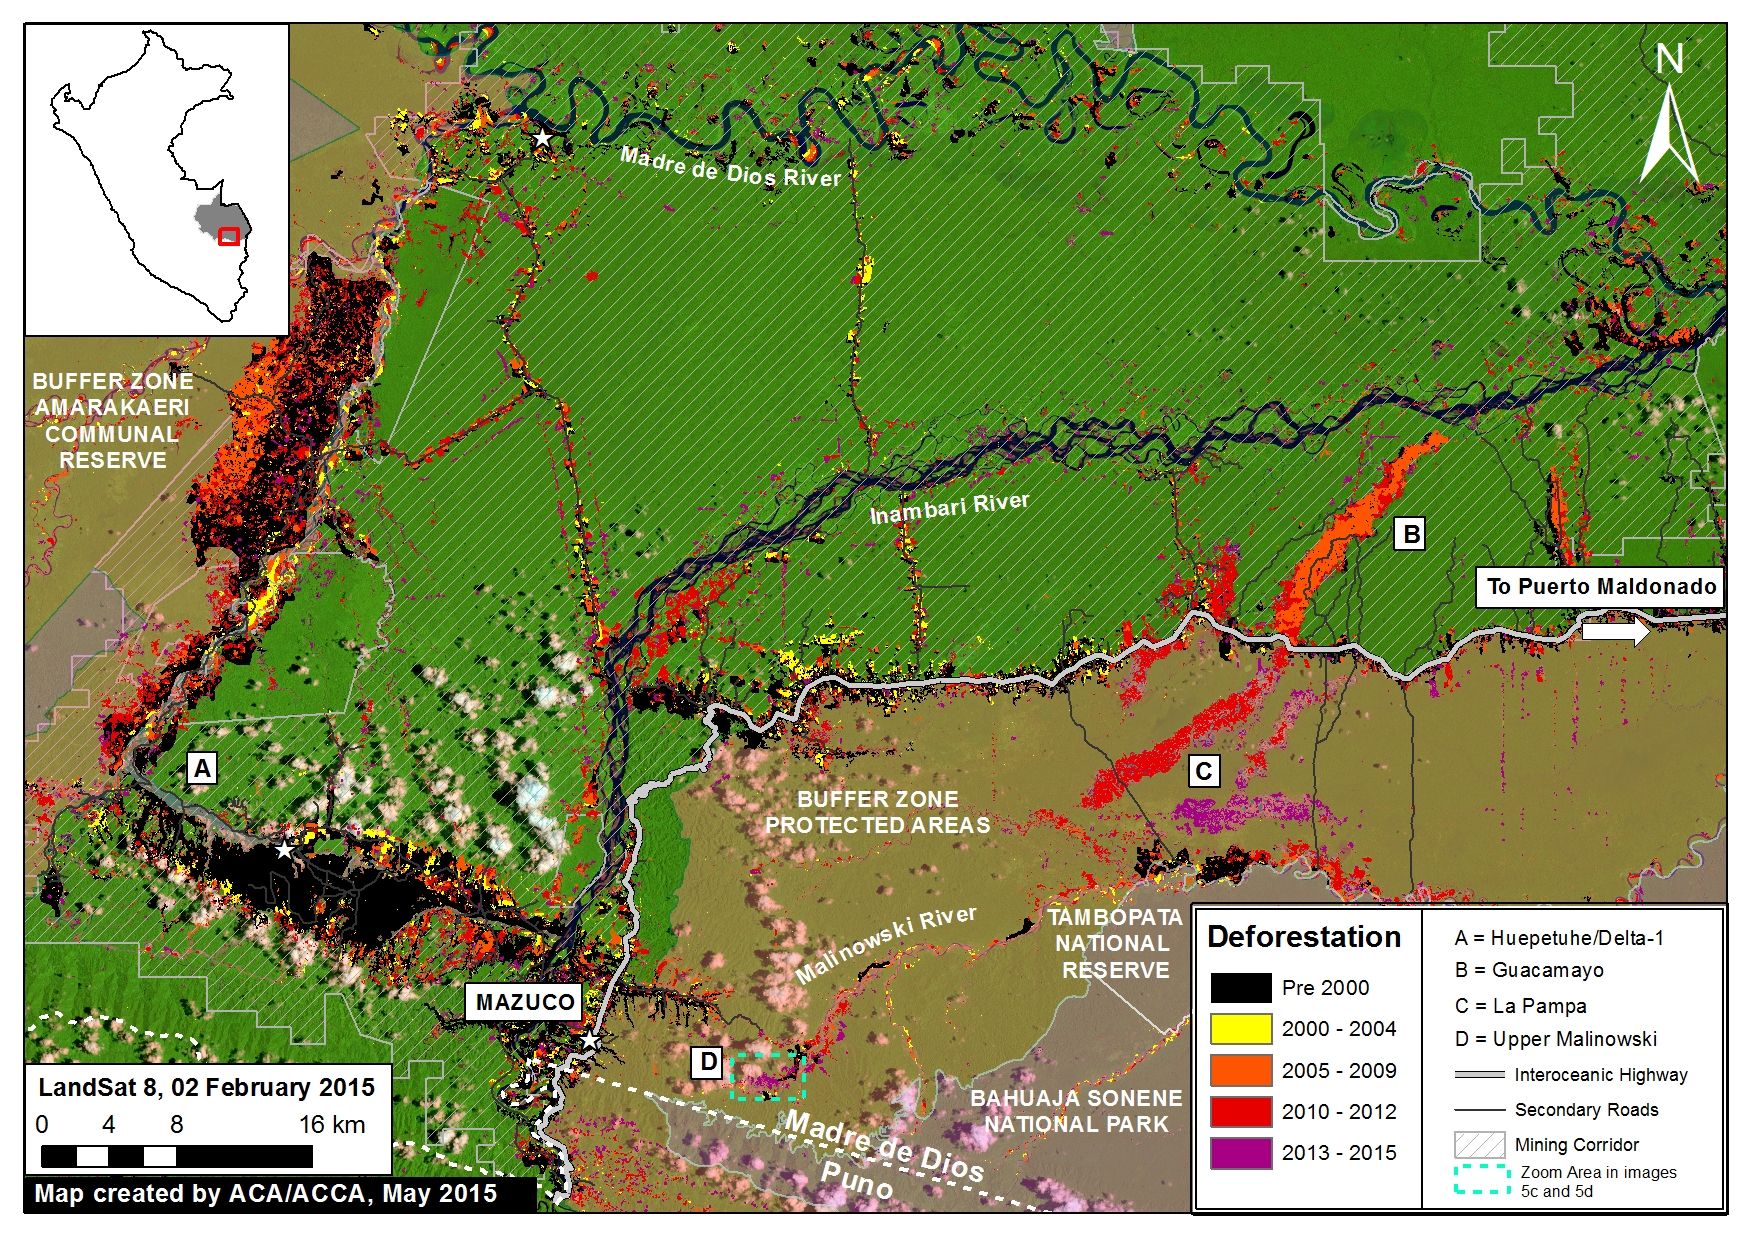
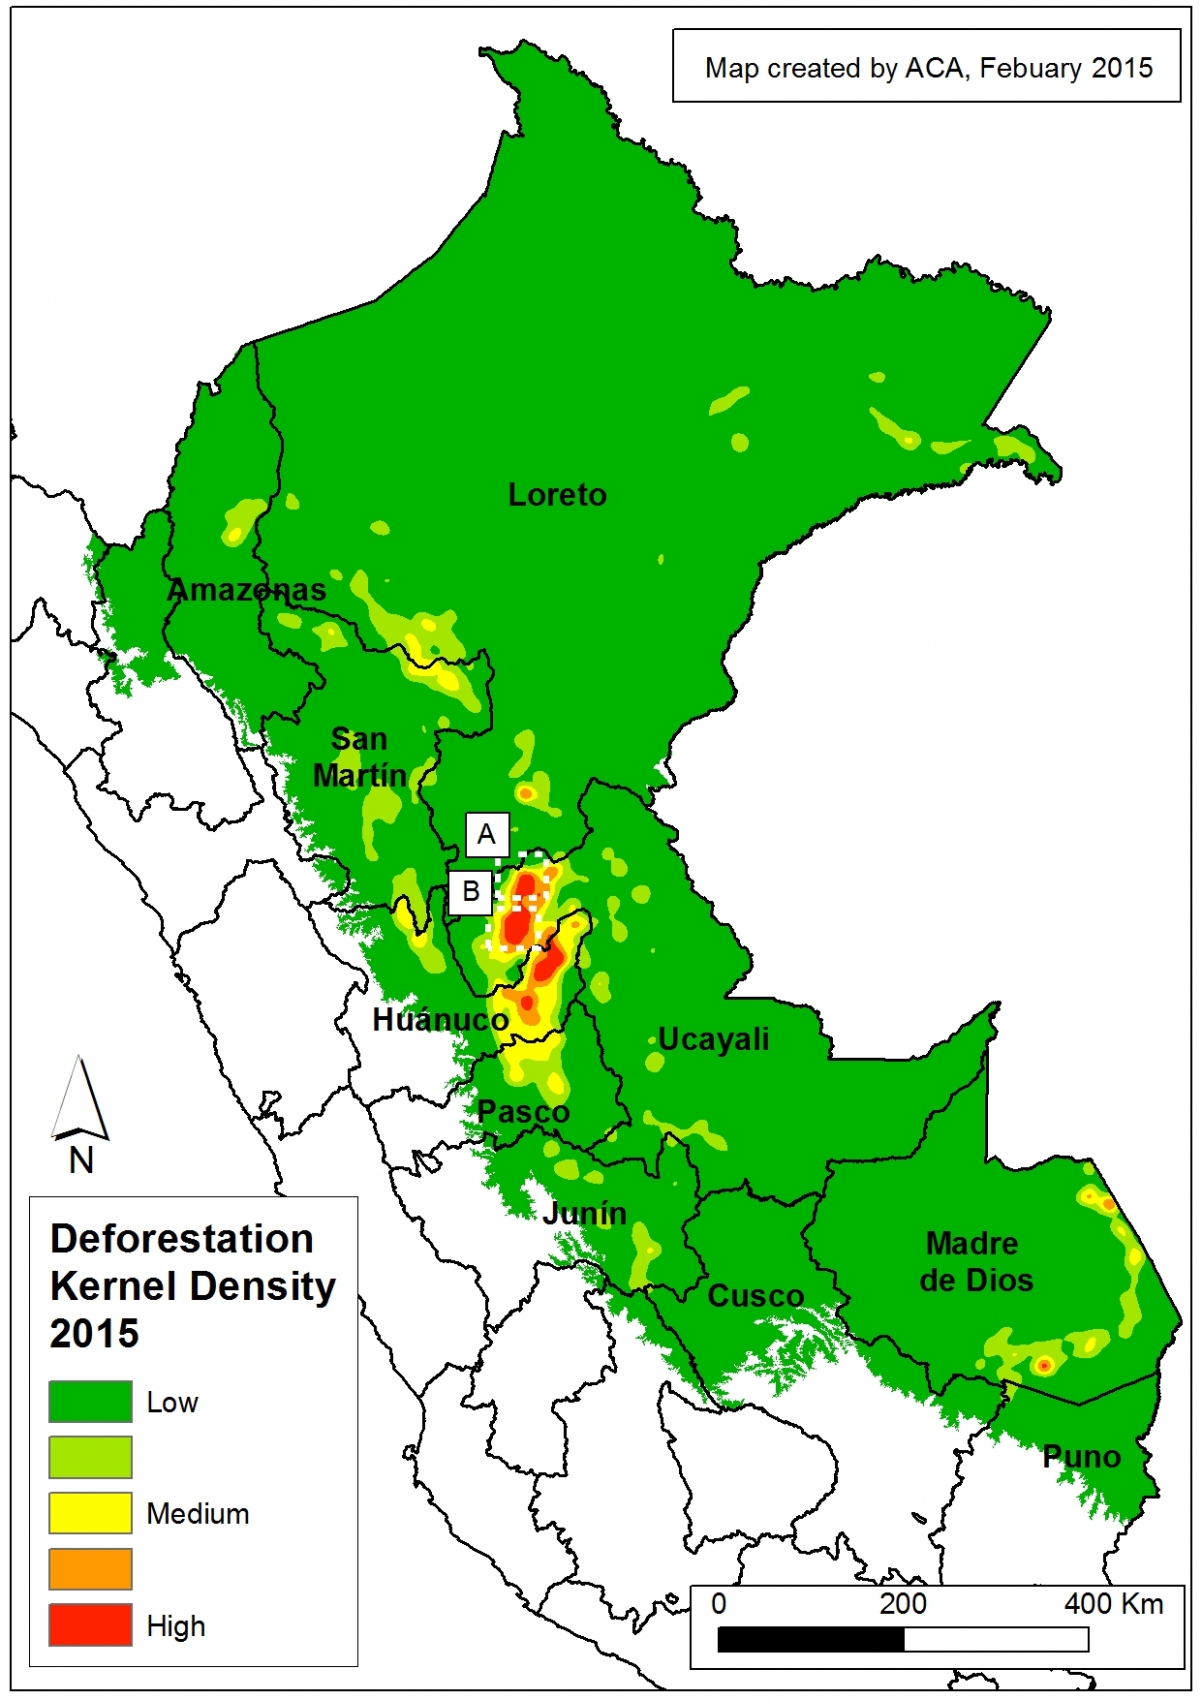
To better understand where the GLAD alert data was concentrated in 2015, we conducted kernel density estimation, a type of analysis that calculates the magnitude per unit area of a particular phenomenon (in this case, forest loss). Image 26a shows the kernel density map for forest loss in the Peruvian Amazon in 2015. It reveals that recent deforestation was concentrated in a number of hotspots in the departments of Huánuco, Madre de Dios, and Ucayali.

Note that in MAAP #25, we conducted this same type of analysis for 2012 – 2014 forest loss data. Thus, with this latest analysis we can see how deforestation trends shifted in 2015.

Insets A and B highlight an area in central Peru (department of Ucayali) where deforestation intensified in 2015. See below for high-resolution images showing the deforestation in these areas. In the coming weeks and months, we will be publishing additional articles highlighting other key 2015 deforestation hotspots.
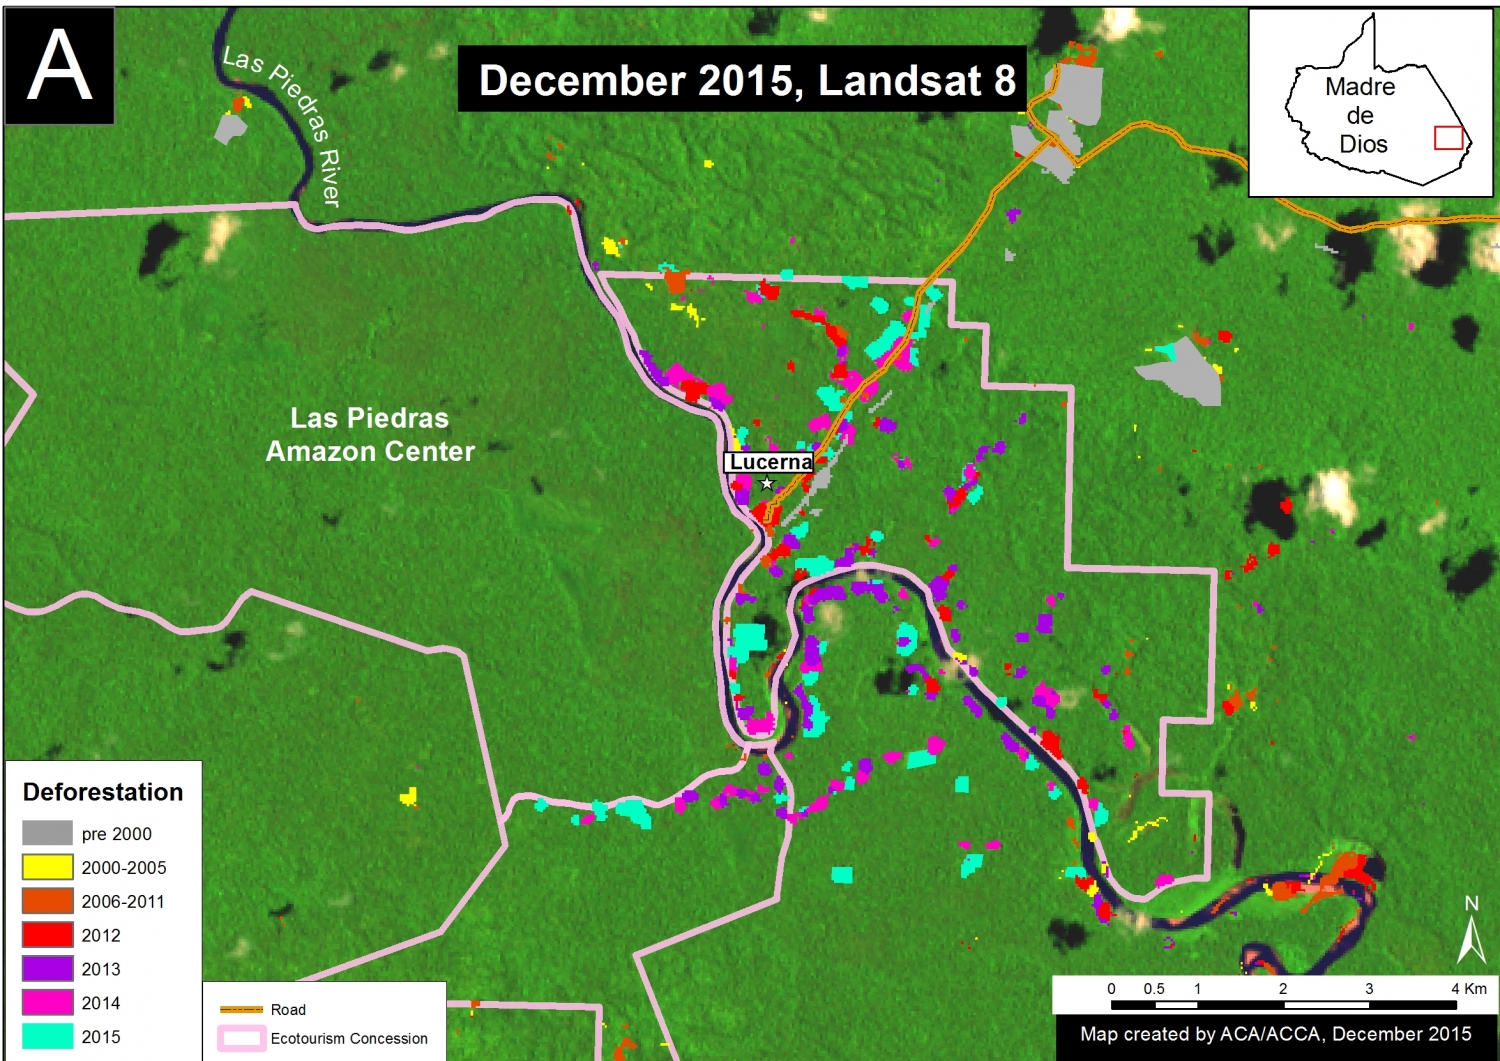


Inset A

MAAP_Coronel_Portillo_29a_v1_en
Image 26b. 2000-15 deforestation for area in Inset A. Data: Hansen et al 2016 (ERL), PNCB/MINAM, Hansen/UMD/Google/USGS/NASA, USGS (Landsat 8)

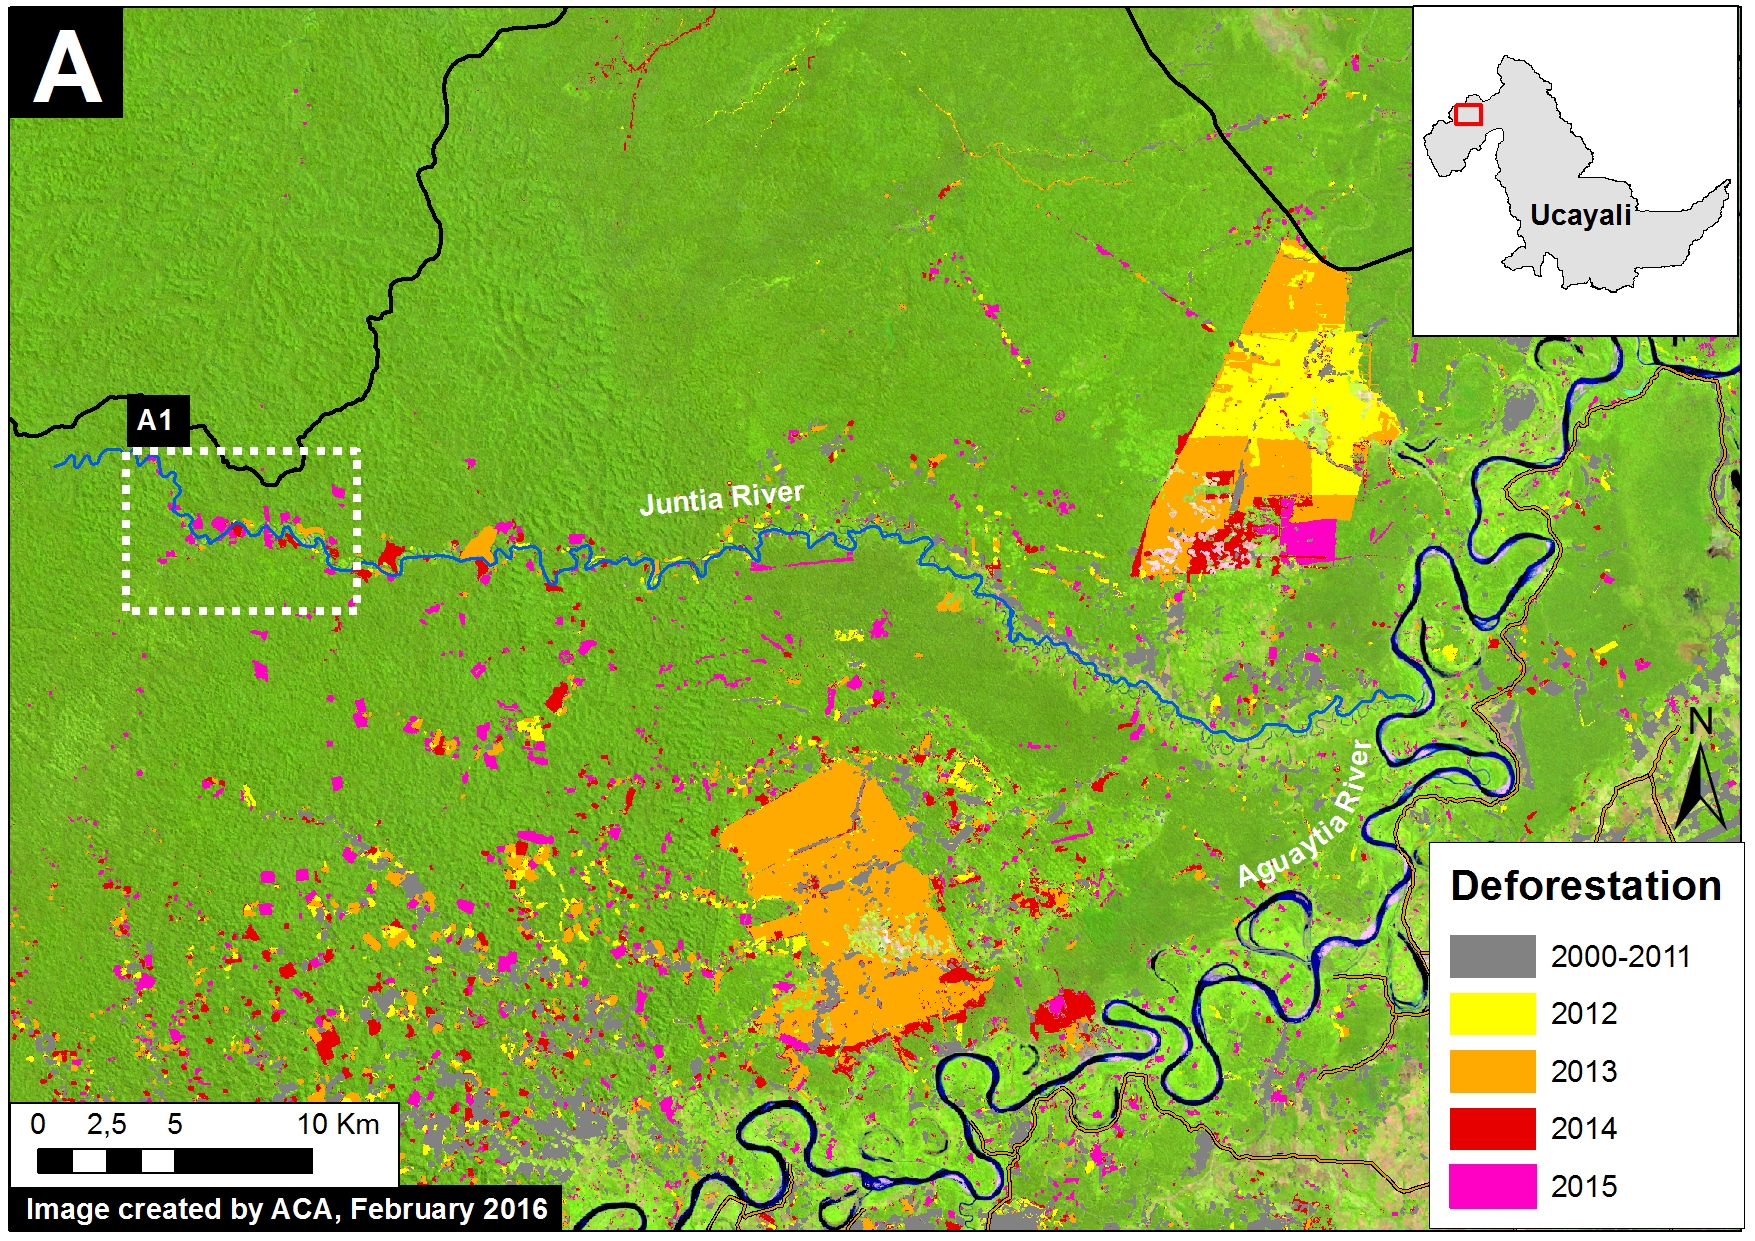
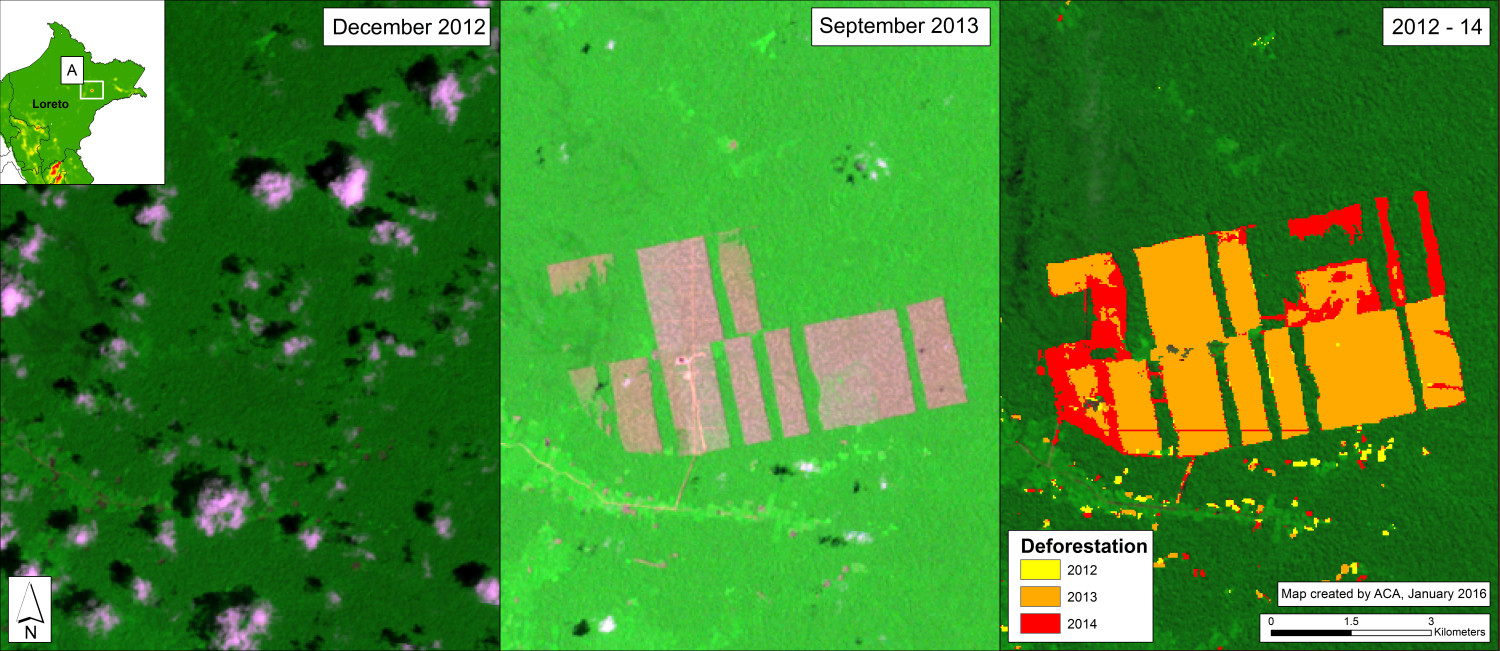
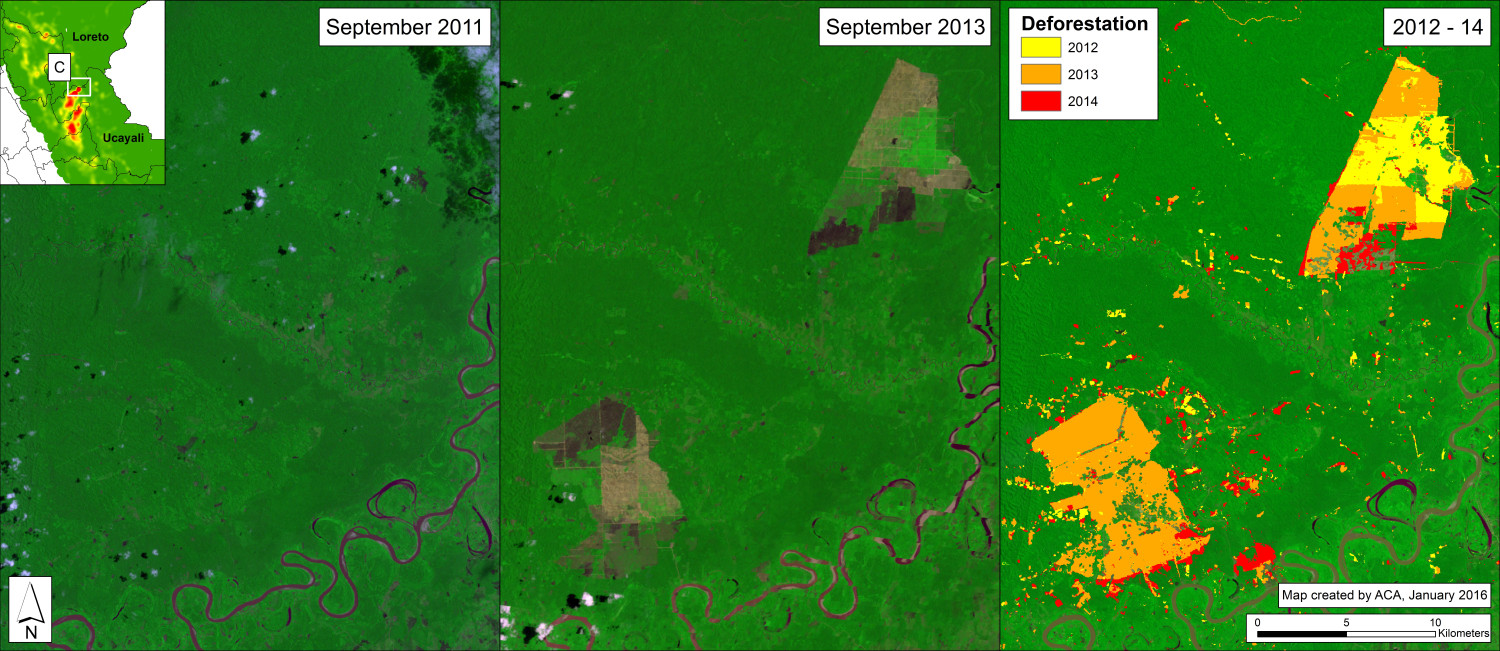
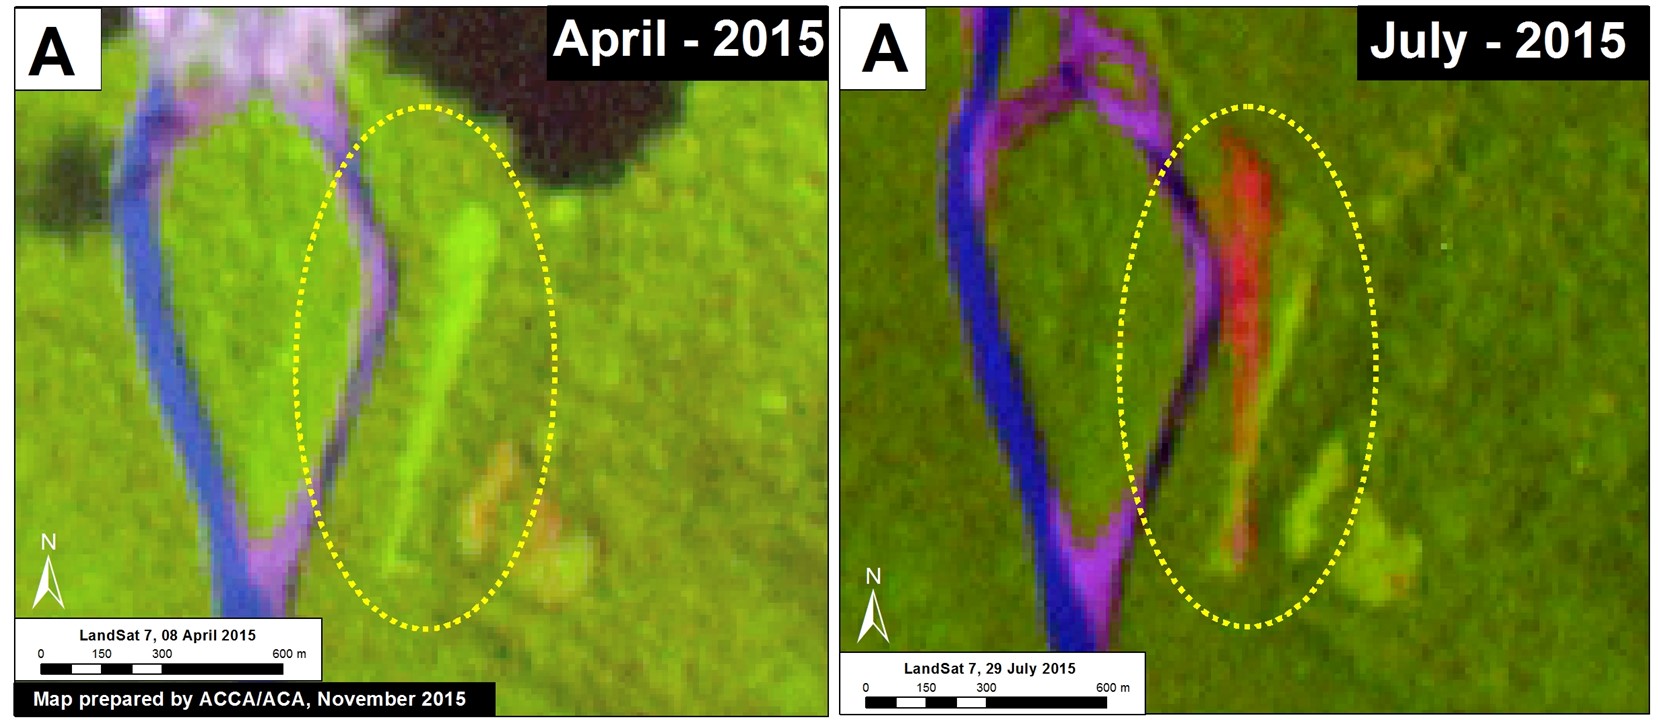
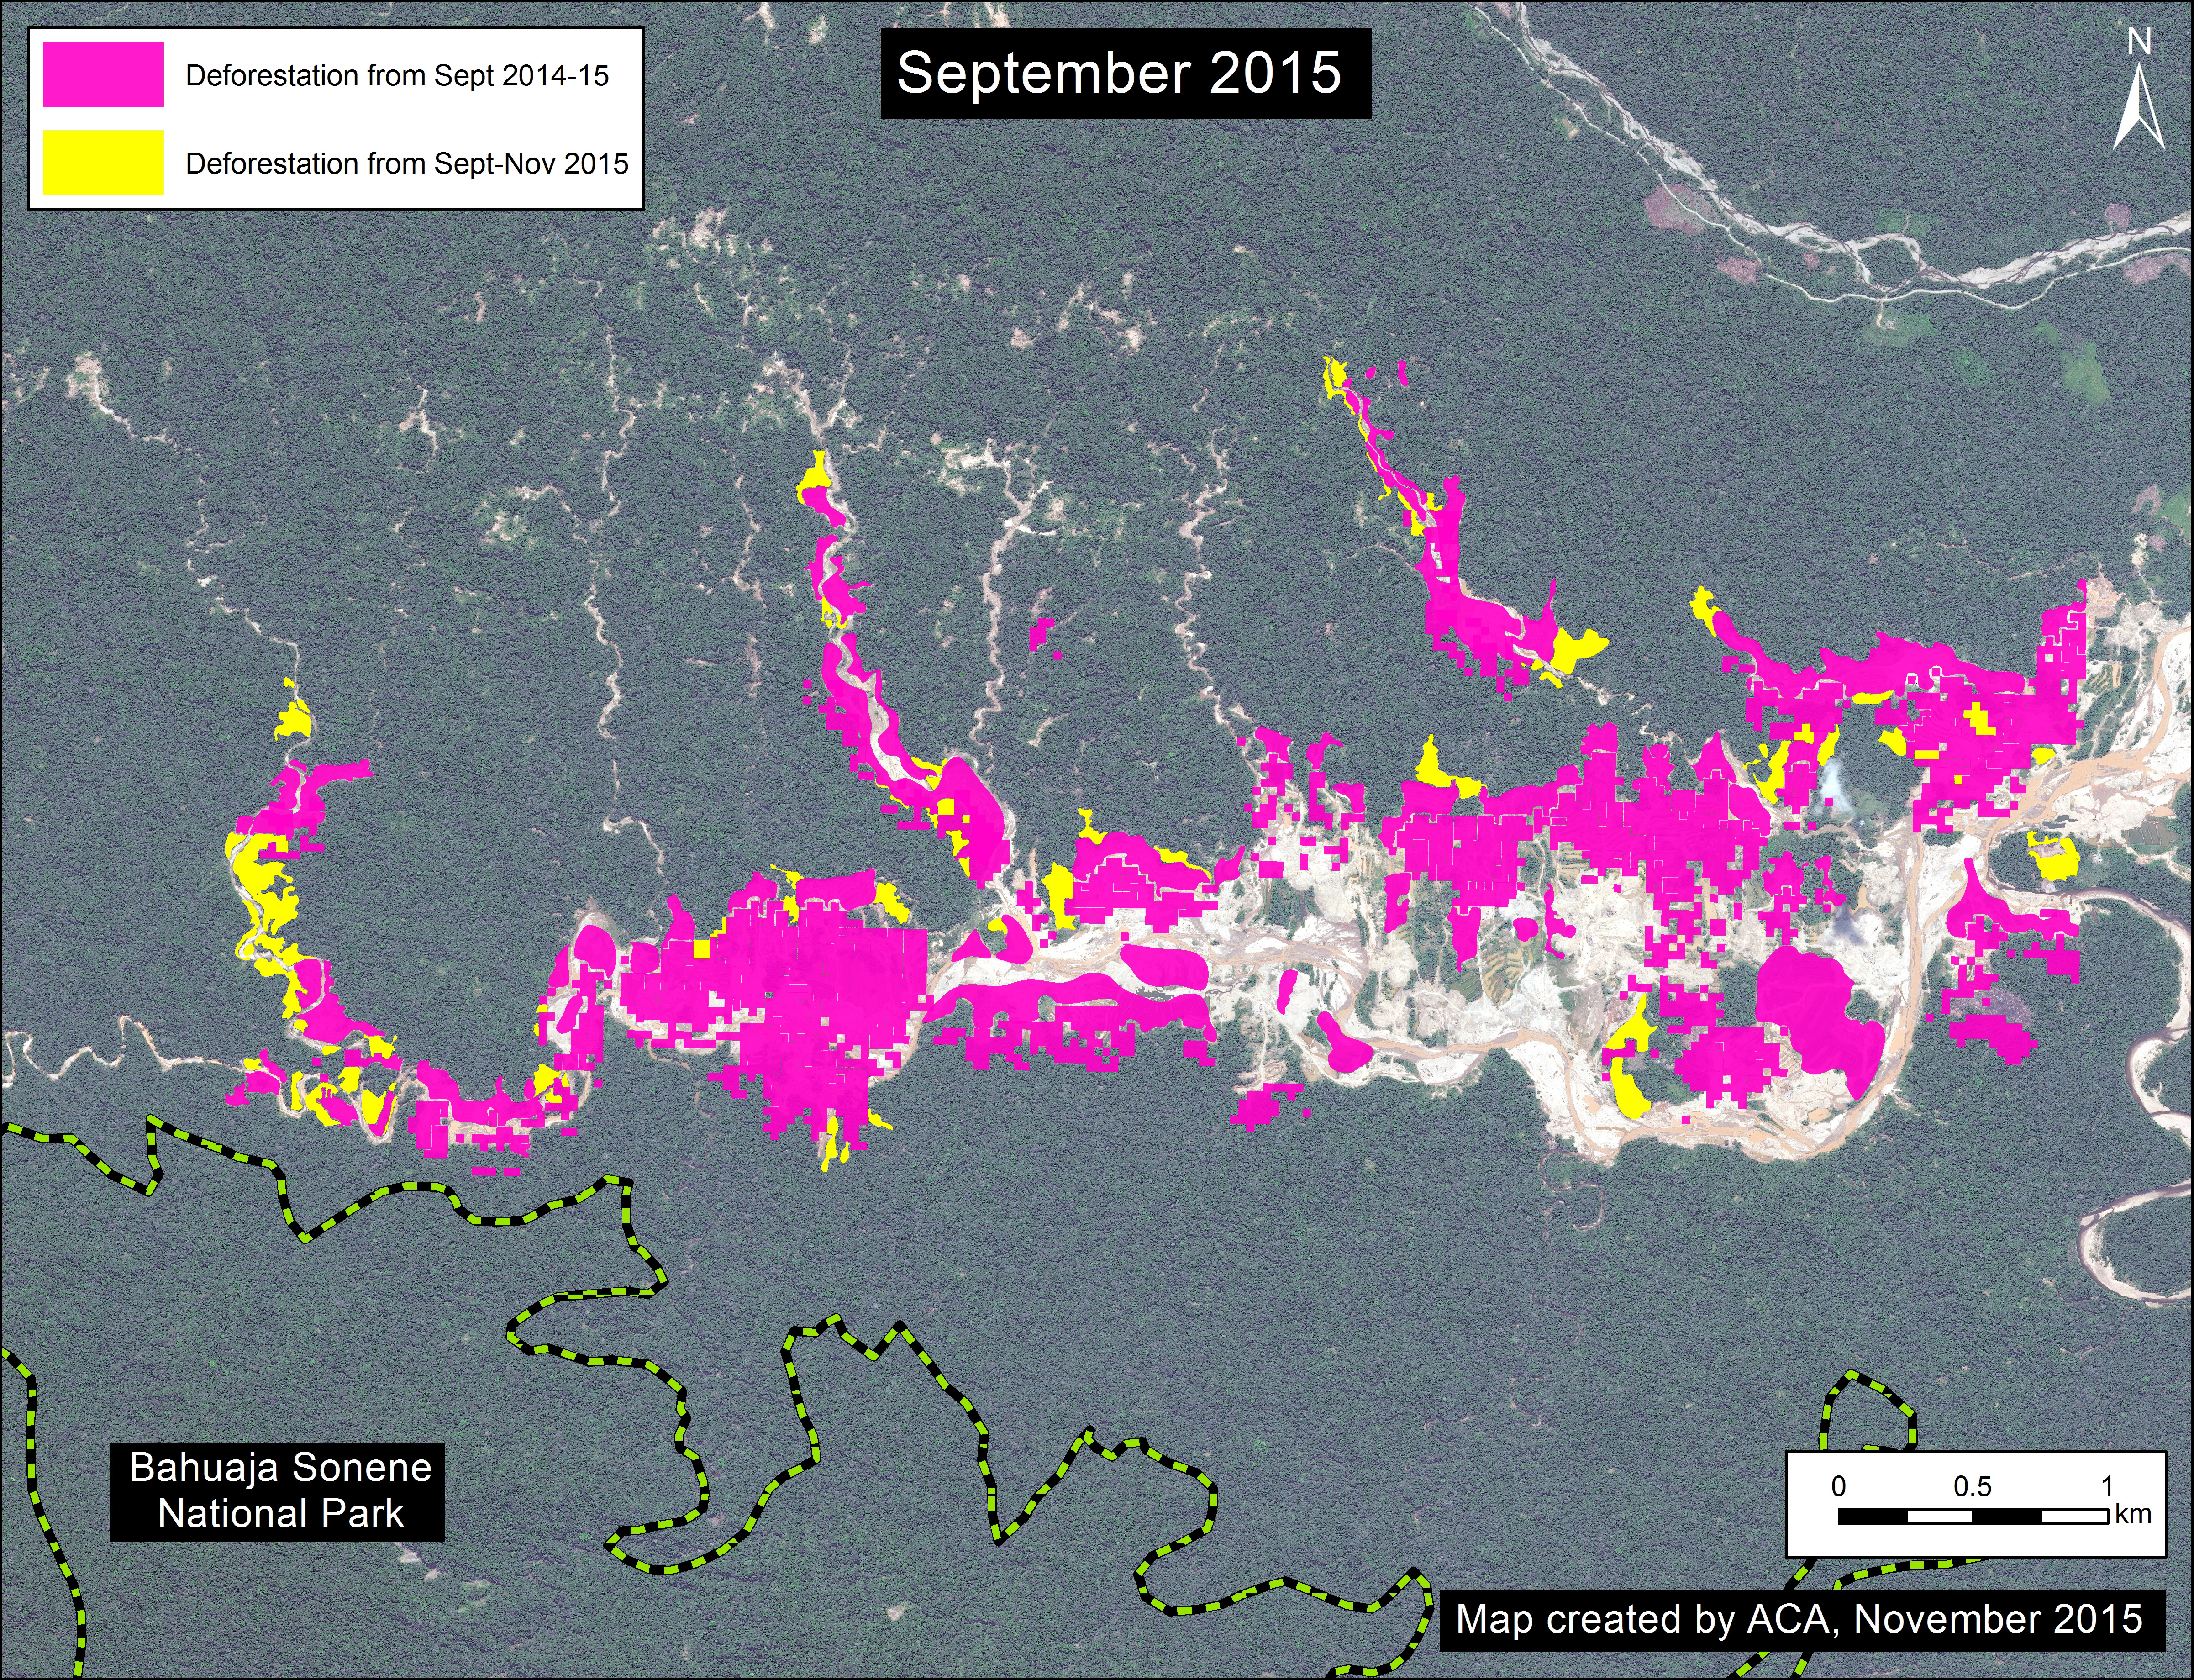
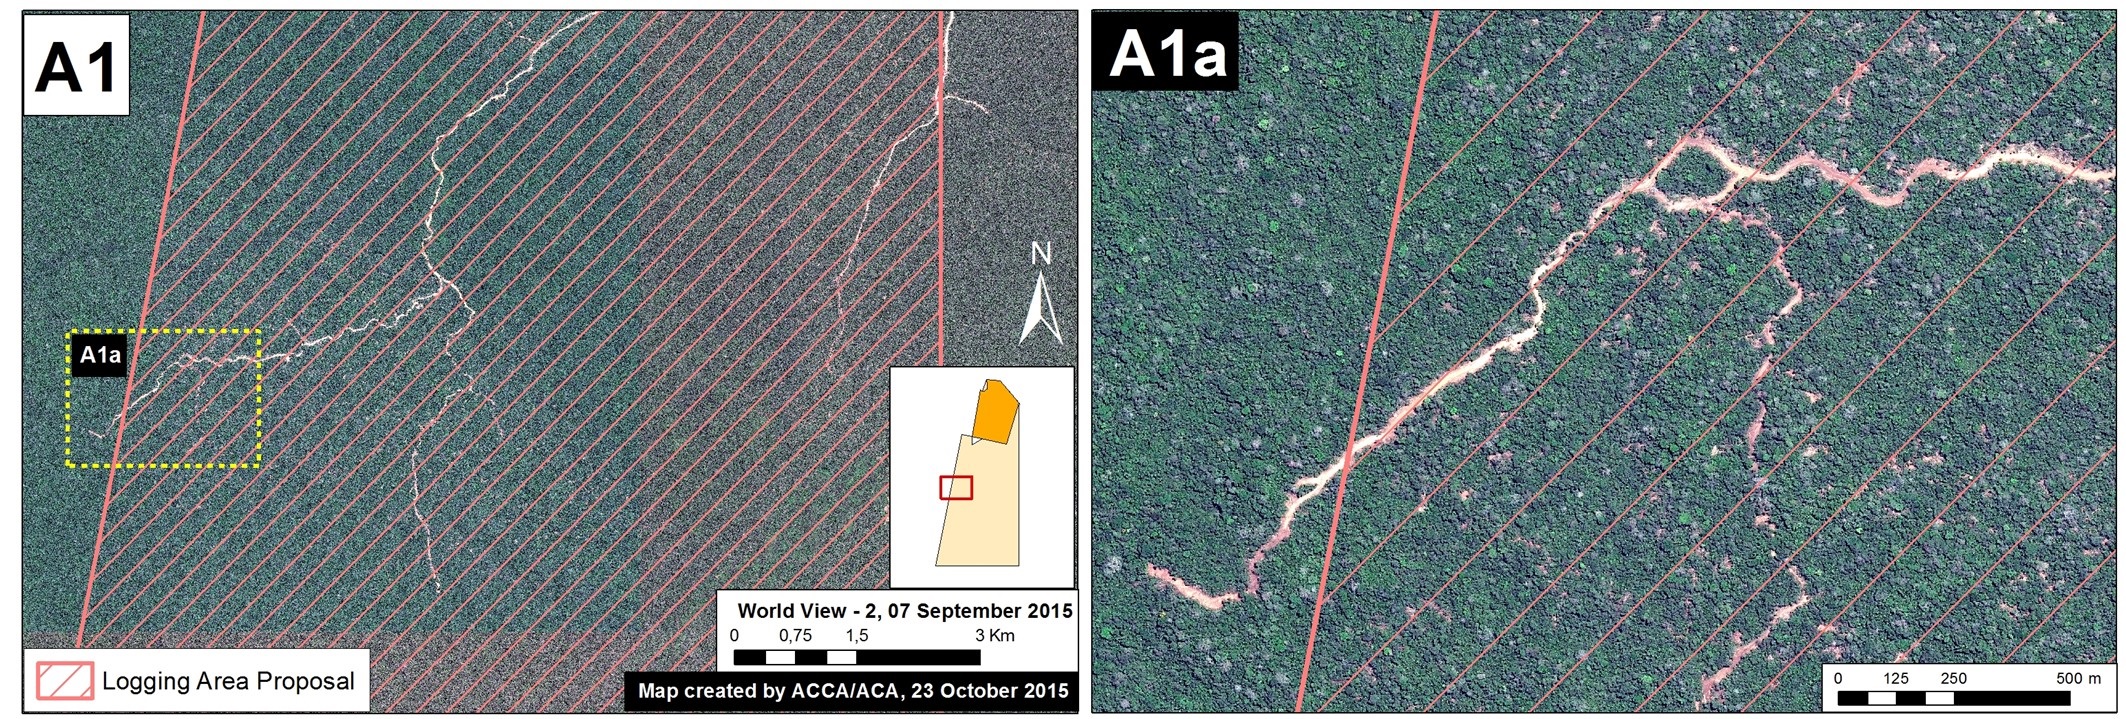
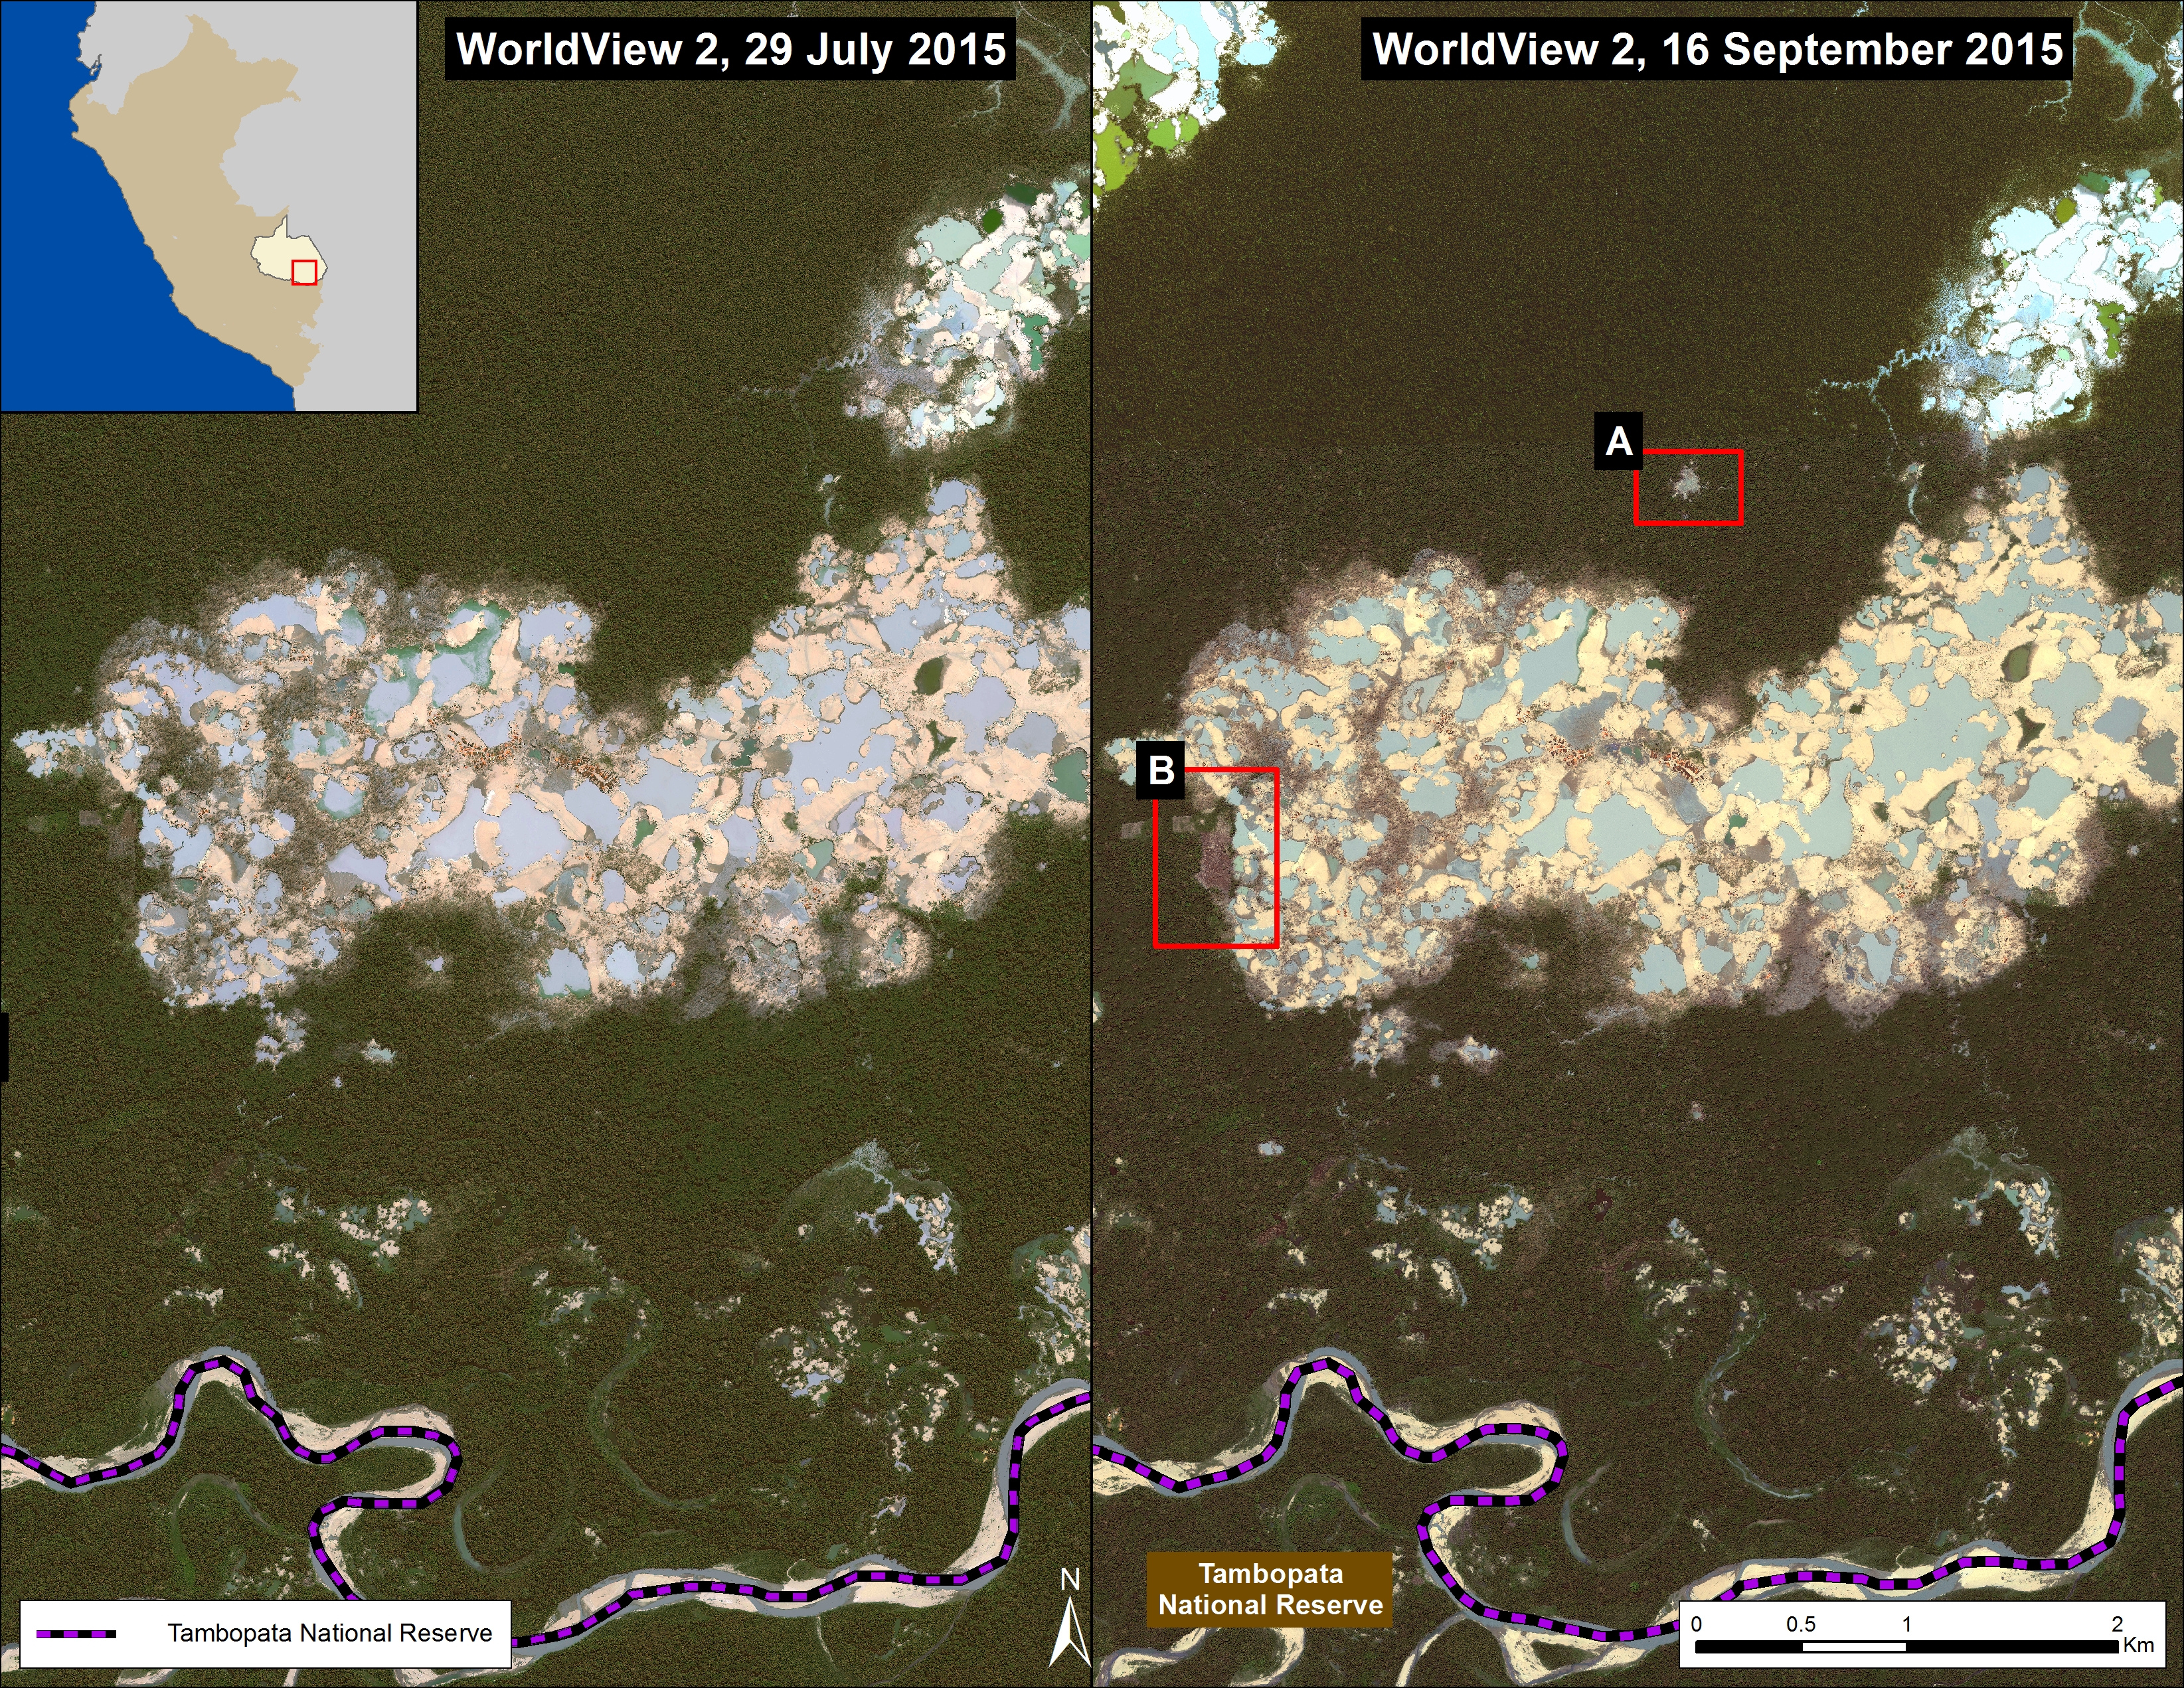
Image 26b shows detailed deforestation information for the area indicated in Inset A (from Image 26a). Note the extensive 2015 deforestation just to the west of two large-scale oil palm plantations (201 hectares, see pink areas).

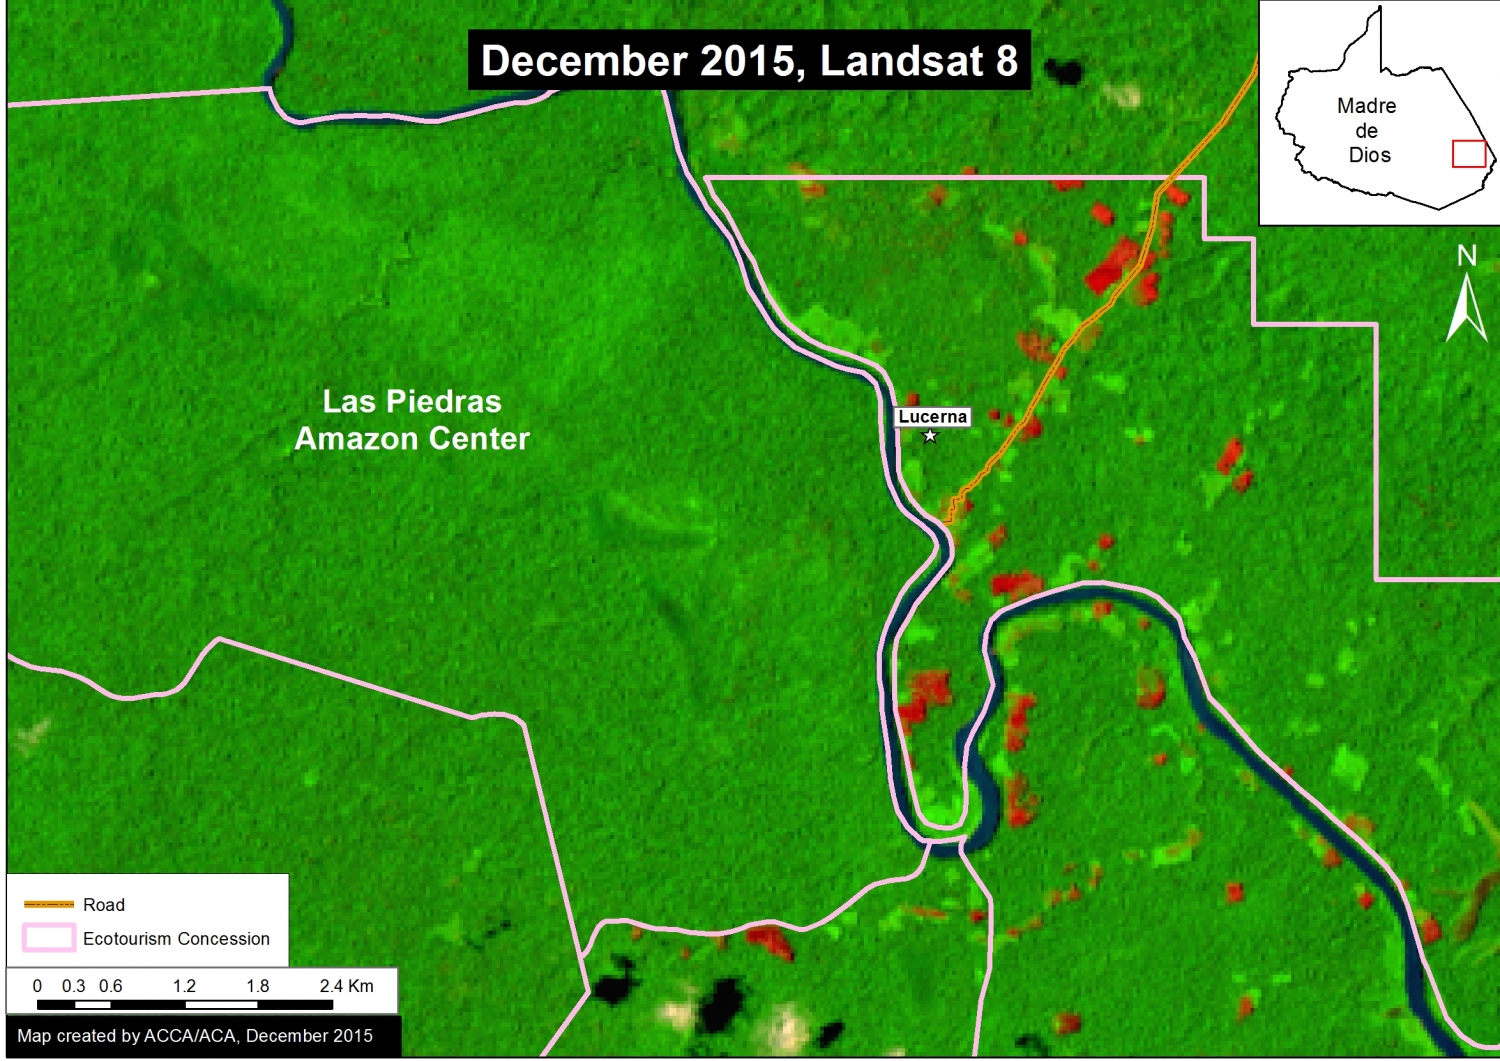
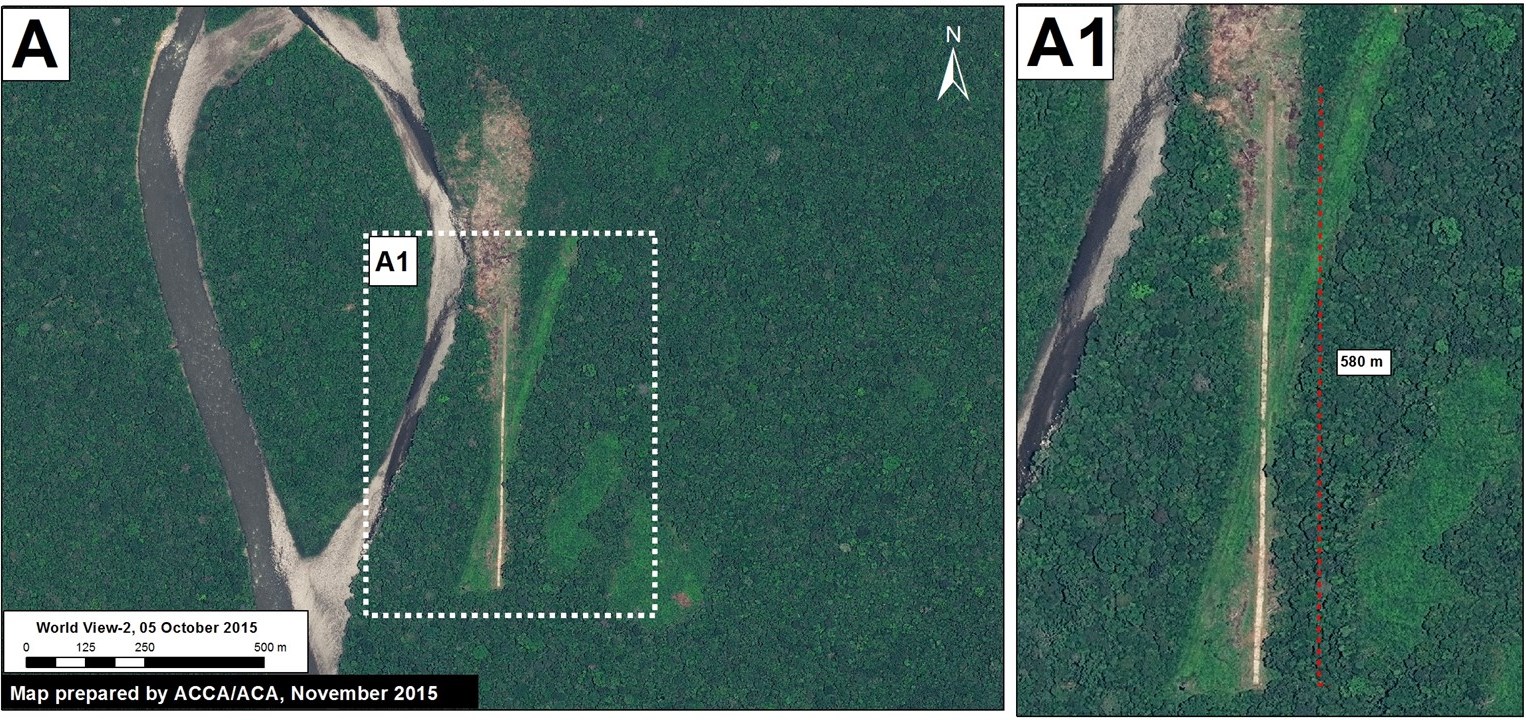
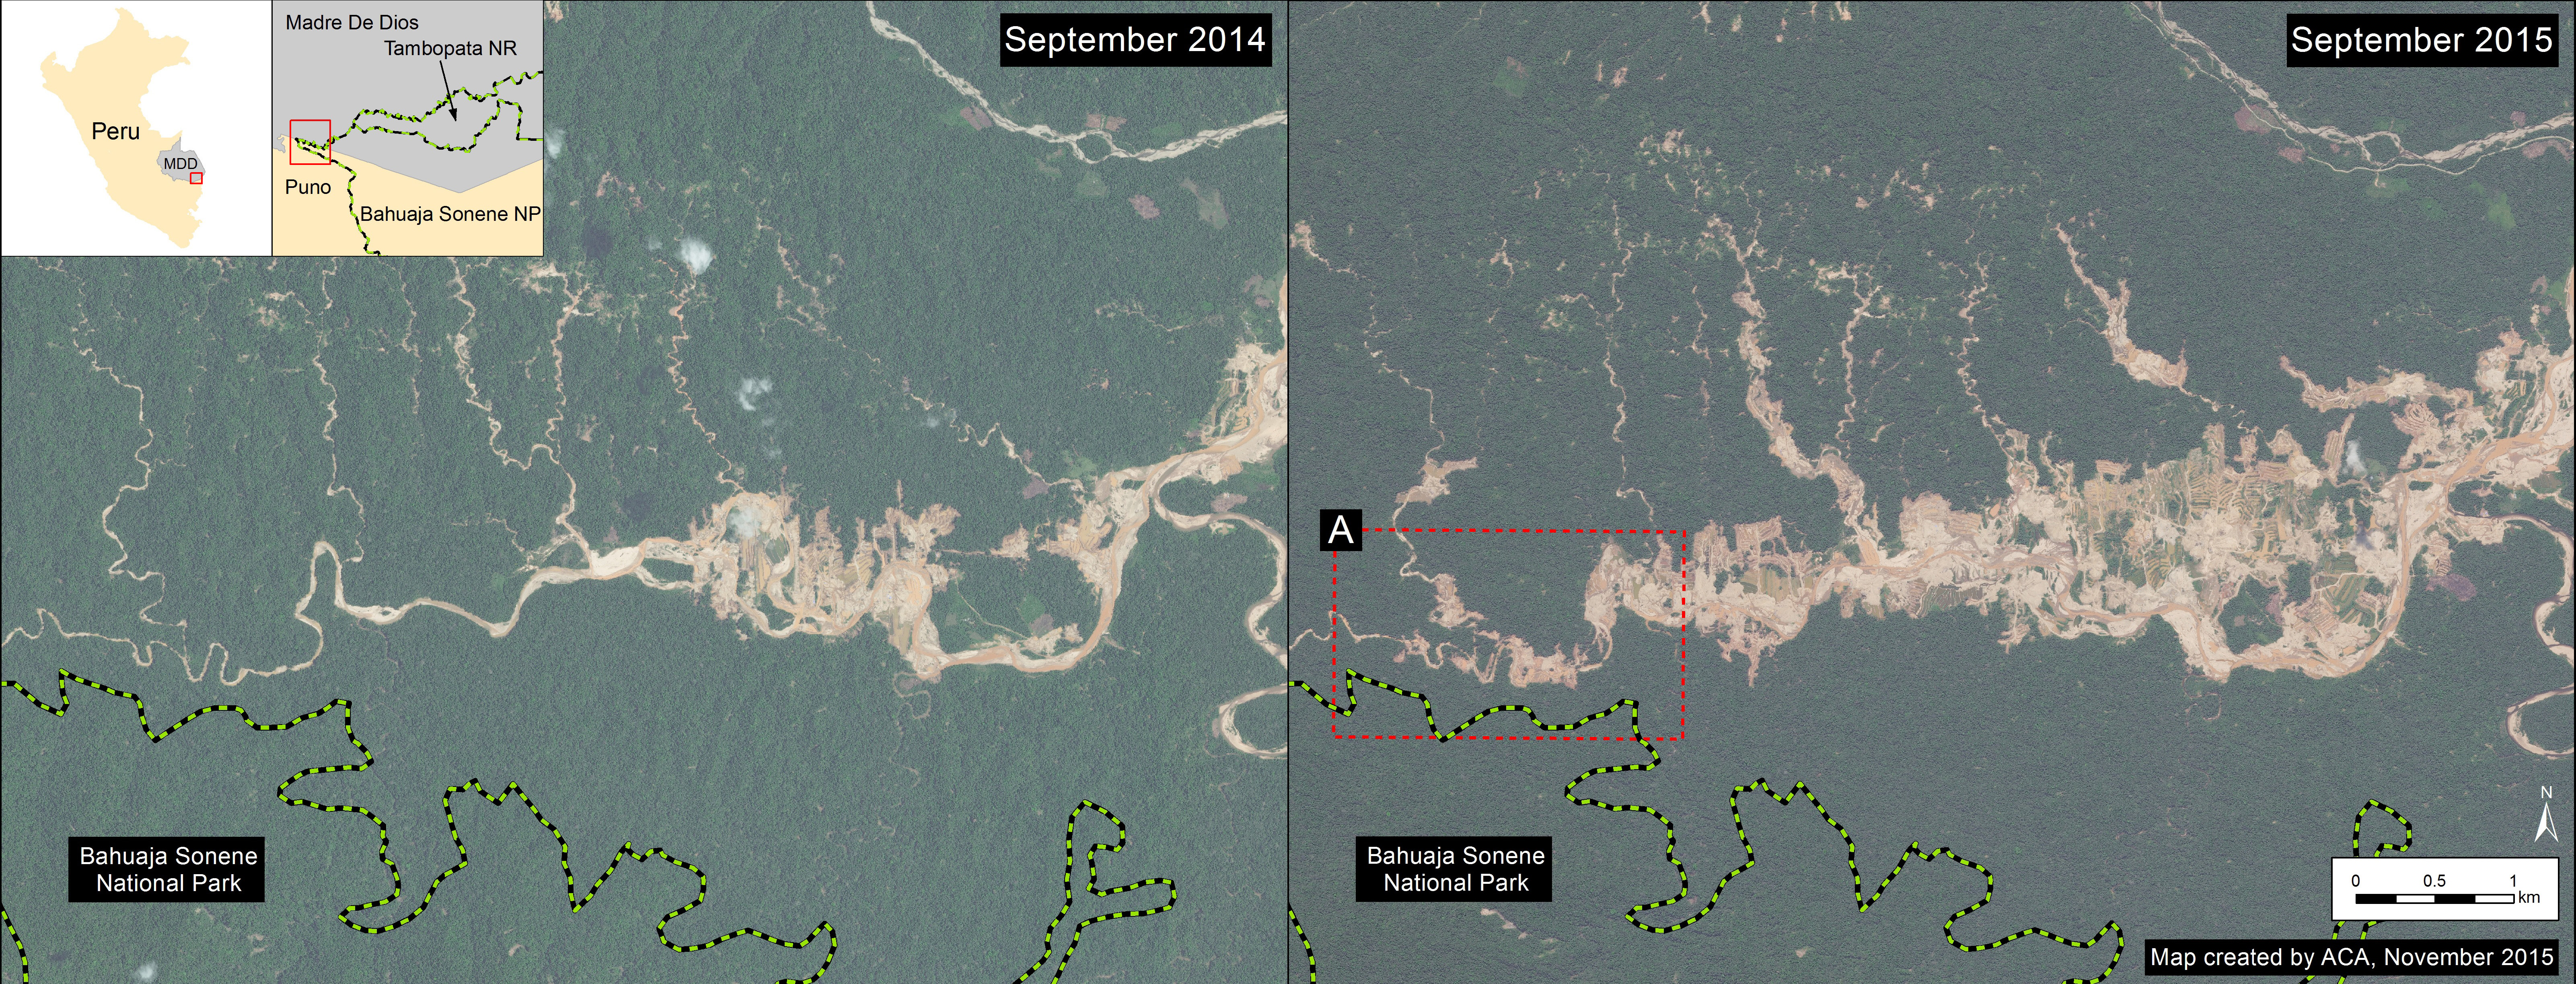
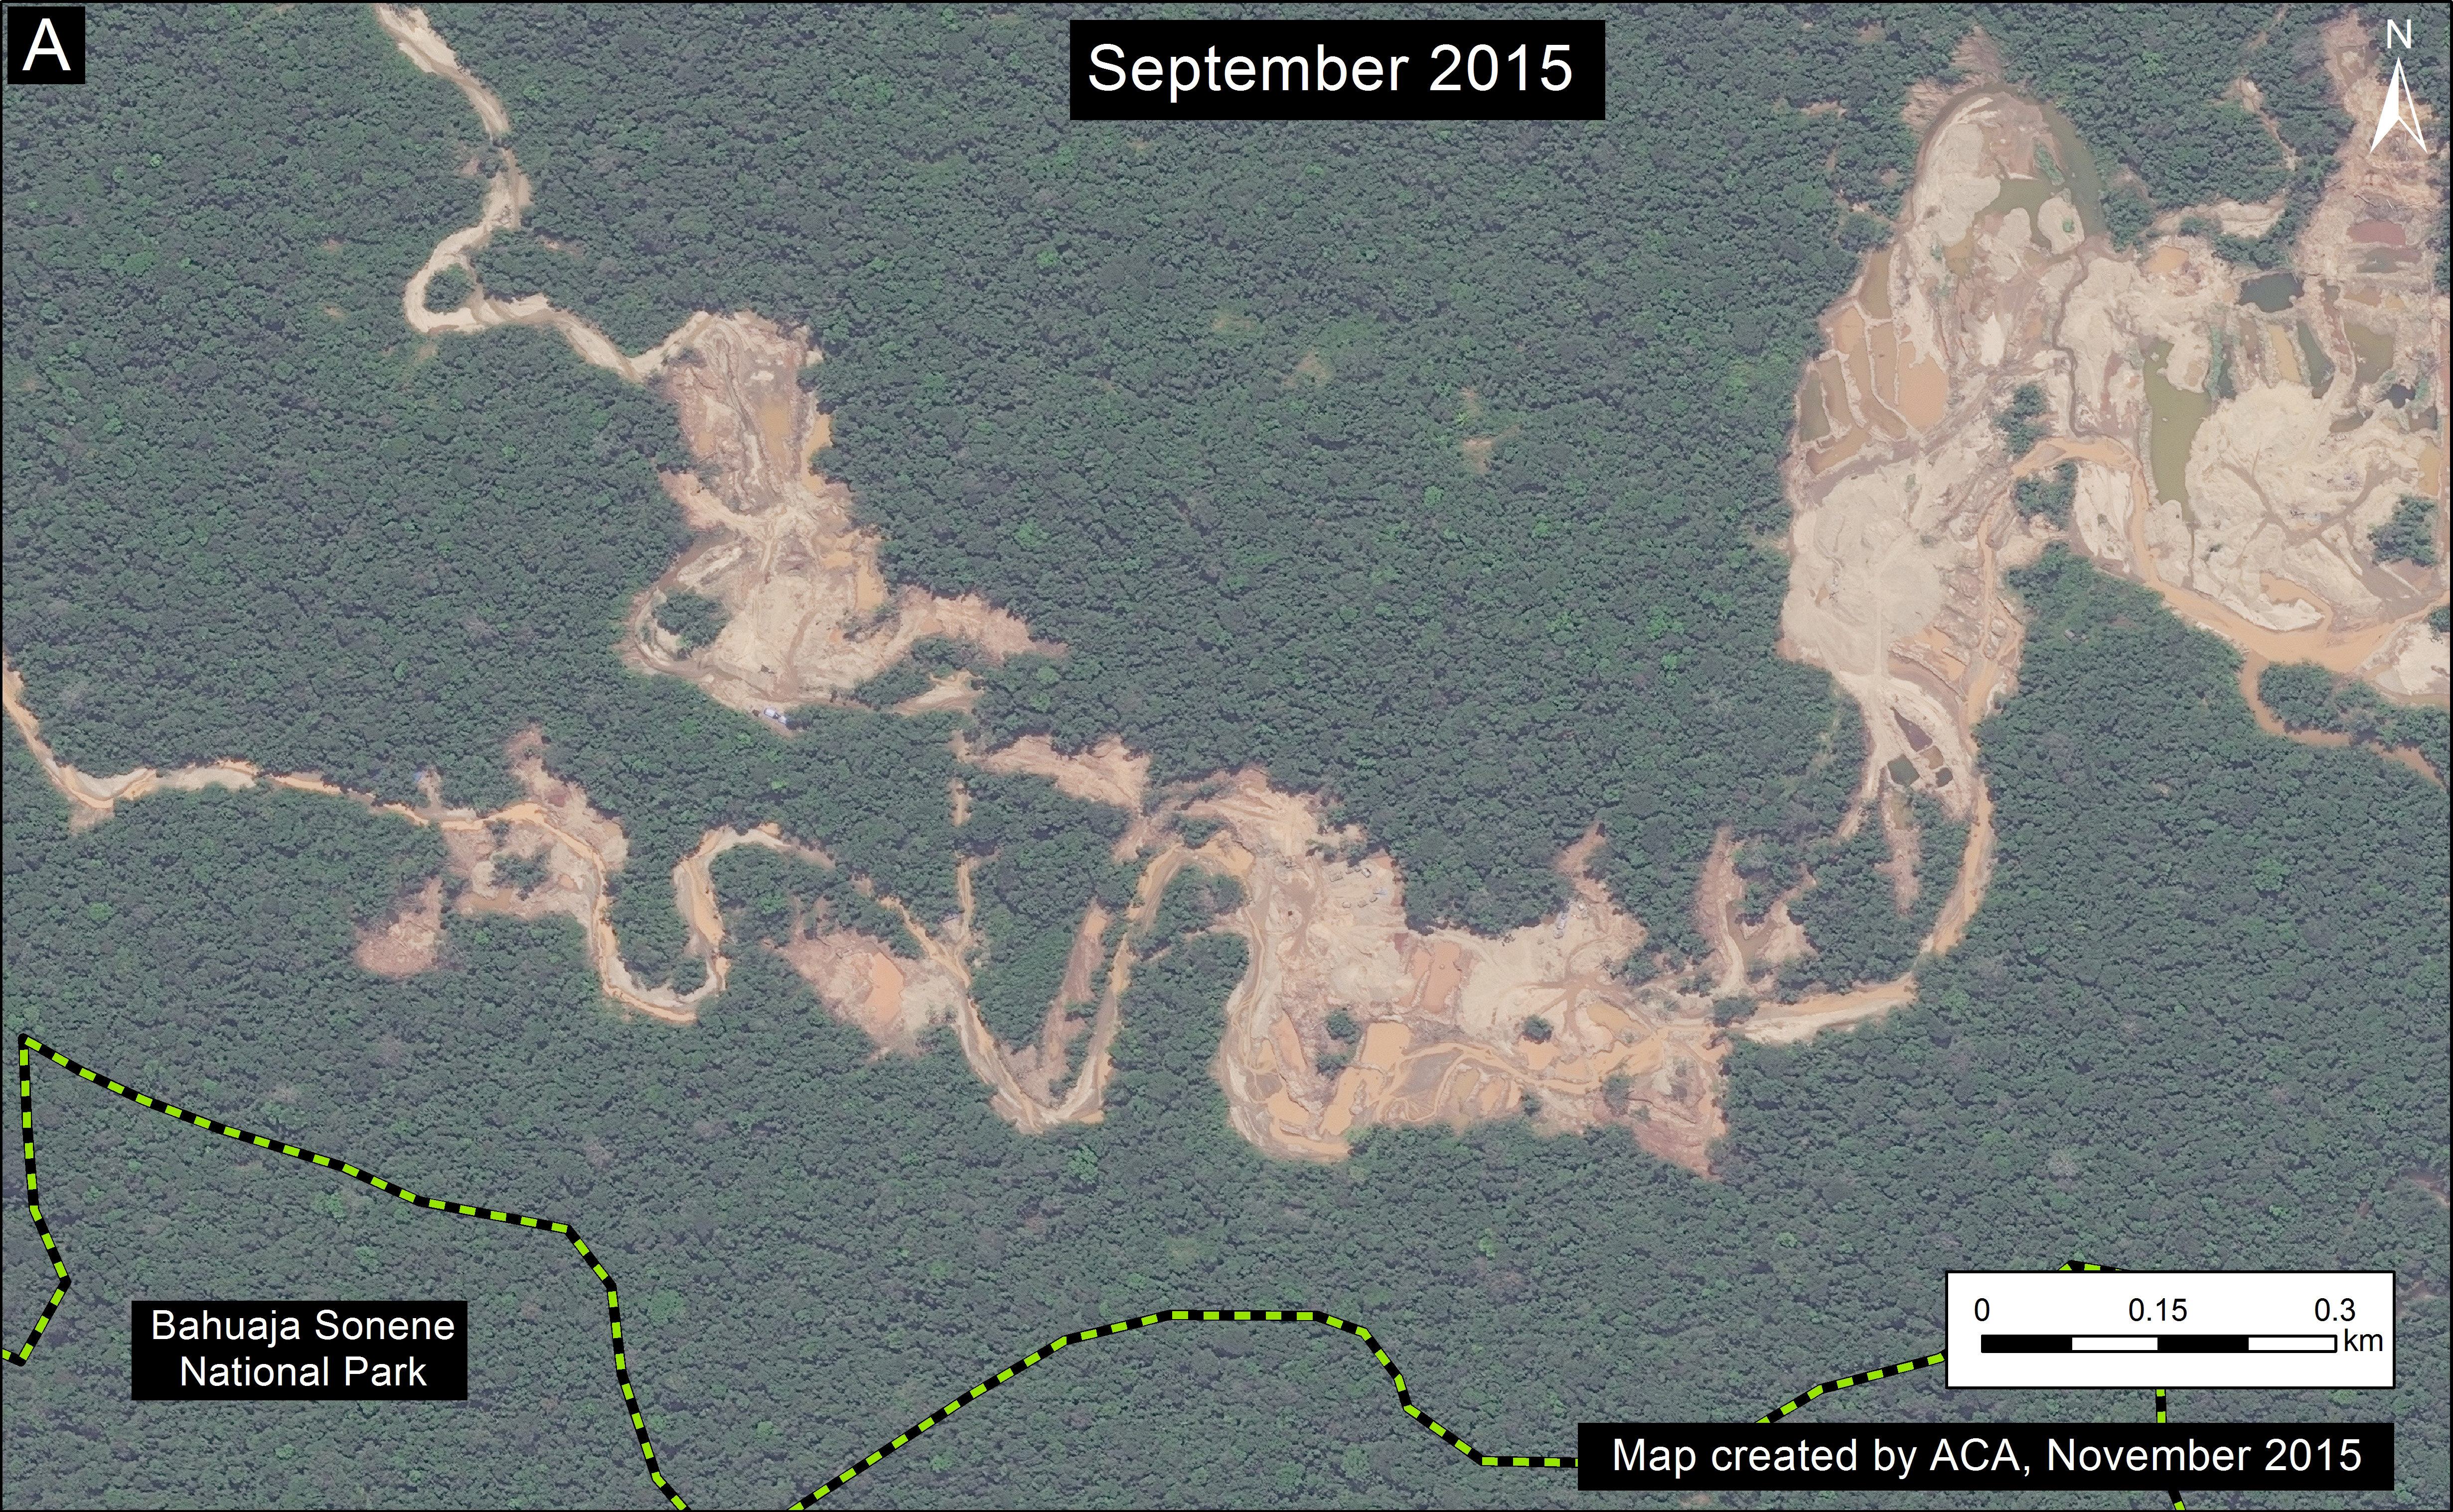
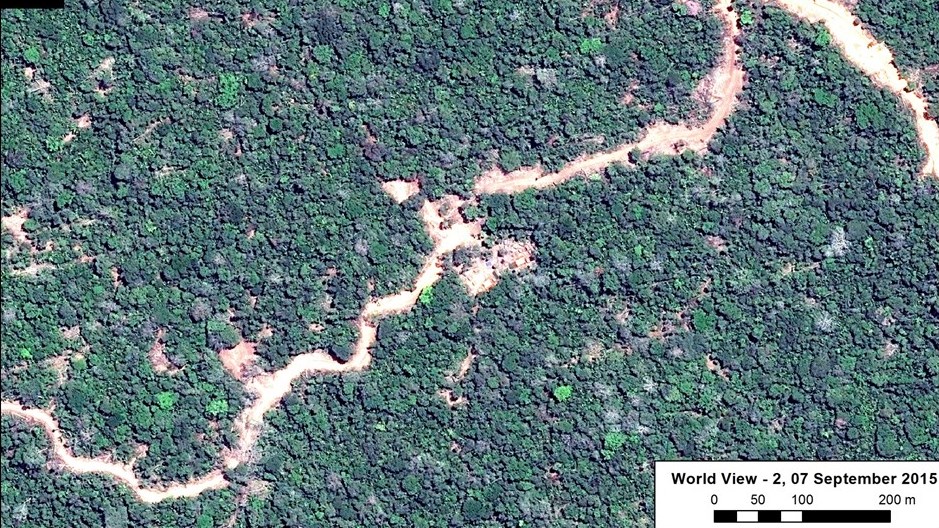
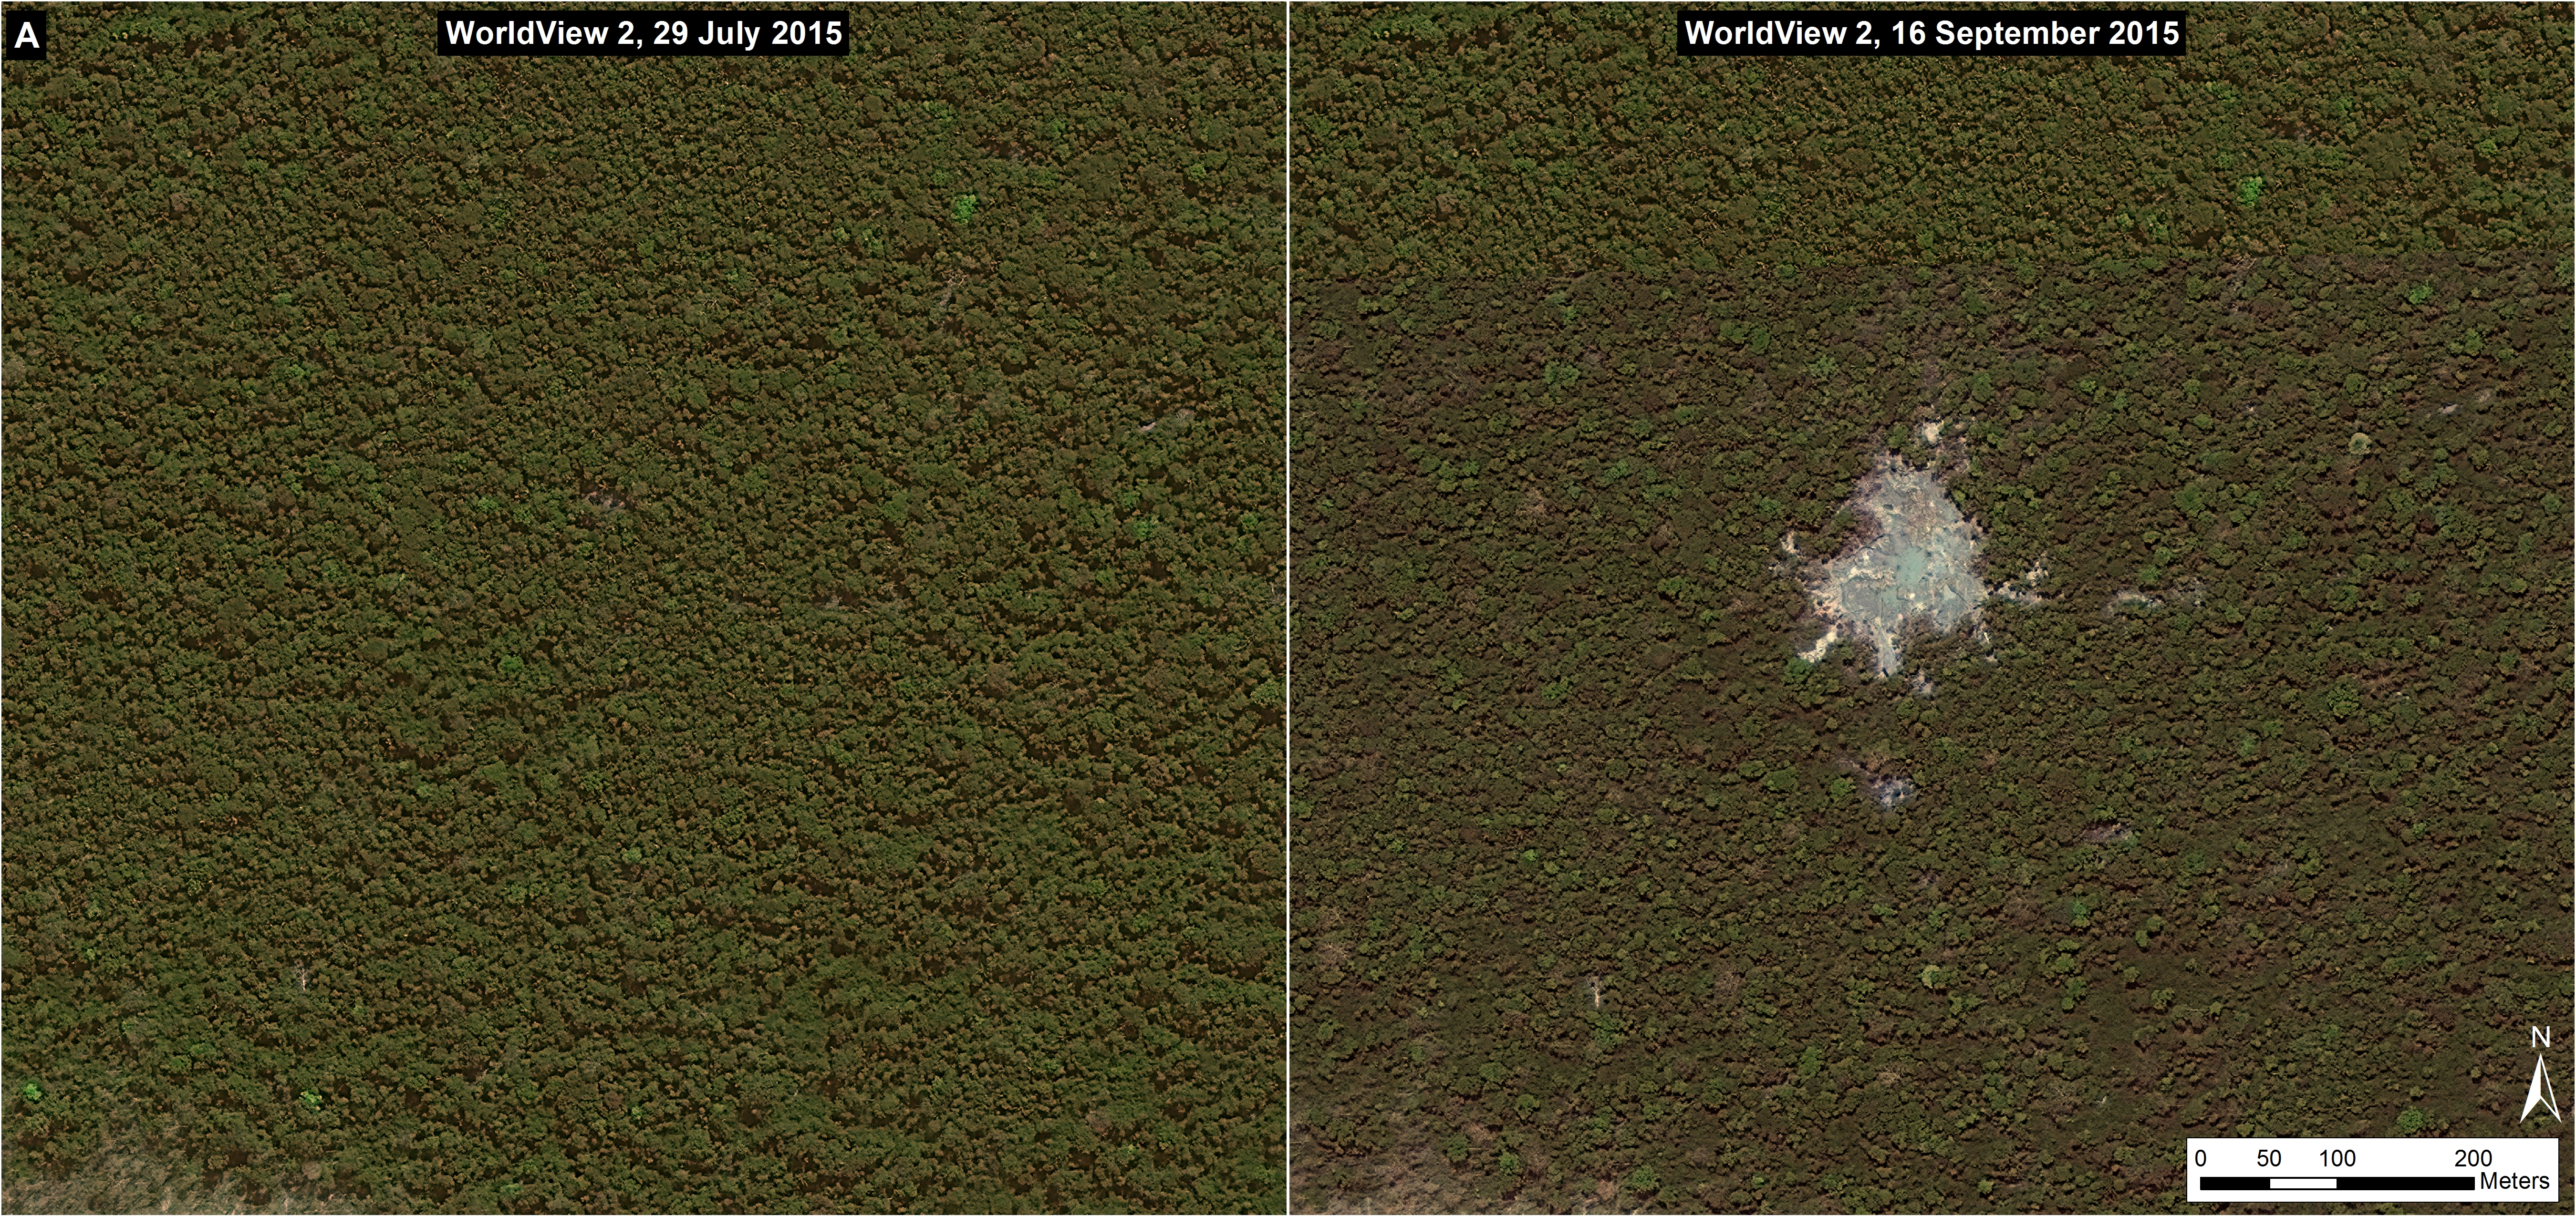
Further below, Image 26c shows a high-resolution satellite image of the area in Inset A1 before (left panel) and after (right panel) the recent deforestation events.


MAAP_Coronel_Portillo_29b_v1_m_en
Image 26c. High-resolution view of area in Inset A1 before (left panel) and after (right panel) recent deforestation events. Data: WorldView-2 de Digital Globe (NextView).


Inset B

MAAP_Coronel_Portillo_29d_v1_en
Image 26d. 2000-15 deforestation for area in Inset B from Image Xa. Data: Hansen et al 2016 (ERL), PNCB/MINAM, Hansen/UMD/Google/USGS/NASA, USGS (Landsat 8)

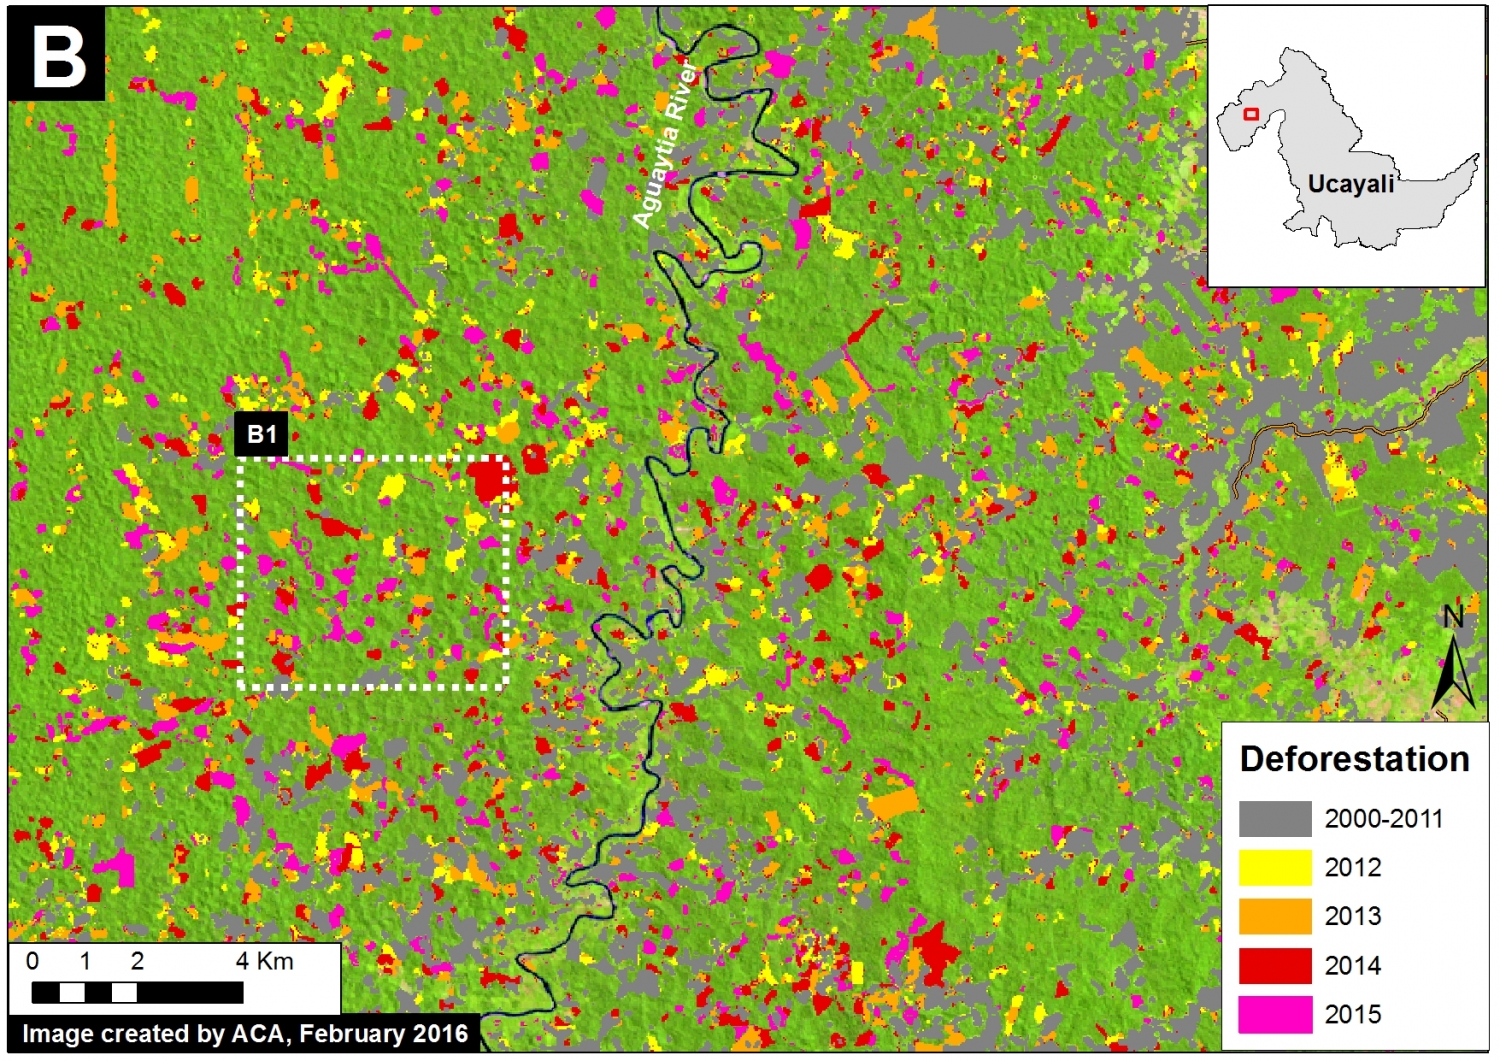
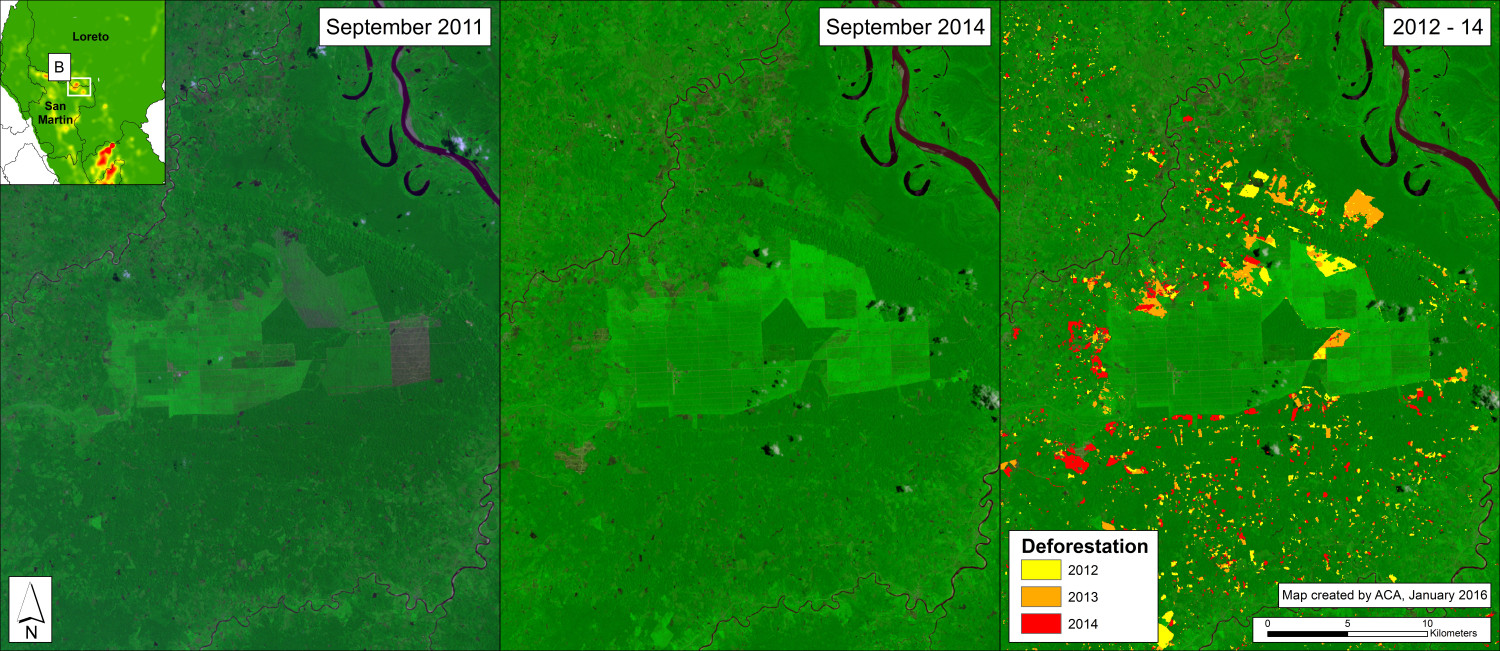
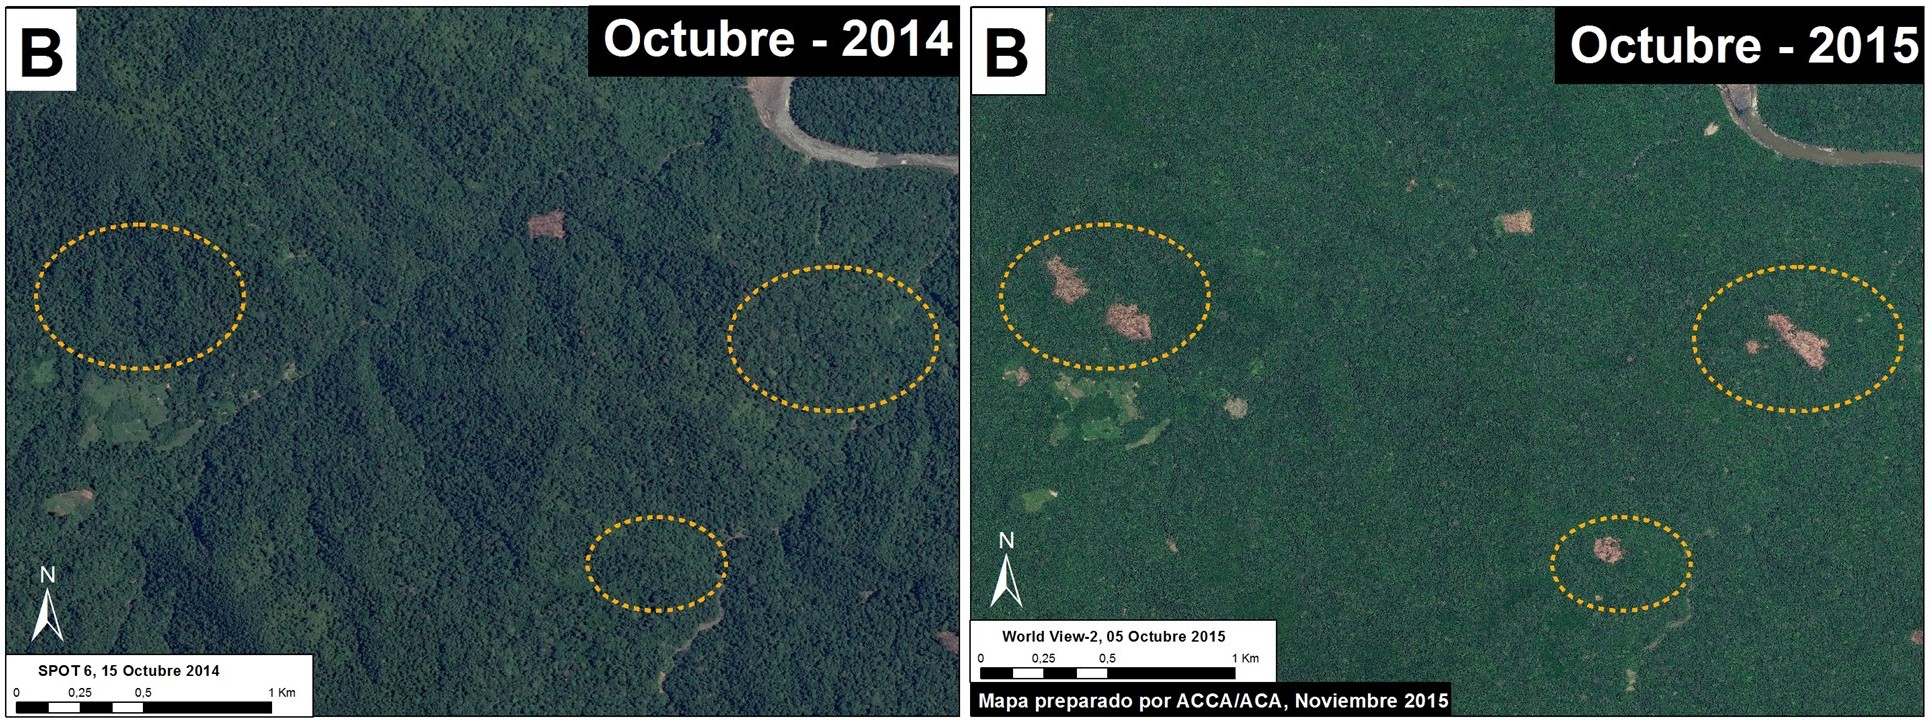
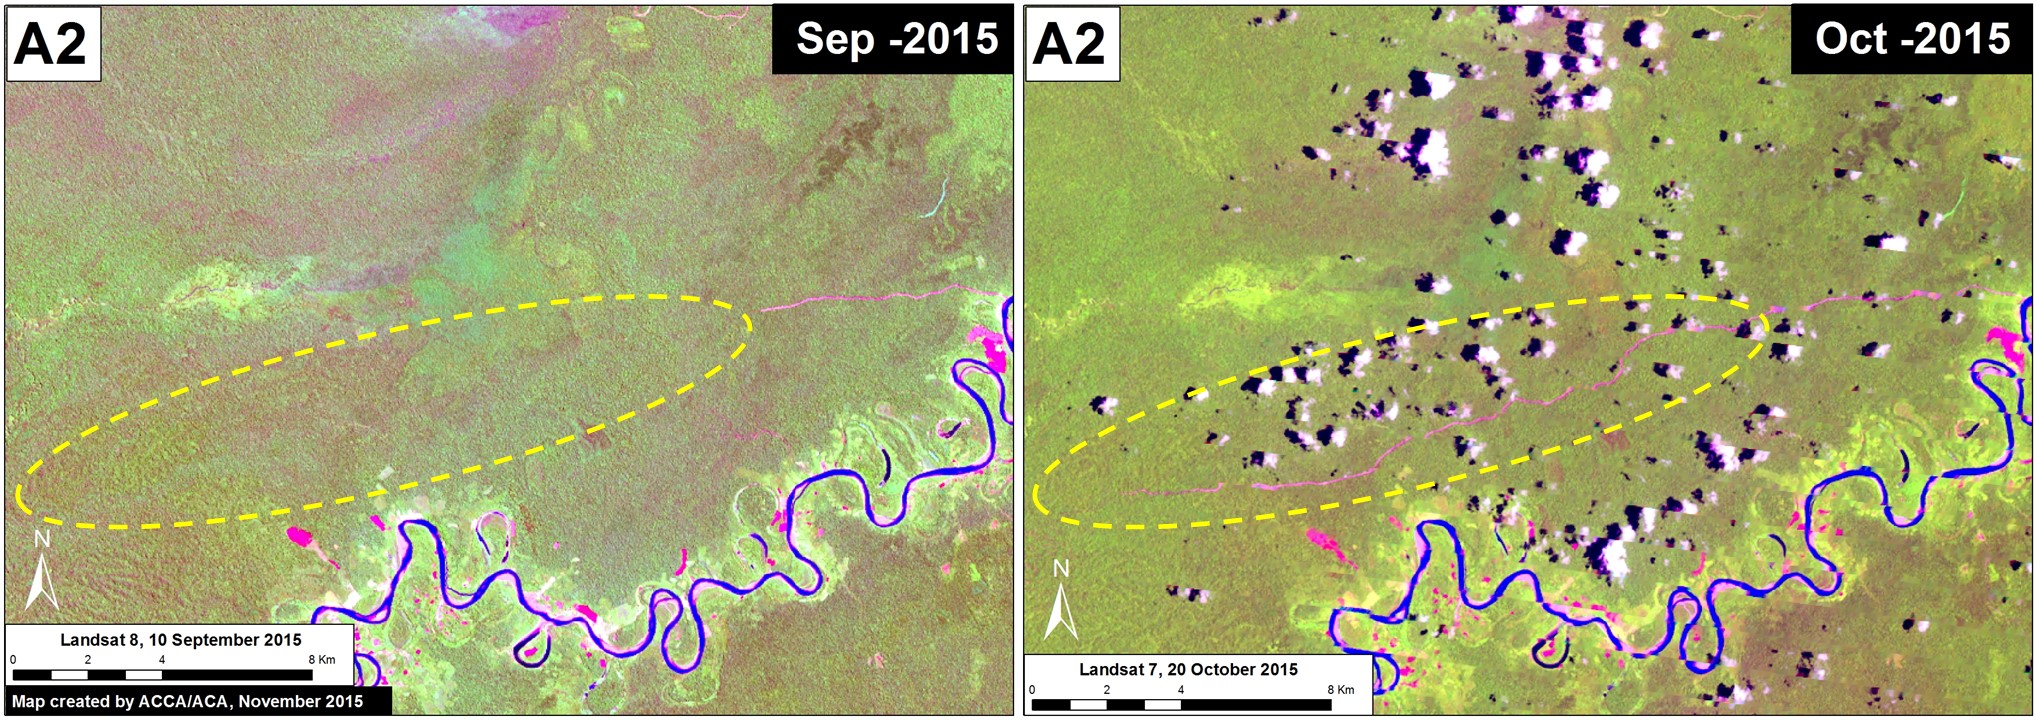
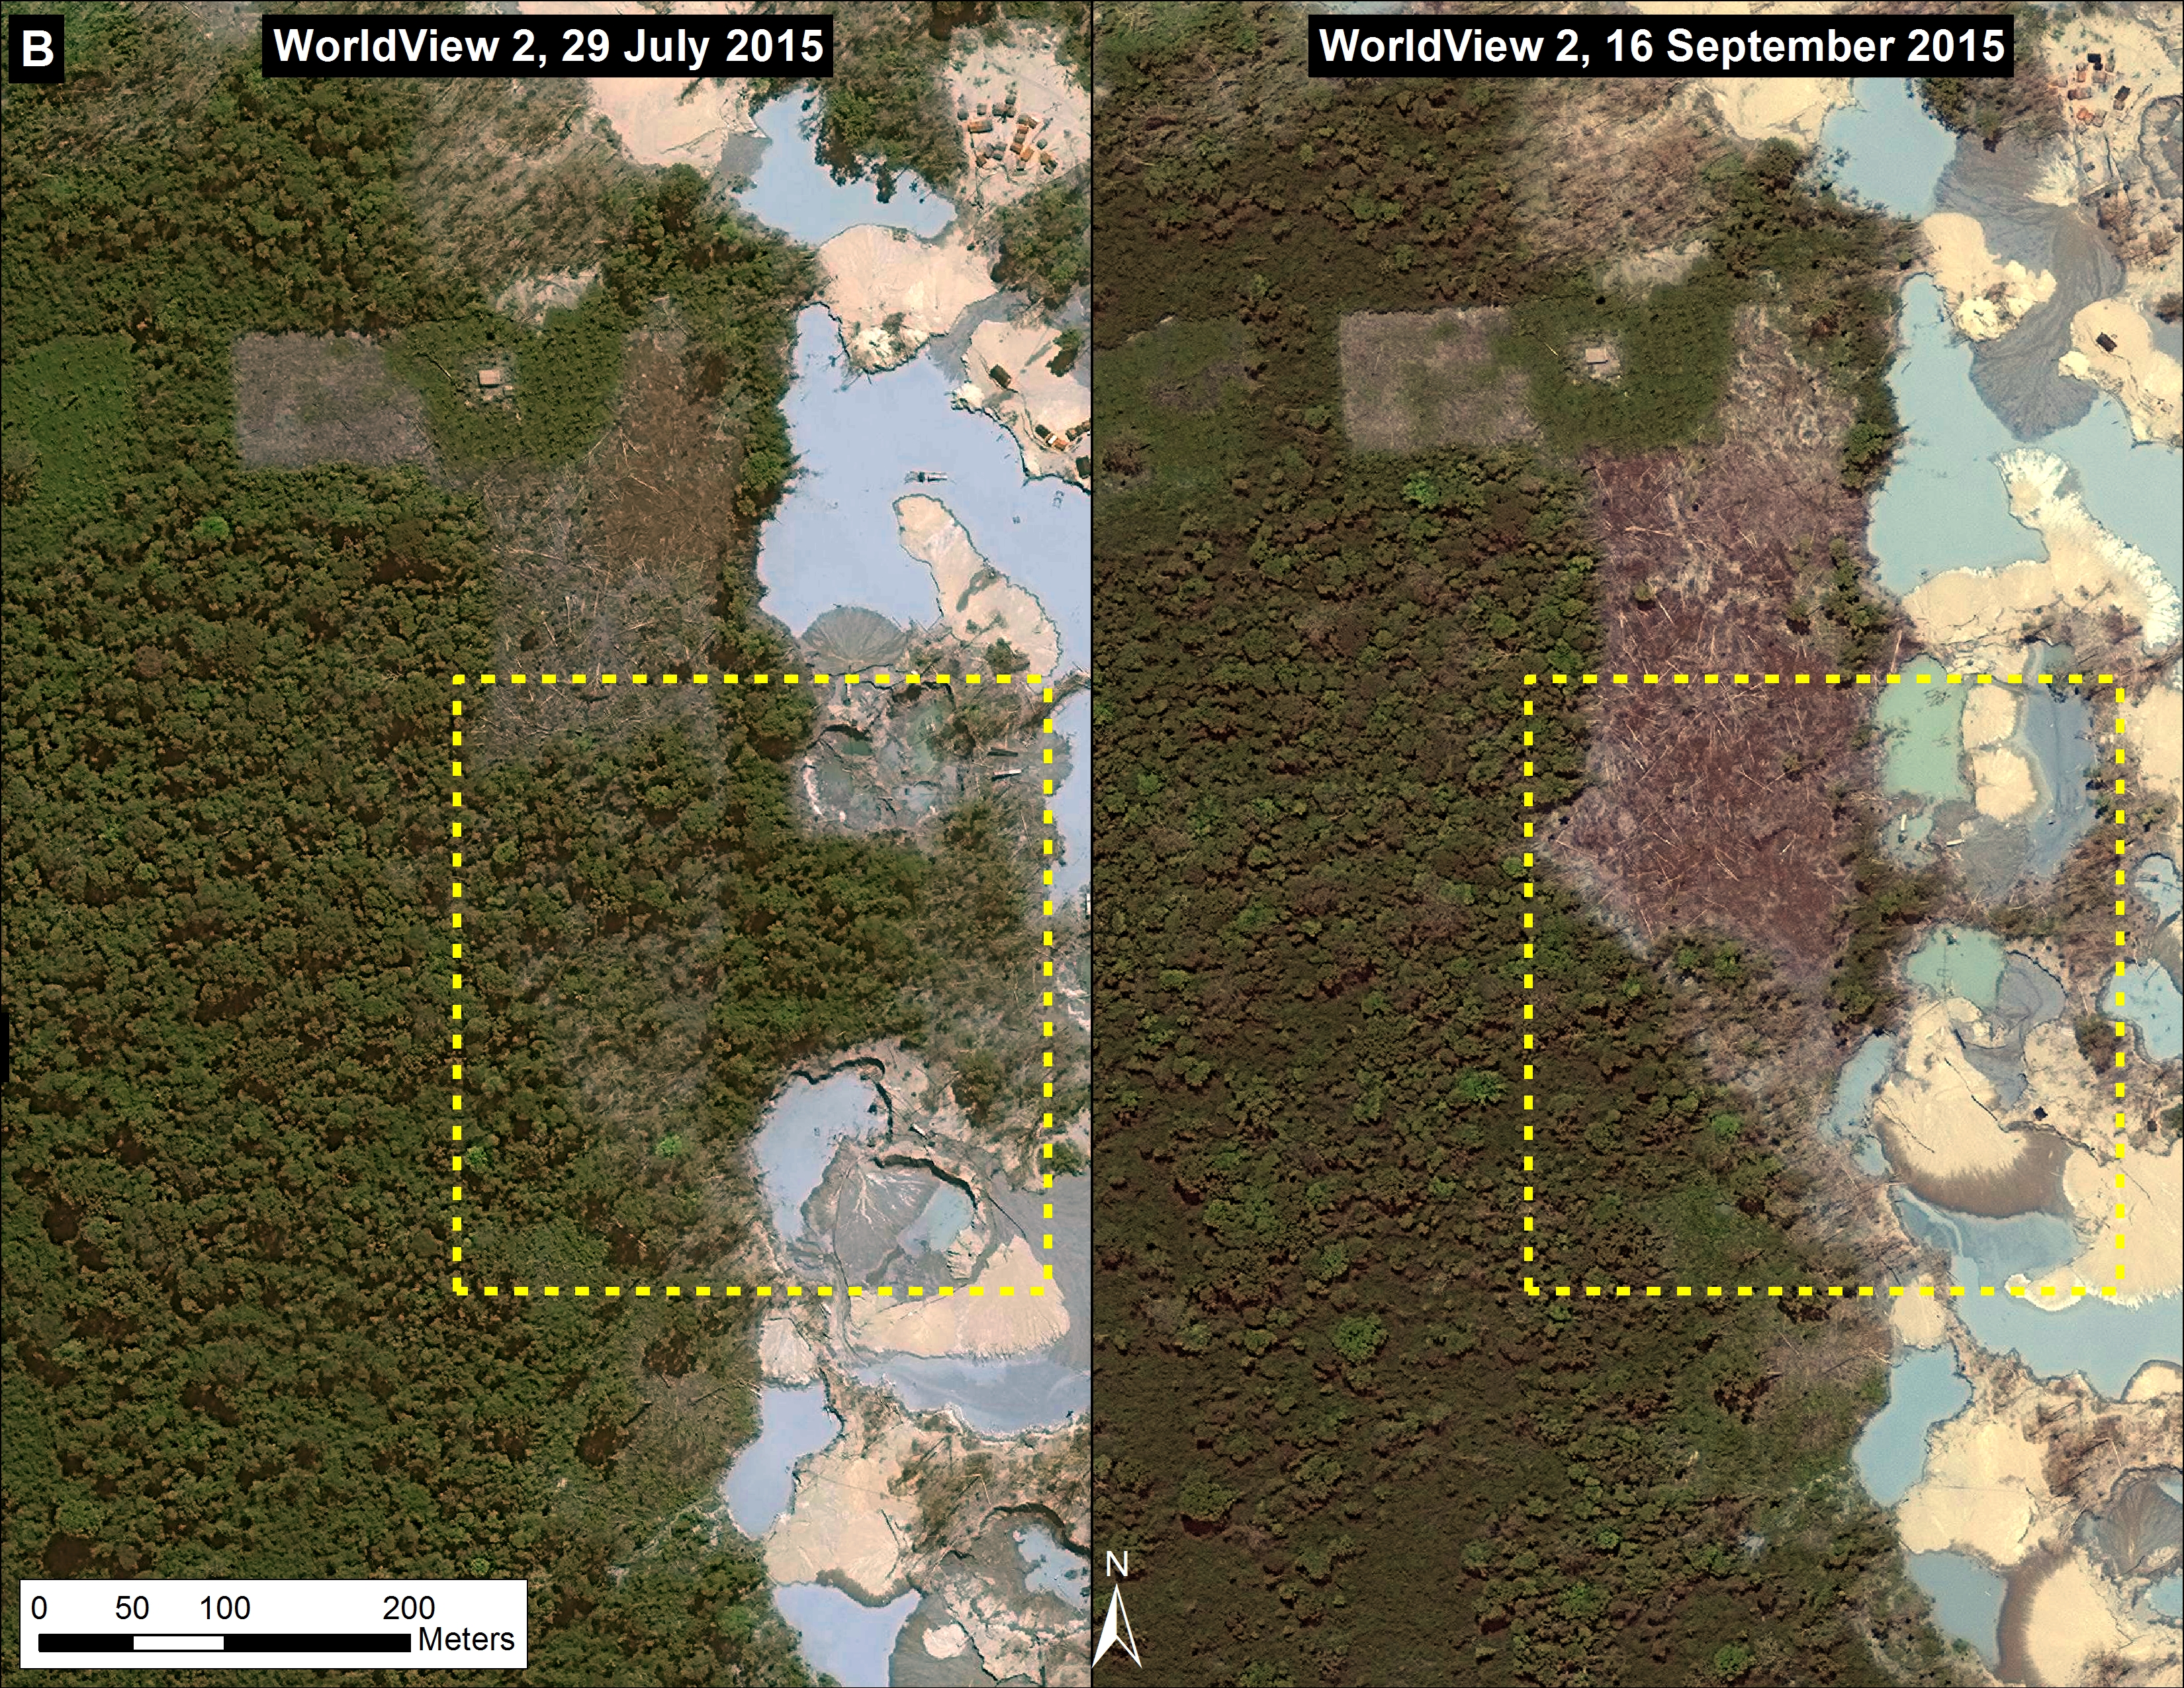
Image 26d shows detailed deforestation information for the area indicated in Inset B (from Image 26a). Note the extensive 2015 deforestation along the Aguaytia River (164 hectares, see pink areas). Recent deforestation (2012-14) appears to be associated with agricultural and logging activities.

Further below, Image 26e shows a high-resolution satellite image of the area in Inset B1 before (left panel) and after (right panel) the recent deforestation events.

MAAP_Coronel_Portillo_29c_v1_m_en
Image 26e. High-resolution view of area in Inset B1 before (left panel) and after (right panel) recent deforestation events. Data: WorldView-2 de Digital Globe (NextView).


Methodology

We conducted this analysis using the Kernel Density  tool from Spatial Analyst Tool Box of ArcGis 10.1 software. Our goal was to emphasize local concentrations of deforestation in the raw data while still representing overarching patterns of deforestation between 2012 and 2014. We accomplished this using the following parameters:

Search Radius: 15000 layer units (meters)

Kernel Density Function: Quartic kernel function

Cell Size in the map: 200 x 200 meters (4 hectares)

Everything else was left to the default setting.

Reference

1 Hansen, M.C., A. Krylov, A. Tyukavina, P.V. Potapov, S. Turubanova, B. Zutta, S. Ifo, B. Margono, F. Stolle, and R. Moore. Humid tropical forest disturbance alerts using Landsat data. Environmental Research Letters, in press. Accessed through Global Forest Watch on March 2, 2016. www.globalforestwatch.org

Citation

Finer M, Novoa S, Snelgrove C (2015) 2015 Deforestation Hotspots in the Peruvian Amazon. MAAP: 26.

MAAP #25: Deforestation Hotspots in the Peruvian Amazon, 2012-2014

Deforestation continues to increase in the Peruvian Amazon. According to the latest information from the Peruvian Environment Ministry1, 2014 had the highest annual forest loss on record since 2000 (177,500 hectares, or 438,600 acres per year). 2013 and 2012 had the third and fourth-highest annual forest loss totals, respectively (behind only 2009).

Source: PNCB/MINAM
Source: PNCB/MINAM

To better understand where this deforestation is concentrated, we conducted kernel density estimation. This type of analysis calculates the magnitude per unit area of a particular phenomenon (in this case, forest loss).

Image 25a shows the kernel density map for forest loss in the Peruvian Amazon between 2012 and 2014 and reveals that recent deforestation is concentrated in a number of “hotspots” in the departments of Loreto, San Martin, Ucyali, Huanuco, and Madre de Dios.

Insets A-D highlight four areas with high densities of forest loss described in previous MAAP articles. We are currently studying the other high density deforestation areas not included in the insets.


Inset A: Cacao in Loreto

Image 25a. Kernel density map for forest loss in the Peruvian Amazon between 2012 and 2014. Data: PNCB/MINAM, Hansen/UMD/Google/USGS/NASA.
Image Xb.
Image 25b. Deforestation for cacao in northern Peru between December 2012 (left panel) and September 2013 (center panel) and cumulative 2012-14 (right panel). Data: USGS, PNCB/MINAM, Hansen/UMD/Google/USGS/NASA

Inset A (from Image 25a) indicates the deforestation of over 2,000 hectares (4,940 acres) on property owned by the company United Cacao (through its wholly owned Peruvian subsidiary, Cacao del Peru Norte) near the town of Tamshiyacu in the department of Loreto. MAAP #9 demonstrated that much of this deforestation took place at the expense of primary forest. Image 25b highlights this area, showing the forest loss between December 2012 (left panel) and September 2013 (center panel; the pinkish areas indicate recently cleared forests). The right panel shows the cumulative deforestation between 2012 and 2014. See MAAP #9 and MAAP #2 for more details.


Inset B: Oil Palm in Loreto/San Martin

Peru_KD_B_3panel_v1
Image 25c. Deforestation for oil palm in northern Peru between September 2011 (left panel) and September 2014 (center panel) and cumulative 2012-14 (right panel). Data: USGS, PNCB/MINAM, Hansen/UMD/Google/USGS/NASA

Inset B (from Image 25a) indicates expanding deforestation within and around two large-scale oil palm plantations along the Loreto-San Martin border. Image 25c highlights this area, showing the forest loss between Setpember 2011 (left panel) and September 2014 (center panel). The right panel shows the cumulative deforestation between 2012 and 2014 (6,363 hectares, or 15,700 acres). See MAAP #16 for more details.

Inset C: Oil Palm in Ucayali

Image Xd.
Image 25d. Deforestation for oil palm in central Peru between September 2011 (left panel) and September 2013 (center panel) and cumulative 2012-14 (right panel). Data: USGS, PNCB/MINAM, Hansen/UMD/Google/USGS/NASA

Inset C (from Image 25a) indicates the deforestation of 9,400 hectares (23,200 acres) of primary forest for two large-scale oil palm plantations in the department of Ucayali. Image 25d highlights this area, showing the forest loss between September 2011 (left panel) and September 2013 (center panel; the pinkish-black areas indicate recently cleared forests). The right panel shows the cumulative deforestation between 2012 and 2014. See MAAP #4 for more details.

Inset D: Gold Mining in Madre de Dios

Peru_KD_D_3panel_v1
Image 25e. Deforestation for gold mining in southern Peru between September 2011 (left panel) and September 2014 (center panel) and cumulative 2012-14 (right panel). Data: USGS, PNCB/MINAM, Hansen/UMD/Google/USGS/NASA

Inset D (from Image 25a) indicates the extensive illegal gold mining deforestation in the buffer zone of Tambopata National Reserve in the department of Madre de Dios. Image 25e highlights this area, showing the forest loss between September 2011 (left panel) and September 2014 (center panel; the lighter areas indicate recently cleared forests). The right panel shows the cumulative deforestation between 2012 and 2014 (4,738 hectares, or 11,700 acres). See MAAP #1 for more details.

It is important to emphasize that in this case, extensive deforestation continued in 2015. See MAAP #12 and MAAP #24 for more details.

Methodology

We conducted this analysis using the Kernel Density  tool from Spatial Analyst Tool Box of ArcGis 10.1 software. Our goal was to emphasize local concentrations of deforestation in the raw data while still representing overarching patterns of deforestation between 2012 and 2014. We accomplished this using the following parameters:

Search Radius: 15000 layer units (meters)

Kernel Density Function: Quadratic

Cell Size in the map: 200 x 200 meters (4 hectares)

Everything else was left to the default setting.

References

1MINAGRI-SERFOR/MINAM-PNCB (2015) Compartiendo una visión para la prevención, control y sanción de la deforestación y tala ilegal.

Citation

Finer M, Snelgrove C, Novoa S (2015) Deforestation Hotspots in the Peruvian Amazon, 2012-2014. MAAP: 25.

MAAP #24: Illegal Gold Mining Penetrates Deeper into Tambopata National Reserve

*NoteDuring the preparation of this analysis, the Peruvian government conducted an operation against the illegal gold mining activity in the area described below (see this news article in Spanish for more information).

In MAAP #21, we revealed, using high-resolution images, the first sign of an invasion into the Tambopata National Reserve (an important natural protected area in the southern Peruvian Amazon) by illegal gold mining activities. Here in MAAP #24, we show two additional types of satellites imagery (due to lack of new high-resolution image) indicating that the illegal gold mining deforestation continues to penetrate deeper into the Reserve.

Image 24a. Landsat images showing the expansion of deforestation inside the Tambopata National Reserve between December 2015 (left panel) and January 2016 (right panel). Data: USGS, SERNANP.

Image 24a shows a comparison between two Landsat images (30 m resolution) indicating that the deforestation continued to increase within the Reserve between December 2015 (left panel) and January 2016 (right panel). The red circles indicate the general location of the newly deforested areas, which appear pink (soil without forest cover) and blue (wastewater pools) in contrast to the green (standing forest). The deforestation inside the Tambopata National Reserve between December 2015 and January 2016 is approximately 20 hectares (49 acres).

Image 24b is the base map showing the area described above in a larger context. The red inset box indicates the area shown in Image 24a.

Image 24b. Reference Map of mining area. Data: SERNANP, WorldView-2 of Digital Globe (NextView).

Radar: Powerful New Tool

Image 24c. Radar images showing the expansion of deforestation inside the Tambopata National Reserve between November 2015 (left panel) and January 2016 (right panel) Data: SERNANP, Sentinel-1

Image 24c shows, for the first time in MAAP, information from a radar satellite (Sentinel-1 from the European Space Agency). Unlike multi-spectral Landsat imagery that is vulnerable to clouds blocking the view, radar imagery is useful year-round (even the Amazon rainy season) because it can penetrate through cloud cover. In the displayed images, the shades of gray are related to the topography and the height of the forest. Lower areas, such as recently deforested lands and bodies of water, appear darker (almost black) in color, while higher areas such as standing forests appear lighter in color. Image 24c confirms the increase in deforestation between November 2015 (left panel) and January 2016 (right panel) within the area indicated above (see the red boxes).

Citation

Finer M, Novoa S, Olexy T (2016) Illegal Gold Mining Penetrates Deeper into Tambopata National Reserve. MAAP: 24.

MAAP #23: Increasing Deforestation along lower Las Piedras River (Madre de Dios, Peru)

The Las Piedras River in the southern Peruvian Amazon (department of Madre de Dios) is increasingly recognized for its outstanding wildlife (for example, see this video by naturalist and explorer Paul Rosolie, and this trailer for the upcoming film Uncharted Amazon). As seen in Image 23a, its headwaters are born in the Alto Purus National Park, but the lower Las Piedras is surrounded by a mix of different types of forestry concessions (logging, Brazil nut harvesting, ecotourism, and reforestation).

Here in MAAP #23, we document the growing deforestation on the lower Las Piedras River in the area surrounding the community of Lucerna (see red box in Image 23a for context).

Image Xa. Las Piedras River and surrounding designations. Data: MINAGRI, IBC, SERNANP.
Image 23a. Las Piedras River and surrounding designations. Data: MINAGRI, IBC, SERNANP.

Deforestation Analysis

Image 23b shows our deforestation analysis for an area along the lower Las Piedras River near the community of Lucerna (see red box in Image 23a for context). We found a sharp increase in deforestation starting in 2012. In the 11 years between 2000 and 2011, we detected the deforestation of 88 hectares (218 acres). In contrast, in the 4 years between 2012 and 2015, we detected the deforestation of 472 hectares (1,166 acres). 2015 had the highest deforestation total with 155 hectares (383 acres).

Image Xb. Lower Las Piedras River deforestation analysis. Data: MINAGRI, PNCB/MINAM, Hansen/UMD/Google/USGS/NASA.
Image 23b. Lower Las Piedras River deforestation analysis. Data: MINAGRI, CLASlite, PNCB/MINAM, Hansen/UMD/Google/USGS/NASA.

Note that the Las Piedras Amazon Center (LPAC) Ecotourism Concession represents an effective barrier to deforestation. However, note that two other, less active, ecotourism concessions are experiencing extensive deforestation. The 4,460 hectare LPAC concession (which was created in 2007 and transferred to ARCAmazon in March 2015) hosts an active tourist lodge, research center,  and Forest Ranger Protection Program, which employs local people to patrol the area while monitoring wildlife and human impacts.

Image Xc. Recent Landsat image showing deforestation along lower Las Piedras. Data: USGS,MINAGRI.
Image 23c. Recent Landsat image showing deforestation along lower Las Piedras. Data: USGS,MINAGRI.

Image 23c shows a very recent (December 2015) Landsat image of the deforestation highlighted in Image 23b. The pinkish-red areas indicate the most recently cleared forests. We have received information indicating that much of this new deforestation is associated with cacao plantations. Cacao is of course used to produce chocolate.

Citation

Finer M, Pena N (2015) Increasing Deforestation along lower Las Piedras River (Madre de Dios, Peru). MAAP #23

MAAP #22: Yaguas – Another Big Conservation Opportunity for Peru

Peru recently celebrated a major conservation victory for 2015 with the creation of Sierra del Divisor National Park. Prior to this announcement, Sierra del Divisor was classified as a Reserved Zone, which is a temporary measure to protect an area of biological importance until the government is able to determine a final designation. In these cases, national park status represents the strongest possible final designation.

Now in 2016, there is the opportunity for another major conservation victory in Peru: creation of Yaguas National Park. Yaguas received Reserved Zone status in 2011 and is now awaiting its final designation. Yaguas Reserved Zone is both big (868,928 hectares or 2,147,168 acres) and remote, located in extreme northeast Peru within the department of Loreto (see Image 22a).

1. MAAP_Yaguas_2x_a_v4
Image 22a. Yaguas Reserved Zone. Data: USGS, SERNANP, PNCB/MINAM, Hansen/UMD/Google/USGS/NASA

Note that Yaguas is a critical part of a series of protected areas that provide landscape level biological connectivity in northeast Peru. In addition, Yaguas borders and complements a large protected Colombian landscape, forming one of the largest assemblies of protected areas and indigenous lands in the Amazon.

Deforestation Analysis

Yaguas Reserved Zone is the rare example of an area in extremely good conservation condition. As seen In Image 22b, we detected virtually no deforestation within or surrounding the reserve. Note that the background in Image 22b is a Landsat image (30 m resolution) from December 2015 showing the reserve is completely covered with intact forest.

2. MAAP_Yaguas_a_v2_es
Image 22b. Yaguas Deforestation analysis. Data: USGS, PNCB/MINAM, Hansen/UMD/Google/USGS/NASA, MINAGRI, SERNANP

Carbon Analysis

Dr. Greg Asner (Carnegie Institution for Science) and the Peruvian Ministry of the Environment recently produced a high-resolution carbon map of Peru (Asner et al. 2014 a,b). As seen in Image 22c, much of the reserve contains very high carbon levels. Using this data, we calculated that Yaguas Reserved Zone contains approximately 102 million metric tons of above-ground carbon, one of the highest totals for a protected area in all of Peru.

3. MAAP_Yaguas_carbono
Image 22c. High-resolution carbon geography of the Yaguas Reserved Zone. Data: Asner et al. 2014 a,b.

Asner GP, Knapp DE, Martin RE, Tupayachi R, Anderson CB, et al. (2014 a) Targeted carbon conservation at national scales with high-resolution monitoring. Proceedings of the National Academy of Sciences111(47), E5016-E5022.

Asner GP, Knapp DE, Martin RE, Tupayachi R, Anderson CB, et al. (2014 b) The high-resolution carbon geography of Peru. Berkeley, CA: Minuteman Press.

Biodiversity

The Yaguas Reserved Zone also contains extremely high levels of biodiversity, particularly for fish. In fact, according to a rapid biological inventory by the Field Museum in 2010, Yaguas may be home to the highest fish diversity in Peru. During the inventory, scientists recorded 337 fish species in three weeks, far more than any other rapid inventory in Peru (see Image 22d). Biologists estimate that Yaguas is home to around 550 fish species, making it one of South America’s most diverse aquatic ecosystems.

The Reserved Zone (and proposed national park) was specifically designed to protect this extraordinary aquatic diversity. It contains a complete gradient of lowland river aquatic habitats, from headwaters (first order and intermediate) and springs to lowland areas encompasing habitats such as floodplains, lakes, swamps, bogs, and a meandering main river (see Images 22e and 22f). Importantly, unlike most of the major rivers protected by Peruvian national parks, the Yaguas River is born in the Amazon lowlands, not in the Andes. Thus, it contains hydrological processes and riparian habitats that are not yet strictly protected by the Peruvian system of protected areas.

Image Xd. Number of fish species recorded in rapid inventories of the Yaguas Reserved Zone and 10 other sites in Loreto, Peru. Data: http://fm2.fieldmuseum.org/rbi/results.asp
Image 22d. Number of fish species recorded in rapid inventories of the Yaguas Reserved Zone and 10 other sites in Loreto, Peru. Data: http://fm2.fieldmuseum.org/rbi/results.asp


Image Xe. Aerial view of Yaguas River. Photo Credit: Alvaro del Campo (Field Museum)
Image 22e. Aerial view of Yaguas River. Photo Credit: Alvaro del Campo (Field Museum)
Quebrada_Cachimbo_1_ADC
Image 22f. Aerial view of Yaguas River and the Cachimbo tributary. Photo Credit: Alvaro del Campo (Field Museum)

References:

Hidalgo, M. H., y A. Ortega-Lara. 2011. Peces. Pp. 98–108 y 308–329 en N. Pitman, C. Vriesendorp, D. K. Moskovits, R. von May, D. Alvira, T. Wachter, D. F. Stotz y Á. del Campo, eds. Perú: Yaguas-Cotuhé. Rapid Biological and Social Inventories Report 23. The Field Museum, Chicago. http://fm2.fieldmuseum.org/rbi/results_23.asp

Pitman, N., C. Vriesendorp, D. K. Moskovits, R. von May, D. Alvira, T. Wachter, D. F. Stotz y Á. del Campo, eds. 2011. Perú: Yaguas-Cotuhé. Rapid Biological and Social Inventories Report 23. The Field Museum, Chicago. http://fm2.fieldmuseum.org/rbi/results_23.asp

Acknowledgments

We thank the Field Museum and Instituto del Bien Común for helpful comments and information.

Citation

Finer M, Novoa S (2015) Another Big Conservation Opportunity for Peru: Yaguas.


MAAP #21: Illegal Gold Mining Deforestation Enters Tambopata National Reserve (Madre de Dios, Peru) [High-Resolution View]

*Note: During the review process for this article, a major operation against illegal mining activities was carried out by the Peruvian government in the area described below.

Image 21a illustrates a recent illegal gold mining invasion of the Tambopata National Reserve. Tambopata is an important protected area in the southern Peruvian Amazon (department of Madre de Dios). Image 21a compares two high-resolution (0.5 m) images taken two months apart over the same area along the northern border of the reserve. One can clearly see the beginning of the illegal gold mining activity and deforestation within the reserve between September (left panel) and November (right panel) 2015. For more context regarding the area in question, see the yellow box in Image 21b.

Image 20a. Recent invasion of Tambopata National Reserve. Data: SERNANP, WorldView-2 and WorldView-3 of Digital Globe (NextView).
Image 21a. Recent invasion of Tambopata National Reserve. Data: SERNANP, WorldView-2 and WorldView-3 of Digital Globe (NextView).

Reference Map

Image 21b is a reference map showing the above detailed area in the larger context between the northern border of the Tambopata National Reserve and the illegal gold mining zone known as La Pampa. The yellow box corresponds to the area detailed in Image 21a. Note that the original boundary of the reserve created in 2000 no longer coincides with the route of the Malinowski River due to its natural movement over time.

Image 20b. Reference Map. Data: SERNANP, WorldView-2 of Digital Globe (NextView).
Image 21b. Reference Map. Data: SERNANP, WorldView-2 of Digital Globe (NextView).

Deforestation Data

Image 21c presents an updated analysis of the deforestation in the area between La Pampa and the Tambopata National Reserve. In this specific area, we documented the deforestation of 2,518 hectares (6,222 acres) between 2013 and 2015, the vast majority of which is clearly linked to illegal gold mining activities. The majority of this recent deforestation has occurred in La Pampa, a bit north of the reserve (but within its buffer zone). However, recent deforestation has also occurred along the Malinowski river, which forms the northern boundary of the reserve in this area.

Imagen 3. Análisis de deforestacion. Fuentes: SERNANP, USGS, WorldView-2 de Digital Globe (NextView).
Image 21c. Analysis of deforestation. Data: CLASlite, Hansen/UMD/Google/USGS/NASA, SERNANP, USGS, WorldView-2 of Digital Globe (NextView).

In Image 21c, the data from 2000-2014 came from Hansen/UMD/Google/USGS/NASA, while the data from 2015 came from our own analysis using CLASlite.

Citation

Finer M, Novoa S, Snelgrove C, Peña N (2015) Confirming an Illegal Gold Mining Invasion of the Tambopata National Reserve (Madre de Dios, Peru) [High-Resolution View]. MAAP #21.

MAAP #20: New Airstrip in Coca-growing Area within Bahuaja Sonene National Park (Puno, Peru)

MAAP #10 detailed the extensive deforestation between 2000 and 2014 (538 hectares or 1,329 acres) in the Colorado sector of Bahuaja Sonene National Park, an important protected area in the southern Peruvian Amazon. Additionally, we described how this sector has a high density of coca plantations, one of the main drivers of the observed deforestation. Coca has many traditional uses in Andean cultures, but is also used to produce cocaine.

Here in MAAP #20, we show that in 2015 the deforestation has continued in this sector of the park. Moreover, as seen in Image 20a, we detected the construction of a new airstrip in a nearby remote area part of the park that is likely being used for transporting coca.

Image 21a. High-resolution view of the area designated for a landing strip, inside Bahuaja Sonene National Park. See Zoom A in Image 21c for context. Data: WorldView-2 of Digital Globe (NextView).
Image 20a. High-resolution view of the area designated for a landing strip, inside Bahuaja Sonene National Park. See Zoom A in Image 20c for context. Data: WorldView-2 of Digital Globe (NextView).

Airstrip

Image 20a shows a high-resolution (0.5 m) image of the new airstrip, which is 580 meters long and 8 meters wide (in addition, see Zoom A in Image 20c for context). It is characteristic of an airstrip designed for a single-engine plane.  As seen in Image 20b, the airstrip was constructed between May and June 2015. In addition, Image 20c, shows that the airstrip is located within the zones of strict and wildlife protection. It appears that a previous airstrip was constructed in this same area in 2013, but became overgrown 2014. It is worth noting that there are no native communities in this area.

Image 21b. Comparison of these two Landsat images from 2015 shows the area that has been designated as an airplane landing strip. Data: USGS.
Image 20b. Comparison of these two Landsat images from 2015 shows the area that has been designated as an airplane landing strip. Data: USGS.

Reference Map

Image 20c shows the reference map for this article. It shows the Colorado sector of Bahuaja Sonene National Park. Zoom A corresponds to the airstrip described above, while Zoom B corresponds to the new deforestation analysis described below.

Image 21c. Deforestation detected inside the Colorado zone of Bahuaja Sonene National Park. Data: SERNANP, MINAM/PNCB, CLASlite, USGS, WCS.
Image 20c. Deforestation detected inside the Colorado zone of Bahuaja Sonene National Park. Data: SERNANP, MINAM/PNCB, CLASlite, USGS, WCS.

New Deforested Areas associated with Coca Cultivation

Image 20d shows a comparison of two high-resolution images showing the deforestation of 40 hectares (99 acres) between October 2014 (left panel) and October 2015 (right panel). The yellow dashed circles indicate the newly deforested areas, which are near previous coca plantations. In addition, Image 20c shows that these newly deforested areas are located within the zones of strict and wildlife protection.

Imagen 20d. Zoom “B” mostrando nuevas áreas deforestadas en dos imágenes de alta resolución. Fuentes: SPOT, WorldView-2 de Digital Globe (NextView).
Image 20d. Zoom “B” shows newly deforested areas in two high-resolution images. Data: SPOT, WorldView-2 of Digital Globe (NextView).

Citation

Novoa S, Finer M (2015) New Airstrip in Coca-growing Area within Bahuaja Sonene National Park (Puno, Peru). MAAP: 20.

MAAP #19: Gold Mining Deforestation Advancing along Upper Malinowski River (Madre de Dios, Peru)

In MAAP #5, we described the intensifying deforestation along the Upper Malinowski River in the department of Madre de Dios, Peru. Here in MAAP #19, we update this information and confirm that the deforestation continues at a rapid pace. This finding is based on analysis of three high-resolution images between September 2014 and November 2015. As described below, we document the deforestation of 392 hectares (969 acres) between September 2014 and November 2015 due to gold mining along the Upper Malinowki River.

Image 19a. Gold mining deforestation between September 2014 and 2015 along Upper Malinowski. Data: SERNANP, WorldView-2 from Digital Globe (NextView).

Image 19a shows a comparison of two high resolution (0.5 m) images taken one year apart over the same area along the Upper Malinowski River (left panel is from September 2014, while the right panel is from September 2015). Comparison analysis of these images reveals two primary findings. First, deforestation is rapidly spreading upstream along the Upper Malinowski and its tributaries.

Second, this deforestation is nearing the border of the Bahuaja Sonene National Park boundary (see Image 19b).

Image 19b. Zoom de la deforestación de minería aurífera cerca el Parque Nacional Bahuaja Sonene (ver Cuadro A en Imagen 19a por el contexto). Datos: SERNANP, WorldView-2 de Digital Globe (NextView).
Image 19b. Zoom of gold mining deforestation near the Bahuaja Sonene National Park. Data: SERNANP, WorldView-2 from Digital Globe (NextView).

Deforestation Analysis

Image 19c is a detailed deforestation analysis between the two images. We documented the deforestation of 352 hectares (870 acres) due to gold mining activities between September 2014 and September 2015 along the Upper Malinowski (note: this calculation covers the area displayed in Image 19a).

Image 19c. Deforestation analysis between September and November 2015 along the Upper Malinowski. Data: CLASlite, SERNANP, WorldView-2 from Digital Globe (NextView).

During preparation of this article, a new high resolution image over the same area from November 2015 became available. As an indication of how rapidly the gold mining is advancing, we documented an additional deforestation of 40 hectares (99 acres) between September and November 2015.

Thus, we documented a total deforestation of 392 hectares (969 acres) between September 2014 and November 2015 along the Upper Malinowki.

Two Gold Mining Deforestation Fronts

The Upper Malinowki is just west (and upstream) of the mining zone known as La Pampa featured in MAAP articles #1, #12, and #17. These currently appear to be the two major gold mining deforestation fronts in Madre de Dios. Image 19b illustrates the general location of these two areas (“C” indicates La Pampa and “D” indicates the Upper Malinowski). Note that La Pampa is within the buffer zone of the Tambopata National Reserve and the Upper Malinowski is within the buffer zone of the Bahuaja Sonene National Park.

Imagen 19d. Fuentes:
Imagen 19d. General location of the Alto Malinowski (“D”) and La Pampa (“C”). Data: CLASlite, MINAM, SERNANP, ACCA, Hansen/UMD/Google/USGS/NASA, USGS.

Citation

Finer M, Snelgrove C (2015) Gold Mining Deforestation Rapidly Advancing along Upper Malinowski River (Madre de Dios, Peru). MAAP: 19.

MAAP #18: Proliferation of Logging Roads in the Peruvian Amazon

MAAP articles #3 and #15 detailed the construction of several new logging roads in the central Peruvian Amazon. Here in MAAP 18, we provide a more comprehensive analysis of the proliferation of logging roads in this section of the Amazon. In Image 18a, we show a high resolution example of a new logging road in this area with active construction during 2015 (see Inset A1 in Image 18c for more context).

new18a v2
Image 18a. New logging road in the Peruvian Amazon. Data: WorldView-2 of Digital Globe (NextView).

Image 18b illustrates the location of all identified logging roads in the central Peruvian Amazon (southern Loreto and northern Ucayali). Most of these roads are located along the Ucayali River and its headwater tributaries. The left panel highlights just the logging roads, while the right panel also includes protected areas, native communities, and logging concessions.

Image 18b. Logging roads in the central Peruvian Amazon. Data: SERNANP, IBC, USGS, MINAGRI.

In Image 18b, we documented the construction of 1,134 km of logging roads between 2013 and 2015 in the central Peruvian Amazon. Of this total, 538 km is in the matrix of logging concessions and native communities in southern Ucayali, 226.1 km is in undesiganted areas in southern Loreto, 210 km is in the buffer zone of Cordillera Azul National Park, and 159 km is around the new Sierra del Divisor National Park.

Note that the buffer zone of Cordillera Azul National Park and surroundings of Sierra del Divisor National Park contain logging concessions and native communities, thus the responsibility of forest authority is the regional government.

Determining the legality of these roads is complex. As the right panel highlights, many of these roads are near logging concessions and native communities, whom may have obtained the rights for logging from the relevant forestry authority (in many cases, the regional government).

Below, we focus on the logging roads in the northern section of Image 18b (see Inset A).

Zoom A: Logging Roads in Southern Loreto/Northern Ucayali

Image 18c. Logging roads in southern Loreto/northern Ucayali. Data: SERNANP, IBC, USGS, MINAGRI.

Image 18c is a zoom of the logging roads shown in the northern section of Image 18a (Inset A), located in southern Loreto and northern Ucayali. It shows five primary areas of interest. Both Insets A1 and A2 correspond to new roads within the southeast buffer zone of the Cordillera Azul National Park with active construction in 2015 (see below for more details).

Insets A3, A4, and A5 correspond to roads with active construction between 2013 and 2015 that have already been featured on MAAP. Inset 3 includes a logging road in the northeast sector of the buffer zone of Cordillera Azul National Park (see MAAP #3 for more details). Insets 3 and 5 show logging roads around the new Sierra del Divisor National Park (see MAAP #15 and MAAP #7 for more details).

Zoom A1: Logging Roads in Nuevo Irazola

Image 18d provides more details about a new logging road with very recent construction within the southeast buffer zone of Cordillera Azul National Park (See Inset A1 in Image 18C for context). This road has grown 68 km between 2013 and 2015, with more than half of this construction occurring over the past year. According to information obtained from the forestry department within the Regional Government of Ucayali (PRMRFFS), the native community of Nuevo Irazola made a logging permission request for industrial and/or commercial use and prepared an Annual Operating Plan. However, a high-resolution (0.5 m) image shows a recent stretch of the road exceeds the area requested for forestry activities (see Image 18d).

MAAP_Ucayali_roads_18c_vALYSSA
Image 18d. High-resolution image of a new forest road in the southeast buffer zone of Cordillera Azul National Park. Data: WorldView-2 of Digital Globe (NextView).

Zoom A2: Rapid Expansion of a Logging Road

Image 18e. Rapid construction of a forest road in the southeast buffer zone of Cordillera Azul National Park. Data: USGS.
Image 18e. Time series of a forest road in the southeast buffer zone of Cordillera Azul National Park. Data: USGS.

Image 18e illustrates the rapid expansion of another forest road located in the southeast section of the Cordillera Azul National Park buffer zone (See Inset A2 in Image 18C for context). We documented the construction of 29.1 km during the six weeks between September 10 (left panel) and October 20 (right panel), a rate of nearly five kilometers per week. The legality of this road is currently unknown, but note that it is extending in the direction of a forestry concession.

Citation

Novoa S, Fuentes MT, Finer M, Pena N, Julca J (2015) Proliferation of Logging Roads in the Peruvian Amazon. MAAP #18.

Note: MAAP #18 is a collaborative effort between Amazon Conservation Association (ACA), Conservación Amazónica (ACCA), and the Centro de Conservación Investigación y Manejo de Áreas Naturales (CIMA).

MAAP 17: Birth of a New Illegal Gold Mining Zone in the Peruvian Amazon [High Resolution View]

In MAAP #12, we featured a high resolution image from July 29, 2015 of the area known as “La Pampa,” a hotspot of illegal mining in the buffer zone of the Tambopata National Reserve (Madre de Dios region, Peru).

Just seven weeks later, we obtained a new high resolution image of La Pampa for September 16, 2015. Image 17a shows the birth of a new gold mining zone between the July image (left panel) and September image (right panel) (see the letter “A” in Image 17b for context). The current extent of this new clearing is 1.5 hectares. This mining activity is illegal since it is located within the buffer zone of the Tambopata National Reserve.

La Pampa 20150916_ZoomA_horizontalV3

Reference Map

Image 17b is the reference map, showing the forest cover change between July (left panel) and September (right panel) 2015. In the right panel, the letter “A” corresponds to Image 17a, while the letter “B” corresponds to Image 17c.

Image 17b. Reference map. Data: WorldView Digital Globe (NextView).

Expanding Deforestation

Image 17c shows the deforestation expanding to the west between July (left panel) and September (right panel) 2015.

La Pampa 20150916_ZoomB_english
Image 17c. Deforestation expanding to the west between July and September 2015. Data: WorldView Digital Globe (NextView).

Citation

Finer M, Olexy T (2015) High Resolution View: Birth of a New Illegal Mining Zone. MAAP #17.