MAAP #36: New Gold Mining Frontier in the Northern Peruvian Amazon

In several previous MAAP articles, we have detailed gold mining deforestation in the southern Peruvian Amazon. Here, we provide evidence of the first known case of gold mining deforestation in northern Peru.

A recent news article published by the Peruvian organization DAR reported that gold mining activity continues to increase in the Santiago River (see Image 36a), located in the Amazonas region of the northern Peruvian Amazon. The article also mentions that this gold mining activity is no longer restricted to the river, but is now entering the forest. There are mining concessions in the area, but according to a recent article published in The Guardian, the miners are not operating legally with permission from the concessionaire.

Here, we show the first satellite images that confirm that the mining activity is indeed causing deforestation along the Santiago River (see below). Click each image to enlarge.

Imagen Xa. Crédito: DAR
Image 36a. Credit: DAR, April 2016

Satellite Images of Gold Mining Deforestation in Northern Peru

Image 36b shows a high-resolution image of the newly deforested area due to mining activity along the Santiago River (see yellow circle). The total forest loss to date is 8 hectares (20 acres).

Imagen Xa. Datos: Planet Labs
Image 36b. Data: Planet Labs

Image 36c shows that the deforestation occurred between August 2014 (left panel) and August 2015 (right panel).

Image 35c. Data: USGS/NASA
Image 36c. Data: USGS/NASA

Citation

Finer M, Novoa S (2016) Gold Mining Deforestation in the Northern Peruvian Amazon. MAAP: 36.

MAAP #35: Confirming Amazon Deforestation by United Cacao in 2013 [High Res View]

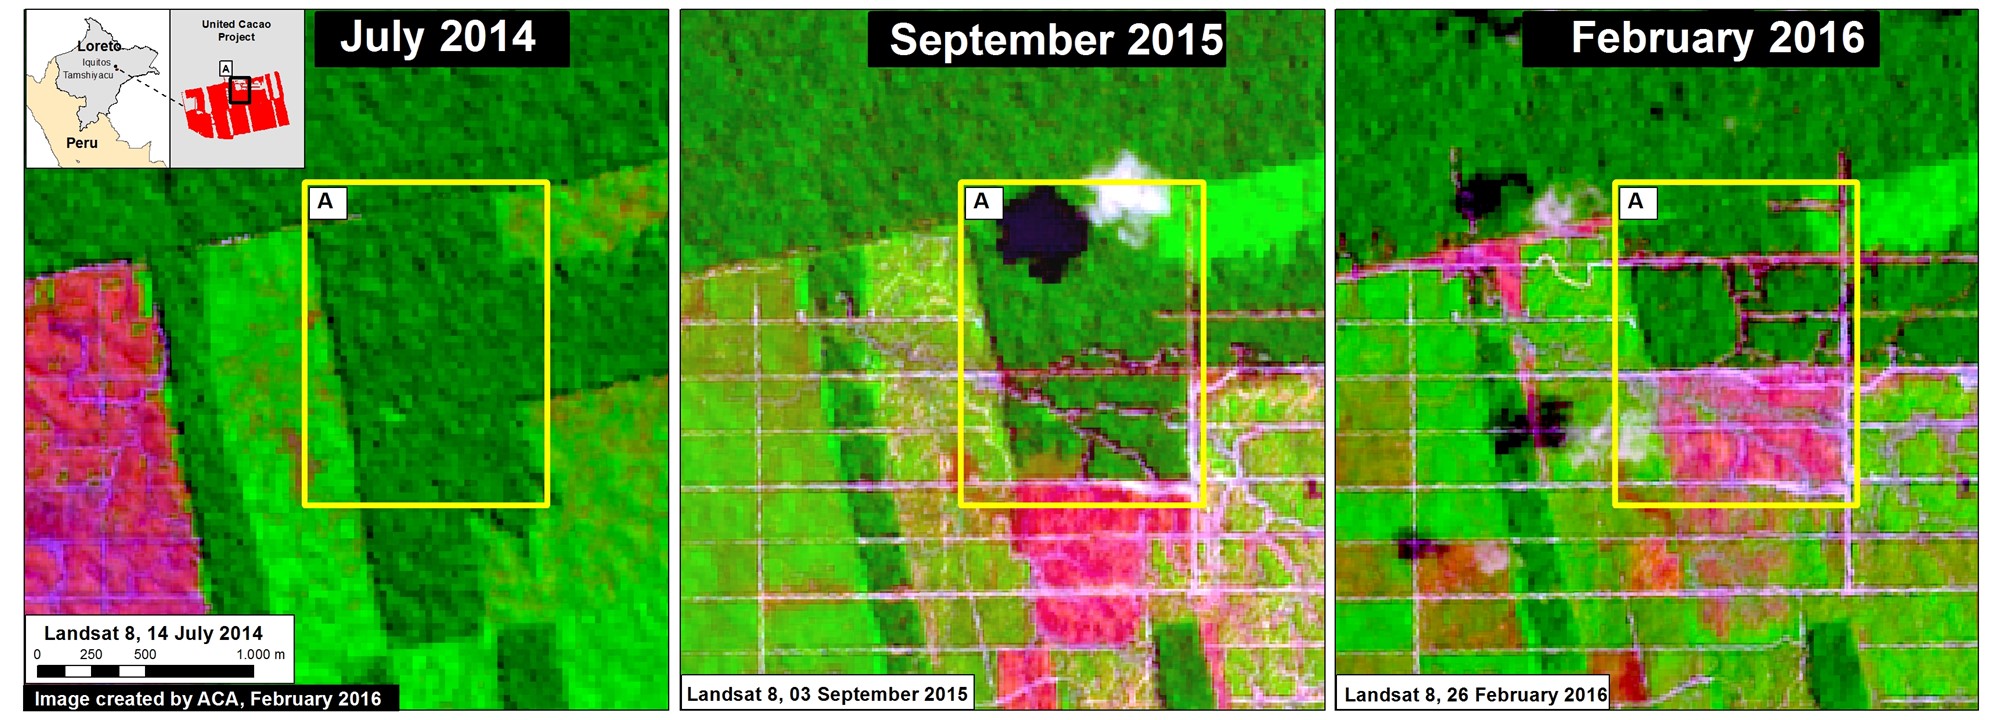
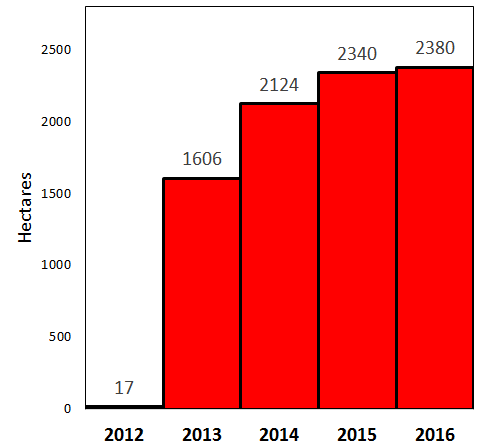
To date, we have published 4 MAAP articles* tracking deforestation by the company United Cacao in the northern Peruvian Amazon (outside the town of Tamshiyacu in the Loreto region). In these articles, based on analysis of satellite imagery, we have documented the deforestation of 2,380 hectares (5,880 acres) related to this project.

The company, however, continues to deny this deforestation**. In general, their main response seems to be that the land in question had been deforested for previous agricultural projects prior to their arrival in 2013.

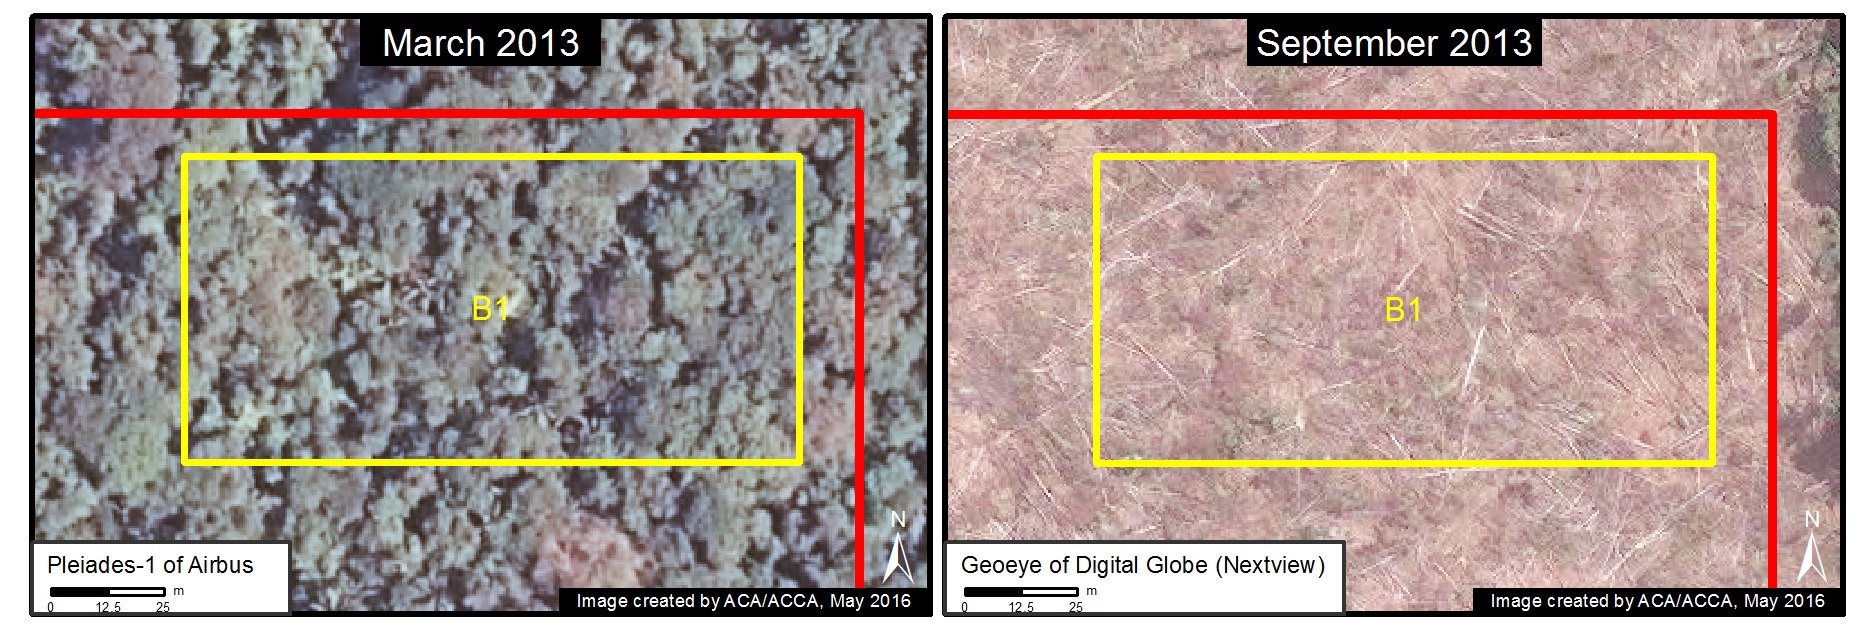
Here in MAAP #35, we show definitively that this assertion simply does not match the satellite evidence. This article is based on analysis of recently-acquired satellite images from early 2013, the time period that the cacao project began. These images show, in extremely high resolution, the large-scale deforestation of primary forest in the project area between March and September 2013.*** Click each image to enlarge.

It is important to resolve the deforestation-related issues because the company has plans to expand its agricultural land bank in the coming years. Please see this recent statement from the Peruvian Forestry Service (SERFOR) for details on the legal aspect of this case.

As a reference, at the end of the article there is a graphic (Image 35l) illustrating the difference (as seen in high-resolution imagery) between primary forest, secondary vegetation, agricultural areas, and deforested areas.

New Evidence of Large-Scale Deforestation in 2013

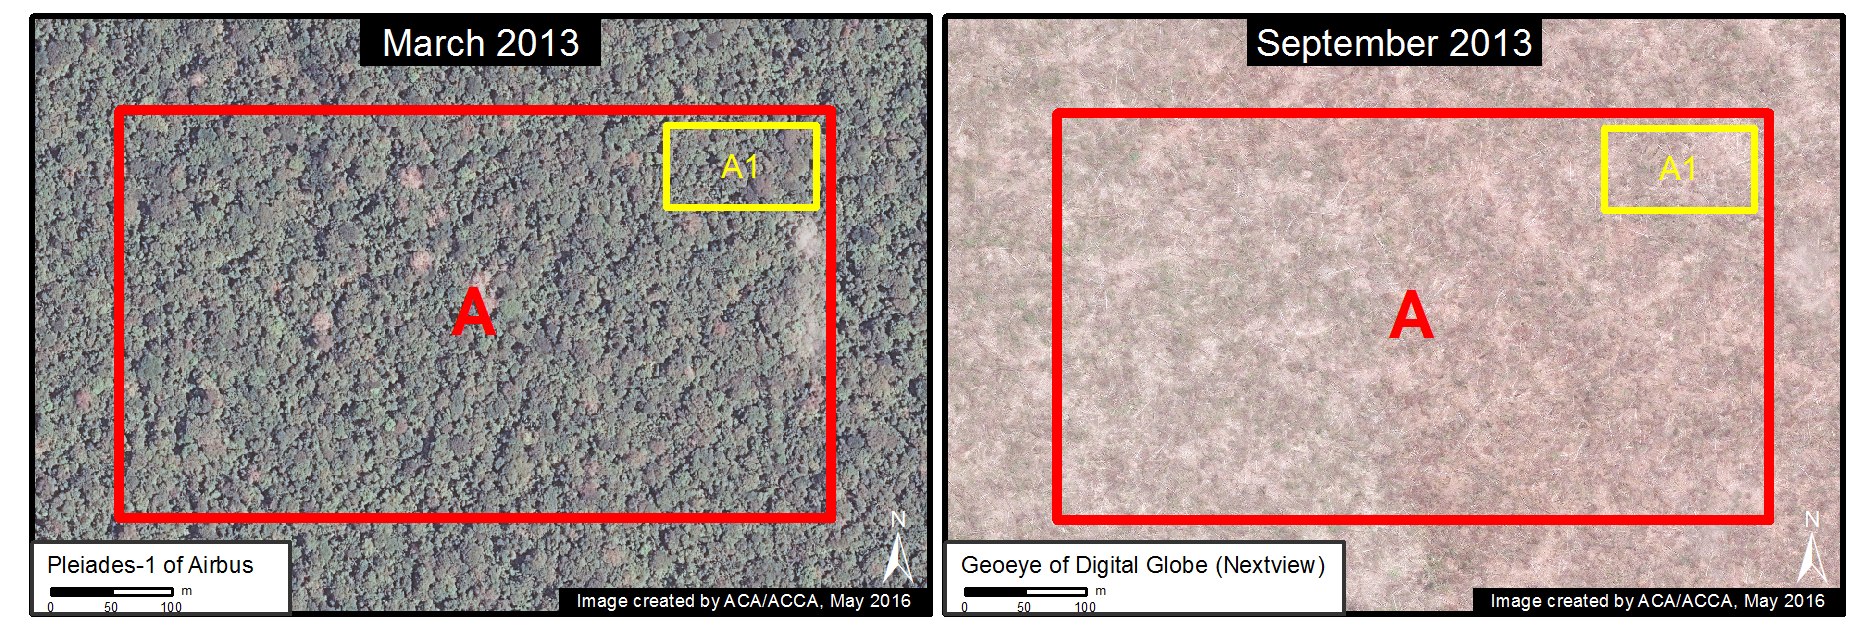
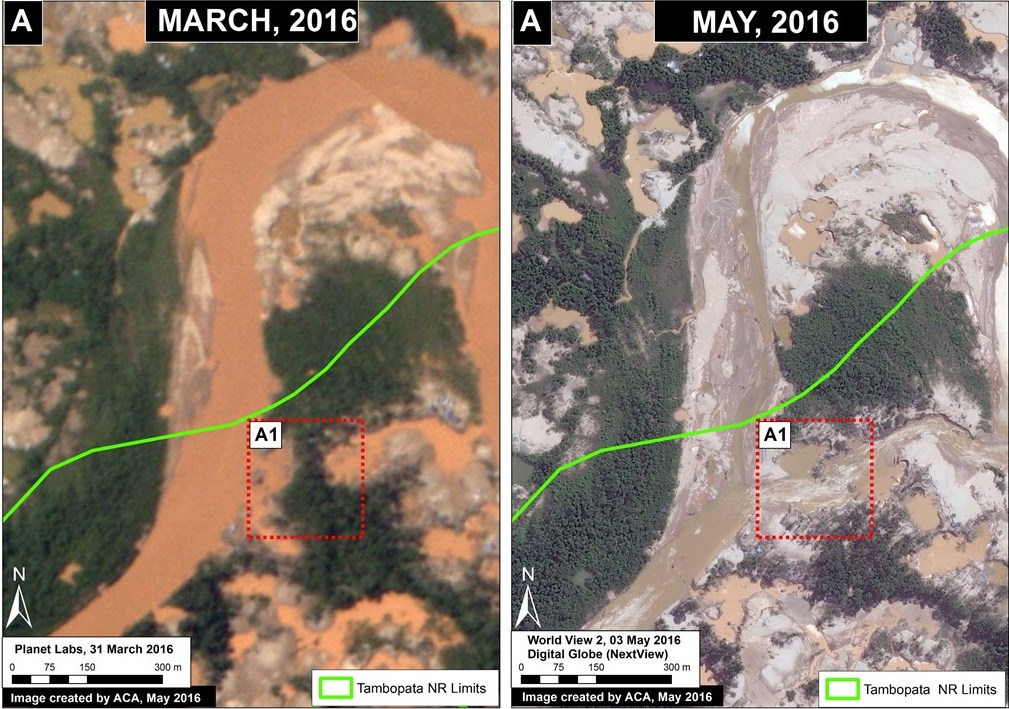
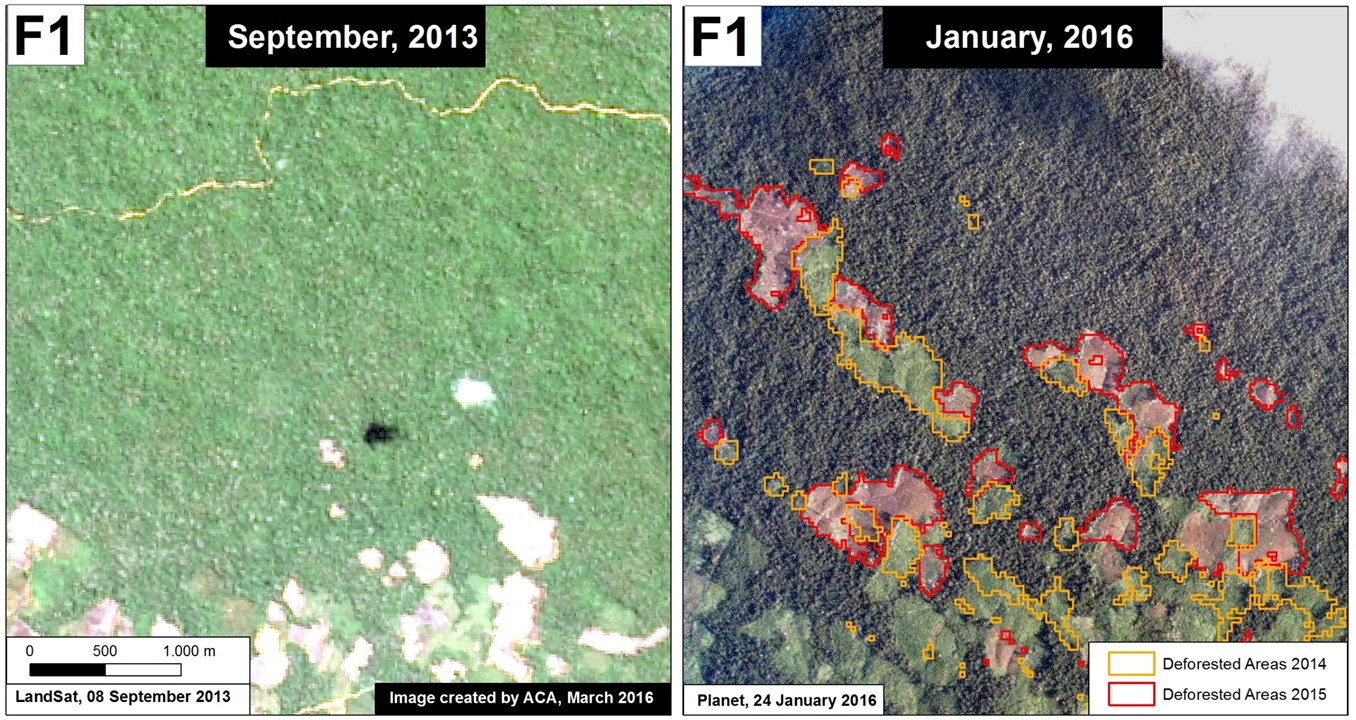
We recently obtained high-resolution satellite imagery from March 25, 2013, immediately before the beginning of the deforestation for the cacao project. Image 35a shows the same exact project area between March (left panel) and September (right panel) 2013. In March, the project area is predominantly covered with primary forest*** and contains only a few scattered patches of previously disturbed land. In contrast, in September, the project area is clearly undergoing a large-scale deforestation event (1,100 hectares at that time).

tamshiyacu2
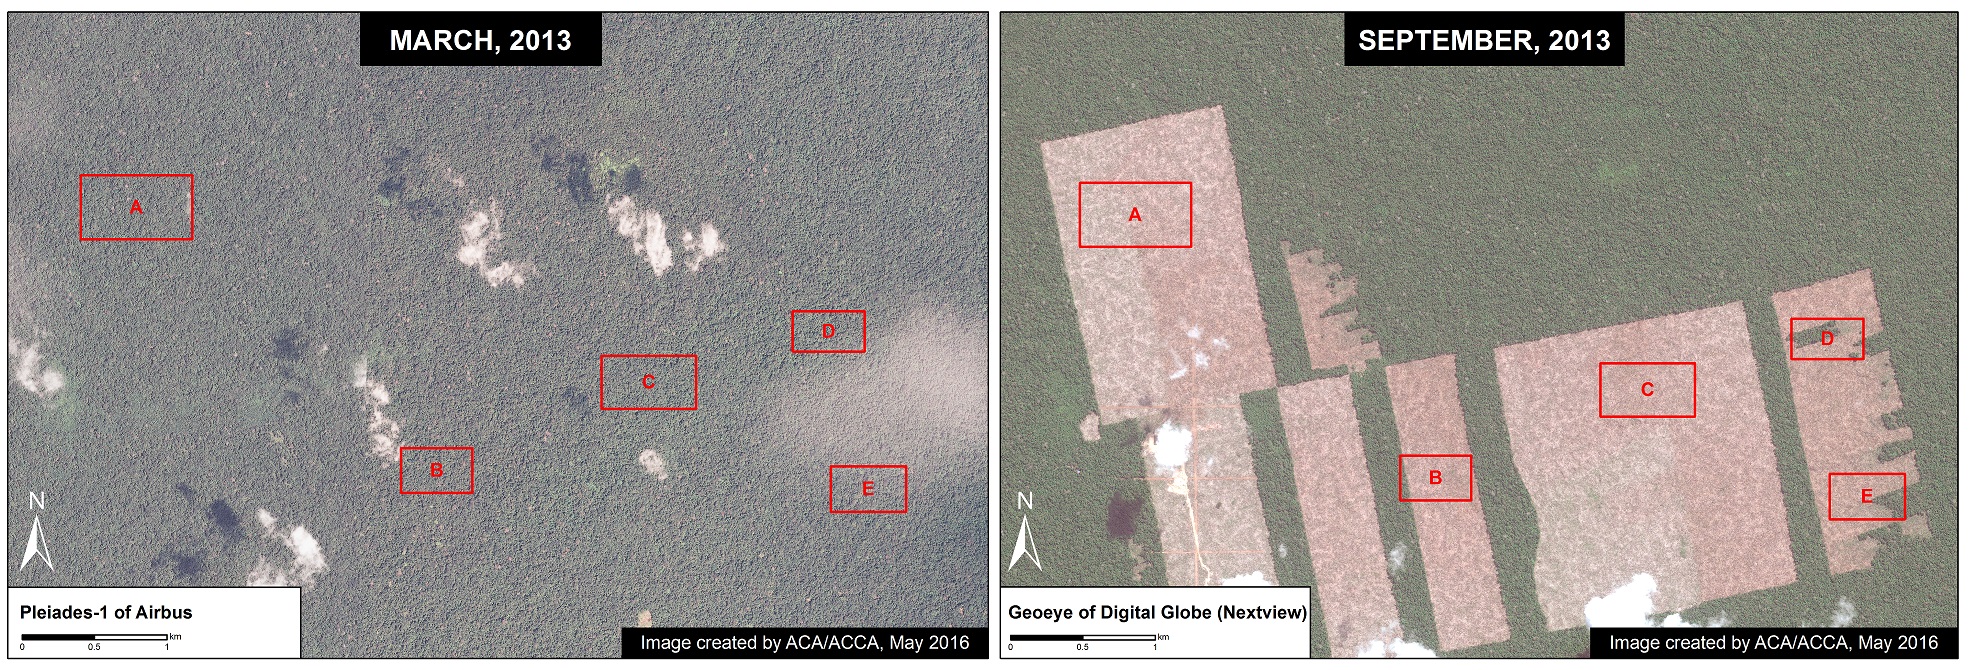
Image 35a. Data: Airbus, Digital Globe (Nextview)

Zoom A

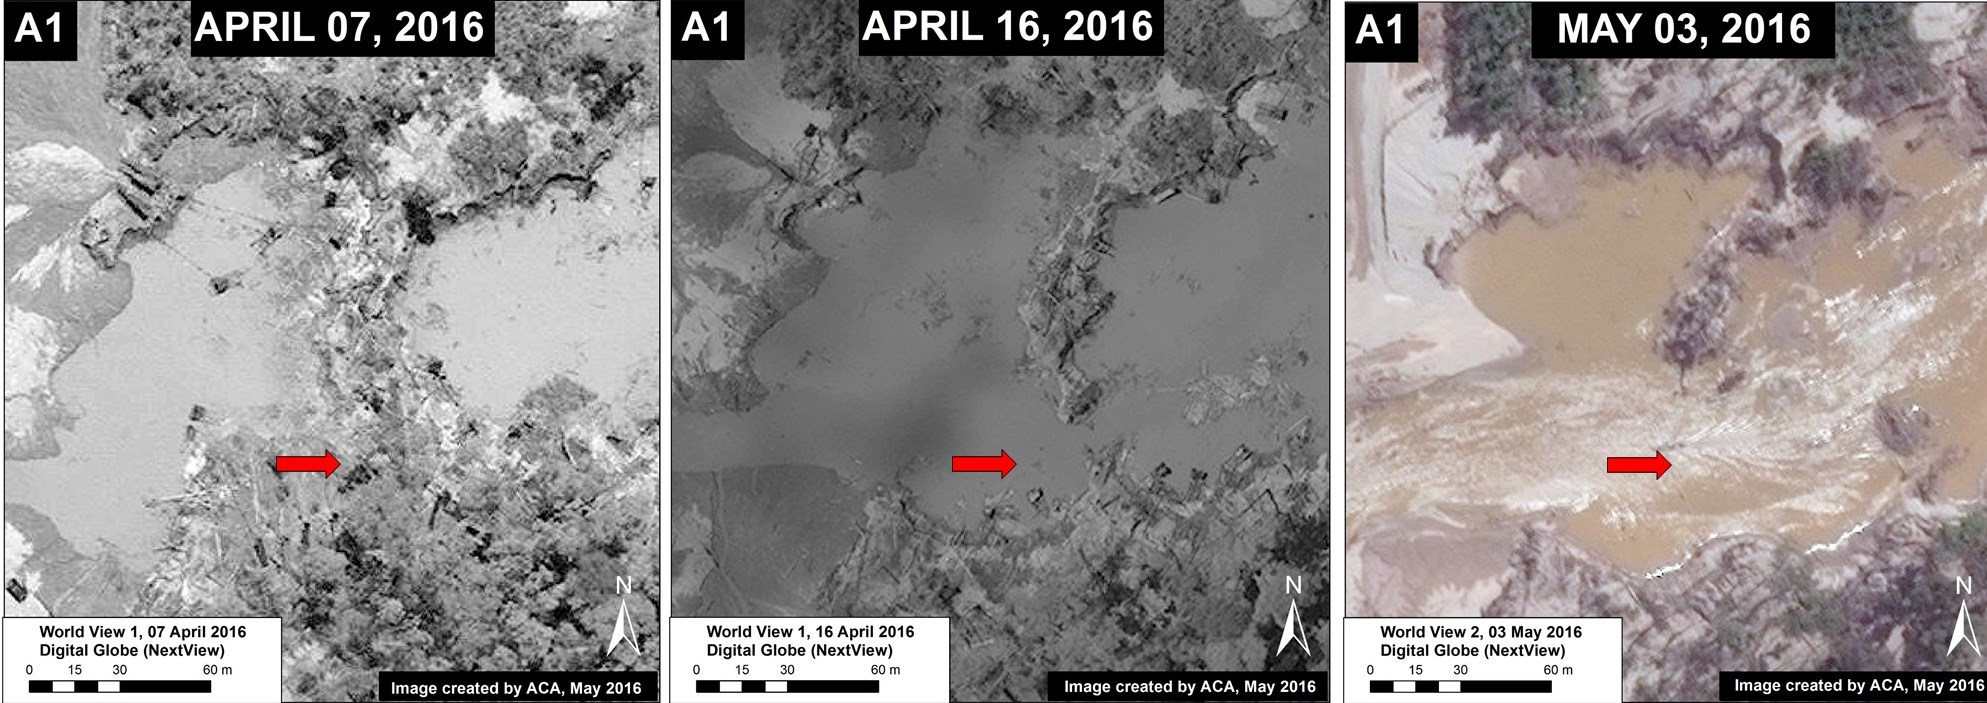
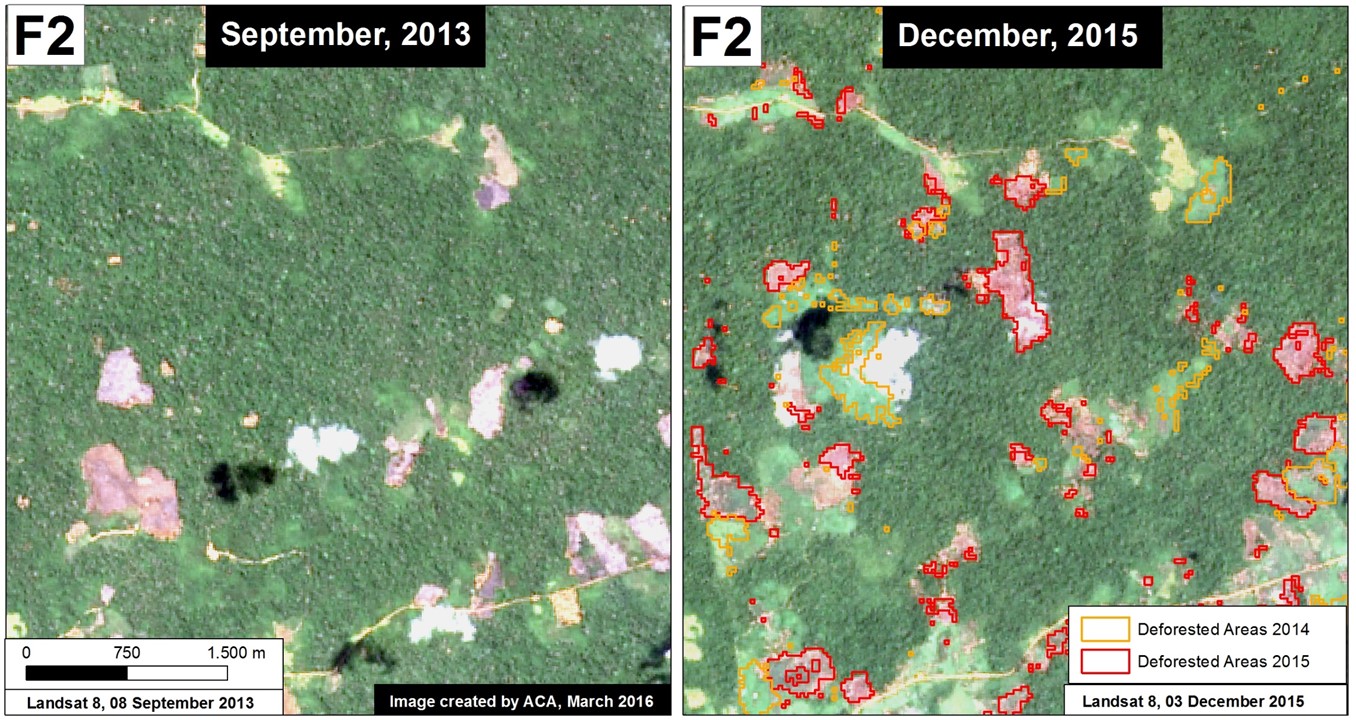
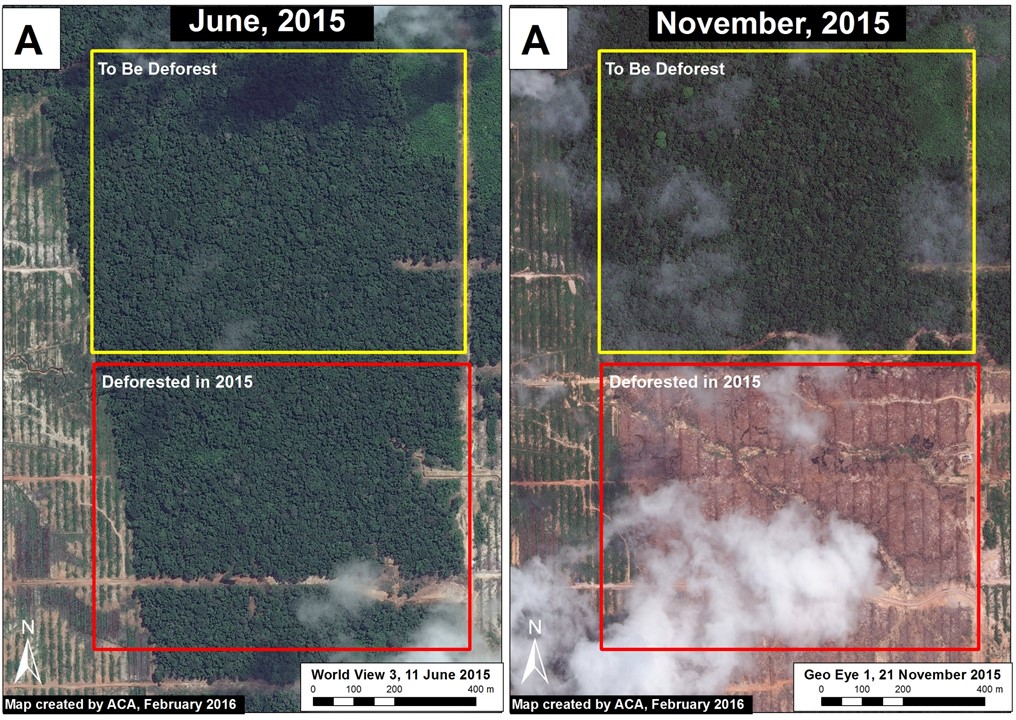
In the following series of images, we show zooms of the areas indicated by Insets A-E in Image 35a. Each image shows the same exact area within the cacao project between March (left panel) and September (right panel) 2013. In all images, one can clearly see intact forest in March followed by large-scale deforestation in September.

Image 35b. Data: Airbus, Digital Globe (Nextview)
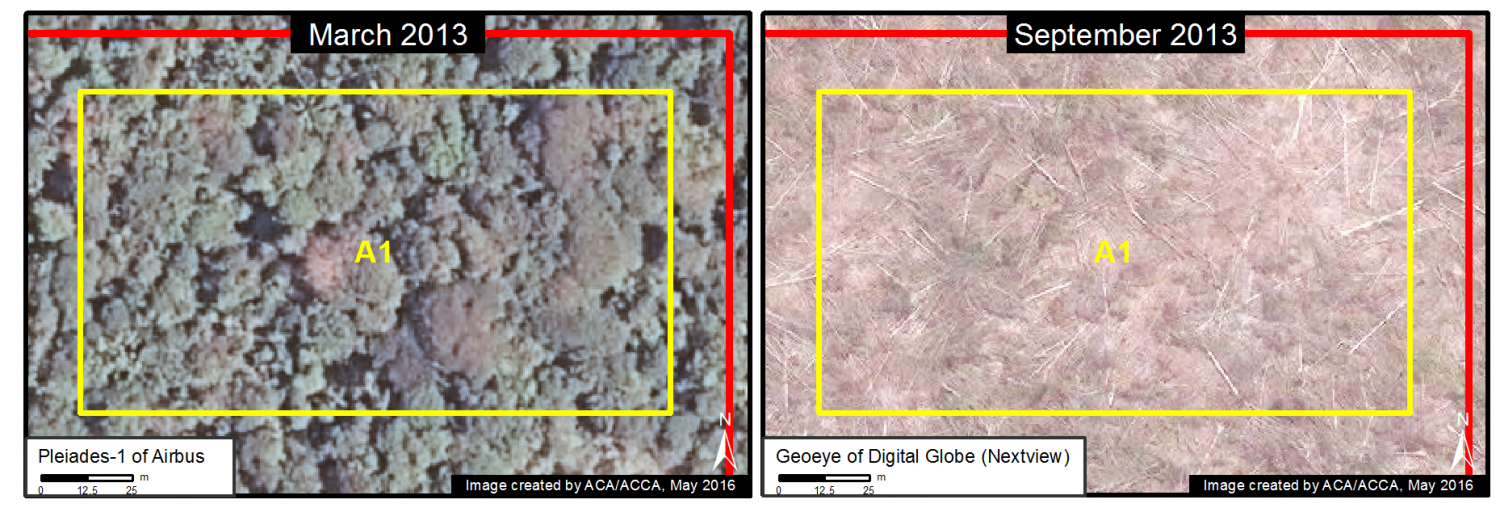
Image 35c. Data: Airbus, Digital Globe (Nextview)
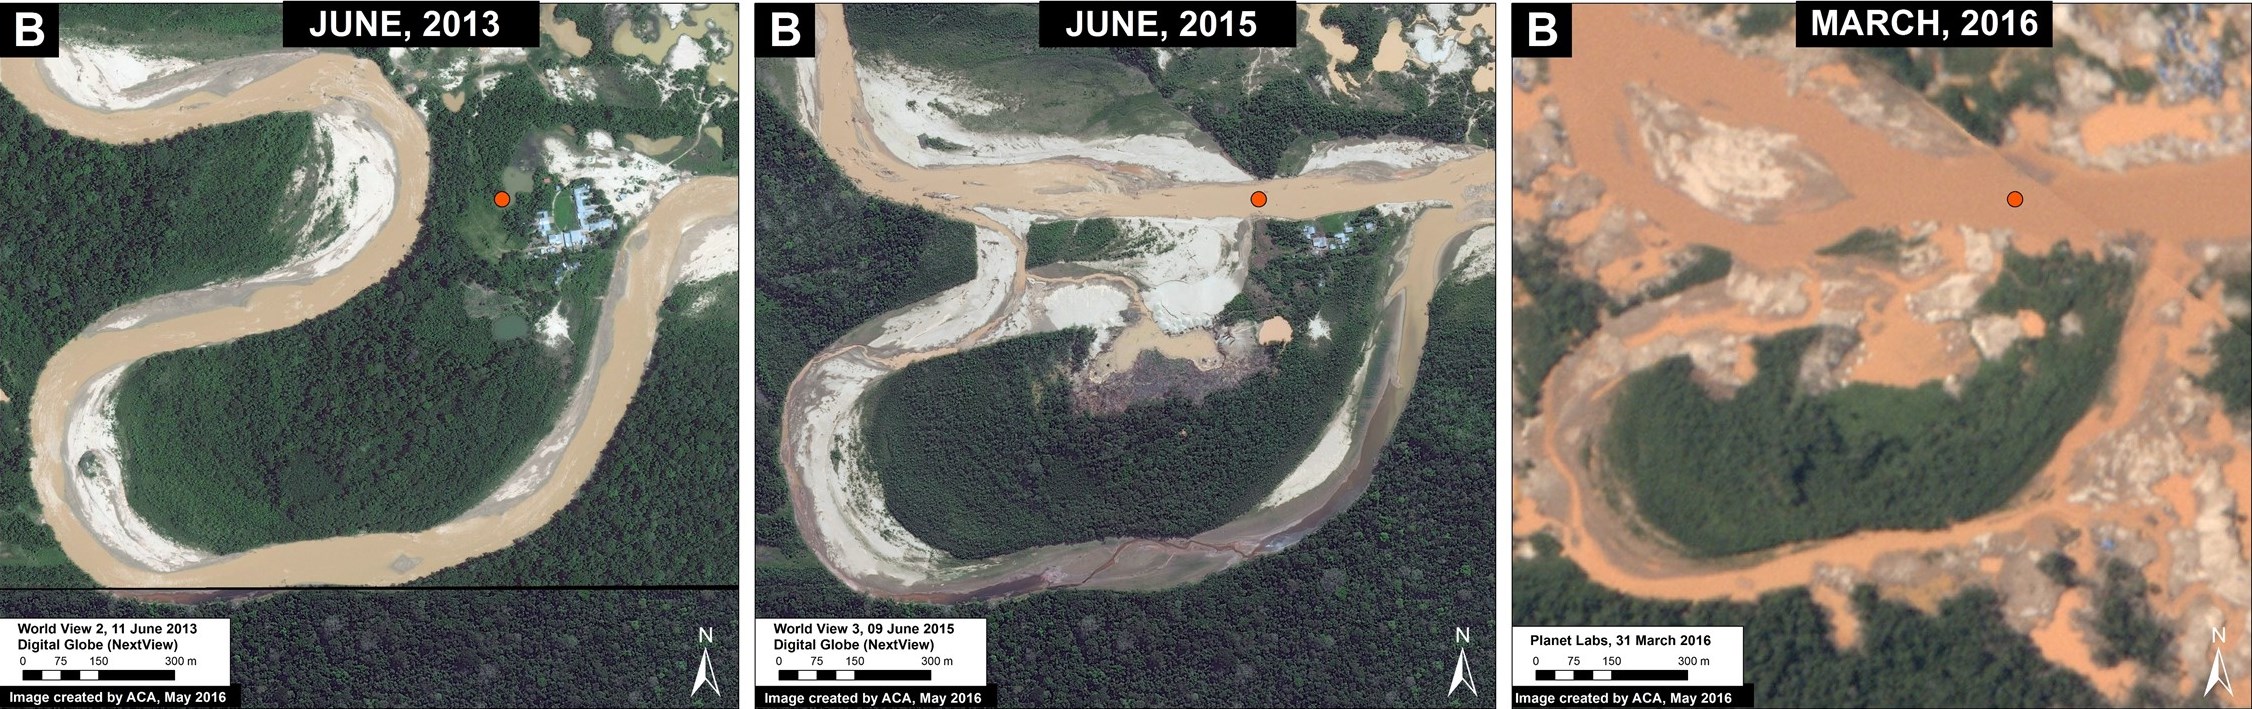
Zoom B

tamsh_zoomB
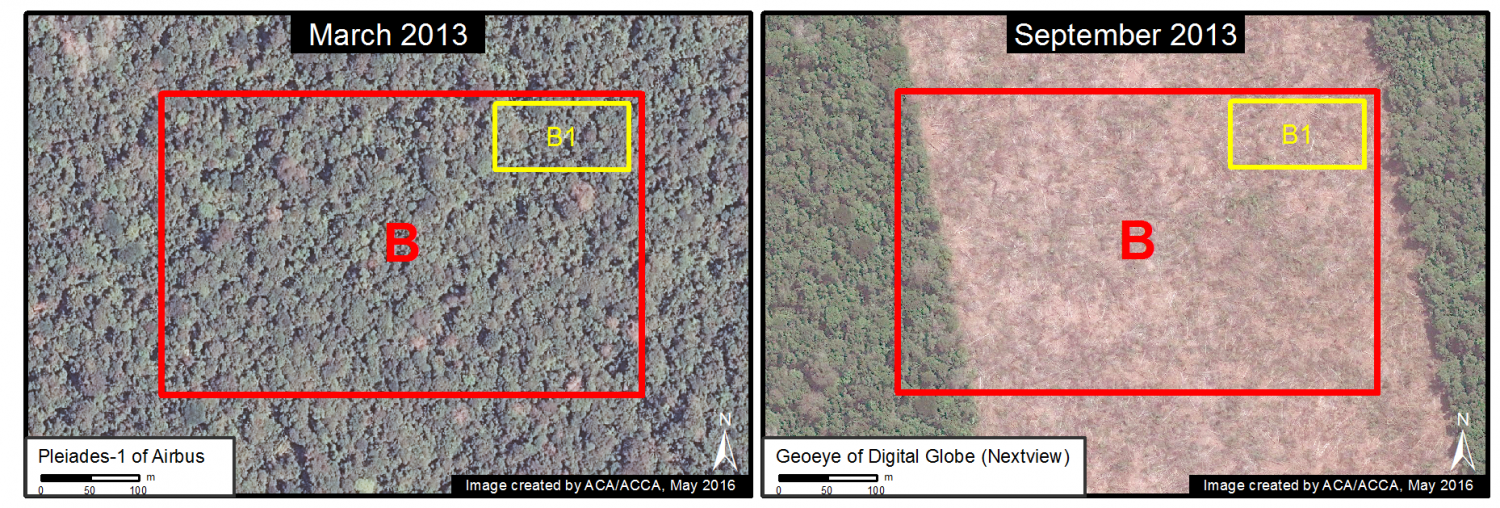
Image 35d. Data: Airbus, Digital Globe (Nextview)
tamsh_zoomB1
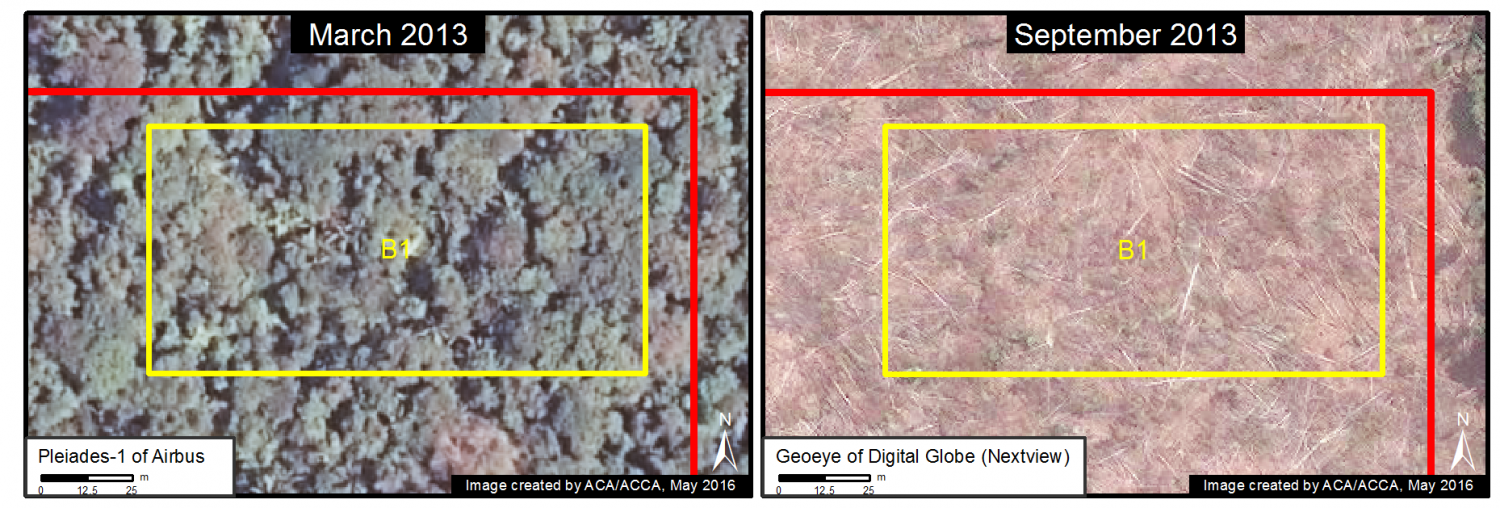
Image 35e. Data: Airbus, Digital Globe (Nextview)

Zoom C

tamsh_zoomC
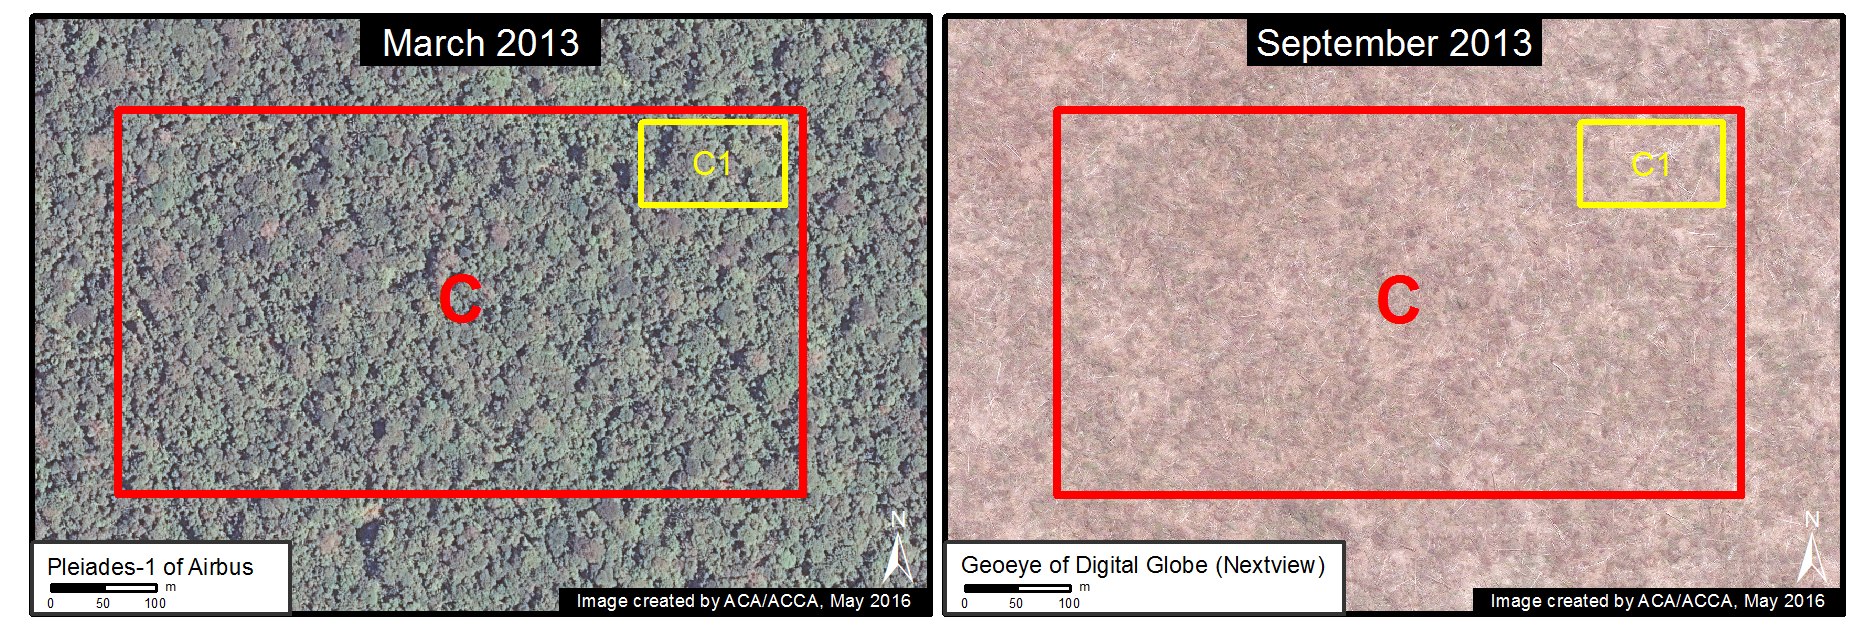
Image 35f. Data: Airbus, Digital Globe (Nextview)
tamsh_zoomC1
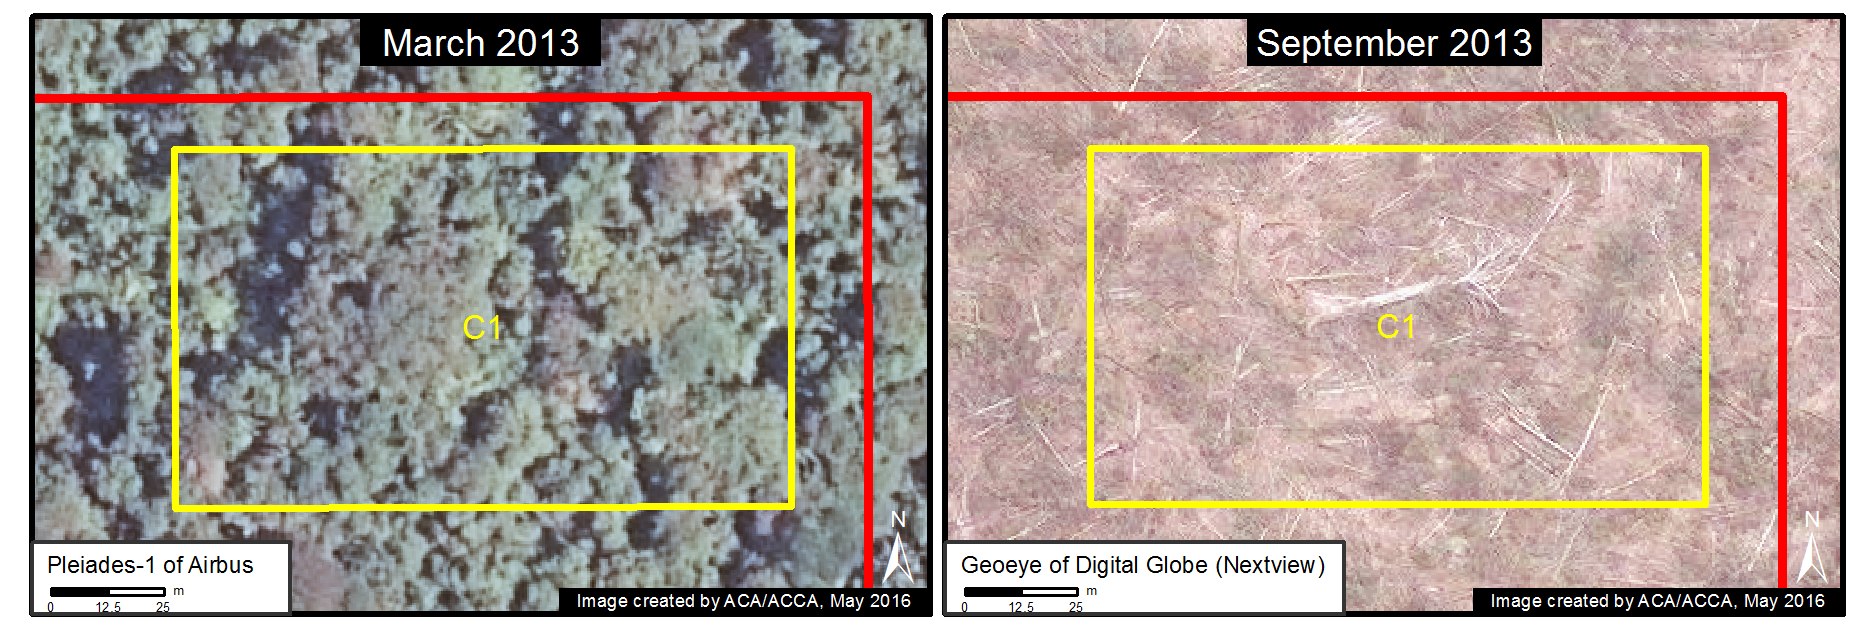
Image 35g. Data: Airbus, Digital Globe (Nextview)

Zoom D

tamsh_zoomD
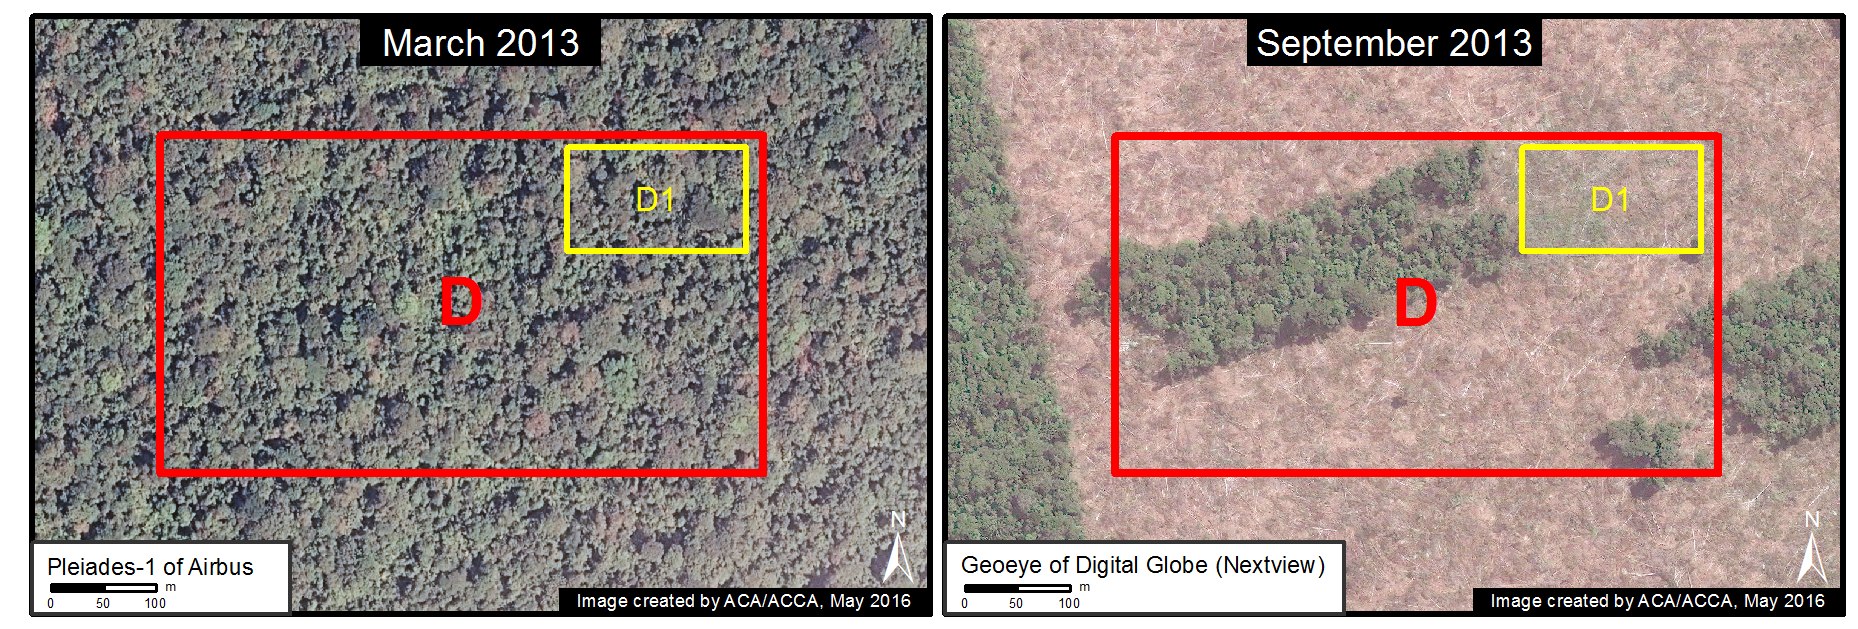
Image 35h. Data: Airbus, Digital Globe (Nextview)
tamsh_zoomD1
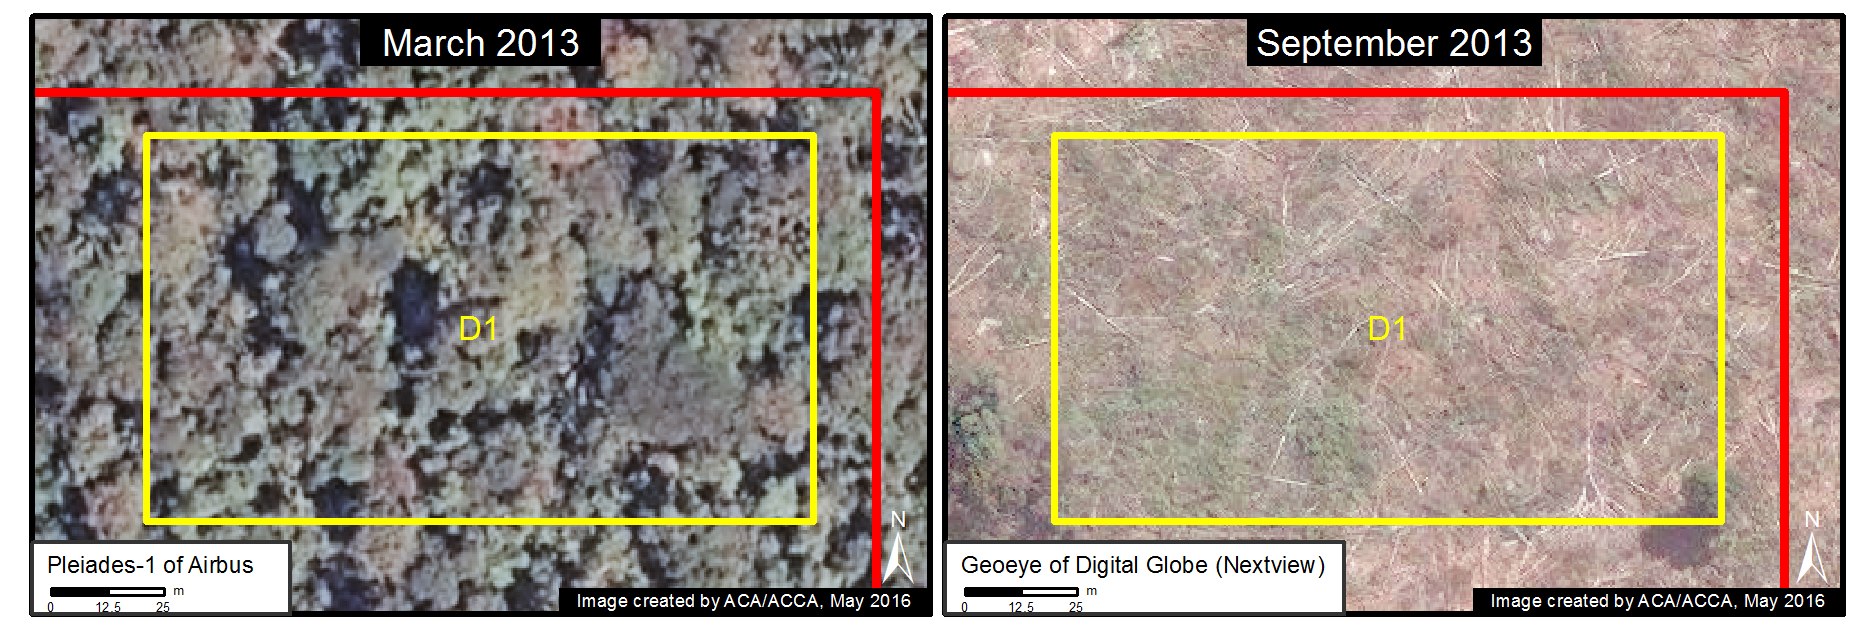
Image 35i. Data: Airbus, Digital Globe (Nextview)

Zoom E

tamsh_zoomE
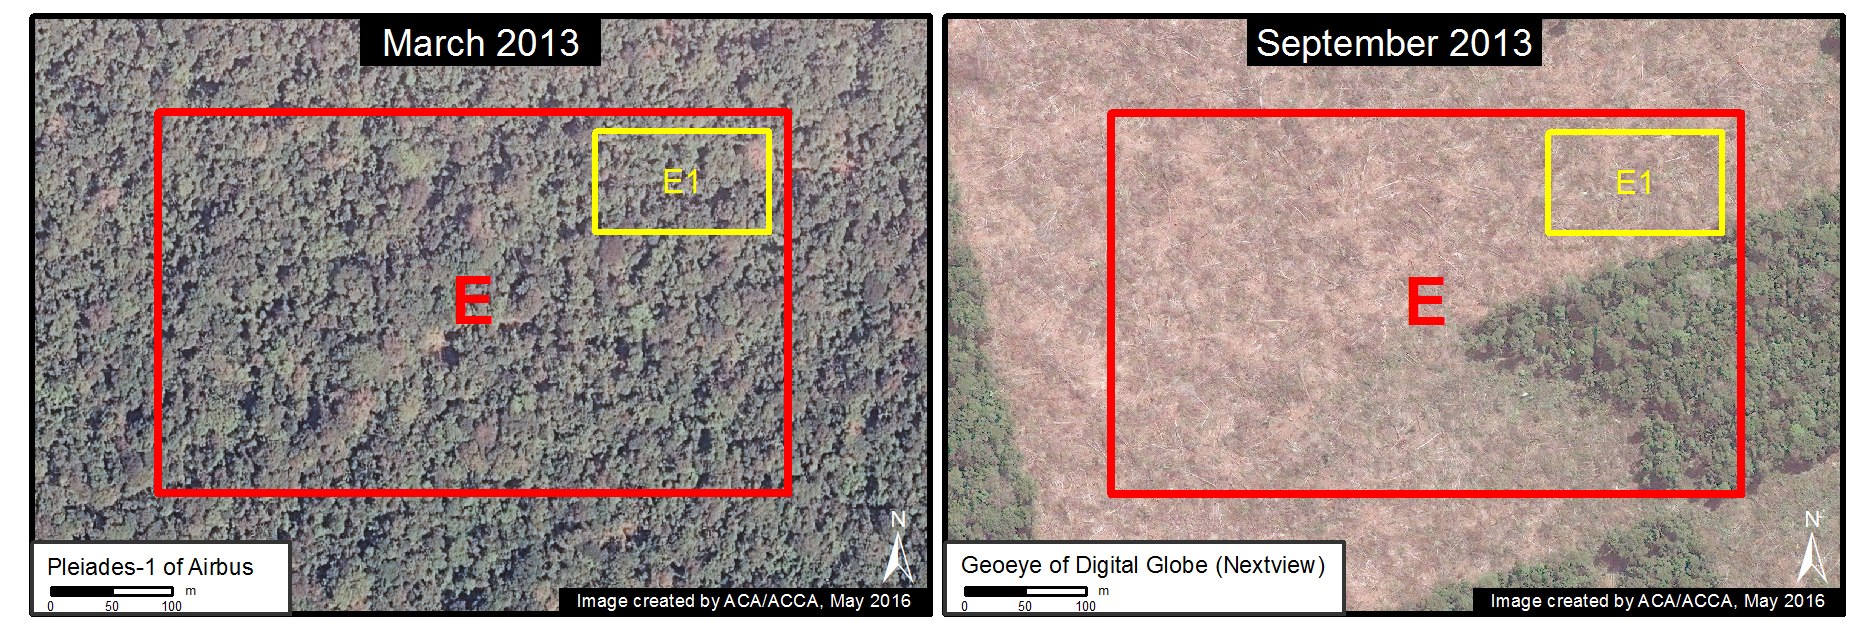
Image 35j. Data: Airbus, Digital Globe (Nextview)
tamsh_zoomE1
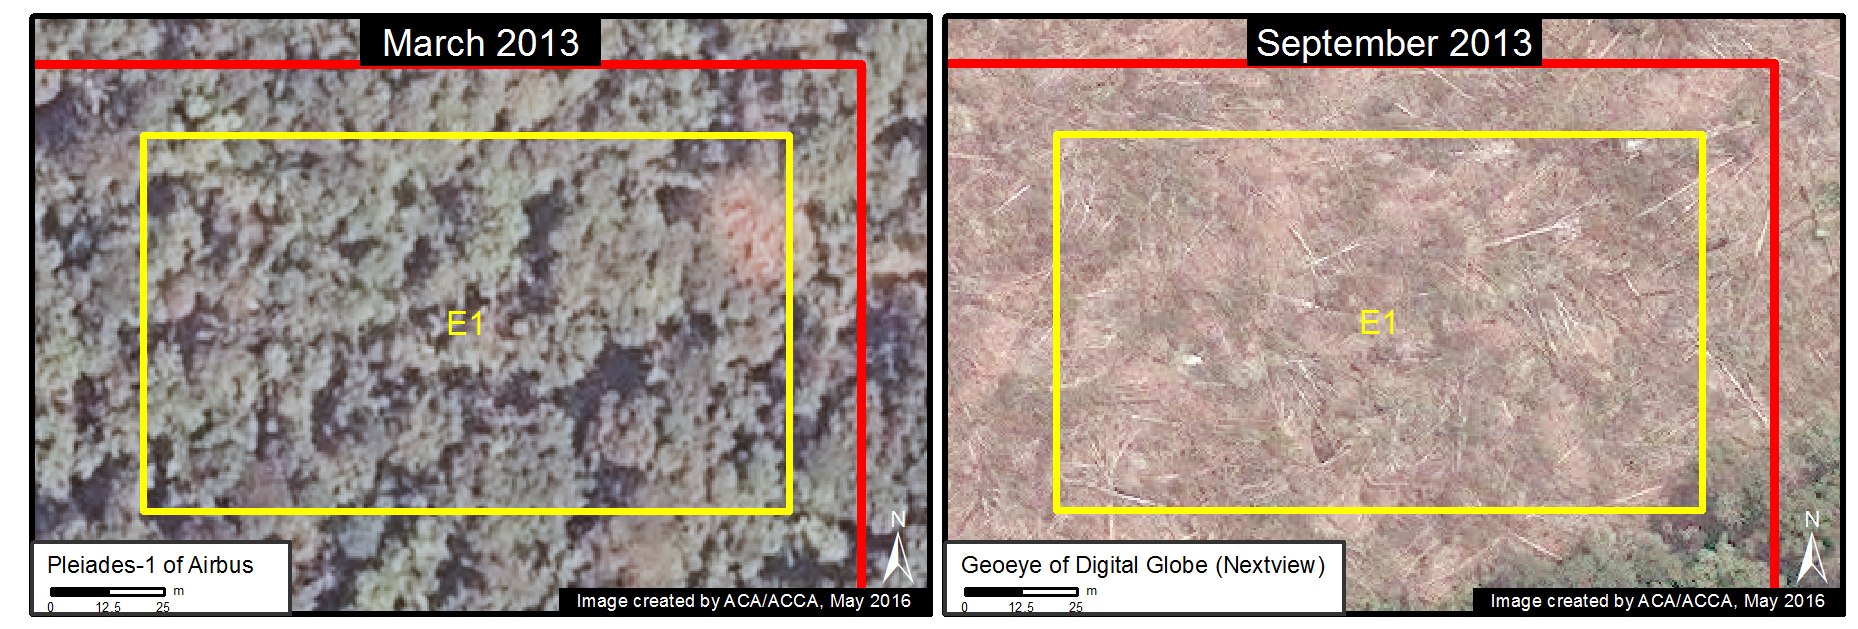
Image 35k. Data: Airbus, Digital Globe (Nextview)

Reference Graphic

Finally, for reference, Image 35l illustrates the difference (as seen in high-resolution imagery) between primary forest, secondary vegetation, agricultural areas, and deforested areas.

Imagen Xl. Datos: Worldview (NextView)
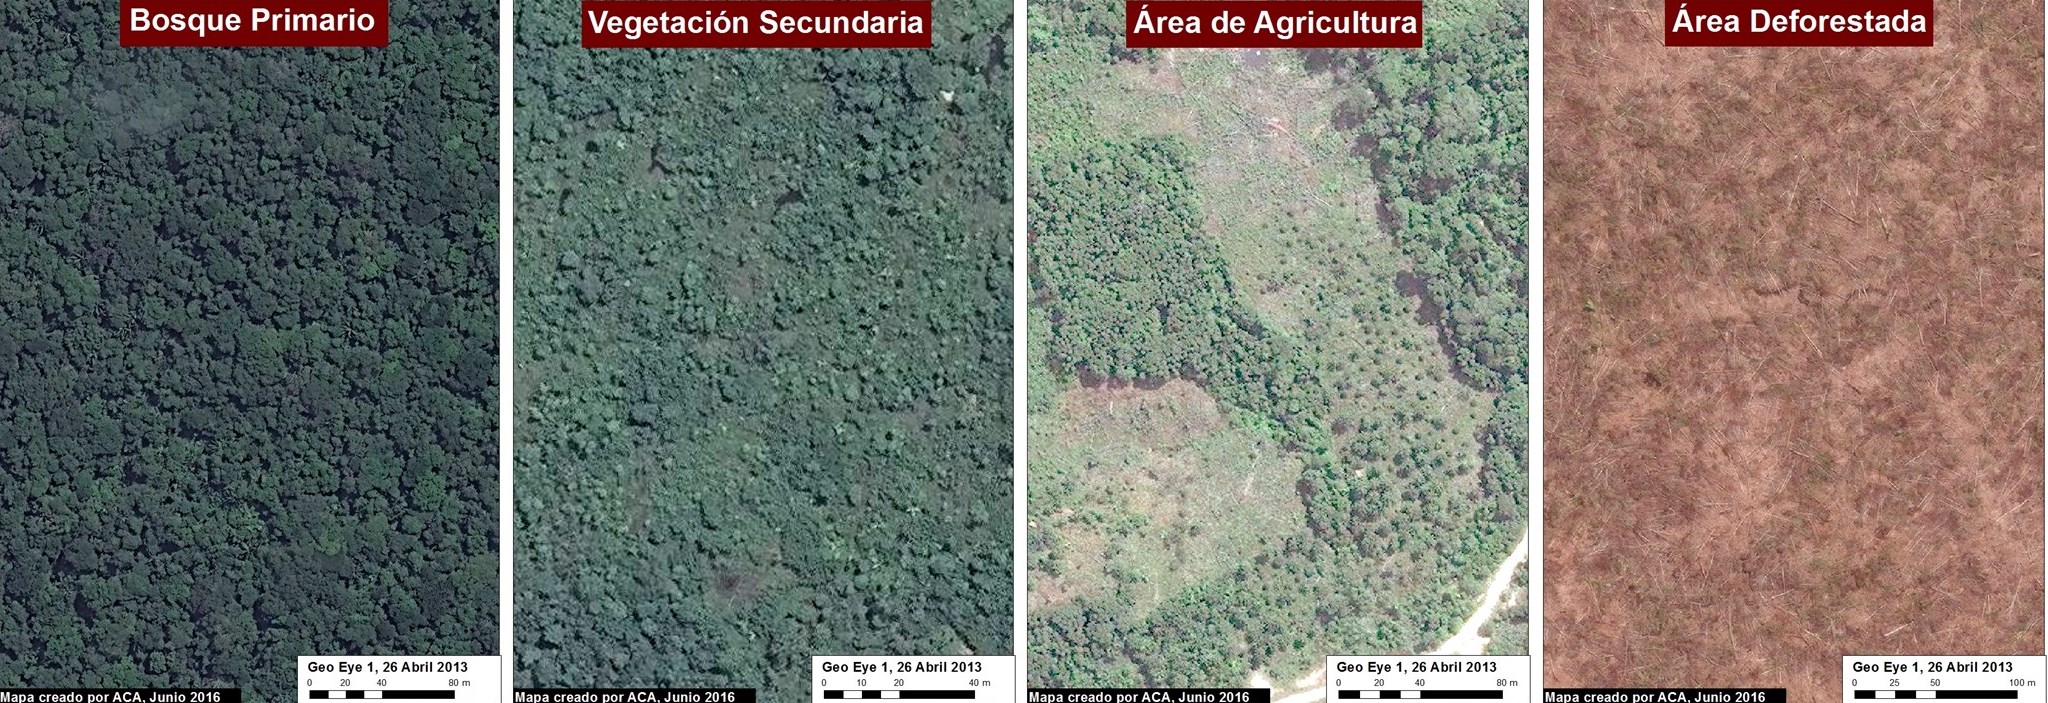
Image 35l. Data: Worldview (NextView)

References

*MAAP #27, MAAP #13, MAAP #9, MAAP #2

**See articles in Directors Talk, La Region, y The Guardian

***see MAAP #9 for details on our time-series analysis dating back to 1985 that revealed that the vast majority of the project area is primary forest

Citation

Finer M, Cruz C, Novoa S (2016) Confirming Amazon Deforestation by United Cacao in 2013 [High Res View].  MAAP: 35.

MAAP #34: New Dams on the Madeira River in Brazil Cause Forest Flooding

The Amazon lowlands have been connected to the Andes Mountains for millions of years by only six major rivers: the Caqueta, Madeira, Maranon, Napo, Putumayo, and Ucayali* (see Image 34a). This intimate connection allows rich Andean nutrients to fuel the Amazon floodplain and enables long-distance catfish migration between feeding grounds in the lowlands and spawning grounds in the highlands.

Image 34a. Data: Esri, DigitalGlobe, GeoEye, Earthstar Geographics, CNES/Airbus DS, USDA, AEX, Getmapping, Aerogrid, IGN, IGP, swisstopo

However, one of these six major Andean tributaries has recently been dammed on its main channel: the Madeira River in western Brazil (See Inset A). The Santo Antônio dam was completed in 2011, followed by the upstream Jirau dam in 2013.

Note in Image 34a that these dams are are located downstream of the Madre de Dios River in southern Peru. Thus, major ecological impacts — such as blocking the route of migratory catfish**— are also very relevant to Peru.

Here in MAAP #34, we describe the forest loss—over 36,100 hectares—associated with the flooding caused by these two dams (with a focus on the Jirau dam).

Zoom A: Forest Loss due to Flooding

Image 34b shows the forest loss due to flooding immediately upstream of the Jirau dam. As of 2015, the total flooded area for both dams is 36,139 hectares (89,301 acres). Major flooding was first detected in 2010, rose substantially in 2011-12, and peaked in 2014.

According to Fearnside 2014, although much of the forest along the Madeira is seasonally flooded, it dies when permanently flooded.*** Therefore, the flooded area is an appropriate measure of forest loss.

Further below, we show a series of satellite images of the areas indicated by Inset B (see Images 34c-e) and Inset C (see Image 34f).

Image 34b. Flooding-related forest loss along the Upper Madeira River. Data: USGS, CLASlite, Hansen/UMD/Google/USGS/NASA.

Zoom B: Flooding Immediately Upstream Jirau Dam

Image 34c shows the flooding immediately upstream of the Jirau dam between 2011 (left panel) and 2015 (right panel). The red dot is a point of reference that indicates the same place in both images. Below, we show high-resolution images of the areas indicated by Insets B1 and B2.

zoomB_rnd2
Image 34c shows the flooding immediately upstream of the Jirau dam between 2011(left panel) and 2015 (right panel).

Zooms B1 and B2: Jirau Dam and Flooding

Image 34d shows a high-resolution view of the Jirau dam in July 2015. Image 34e shows a high-resolution view of a portion of the flooded area immediately upstream of the Jirau dam in August 2015. The red dot is a point of reference that indicates the same place in both panels.

b1_rnd2
Image 34d. High-resolution view of the Jirau dam. Data: WorldView-2 from Digital Globe (NextView).
zoomb2_rnd2
Image 34e: High-resolution view of flooded area immediately upstream of the Jirau dam. Data: WorldView-2 from Digital Globe (NextView).

Zoom C: Flooding Further Upstream of Jirau Dam

Image 34f shows the flooding further upstream of the Jirau dam between 2011 (left panel) and 2015 (right panel). The red dot is a point of reference that indicates the same point in both images.

zoomC_rnd2
Image 34f. Forest flooding further upstream of the Jirau dam between 2011 (left panel) and 2015 (right panel). Data: USGS

References

*Finer M, Jenkins CN (2012) Proliferation of Hydroelectric Dams in the Andean Amazon and Implications for Andes-Amazon Connectivity. PLOS ONE: 7(4): e35126. Link: http://journals.plos.org/plosone/article?id=10.1371/journal.pone.0035126

**Duponchelle F et al (2016) Trans-Amazonian natal homing in giant catfish. J. Appl. Ecol. http://doi.org/bd45

***Fearnside PM (2014) Impacts of Brazil’s Madeira River dams: Unlearned lessons for hydroelectric development in Amazonia. Environmental Science & Policy 38: 164-172.

Citation

Finer M, Olexy T (2015) New Dams on the Madeira River (Brazil) Cause Forest Flooding. MAAP: 34.

MAAP #33: Illegal Gold Mining Alters Course of Malinowski River (border of Tambopata National Reserve)

In MAAP #30, we described the illegal gold mining invasion of Tambopata National Reserve, an important protected area in the southern Peruvian Amazon (department of Madre de Dios). Here in MAAP #33, we show that illegal gold mining is also altering the course of the Malinowski River, which forms the natural boundary of the Reserve. Image 33a shows the two areas where we have documented a total artificial deviation (cutting) of 4.4 km (2.7 miles) of the river (see details below).

Image 33a. Data: Planet Labs, SERNANP

Zoom A: A Recent Deviation of the Malinowski River

Image 33b shows the final stage of the deviation of the Malinowski River between March 31 (left panel) and May 3 (right panel) of this year in the area indicated by Inset A in Image 33a. The new flow of the river is clearly seen in the right panel, cutting a 1.7 km stretch of the previous course.

Image 33b. Data: Planet Labs, Digital Globe (Nextview)

Image 33c shows with greater precision how the Malinowski river was diverted in this area between April and May 2016. The red arrow indicates the exact same place across time in the three images.

Image 33c. Data: Digital Globe (Nextview)

Zoom B: An Earlier Deviation of the Malinowski River

In February 2016, Peruvian specialists presented how mining activity had recently changed the natural course of the Malinowski river in the area indicated in Inset B*. Image 33d shows the progressive change: from the increase in mining activity along the normal course of the river in June 2013 (left panel), to the new stretch of riverbed in June 2015 (center panel), and finally to the expansion of mining activity along the previous course (right panel). The red dot indicates the same place over time in the three images. A total of 2.7 km was cut from the previous river course.

Image 33d. Data: Digital Globe (Nextview), Planet Labs

Ecological Impacts

According to Dr. Carlos Cañas**, coordinator of the Amazon Waters Initiative for Wildlife Conservation Society in Peru, the deviation of the natural course of the Malinowski River will have significant ecological impacts, including:

  • Although the Malinowski River’s course has natural movement, the changes documented in MAAP #33 definitely represent an artificial alteration caused by mining activity.
  • These artificial changes are altering the course of the Malinowski from one that is “narrow and defined” to one that is “wide and scattered.” This change impacts the river’s flood patterns by changing the intensity, timing, and frequency of flooding along the river’s banks. This implies an effect on the migratory behavior of many species of fish downstream, which receive and interpret signals from the river to guide vital functions like feeding and reproduction.
  • The river’s new wider course also causes the velocity of water downstream to decrease, which will lead to increased levels of sediment in the discharge zone of the largest tributary, the Tambopata. Given the nature of the Tambopata, this could provide the almost-permanent damming of the Malinowski, as greater volume of the Tambopata means more sedimentation at the mouth of the river. Among other things, this could hinder the entry of fish to their feeding zones.
  • As seen in Image 33d, fish access to certain areas will be interrupted by the blockade and closure of channels. Also, the connection between the floodable forest and the river channel is completely altered, if not interrupted, in this section of the river. Many fish species that eat fruit or vegetation from the adjacent forest depend on this seasonal connection for food.
  • The Malinowski River, since it is a tributary of the Tambopata River, has natural áreas that are crucial to the reproduction of many local species. Its tributary streams represent habitats that differ from the main river and harbor an incredible variety of fish and invertebrates that contribute to the biodiversity of the river basin. These streams have little sediment, and are thus highly transparent. Mining will destroy or drastically alter these environments, severely impacting this biodiversity.

Referencias

*Villa L., Campos L. G., Pino I. M. (01 de febrero de 2016). Primer Sistema de Alerta Temprana de Geoinformación (SAT-GI) para Áreas Naturales Protegidas del Perú: Reserva Nacional Tambopata y el Ámbito de Madre de Dios del Parque Nacional Bahuaja Sonene. Reporte Nº 001-2016.

** Cañas CM, Waylen PR (2011) Modelling production of migratory catfish larvae (Pimelodidae) on the basis of regional hydroclimatology features of the Madre de Dios Basin in southeastern Peru. Hydrol. Process. DOI: 10.1002/hyp.8192.

**Cañas CM, Pine WE (2011) DOCUMENTATION OF THE TEMPORAL AND SPATIAL PATTERNS OF PIMELODIDAE CATFISH SPAWNING AND LARVAE DISPERSION IN THE MADRE DE DIOS RIVER
(PERU): INSIGHTS FOR CONSERVATION IN THE ANDEAN-AMAZON HEADWATERS. River Res. Applic. 27: 602–611.

Citation

Finer M, Novoa S (2016)  Illegal Gold Mining Alters the Course of the Malinowski River (border of Tambopata National Reserve). MAAP: 33.

MAAP #32: Large-scale vs. Small-scale Deforestation in the Peruvian Amazon

Graph 32a. Data: PNCB/MINAM, UMD/GLAD

In the previous MAAP #25 and MAAP #26, we illustrated deforestation hotspots in the Peruvian Amazon for the periods 2012-2014 and 2015*, respectively. Here in MAAP #32, we present a complementary analysis based on the size of deforestation events.

Graph 32a shows the comparative results of deforestation patterns between 2013 and 2015, indicating that:
Small-scale (< 5 hectares) accounted for the vast majority of deforestation events (70-80%) each year.
Medium-scale (5-50 hectares) accounted for approximately 20% of the deforestation events each year.
Large-scale (> 50 hectares) deforestation was variable. In 2013, the year with the most activity of new cacao and oil palm plantations, it accounted for 8% of the deforestation events. In 2015 it was only 1%.

In summary, small- and medium-scale deforestation events represent more than 90% of the total and a constant threat, while large-scale deforestation events represents a latent threat. As described below, large-scale projects can quickly cause massive deforestation events, and should therefore remain a high priority.

*We have increased our deforestation estimate for 2015 to 163,238 hectares (403,370 acres), the second highest on record (behind only 2014). This estimate is based on GLAD alerts, produced by University of Maryland, Google, and Global Forest Watch.

Base Map

Image 32a shows, in graphic form, the deforestation patterns described above for 2013 (left panel) and 2015 (right panel). Further below, we show zooms for three key zones in the north, central, and south, respectively.

Categ_13_15_v1_en
Image 32a. Data: PNCB/MINAM, UMD/GLAD

Northern Peruvian Amazon

Image 32b shows a zoom of the northern Peruvian Amazon for 2013 (left panel) and 2015 (right panel). In general, there is a pattern of small-scale deforestation along the rivers of Loreto. Additionally, in 2013, there were large-scale deforestation events for a cacao project located to the southeast of the city of Iquitos (see MAAP #27 for more details) and for oil palm plantations along the border of Loreto and San Martin regions (see MAAP #16 for more details). In 2015, the expansion of deforestation continued in these areas, but at a medium-scale.

Categ_13_15_n_v1_en
Image 32b. Data: PNCB/MINAM, UMD/GLAD

Central Peruvian Amazon

Image 32c shows a zoom of the central Peruvian Amazon for 2013 (left panel) and 2015 (right panel). In general, there is a concentration of small- and medium-scale deforestation between northwest Ucayali and southeast Huánuco. Additionally, in 2013, there is large-scale deforestation for two new oil palm plantations located northeast of the city of Pucallpa (see MAAP #4 for more details).

Categ_13_15_c_v1_en
Image 32c. Data: PNCB/MINAM, UMD/GLAD

Southern Peruvian Amazon

Image 32d shows a zoom of the southern Peruvian Amazon for 2013 (left panel) and 2015 (right panel). In general, there is a pattern of small- and medium-scale deforestation along the Interoceanic highway in Madre de Dios. Additionally, there is the persistence of large-scale deforestation in southern Madre de Dios related to illegal gold mining (see MAAP #12 for more details).

Categ_13_15_s_v1_en
Image 32d. Data: PNCB/MINAM, UMD/GLAD

Citation

Finer M, Novoa S (2016) Large-scale vs. Small-scale Deforestation in the Peruvian Amazon. MAAP: 32.

MAAP #31: Deforestation Continues Expansion in La Pampa (buffer zone of Tambopata National Reserve)

Illegal gold mining deforestation continues to expand in La Pampa, an area located in the buffer zone of Tambopata National Reserve in the Madre de Dios region. Here, we present a series of high-resolution (0.5 m) images that clearly illustrate this expansion. Image 31a shows the large, expanding mass of deforestation in La Pampa (as of November 2015) in relation to the Tambopata National Reserve and its buffer zone. Insets A and B indicate the high-resolution zoom areas, where further below we show the rapid deforestation of 76 hectares (188 acres) between November 2015 and April 2016.

Capture_main
Image 31a. Data: WorldView-2 of Digital Globe (NextView).

Zoom A: Rapid Advance of Deforestation

Image 31b shows the expansion of deforestation (28 hectares) between November 2015 (left panel) and April 2016 (right panel) in the eastern section of La Pampa. The red dot indicates the exact same point in both images across time.

DGapril_ZoomA_english_v2
Image 31b. Data: WorldView-2 of Digital Globe (NextView).

Zoom B: Formation of a Large Camp

Image 31c shows the formation of a large mining camp between November 2015 (left panel) and April 2016 (right panel) in the eastern section La Pampa. The red dot indicates the exact same point in both images across time. The image also shows the deforestation of 48 hectares around the camp.

DGapril_ZoomB_english_v2
Image 31c. Data: WorldView-2 of Digital Globe (NextView).

Citation

Finer M, Olexy T (2016) Deforestation Continues Expansion in La Pampa (buffer zone of Tambopata National Reserve). MAAP: 31.


MAAP #30: Gold Mining Invasion of Tambopata National Reserve Intensifies

As described previously in MAAP #21, the illegal gold mining invasion of the Tambopata National Reserve began in late 2015. Here in  MAAP #30, we confirm that this invasion continues to intensify in 2016.

Image 30a shows the invasion zone, where we document that the illegal mining is advancing on seven fronts within the northwest section of the reserve and has thus far directly caused the deforestation of 130 hectares (320 acres) since September 2015. Below, we show high-resolution zooms of fronts 1-5 (Inset A) and a major mining camp recently established just outside of the Reserve (Inset B).

Imagen 30a. Datos: Planet Labs, SERNANP
Image 30a. Data: Planet Labs, SERNANP

Invasion of Tambopata: Fronts 1-5

Image 30b shows the rapid expansion of deforestation in 5 of the fronts inside the Reserve between the end of January (left panel) and March (right panel) of 2016. This image corresponds to Inset A in Image 30a. Further below, Images 30c and 30d show high-resolution zooms of these 5 fronts.

Image 30b. Data: Planet Labs, SERNANP

Zoom of Fronts 1 & 2

Image 30c shows a zoom of deforestation fronts 1 and 2 between January (left panel) and March (right panel) of 2016.

Image 30c. Data: Planet Labs, SERNANP

Zoom of Fronts 3, 4, & 5

Image 30d shows a zoom of fronts 3, 4, and 5 between January (left panel) and March (right panel) of 2016.

Image 30d. Data: Planet Labs, SERNANP

Major Mining Camp Adjacent to Tambopata Reserve

Image 30e shows, in high-resolution, the establishment of a major mining camp in front of the invaded section of the Reserve (and within the Reserve’s official buffer zone). This Image corresponds to Inset B in Image 30a.

Image 30e. Data: WorldView-2 de Digital Globe (NextView).

Using Radar to Confirm Invasion Continues

In early 2016, the Peruvian government led two major interventions (on January 21 and February 23, respectively) against the illegal miners operating in the interior of the Reserve. However, Image 30f shows in red the continued advance of deforestation (44 hectares) between March 1 (left panel) and March 25 (right panel). In other words, using radar technology (which can pierce through cloud-cover) we can confirm that deforestation continued to advance after the government interventions.

Imagen Xd. Datos: Sentinel-1, SERNANP
Image 30f. Data: Sentinel-1, SERNANP

Finer M, Novoa S, Olexy T (2016) Invasion of Tambopata National Reserve Intensifies. MAAP: 30.

MAAP #29: Construction of New Road between Manu National Park and Amarakaeri Communal Reserve (Madre de Dios)

Here in MAAP #29, we describe the Nuevo Eden-Boca Manu-Boca Colorado road project in the southern Peruvian Amazon (Madre de Dios region). The objective of this article is to show the current state of construction and quantify the direct and indirect deforestation caused thus far by the road. This is a controversial road project because it cuts through the buffer zones of two important protected areas, the Amarakaeri Communal Reserve and Manu National Park*.

MAAP_Manu_a_m_v1_en
Image 29a. Data: SERNANP, USGS, MINAGRI, IBC, CLASlite, PNCB/MINAM, Hansen/UMD/Google/USGS/NASA, SPOT

Image 29a shows the general context of the area between Amarakaeri  and Manu where the road is being constructed. The yellow line indicates the section of road built in 2015 (11.6 km) between the towns of New Eden and Shipetiari (see right panel for high-resolution image of this construction). The red line indicates the new section under construction thus far in 2016 (21.8 km). Thus, in total, we have documented the construction of 33.4 km of road within the Amarakaeri Communal Reserve buffer zone. Finally, the pink line indicates the future road section planned to Boca Manu and then to Boca Colorado.

Road Construction in 2015

Image 29b shows a series of satellite images (Landsat) that illustrate the rapid road construction during 2015. The first two panels show the construction of 11.6 km between February (left panel) and October (central panel) 2015. The yellow arrows in the central panel indicate the direct deforestation (20 hectares) associated with construction of the route. The yellow circles in the right panel indicate the indirect (secondary) deforestation associated with the road (12 hectares). Thus, in total, we have documented the deforestation of 32 hectares (or 79 acres) associated with the road as of mid-March 2016.

MAAP_Manu_c_m_v1_en
Image 29b. Data: NASA/USGS.

New Road Construction in 2016

Image 29c shows the continued road construction (2.9 km) between January and mid-March 2016 (see orange arrows in the left panel). Moreover, using high-resolution imagery provided by Planet Labs, the right panel shows a new path (see red arrows) that is likely the leading edge of the current road construction. This path now extends an additional 19 km in the direction of Boca Manu (see Image 29d).

MAAP_Manu_e_m_v1_en
Image 29c. Data: NASA/USGS, Planet Labs
Imagen Xd. Datos: USGS
Image 29d. Data: NASA/USGS

References

*MINAM (2016) MINAM está en contra de predictamen que permitiría la construcción de la carretera en zona de amortiguamiento del Manu y de Amarakaeri. http://www.minam.gob.pe/perucrecimiento/2016/02/29/minam-esta-en-contra-de-predictamen-que-permitiria-la-construccion-de-la-carretera-en-zona-de-amortiguamiento-del-manu-y-de-amarakaeri/

MINAM (2015) MINAM y SERNANP manifiestan preocupación por aprobación de ley que declara de interés nacional carretera en zona de amortiguamiento del Manu y Amarakaeri. http://www.minam.gob.pe/notas-de-prensa/minam-y-sernanp-manifiestan-preocupacion-por-aprobacion-de-ley-que-declara-de-interes-nacional-carretera-en-zona-de-amortiguamiento-del-manu-y-amarakaeri/

Citation

Finer M, Novoa S, Olexy T (2016) Construction of a New Highway between Manu National Park and Amarakaeri Communal Reserve (Madre de Dios), 2016. MAAP: 29.

MAAP #28: New Deforestation Hotspot along Interoceanic Highway in Southern Peruvian Amazon (Madre de Dios)

We have previously detailed the extensive illegal gold mining problem in the southern Peruvian Amazon (Madre de Dios region), but here in MAAP #28 we detail the emergence of another deforestation hotspot in the region. Image 28a shows the intensification of this hotspot, located along the newly paved Interoceanic highway around the town of Iberia (see Inset F), between 2012-14 (left panel) and 2015 (right panel). Note that the gold mining hotspot, indicated by Inset E, remained consistently high among the two time frames.

Image 28a. UMD/GLAD, PNCB/MINAM

2015 Deforestation Hotspot Base Map

Image 28 b. UMD/GLAD

This analysis builds off the previous MAAP #26, where we presented an initial map of “Deforestation hotspots in the Peruvian Amazon in 2015,” based on an analysis of data from the new GLAD* alerts.

Image 28b shows an updated version of the 2015 Peruvian Amazon deforestation hotspots map. Inset F shows the new hotspot featured in this article (see details below).

Note about the Hotspots: Insets A and B indicate two hotspots in the Ucayali region – see MAAP #26 for more detail. Insets C and D indicate two hotspots in Huánuco that we are currently analyzing. Inset E indicates the illegal gold mining zone known as La Pampa, described in various MAAP articles (for example, see MAAP #12). Inset F shows the area of interest in this article.


New Deforestation Front

Image 28c.
Image 28c. PNCB/MINAM, Hansen/UMD/Google/USGS/NASA, UMD/GLAD, MTC, MINAGRI

Image 28c shows detailed information about the deforestation surrounding the town of Iberia in northeast Madre de Dios (see Inset F in Image 28a for context).

Note the extensive deforestation in both 2014 and 2015 along both sides of the Interoceanic highway (1,830 hectares, or 4,522 acres).

Also note that much of the deforestation is an agglomeration of small-scale patches and occurs within forestry concessions (timber and rubber harvesting).

Insets F1 and F2 show the zooms described in greater detail below.


Zoom F1

Image 28d compares two satellite images of the area indicated in Inset F1 (see Image 28c for context) between September 2013 (left panel) and January 2016 (right panel). Note the large increase in newly deforested areas for what appears to be small-scale agricultural inside a timber concession.

Image 28d. Data: USGS, Planet Labs
Image 28d. Data: NASA/USGS, Planet Labs, PNCB/MINAM, UMD/GLAD

Zoom F2

Image 28e compares satellite images of the area indicated in Inset F2 (see Image 28c for context) between September 2013 (left panel) and December 2015 (right panel). Note the large increase in newly deforested areas for what appears to be small-scale agricultural within a rubber concession.

Image 28e. Data: USGS, PNCB/MINAM, UMD/GLAD
Image 28e. Data: NASA/USGS.

References

* Produced by the University of Maryland, Google, and WRI’s Global Forest Watch. http://www.globalforestwatch.org/map/5/-9.31/-75.01/PER/grayscale/umd_as_it_happens

*Hansen, M.C., A. Krylov, A. Tyukavina, P.V. Potapov, S. Turubanova, B. Zutta, S. Ifo, B. Margono, F. Stolle, and R. Moore. Humid tropical forest disturbance alerts using Landsat data. Environ. Res. Lett. 11: 034008.

Citation

Finer M & Novoa S (2016) New Deforestation Hotspot in Madre de Dios, 2016. MAAP: 28.


MAAP #27: United Cacao Continues Deforestation of Primary Forest in Tamshiyacu (Loreto, Peru)

Deforestation continues to increase in the land owned and operated by United Cacao  near the town of Tamshiyacu in the northern Peruvian Amazon. Since 2013, we have documented the deforestation of 2,380 hectares (5,880 acres) related to this project, the vast majority at the expense of primary forest*. Of this total, 250 hectares were clear-cut after the Peruvian Ministry of Agriculture ordered the “paralyzation” of the company’s agricultural activities in December 2014**. Here in MAAP #27, we present evidence that indicates the deforestation related to this project will continue to expand in the coming months.

Image 27a. Data: USGS.

Image 27a shows a series of satellite images (Landsat) that shows the advance of deforestation in in the northern part of the United Cacao project. The left panel shows this area contained a remnant of primary forest (see dark green color in Inset A) in July 2014. The central panel shows that, by September 2015, a new access road network was constructed in the southern part of this area (see pink color, which indicates recently deforested areas). Finally, the right panel shows that in February 2016 (the most recent image), the southern part of that same area is now deforested, while a new access road network has been constructed to the north. Thus, if this pattern continues (access roads followed by large-scale deforestation), we predict that deforestation will soon occur in this northern area.

High-Resolution View

Image 27b shows, in high-resolution, the deforestation of primary forest between June (left panel) and November (right panel) of 2015 in the northern part of the United Cacao project described above (see red box in both images). The image also shows the area of primary forest that is now threatened with additional deforesation (see yellow box in both images).

Image 27b. Data: WorldView-3 from Digital Globe (NextView).
Data: PNCB/MINAM, Hansen/UMD/Google/USGS/NASA, Hansen et al 2016 (ERL)***

Deforestation Trend

The graph to the right shows the trend of accumulated deforestation in the United Cacao project area between 2012 and February 2016. The company began operations in early 2013, the same year as the large increase in deforestation. Also note that deforestation increased in 2015 despite the Ministry of Agriculture’s “paralyzation” order in late 2014.


GLAD weekly alerts

It is worth emphasizing how quickly and precisely the new GLAD weekly alert system picked up the new access road construction in 2016 (see Image 27c). Also, click here to see this view on Global Forest Watch.

Image 27c. Data: UMD/GLAD, GFW, UrtheCast

Notes

*According to the Supreme Decree (No. 018-2015-MINAGRI) approving the Regulations for Forest Management under the framework of the new 2011 Forestry Act (No. 29763), the official definition of primary forest in Peru is: “Forest with original vegetation characterized by an abundance of mature trees with species of superior or dominant canopy, which has evolved naturally.” Using methods of remote sensing, our interpretation of that definition are areas that from the earliest available image (in this case, from 1985) are characterized by dense closed-canopy coverage and experienced no major clearing events. See MAAP #9 and MAAP #2 for more details.

** Resolución de Dirección General N° 462-2014-MINAGRI-DVDIAR-DGAAAA recent press release from the organization Environmental Investigation Agency reports that the order is still in effect (http://eia-global.org/blog/united-cacao-linked-companies-ordered-to-stop-operations-by-peruvian-author).

***Hansen, M.C., A. Krylov, A. Tyukavina, P.V. Potapov, S. Turubanova, B. Zutta, S. Ifo, B. Margono, F. Stolle, and R. Moore (2016) Humid tropical forest disturbance alerts using Landsat data.  Environ. Res. Lett. 11: 034008. Accessed through Global Forest Watch: www.globalforestwatch.org

Citation

Finer M, Novoa S (2016) United Cacao Continues Deforestation of Primary Forest in Tamshiyacu (Loreto, Peru). MAAP: #27.