MAAP #63: Patterns of Deforestation in the Colombian Amazon

We are excited to present our initial analysis of the Colombian Amazon, a work that reflects an important collaboration with our colleagues at Amazon Conservation Team. It is also our first report in the more interactive “Story Map” format.

This report has two objectives: 1) Illustrate the major deforestation hotspots in the Colombian Amazon between 2001 and 2015 and 2) Focus in on one of the most important hotspots, located in the Caquetá department. In short, we show satellite imagery of the expanding forest loss in one of the most important deforestation hotspots in the Colombian Amazon.

Please follow this link to view the Story Map: https://www.maapprogram.org-deforestation-patterns-colombian-amazon/

MAAP #62: Fire, Rain, and Deforestation in the Peruvian Amazon

In 2016, Peru experienced an intense forest fire season (MAAP #52, MAAP #53). A leading hypothesis was that intense drought facilitated the escape of agricultural burns. To investigate, this report analyzes the dynamic between fires and precipitation over the past 15 years, finding a strong temporal correlation (Image 62a). We also investigate the link between fires and forest loss, finding a spatial correlation.

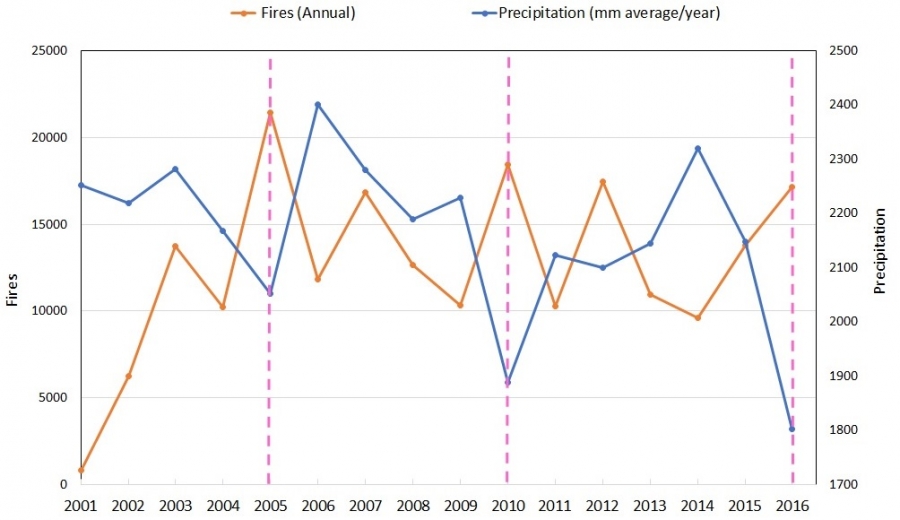
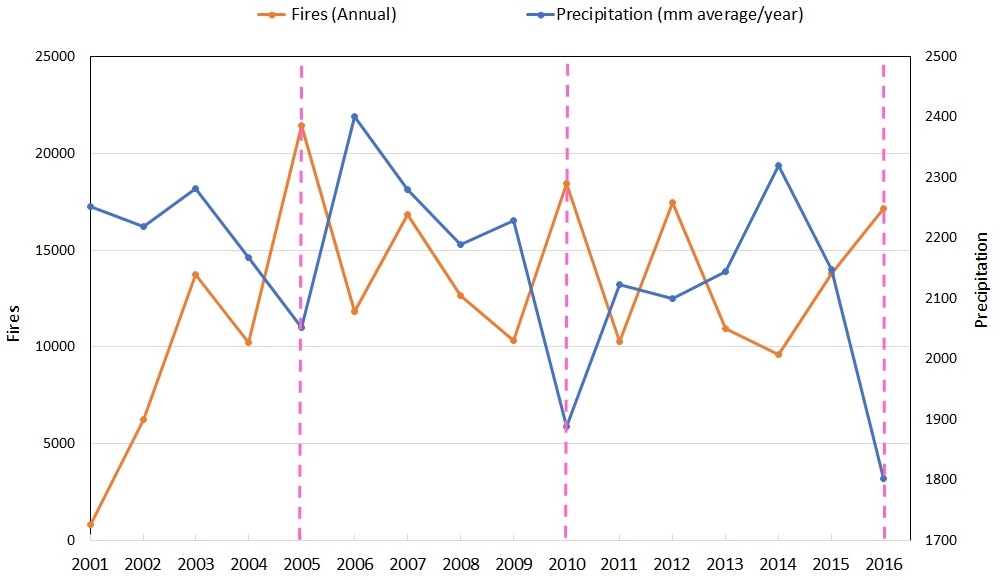
Image 62a. Data: TRMM, FIRMS/NASA, PNCB/MINAM, GLAD/UMD

Fire and Rain

Image 62a (see above) compares satellite data for fires and precipitation. Note that the three years with the least rain (2005, 2010, and 2016) correlate with the most fires (see pink lines)*. Similarly, the years with the most rain (2006 and 2014) correlate with low fire levels. Therefore, the 15-year data set indicates a strong correlation between fires and precipitation.

The exceptions of 2007 and 2012, which experienced spikes in fires despite relatively high precipitation, may be explained by the establishment of large-scale oil palm projects which generated many fires (MAAP #16, MAAP #41).

*See the Annex for information regarding the importance of increased number of dry days in 2005, 2010, and 2016.

Fire and Forest Loss

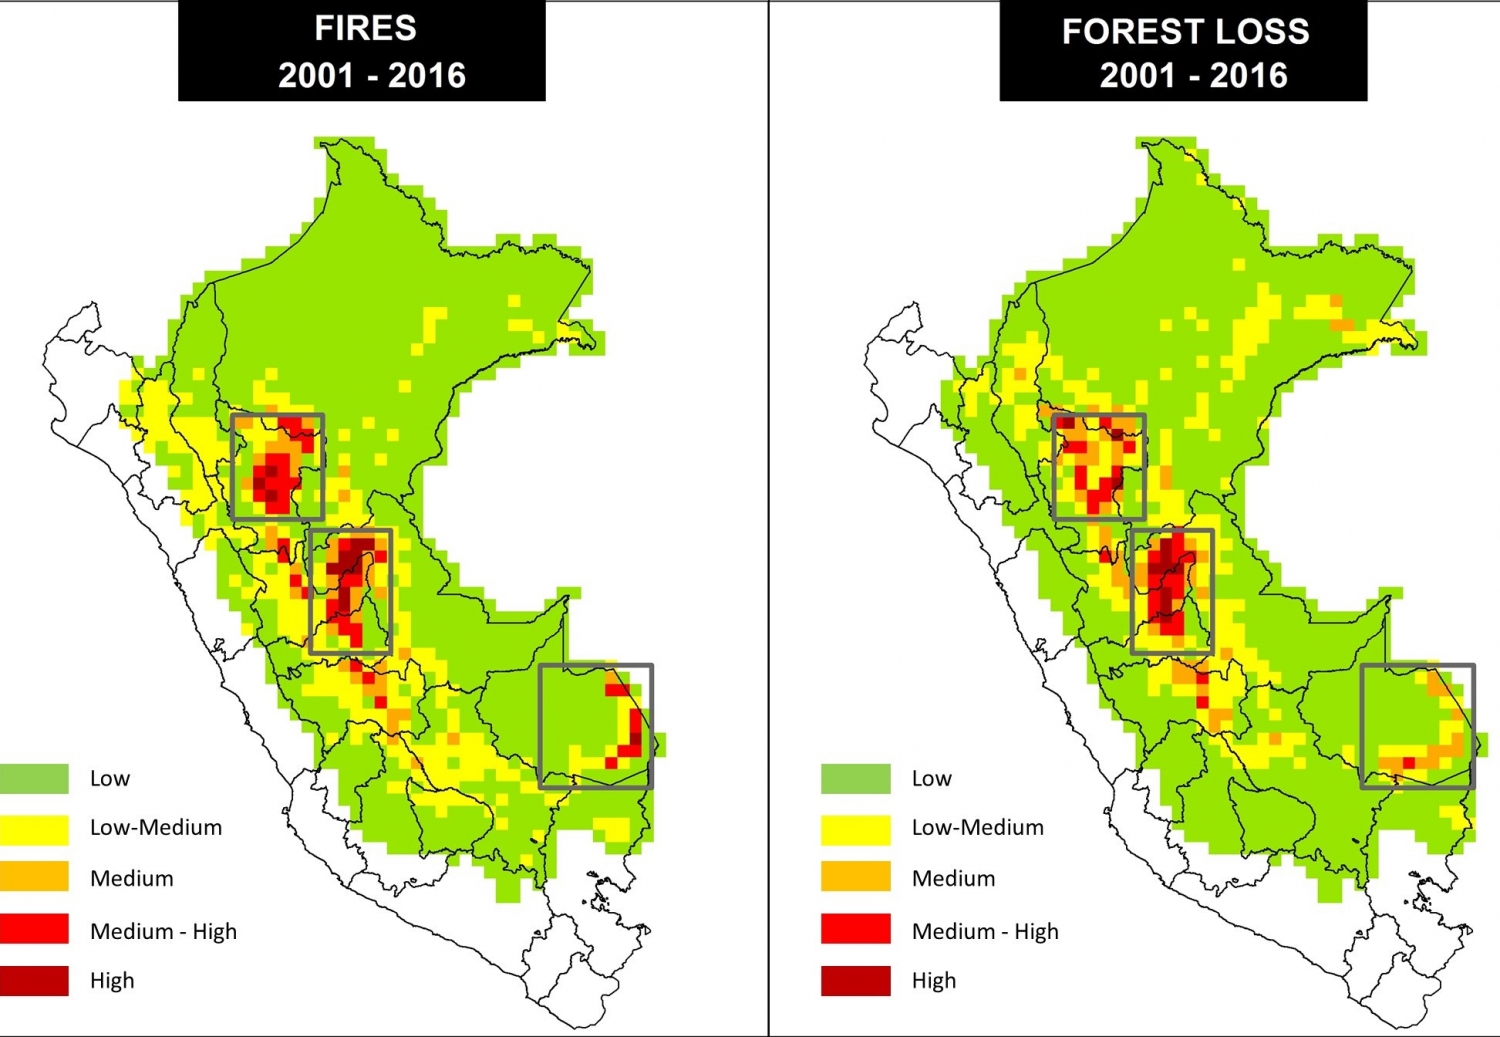
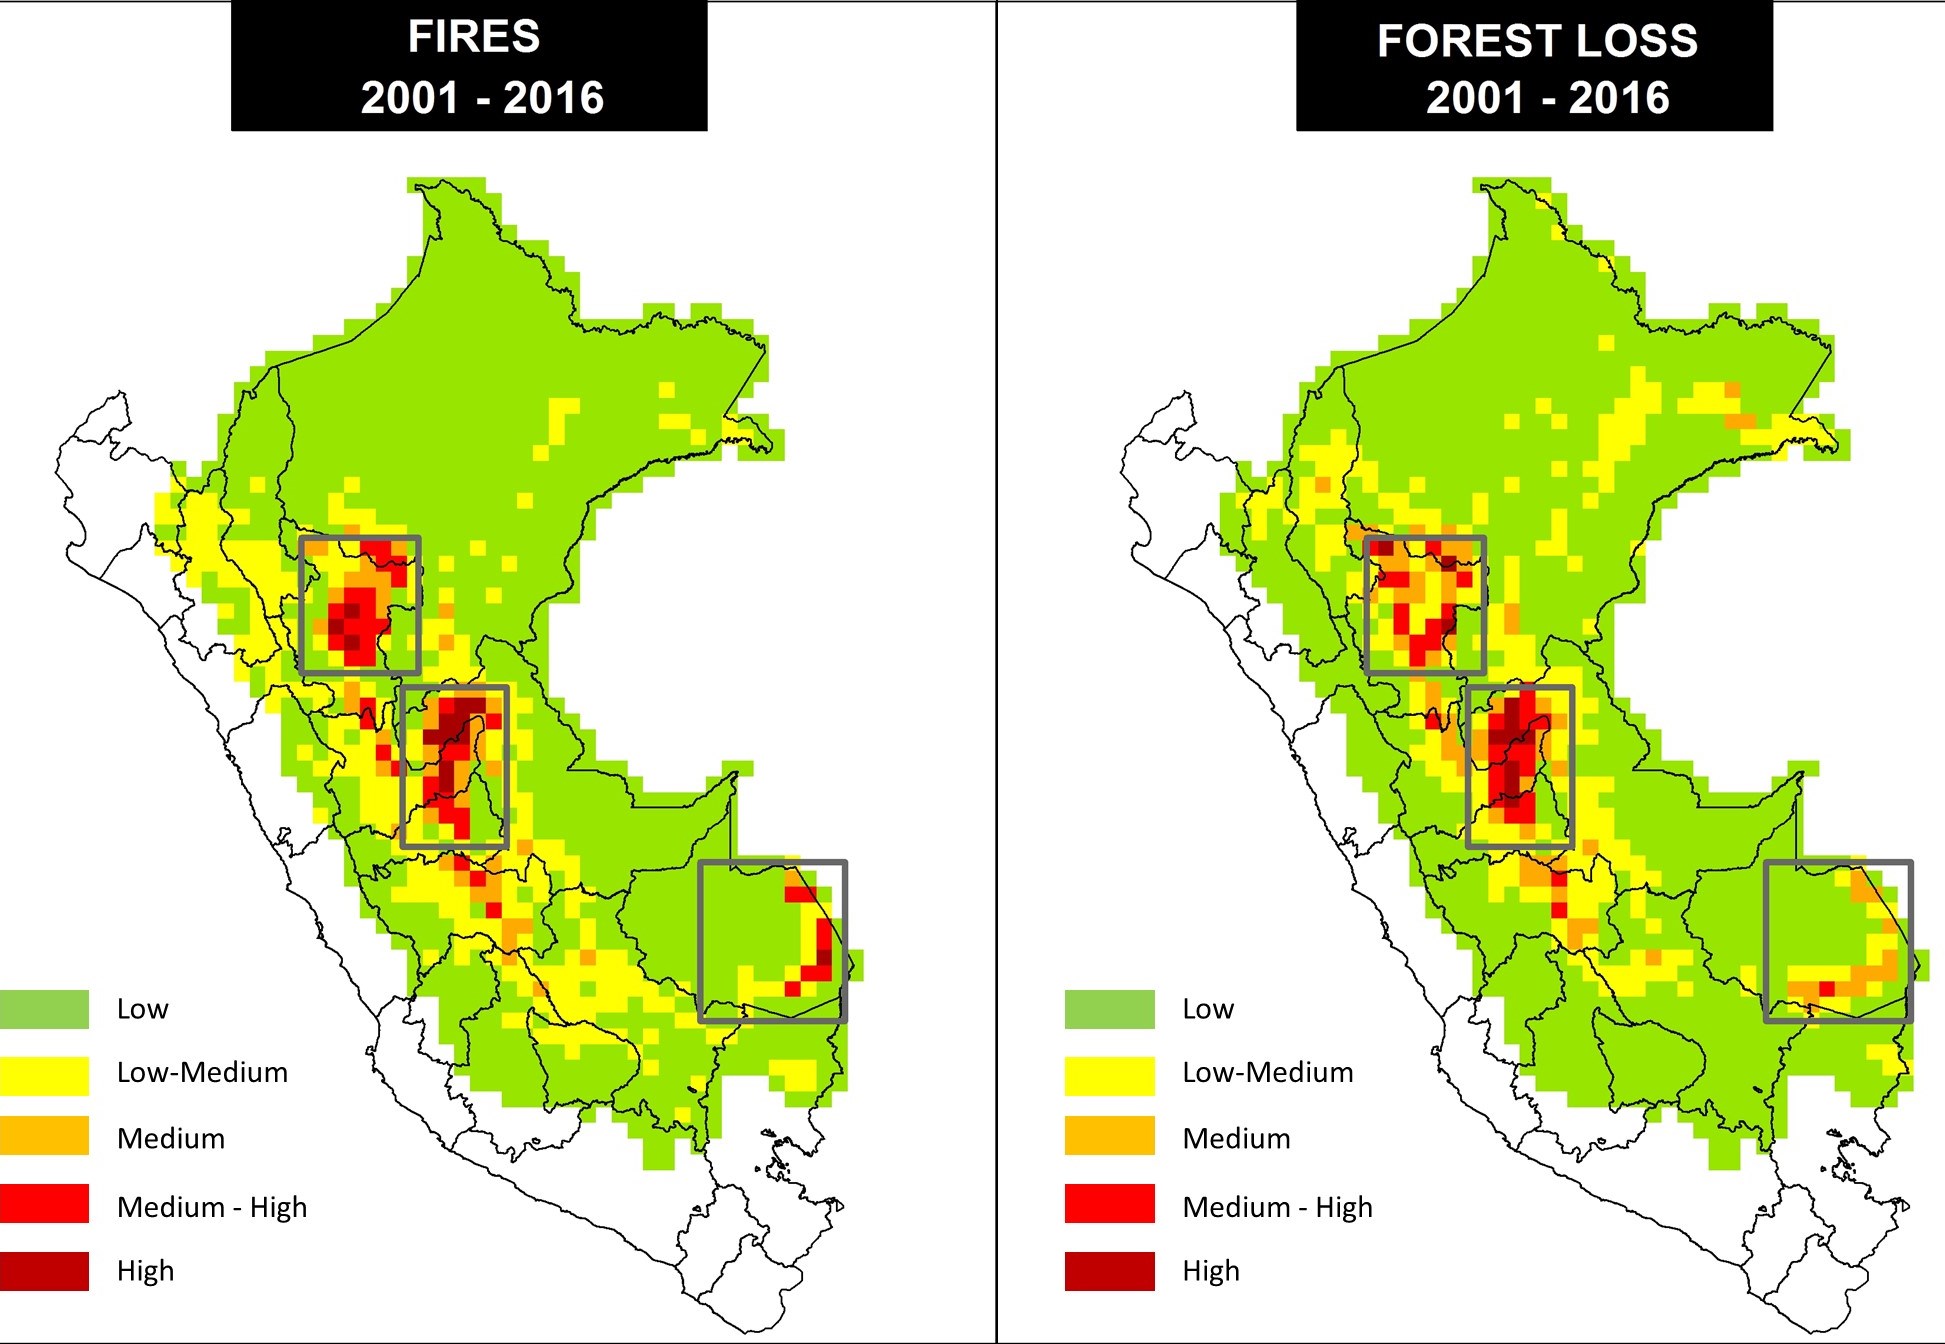
Image 62b. Data: FIRMS/NASA, PNCB/MINAM, GLAD/UMD

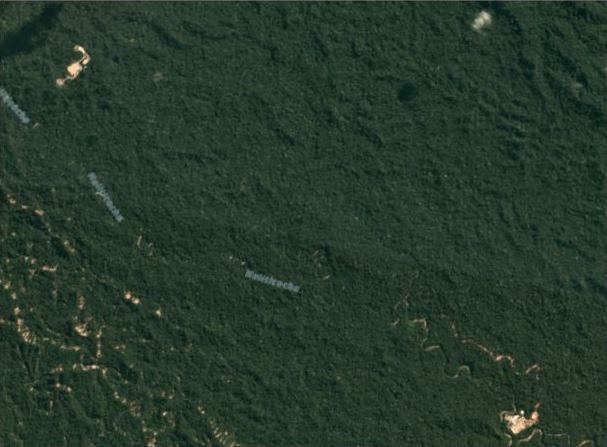
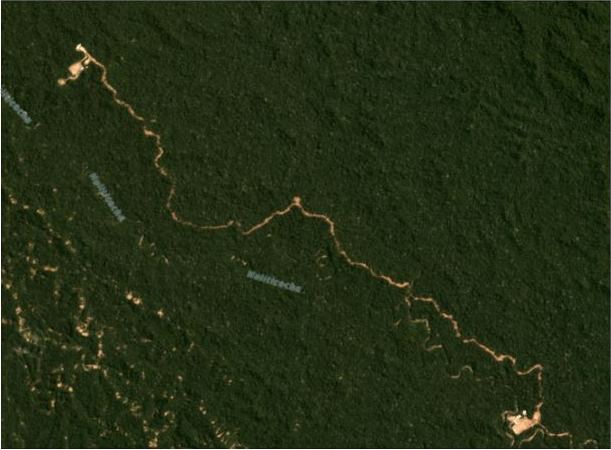
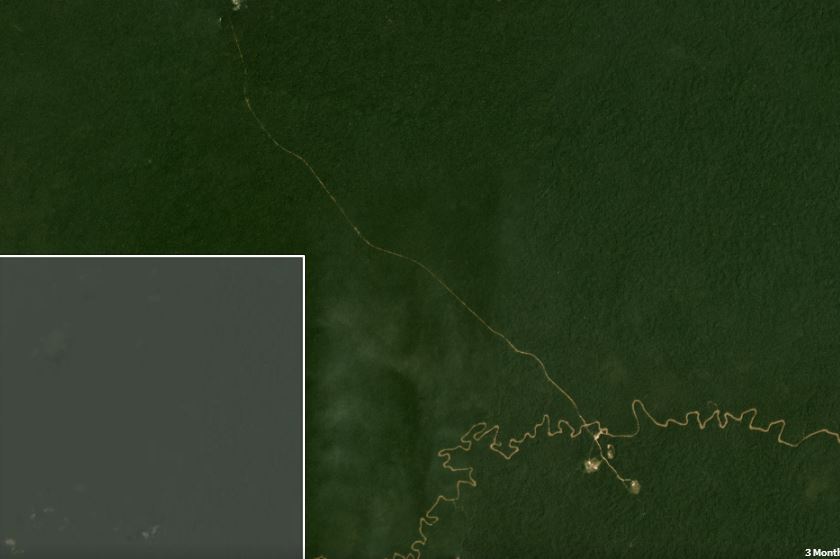
Image 62b shows the spatial correlation between fires and forest loss in the Peruvian Amazon over the last 15 years. The inset boxes indicate some of the hotspots that are common between the two variables.

Link between Fire, Rain, and Forest Loss
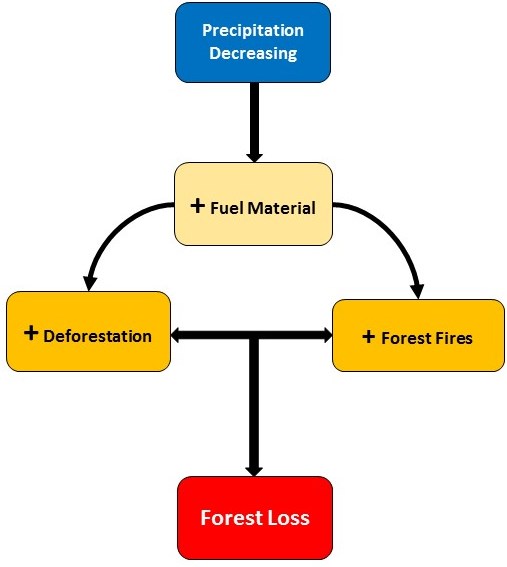
Image 62c. MAAP

A relationship exists between three key variables: fire, rain, and forest loss.

Amazonian research has found that drought increases fuel material within forests (References 1, 2, 3).

Thus, as illustrated in Image 62c, the reduction of precipitation results in an increase in combustible material that facilitates the conditions for forest fires and deforestation, which ultimately results in an increase in forest loss.


Increase in Dry Days

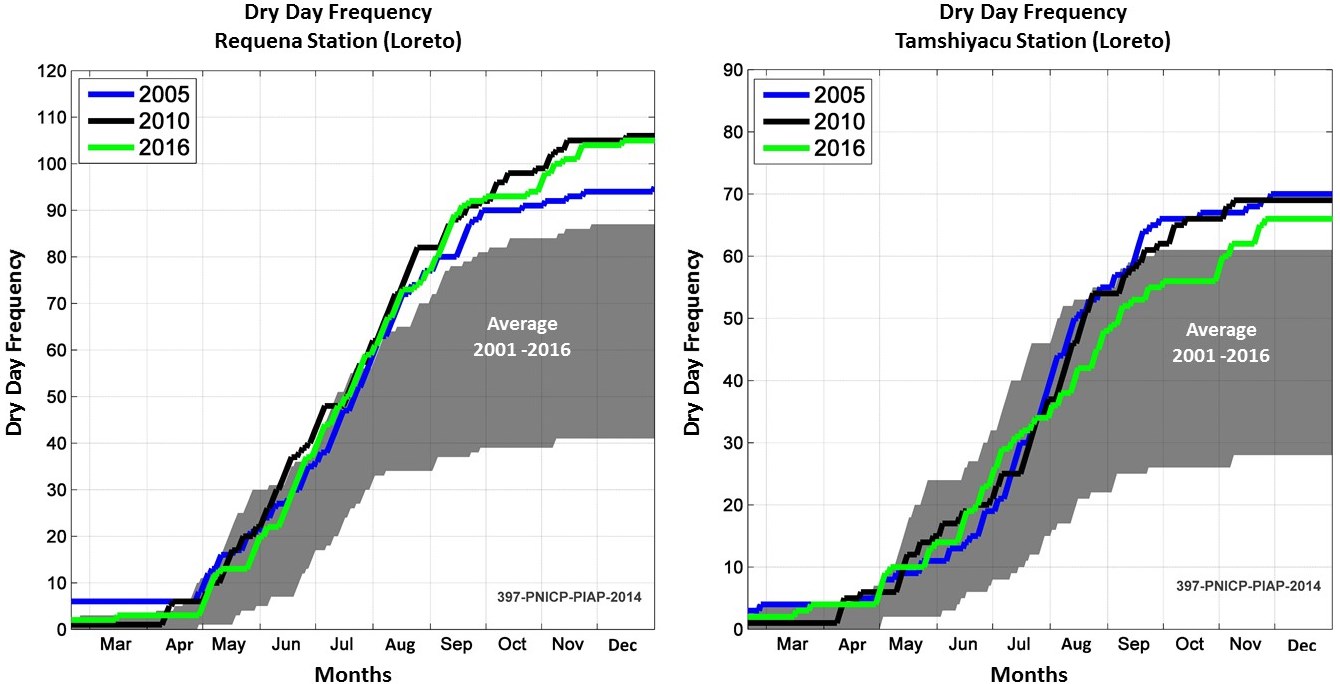
Image 62d: Data: NASA/IGP (Reference 6).

The years with the lowest annual rainfall – 2005, 2010, and 2016 – also had an increased number of “dry days” (24 hours without precipation). The number of dry days is linked to tree mortality, generating flammable material (References 4-5).

Image 62d shows a comparison of the frequency of dry days at two hydrometric stations in the northern Peruvian Amazon. Note that the number of dry days is 2016 was similar to the historic droughts in 2005 and 2010.

The Geophysical Institute of Peru (Instituto Geofisico del Perú) is monitoring the frequency of dry days in real time, as part of a study on extreme hydrological events in the Amazon. The monitoring of the frequency of dry days, a key variable regarding vegetative conditions and photosynthetic activity in the Amazon during extreme droughts, can be an important indicator of forest fire risk.

References

1. Alencar A et al. 2011. Temporal variability of forest fires in Eastern Amazonia. Ecological Aplications. 21(7) 2397-2412.

2. Armanteras & Retana, 2012. Dynamics, Patterns and Causes of Fires in Northwestern Amazonia. ONE 7(4): e35288. doi:10.1371/journal.pone.0035288

3. Gutierrez Velez et al., 2014. Land cover change interacts with drought severity to change fire regimes in Western Amazonia. Ecological Aplications. 24(6) 1323-1340.

4. Marengo, J.A & Espinoza, J.C. 2015. Review Extreme seasonal droughts and floods in Amazonia: causes, trends and impacts. International Journal of Climatology.

5. Espinoza JC; Segura H; Ronchail J; Drapeau G; Gutierrez-Cori O. 2016. Evolution of wet- and dry-day frequency in the western Amazon basin: Relationship with atmospheric circulation and impacts on vegetation. Water Resources Research.

6. Proyecto IGP-IRD, financiado mediante Innovate Peru: 397-PNICP-PIAP-2014: http://intranet.igp.gob.pe/eventos-extremos-amazonia-peruana/

Citation

Novoa S, Finer M (2017) Fire, Rain, and Deforestation in the Peruvian Amazon. MAAP: 62.

MAAP #61: Illegal Gold Mining Decreases in Tambopata National Reserve

In the previous MAAP #60, we showed the rapidly increasing illegal gold mining deforestation in the buffer zone of Tambopata National Reserve. In contrast, here we show that the rate of illegal gold mining deforestation is decreasing within Tambopata National Reserve, due to the active interventions by the Peruvian Government. Tambopata is an important protected area in the southern Peruvian Amazon due to its high biodiversity.

Image 61. Data: Planet, MAAP, SERNANP

Gold Mining Deforestation within Reserve

Image 61 shows the trajectory of illegal gold mining deforestation within Tambopata National Reserve, from the initial invasion in September 2015 to May 2017. Although the rate has decreased, total deforestation within the Reserve has increased to 1,360 acres (550 hectares*) since September 2015. The Peruvian national protected areas agency, SERNANP, is stating that 90% of the invaded area has been cleared of illegal miners.

* Our estimate of 550 hectares refers specifically to gold mining deforestation within Tambopata National Reserve since September 2015. SERNANP’s estimate of 750 hectares includes all mining activities (not just deforestation) since the creation of the Reserve.

Decreasing Deforestation Rate

Table 61 shows how the rate of gold mining deforestation within Tambopata National Reserve between January 2016 and April 2017. Peaks in deforestation occurred in March and August 2016, followed by a sharp decrease in September, when the Peruvian government carried out a series of raids within the Reserve.

Table 61. Data: MAAP

Two Areas to Watch

We detected, however, some recent mining activity in two areas within Tambopata National Reserve (Insets A and B in Image 61). Images 61A and 61B show these areas between November 2016 (left panel) and May 2017 (right panel). The red dots () indicate the same location across time between the panels.

Image 61a. Data: SERNANP, RapidEye/Planet, Sentinel/ESA
Image 61b Data: SERNANP, RapidEye/Planet, Sentinel/ESA

In response to these continued, isolated incursions by illegal miners in Tambopata National Reserve, SERNANP has been continuously carrying out patrols and raids, with the goal of completely eliminating illegal gold mining from the Reserve. In fact, prior to this publication, SERNANP, together with other authorities, carried out a raid in the area shown in Image 61b.

Citation

Finer M, Novoa S, Olexy T (2017) Illegal Gold Mining Decreases in Tambopata National Reserve. MAAP: 61.

MAAP #60: Gold Mining Increases in Buffer Zone of Tambopata National Reserve

In the previous MAAP #50, we presented an analysis of the extent of gold mining deforestation in the southern Peruvian Amazon as of September 2016. Here, we partially update the data for the area within the buffer zone of Tambopata National Reserve.* We document the increase of 1,135 acres (460 hectares) of illegal mining deforestation during the last 8 months, from September 2016 to May 2017 (see red in Image 60). That brings the total deforested area in the buffer zone to 10,970 acres (4,440 hectares) since 2012.

Image 60. Data: Planet, MAAP, SERNANP

*The buffer zone does not form part of the respective protected area, thus it is not under the jurisdiction of the Peruvian national protected areas agency, SERNANP. However, the illegal activities that are being carried out in the buffer zone are putting the conservation values of the protected area at risk, and are under the jurisdiction of other entities in the Peruvian government.

High-Resolution Zooms

Image 60a shows the buffer zone’s most active deforestation front between September 2016 (left panel) and May 2017 (right panel). Inset A1 highlights the most recent deforestation, showing the advance just between March (left panel) and May (right panel) 2017. The red points () indicate the same place on both panels.

Image 60a. Data: RapidEye/Planet, Sentinel/ESA
Inset A1. Data: RapidEye/Planet, Sentinel/ESA

Movement of Illegal Mining Camps

Image 60b is a GIF that shows the continual movement of illegal mining camps towards the active deforestation front, between November 2015 and March 2017. Note that previous camps are abandoned after the relocation.

Image 60b. Data: DigitalGlobe (Nextview), Planet

Legal Implications

Recently, a bill has been presented in the Peruvian Congress that proposes that illegal mining should not be classified as an organized crime. However, as evidenced in this report, the illegal gold mining camps operate in a highly organized manner.

Citation

Finer M, Olexy T, Novoa S (2017) Gold Mining Increases in the Buffer Zone of Tambopata National Reserve. MAAP: 60.

MAAP 59: Power of “Small Satellites” from Planet

Image 59a. Source: Planet

The company Planet is pioneering the use of high-resolution “small satellites” (Image 59a). They are a fraction of the size and cost of traditional satellites, making it possible to produce and launch many as a large fleet. Indeed, Planet now operates 149 small satellites, known as Doves, the largest fleet in history. The Doves capture color imagery at 3-5 meter resolution, and will line up (like a string of pearls) to cover everywhere on Earth’s land area every day.

Over the past year, MAAP* has demonstrated the power of Planet imagery to monitor deforestation and degradation in near real-time in the Amazon. A consistent flow of new, high-resolution imagery is needed for this type of work, making Planet’s fleet model ideal. Below, we provide a recap of key MAAP findings based on Planet imagery, for a diverse set of cases including gold mining, agriculture deforestation, logging roads, wildfire, blowdowns, landslides, and floods.**

*MAAP has been fortunate to have access to Planet imagery via the Ambassador program.
**Note: In the images below, the red dot () indicates the same location across time between panels.

Illegal Gold Mining

Image 59b. Data: Planet, SERNANP

We used Planet imagery to closely track the recent illegal gold mining invasion of Tambopata National Reserve, a mega-diverse protected area in the southern Peruvian Amazon. Image 59b is a GIF showing the full invasion: from the initial invasion in January 2016, to subsequent deforestation advances in July and November 2016, and the most recent image in March 2017. The total deforestation from the invasion is over 1,235 acres. These images were an important resource for authorities, civil society, and the media responding to the situation.

Illegal Agriculture Deforestation

Image 59c. Data: Planet, SERNANP

We used Planet imagery to document numerous cases of small-scale deforestation for illegal agricultural practices. These examples are important because, cumulatively, small-scale deforestation represents the vast majority (80%) of forest loss events in the Peruvian Amazon (see MAAP Synthesis #2). Image 59c shows the rapid appearance of several new agricultural plots between May (left panel) and June (right panel) 2016 within an important natural protected area in the central Peruvian Amazon, El Sira Communal Reserve.

Logging Roads

Image 59d. Data: Planet

We used Planet imagery to show the rapid construction of logging roads. For example, Image 59d shows the construction of a logging road in the buffer zone of an important national park in the central Peruvian Amazon (Cordillera Azul) between November 2015 (left panel) and July 2016 (right panel).

Wildfire

Image 59e. Data: Planet

Planet imagery was also an important resource to monitor the intense wildfires in Peru last year. Image 59e shows forest loss from an escaped agricultural fire in the northern Peruvian Amazon between May (left panel) and October (right panel) 2016. Note the imagery even caught the smoke from the fires in September (middle panel).

Blowdowns

Image 59f. Data: Planet

We used Planet to help document a little-known, but important, type of natural forest loss in the Peruvian Amazon: blowdown due to strong winds from localized storms known as “hurricane winds.” Image 59f shows a high-resolution view of a recent major blowdown event between January (left panel) and August (right panel) 2016 in the northern Peruvian Amazon.

Landslides

Image 59g. Data: Planet

Planet imagery recently revealed an interesting natural phenomenon: a major landslide within a remote, rugged section of Peru’s newest national park, Sierra del Divisor. Image 59g shows the area between October 2016 (left panel) and March 2017 (right panel).

Floods

Image 59h. Data: Planet

Finally, Planet imagery played a key role in monitoring the impacts of the recent deadly floods that hit the northern Peruvian coast. Image 59h shows the rapid flooding of agricultural plots along a river in northern Peru between February (left panel) and March (right panel) 2017.

References

Planet Team (2017). Planet Application Program Interface: In Space for Life on Earth. San Francisco, CA. https://api.planet.com

Citation

Finer M, Novoa S, Mascaro J (2017) Power of “Small Satellites” from Planet. MAAP: 59.

MAAP #58: Link between Peru’s Flooding and Warm Coastal Waters

In previous articles MAAP #56 and MAAP #57, we presented a series of striking satellite images of the recent deadly floods in northern Peru. Satellites provide additional types of data critical to better understanding events such as extreme flooding. Here, we present two more types of satellite data related to the flooding: ocean water temperature and precipitation.


Warming Coastal Waters

Image 58a. Data: NOAA

Satellite data from NOAA (the U.S. National Oceanic and Atmospheric Administration) clearly shows the warming of the northern Peruvian coastal waters immediately before and during the heavy rains and flooding (1, 2). Specifically, Image 58a shows the sudden warming in January, followed by intensifying warming in February and March (white inset box indicates primary flooding zone). Peruvian experts have referred to this phenomenon as “coastal El Niño”.

Heavy Rains

Image 58b. Data: Senamhi, GPM/NASA

Image 58b shows the resulting accumulated monthly precipitation totals (white inset box indicates primary flooding zone). In January, as expected, the dry northern coast had much lower precipitation than the Amazon region to the east. In February and March, however, the northern coast experienced abnormally intense rainfall, even more than many parts of the Amazon.

Floods linked to Climate Change?

Questions have emerged regarding the link between the deadly Peruvian floods and climate change (3). As seen in the images above, the sudden appearance of warm coastal waters coincides with intense rains in the primary flooding zone. Additional analysis is needed to better understand the link between the Peruvian floods and climate change, but such events are consistent with predictions related to heavy rains fueled by ocean warming due to climate change (3). Climate change could also increase the frequency or intensity of El Niño events (4).

References

  1. Villa, L. (27 de marzo 2017). Radar Sentinel-1: Evaluación Preliminar del Impacto del Niño Costero en Perú (Parte II). [Mensaje en un blog]. Recuperado de: http://luciovilla.blogspot.com/2017/03/radar-sentinel-1-evaluacion-preliminar_27.html
  2. Villa, L. (17 de marzo 2017). Radar Sentinel-1: Evaluación Preliminar del Impacto del Niño Costero en Perú (Parte I). [Mensaje en un blog]. Recuperado de: http://luciovilla.blogspot.com/2017/03/radar-sentinel-1-evaluacion-preliminar.html
  3. Berwyn B (2017) Peru’s Floods Follow Climate Change’s Deadly Extreme Weather Trend. Inside Climate News. Link: https://insideclimatenews.org/news/24032017/peru-floods-extreme-weather-climate-global-warming-el-nino
  4. Fraser B (2017) Coastal El Niño catches Peru by surprise. EcoAmericas March 2017.

Citation

Finer M, Novoa S, Gacke S (2017) Link between Peru’s Flooding and Warm Coastal Waters. MAAP: 58.

MAAP #57: High Resolution Satellite Images of the Flooding in Peru

Image 57. Data: ESRI, INEI, MINAM. Click to enlarge.

In the previous MAAP #56, we showed a series of satellite images of the deadly floods that recently hit northern Peru.

In this report, we show a series of new, very high resolution satellite images (50 cm) of the flooding. They show, in striking detail, some of the local impacts, including to croplands and the Panamerican Highway.

Image 57 shows the 13 rivers that recently overflowed in northern Peru.

Below, we show images of the flooding around four of the rivers, labelled A-D.


Tumbes River

Image 57a shows the flooding along a stretch of the Tumbes River between October 2016 (left panel) and March 2017 (right panel). The yellow inset boxes indicate the areas of the follow-up zooms.

Image 57a. Data: Digital Globe (Nextview)
Inset A1. Data: Digital Globe (Nextview)
Inset A2. Data: Digital Globe (Nextview)

Chira River

Image 57b shows the flooding along a stretch of the Tumbes River between January (left panel) and March 2017 (right panel). The yellow inset boxes indicate the areas of the follow-up zooms.

Image 57b. Data: Digital Globe (Nextview)
Inset B1. Data: Digital Globe (Nextview)
Inset B2. Data: Digital Globe (Nextview)

La Leche River

Image 57c shows the flooding along a stretch of the La Leche River between January (left panel) and March 2017 (right panel). The yellow inset boxes indicate the areas of the follow-up zooms. Note the flooding of the PanAmerican Highway.

Image 57c. Data: Digital Globe (Nextview)
Inset C1. Data: Digital Globe (Nextview)

Jequetepeque River

Image 57d shows the flooding along a stretch of the Jequetepeque River between January (left panel) and March 2017 (right panel). The yellow inset boxes indicate the areas of the follow-up zooms.

Image 57d. Data: Digital Globe (Nextview)
Inset D1. Data: Digital Globe (Nextview)
Inset D2. Data: Digital Globe (Nextview)

References

UNOSAT, 2017. Efectos del Niño Costero: Inundaciones en Perú, Departamentos de La Libertad & Ancash. _Marzo_20170321

UNOSAT, 2017. Efectos del Niño Costero: Inundaciones en Perú, Departamentos de La Libertad & Ancash. _Marzo_20170321

UNOSAT, 2017. Efectos del Niño Costero: Inundaciones en Perú, Departamentos de Piura. Marzo_20170320

Citation

Novoa S, Finer M (2017) High Resolution Images of the Flooding in Peru. MAAP: 57

MAAP #56: Major Flooding in Northern Peru from Coastal El Niño

Image 56. Datos: NASA, ESA, JRC/Google

Intense rainfall is causing severe and deadly flooding along the northern coast of Peru.

The cause is likely “coastal El Niño,” a phenomenon produced by abnormal ocean warming along the equatorial coast of the Pacific Ocean.

Image 56 shows a preliminary estimate of the flooded areas along the northern coast (in red). We created this estimation via an analysis of radar images (Sentinel-1) that identified areas saturated with water.

Below, we show satellite images of the areas indicated by Insets A-D, which represent examples of flooding events.

Note that the red points indicate the same spots between panels.


Formation of Temporary Lagoons

An indicator of intense rains in northern Peru is the formation of the temporary lagoons La Niña and La Niña Sur, in the region of Piura. Image 56a shows the rapid formation of the lagoons between late January (left panel) and March 2017 (right panel).

Image 56a. Data: ESA

Floods that affect Towns, Infrastructure, and Crops

Image 56b shows areas where flooding has affected the Pan-American highway between January (left panel) and March (right panel) in the Lambayeque region. Image 56c shows a zoom of the overflowing La Leche River and the flooding of agricultural areas around the highway. Image 56d shows the flooding of the Reque River and the impact on agricultural areas and urban zones.

Image 56b. Data: ESA, NASA/USGS
Image 56c. Data: ESA
Image 56d. Data: Planet

References

Planet Team (2017). Planet Application Program Interface: In Space for Life on Earth. San Francisco, CA. https://api.planet.com

Citation

Novoa S, Finer M (2017) Major Flooding in Northern Peru from Coastal El Niño. MAAP: 56.

MAAP #55: New 2017 “Hurricane Winds” in Peruvian Amazon

In the previous MAAP #54, we described the phenomenon of natural forest loss due to “hurricane winds,” showing several examples from 2016 in the Peruvian Amazon. Strong winds from these localized storms can knock down hundreds of acres of forest at a time.

In January 2017, GLAD tree loss alerts indicated two new hurricane wind events in the southern Peruvian Amazon (Madre de Dios region). Below, we show high-resolution images of these cases. The first is a large hurricane wind event that knocked down 780 acres (Image 55a). The second is an event of 185 acres that took place within a forestry concession (Image 55b).

Image 55a: Data: Planet
Image 55b: Data: Planet

Very High Resolution View

We also show a new very high resolution image (0.5 meters) of one of the hurricane wind events in 2016 in the Loreto region (example B of MAAP #54). Image 55c shows the following pattern: fan-shaped pattern of forest loss with a defined orientation following the direction of the storm winds. It is worth mentioning that this event occurred within a protected area, Maijuna-Kichwa Regional Conservation Area.

Image 55c. Data: Digital Globe (Nextview)

Reference

Planet Team (2017). Planet Application Program Interface: In Space for Life on Earth. San Francisco, CA. https://api.planet.com

Citation

Finer M, Novoa S (2017) New 2017 “Hurricane Winds” in Peruvian Amazon. MAAP: 55.