 We admit that most MAAP stories are about the bad news of Amazon deforestation. But fortunately there is good news as well.
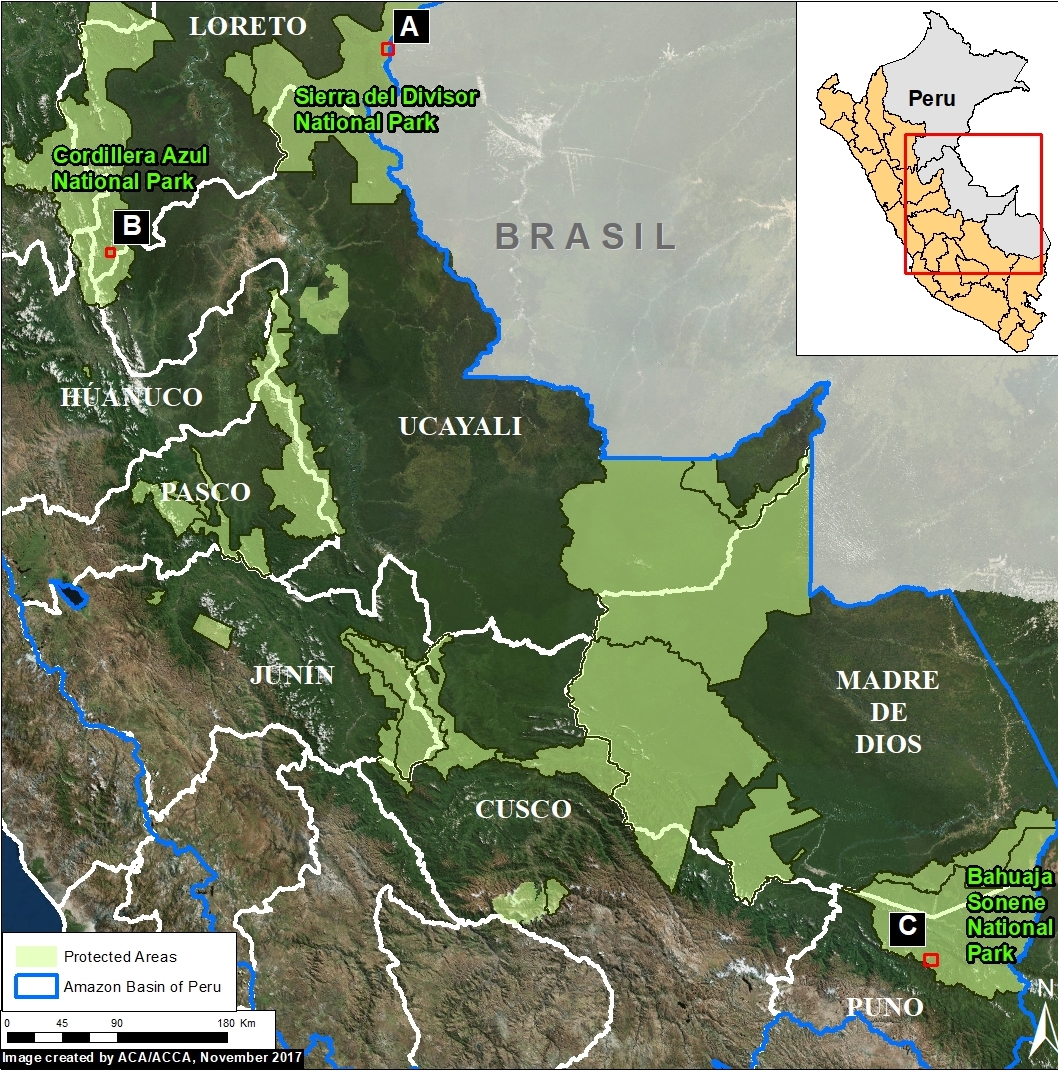
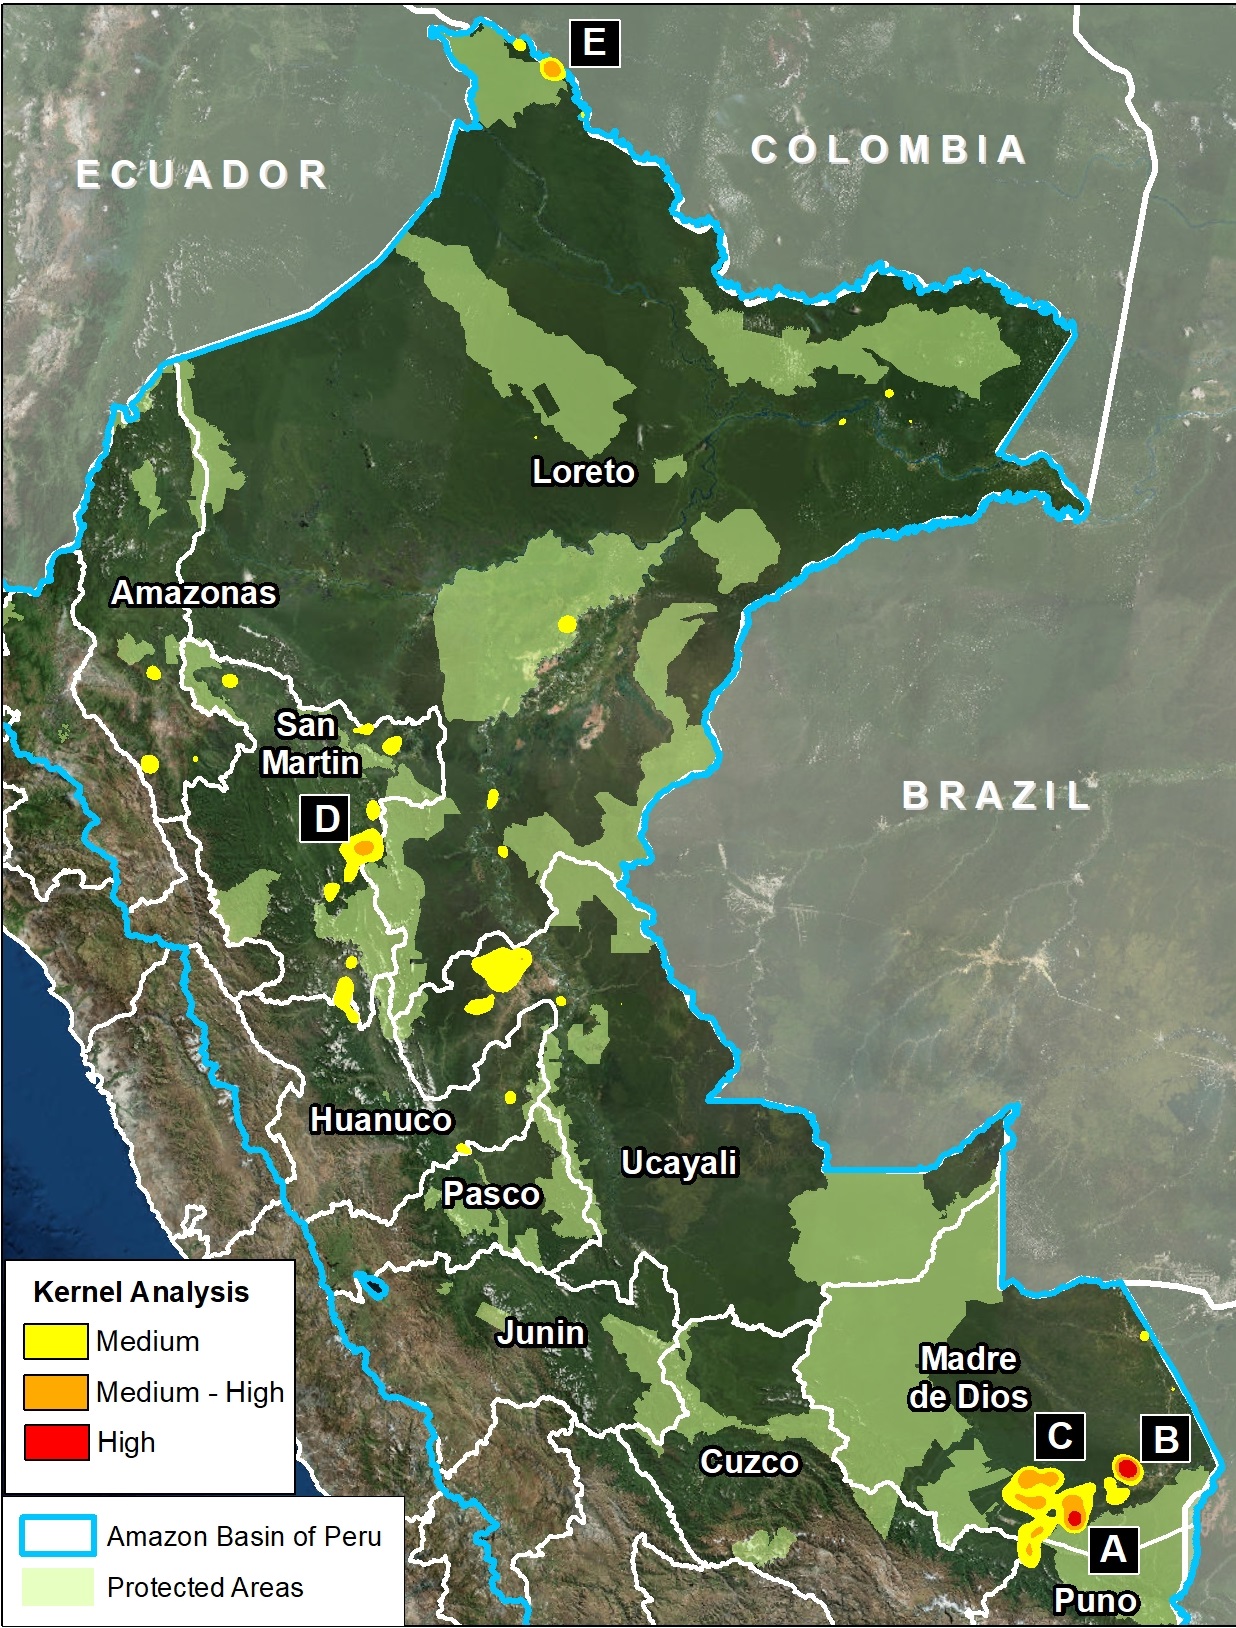
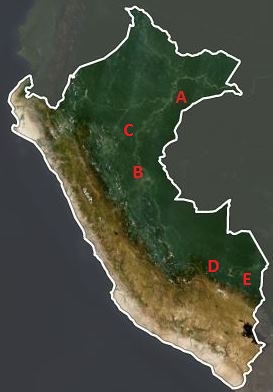
Here we highlight 5 good news stories from the Peruvian Amazon that show how near real-time monitoring may lead to halting deforestation from emerging threats, such as gold mining and large-scale agriculture (oil palm and cacao plantations).
The detailed cases are:
A) United Cacao (cacao),
B) Plantations of Pucallpa (oil palm),
C) Grupo Romero (oil palm),
D) Amarakaeri Comunal Reserve (gold mining), and
E) Tambopata National Reserve (gold mining).
United Cacao
Image 64a. Data: NASA/USGS
The rapid deforestation of primary forest for a large-scale cacao plantation in the northern Peruvian Amazon took everyone by surprise in 2013. Civil society led the way in exposing and tracking the deforestation with satellite imagery and the government eventually confirmed the forest loss data. For its part, MAAP published 6 articles (for example MAAP #35 and MAAP #2).
Although total deforestation eventually reached 5,880 acres (2,380 hectares), the company, due to a complicated combination of factors, was suspended from the London Stock Exchange and no new deforestation has been detected in over a year.
Image 64a shows that the cacao project area was covered by intact forest in late 2012, followed by large-scale deforestation of primary forest in 2013. The deforestation slowed, and then stopped, between 2014 and 2017. The yellow circle indicates the cacao plantation area over time.
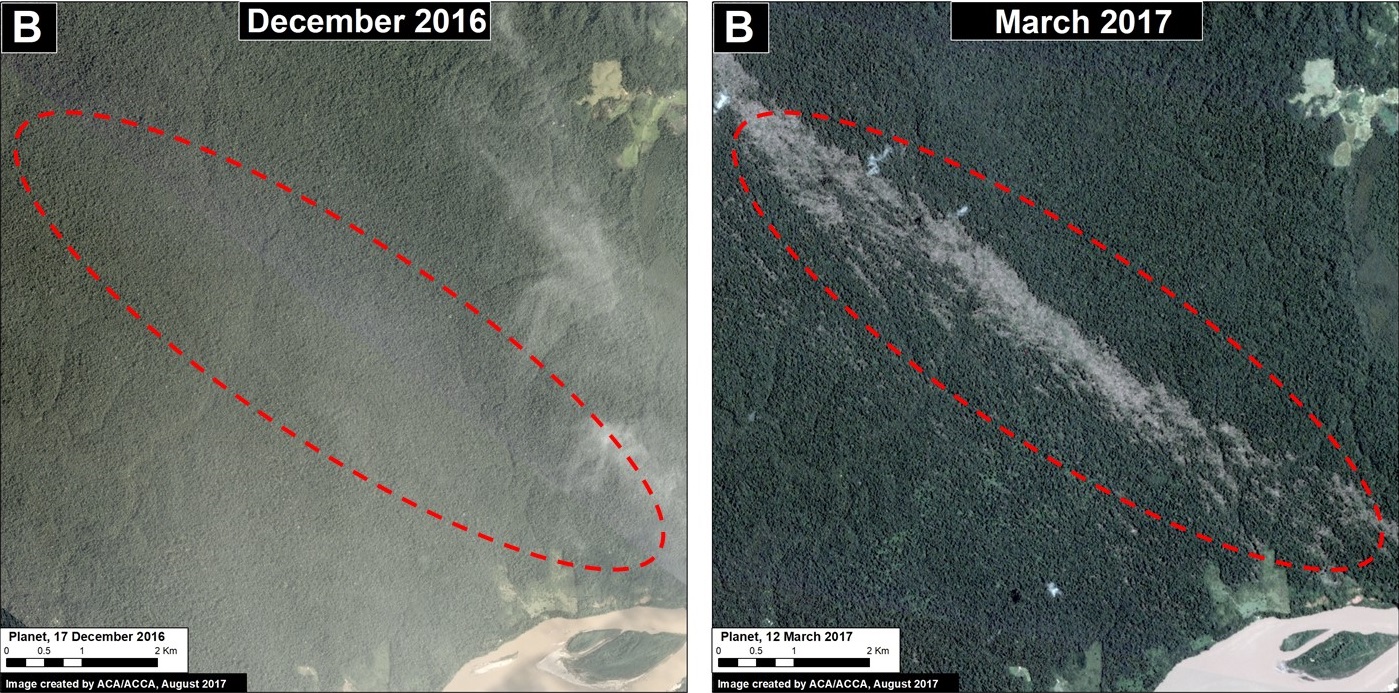
Plantations of Pucallpa (oil palm)
In a remarkable case, satellite imagery was used to demonstrate that an oil palm company (Plantations of Pucallpa) had breached the Code and Conduct of the RSPO (Roundtable on Sustainable Palm Oil), a non-profit entity founded to develop and implement global standards for sustainable palm oil.
In 2015, the Native Community of Santa Clara de Uchunya (with the support of the NGO Forest Peoples Programme) presented an official complaint to the RSPO against Plantations of Pucallpa, a member of the roundtable. An important component of the complaint alleged massive deforestation, but the company adamantly denied it. MAAP articles showing the deforestation of 15,970 acres (6,460 hectares) were used as evidence (MAAP #4, MAAP #41), as was independent government analysis.
In April 2017, the RSPO concluded that Plantations of Pucallpa cleared 14,145 acres (5,725 hectares) despite declaring no land-clearing, thus breaching the Code and Conduct. Several months prior this decision, the company divested its oil palm estates and withdrew from the RSPO. We have not detected any new deforestation in the project area in over a year.
Image 64b shows the massive deforestation for two large-scale oil palm plantations in the central Peruvian Amazon (Plantations of Pucallpa is the plantation to the north). The yellow circles indicate the oil palm plantation project areas over time. Note that the project area was a mix of primary and secondary forest in 2011, immediately prior to the deforestation, which began in 2012. The deforestation intensified in 2013 before nearly reaching its maximum extent in 2015. We have not detected any new deforestation since 2016.
Image 64b. Data: NASA/USGS, MAAP
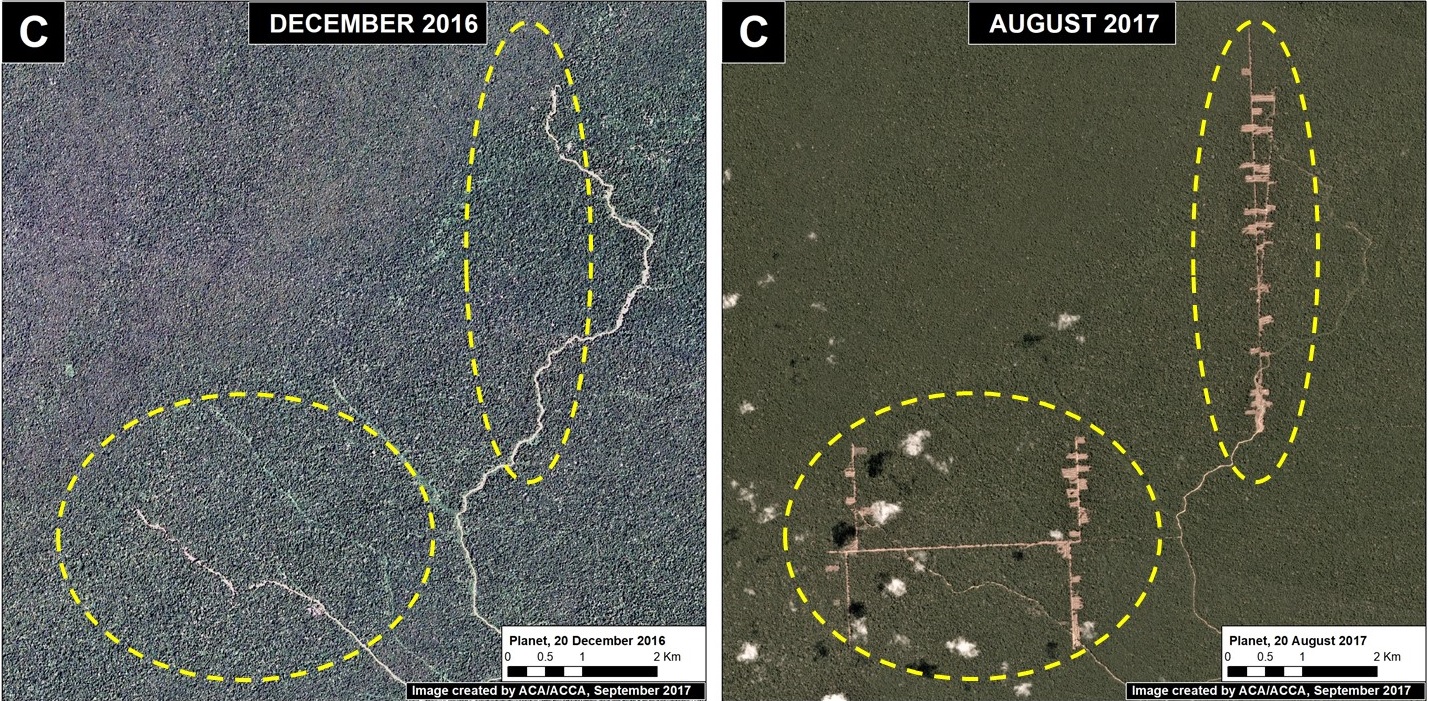
Grupo Romero (oil palm)
Perhaps the best news of the bunch is about four large-scale oil palm plantations that were stopped before any deforestation occurred. As detailed in a recent report by Environmental Investigation Agency, the Peruvian business conglomerate Grupo Romero conducted environmental impact studies for four new oil palm plantations in the northern Peruvian Amazon. Analysis of these studies revealed that these plantations would cause the massive deforestation of 56,830 acres (23,000 hectares) of primary forest. After strong pushback from civil society, including legal action, a recent report from Chain Reaction Research revealed that Grupo Romero is now working towards a zero-deforestation supply chain and thus found that the four planned plantations are no longer feasible and abandoned the projects.
Image 64c shows how the project area for two of the proposed oil palm plantations (in yellow), Santa Catalina and Tierra Blanca, is largely covered by intact, primary forest.
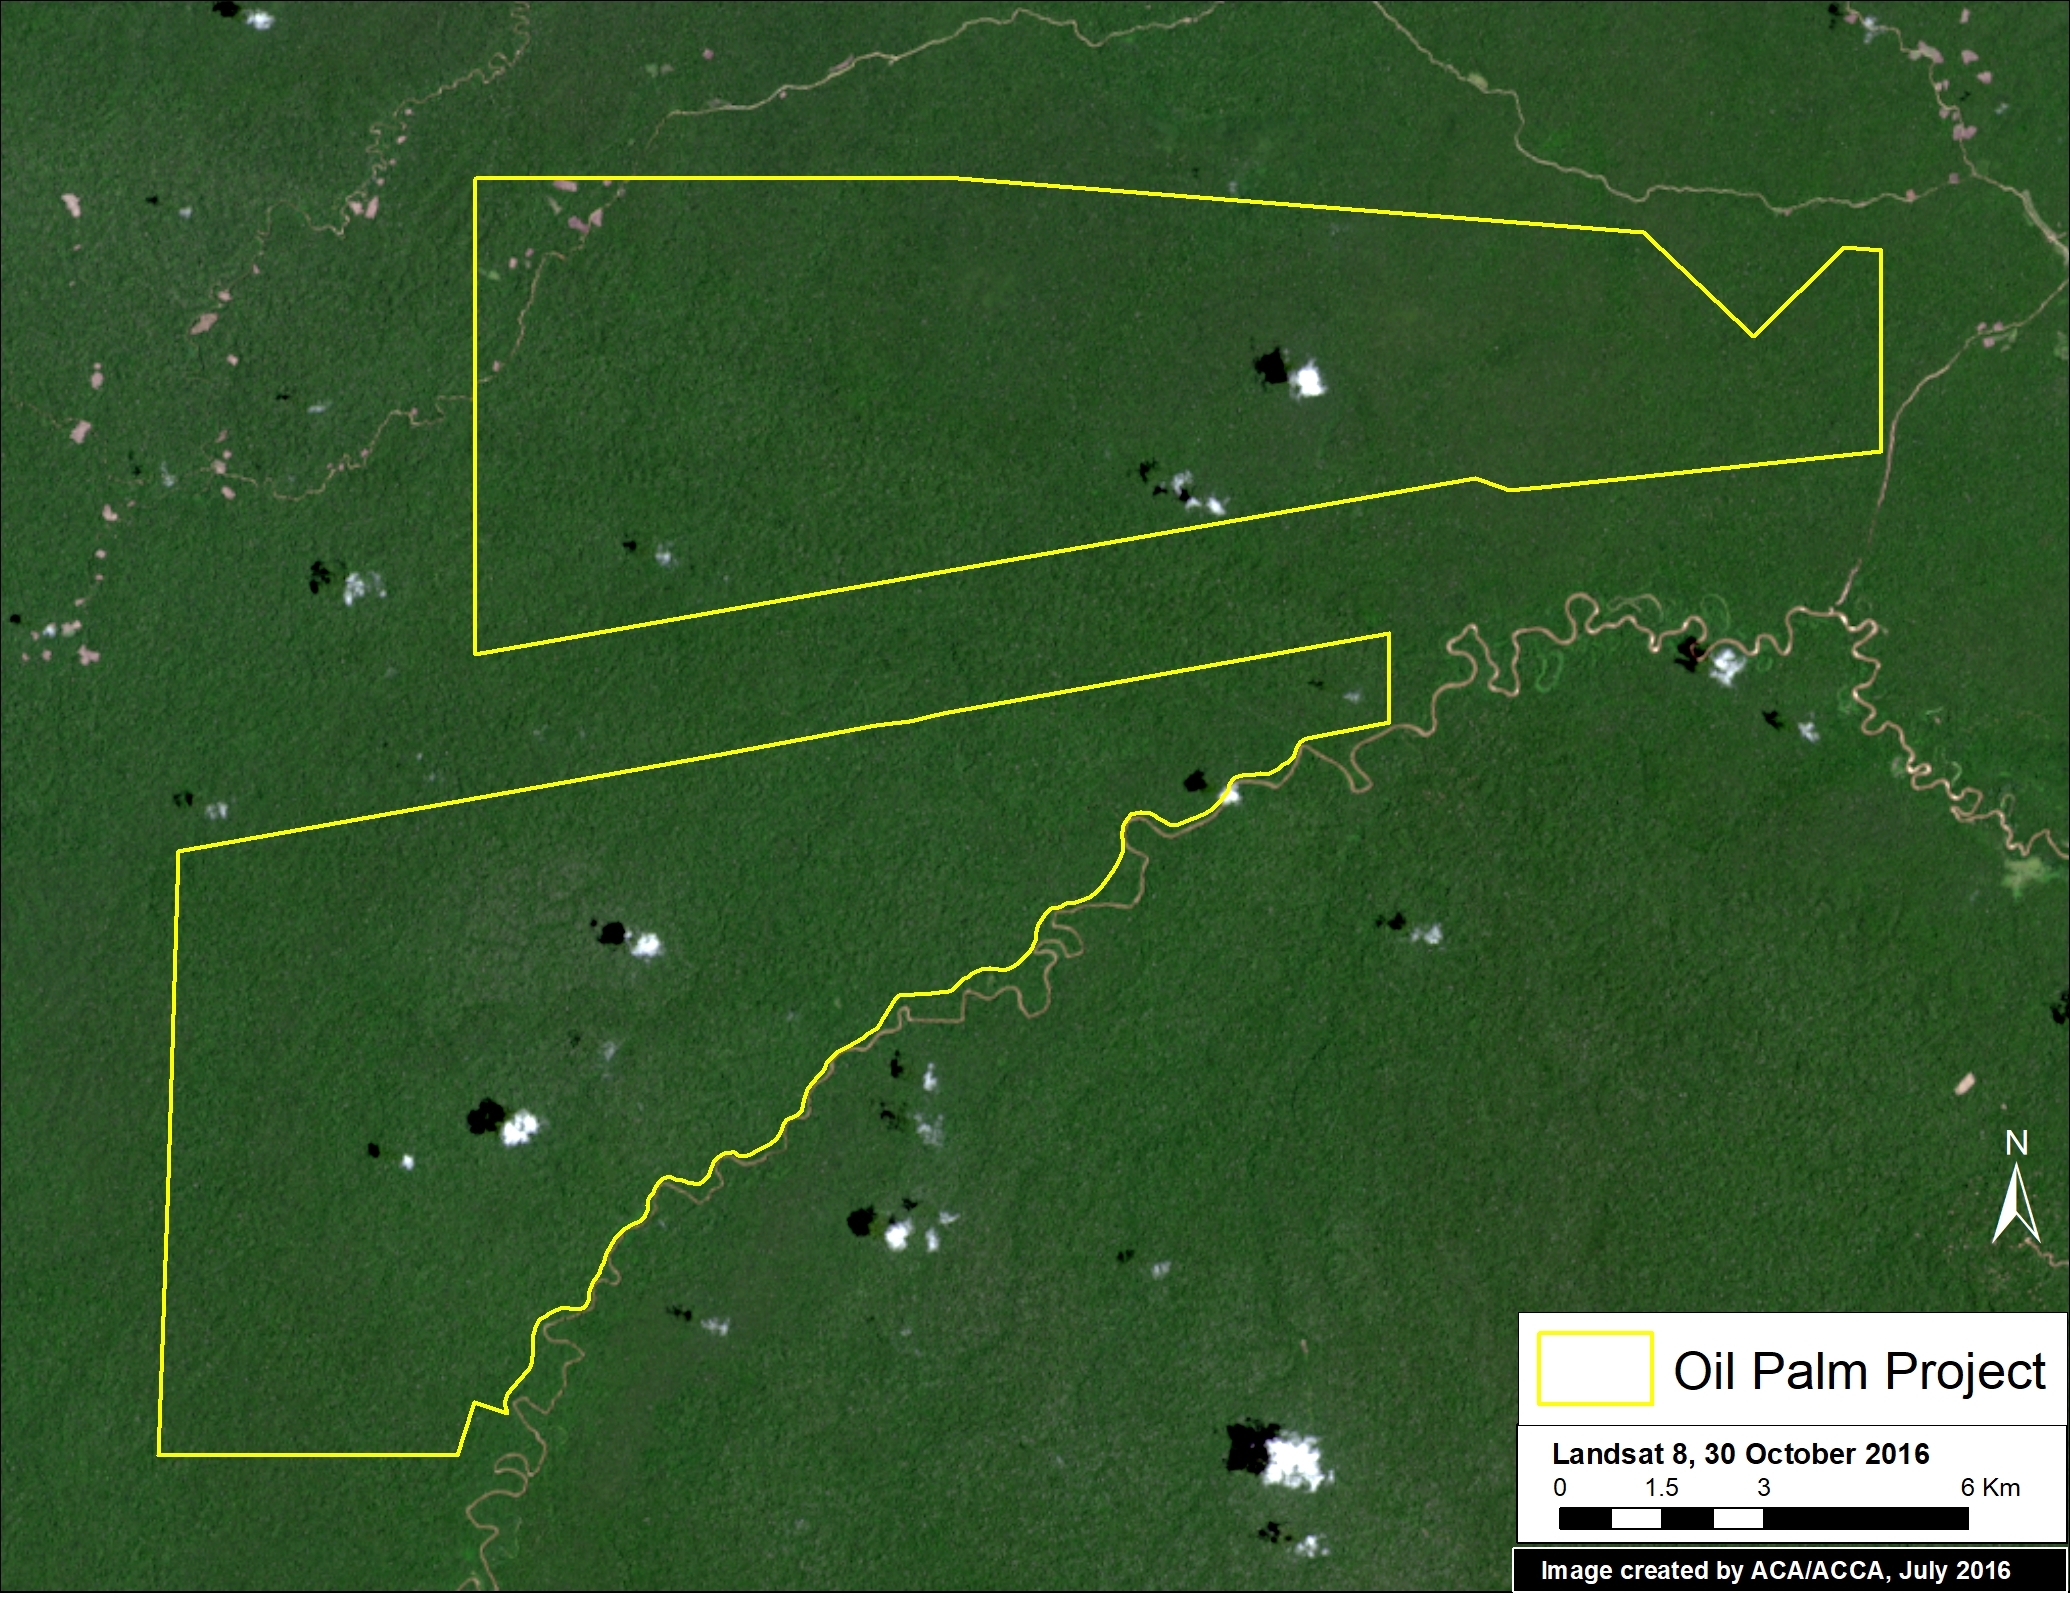
Image 64c. Data: NASA/USGS, Grupo Palmas (Grupo Romero)
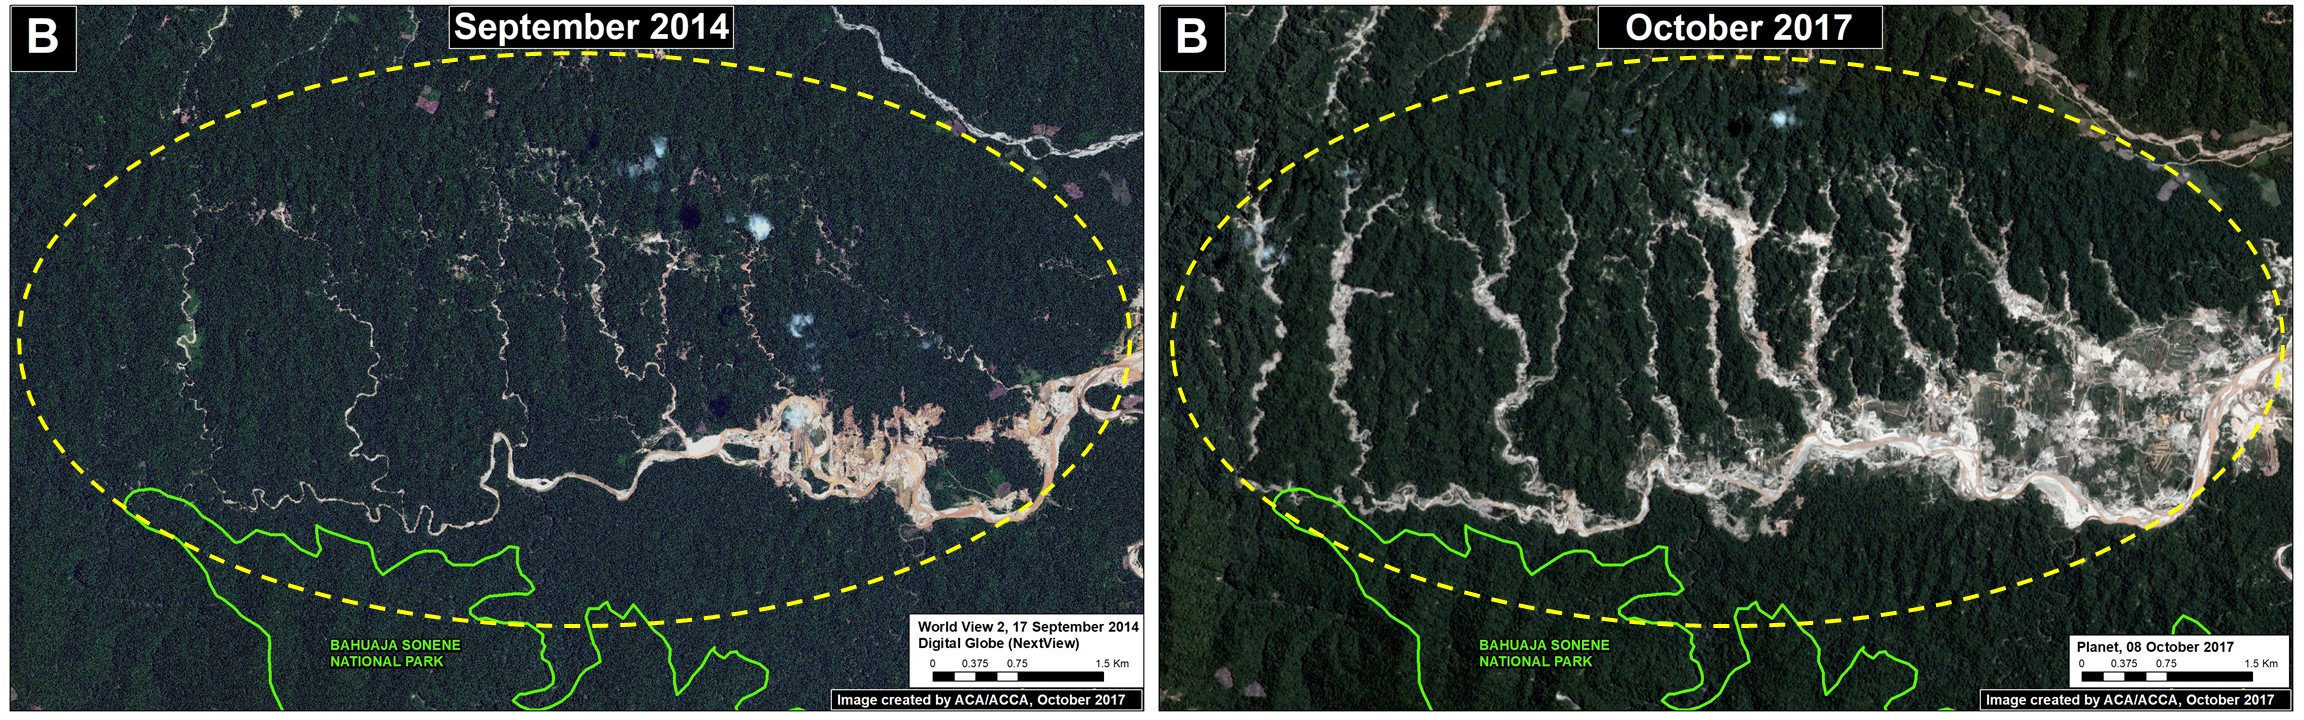
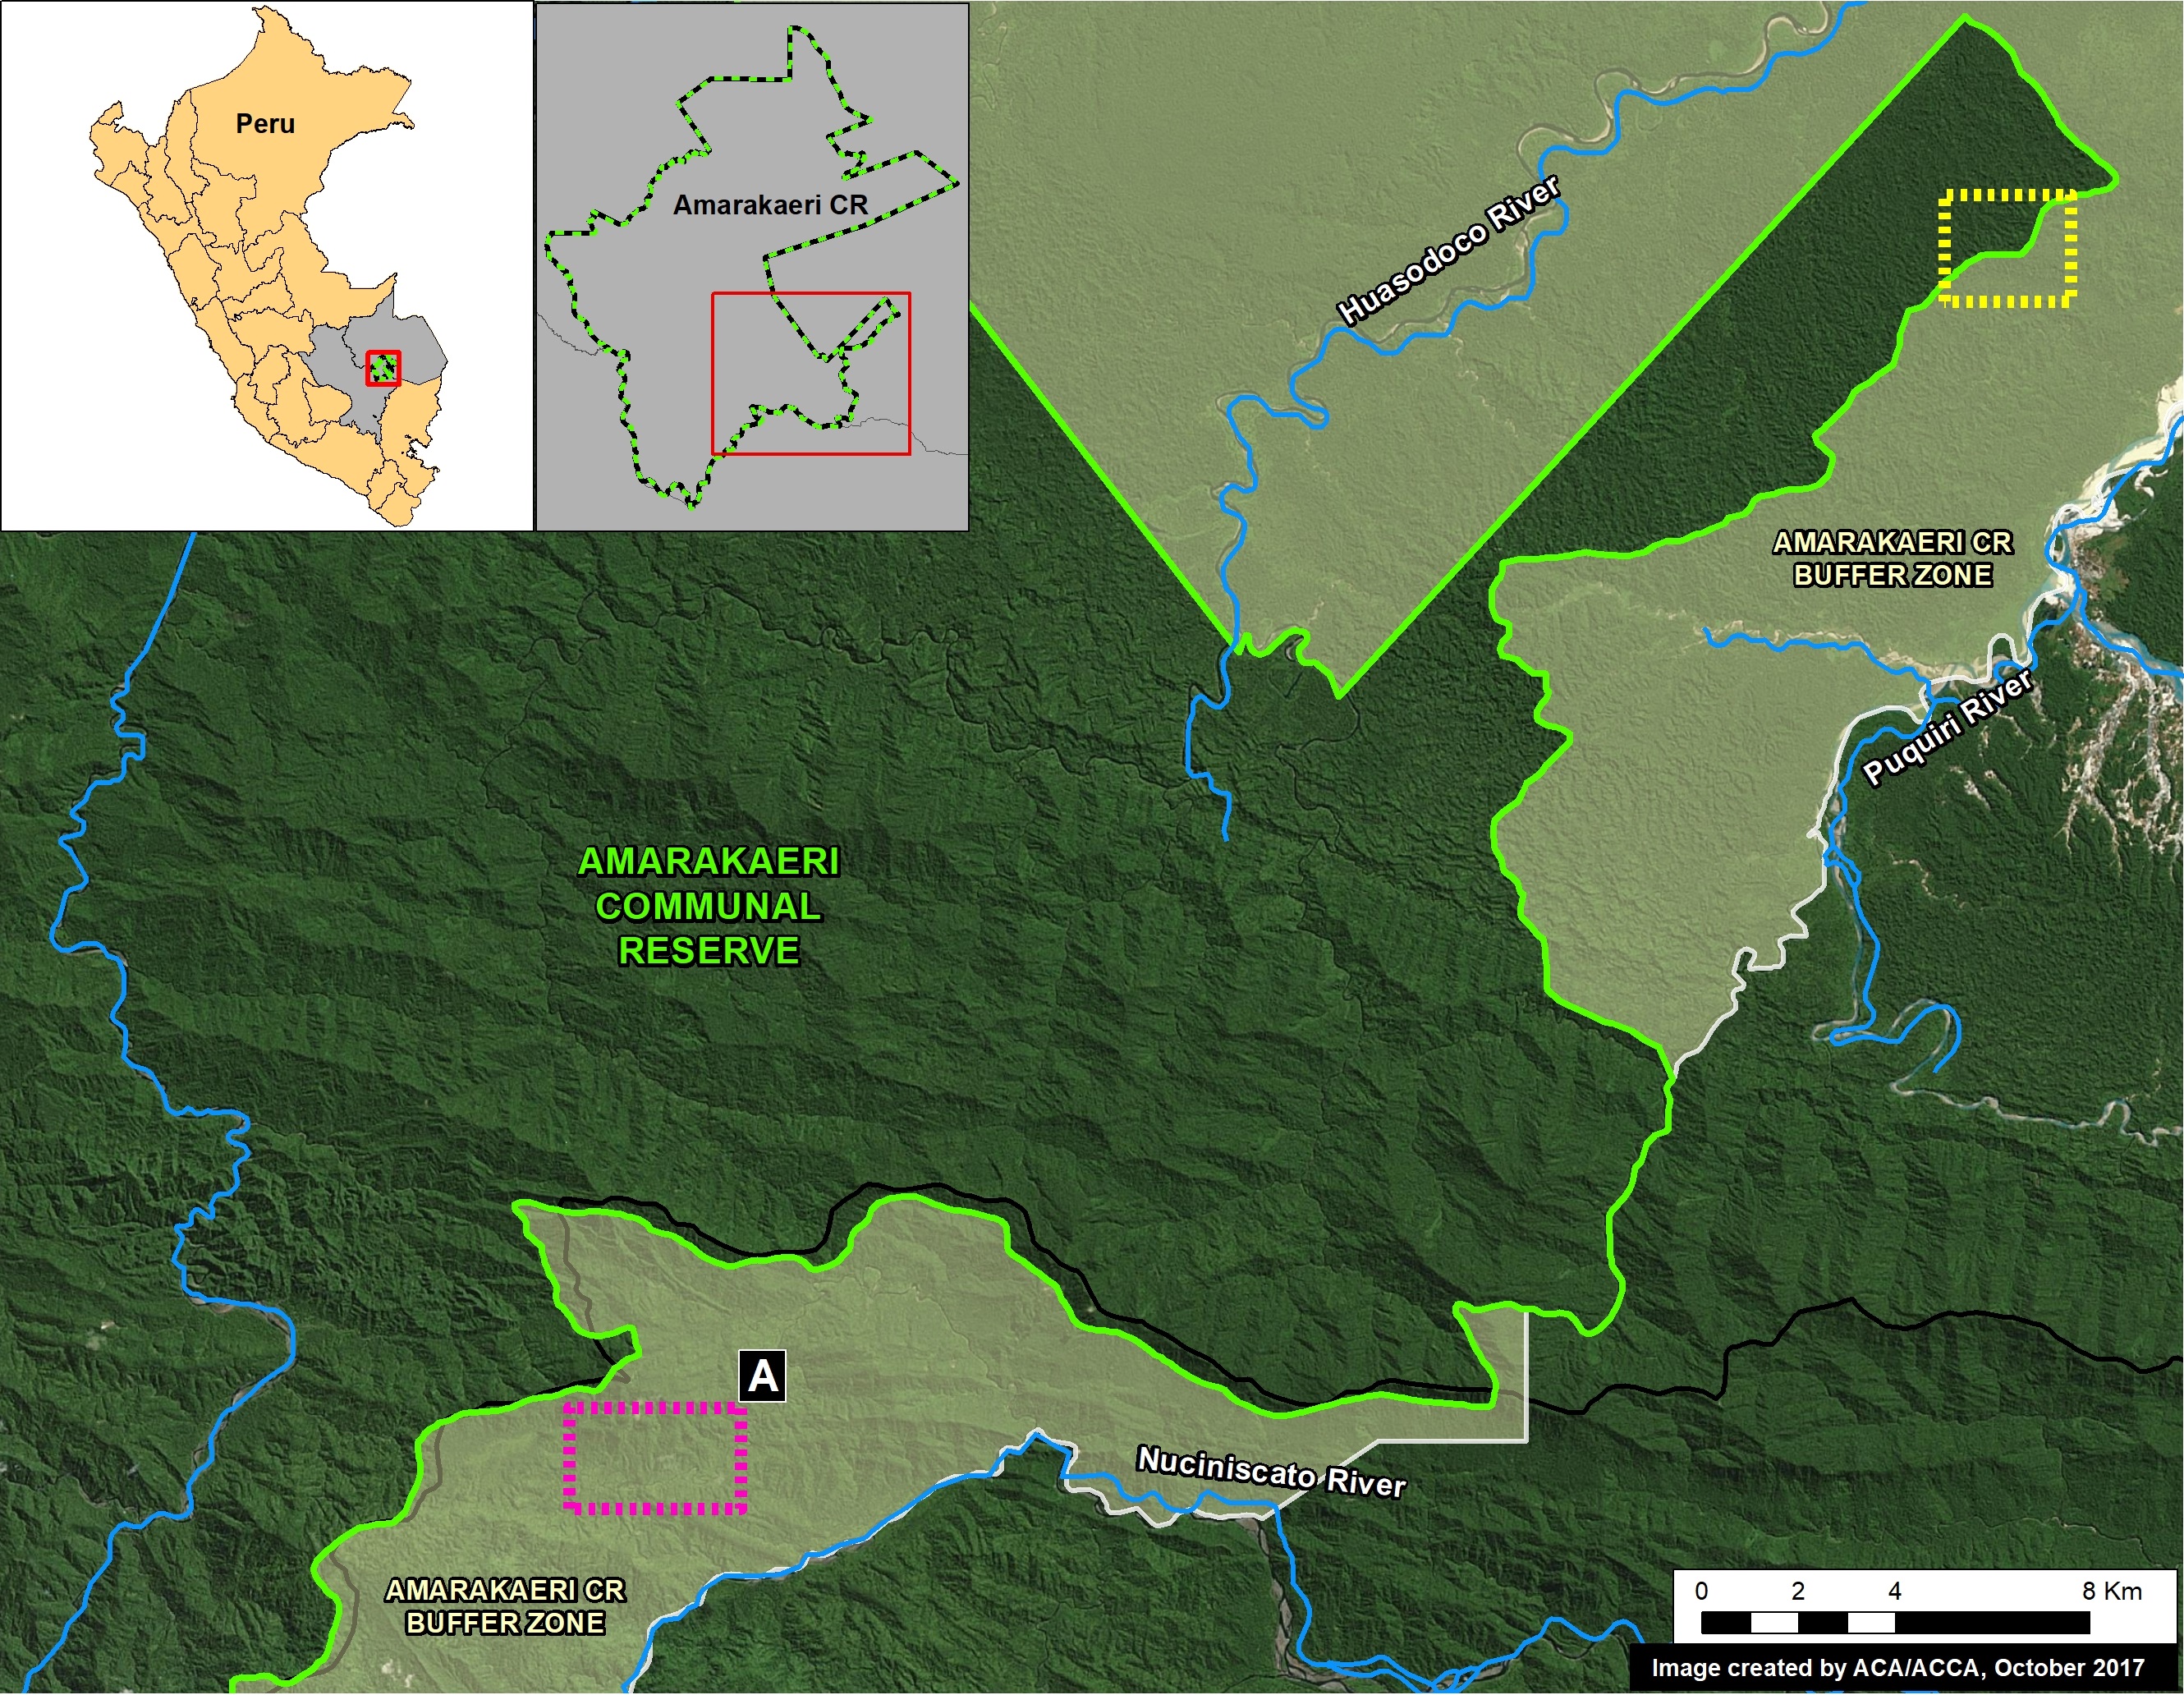
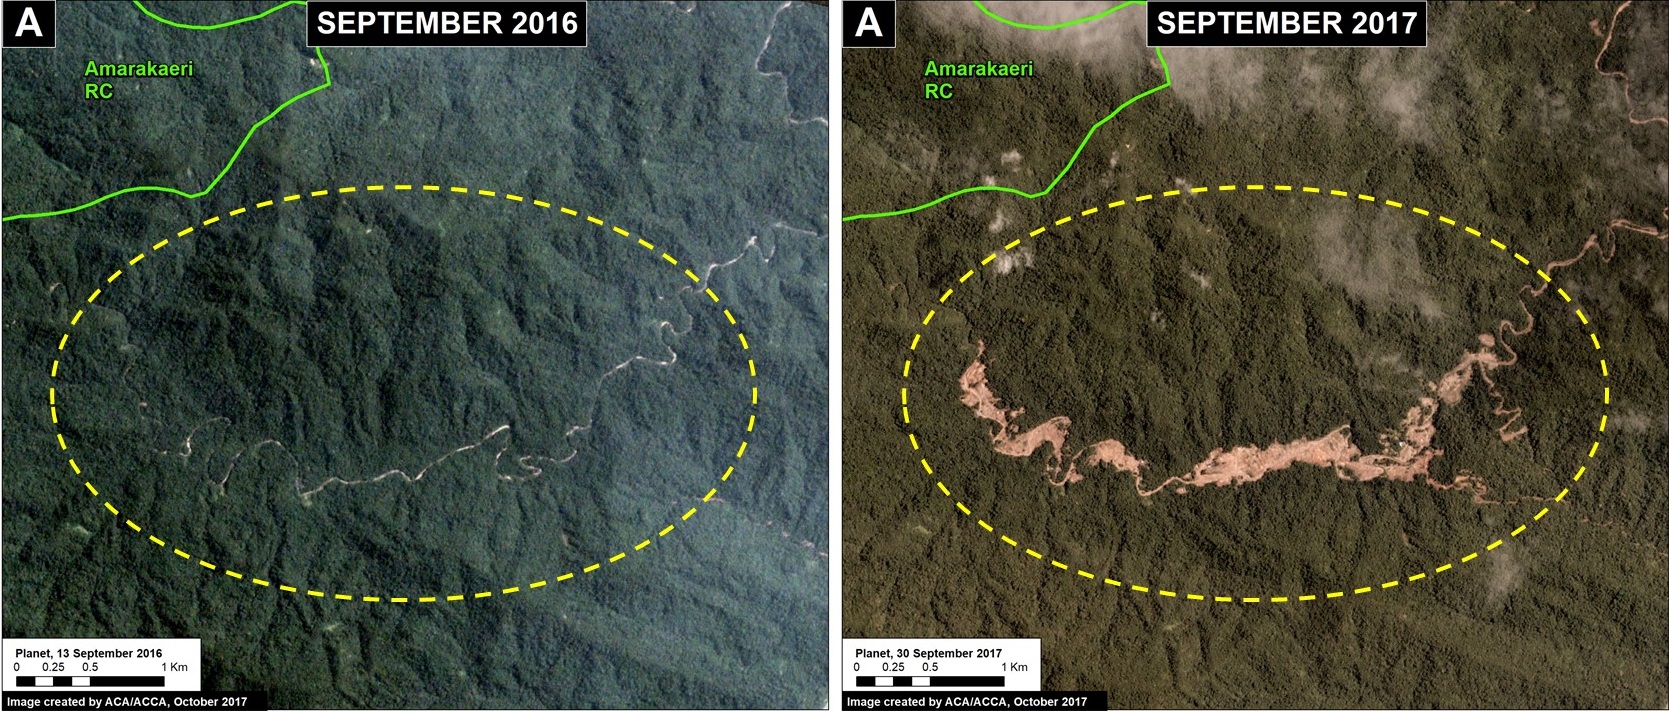
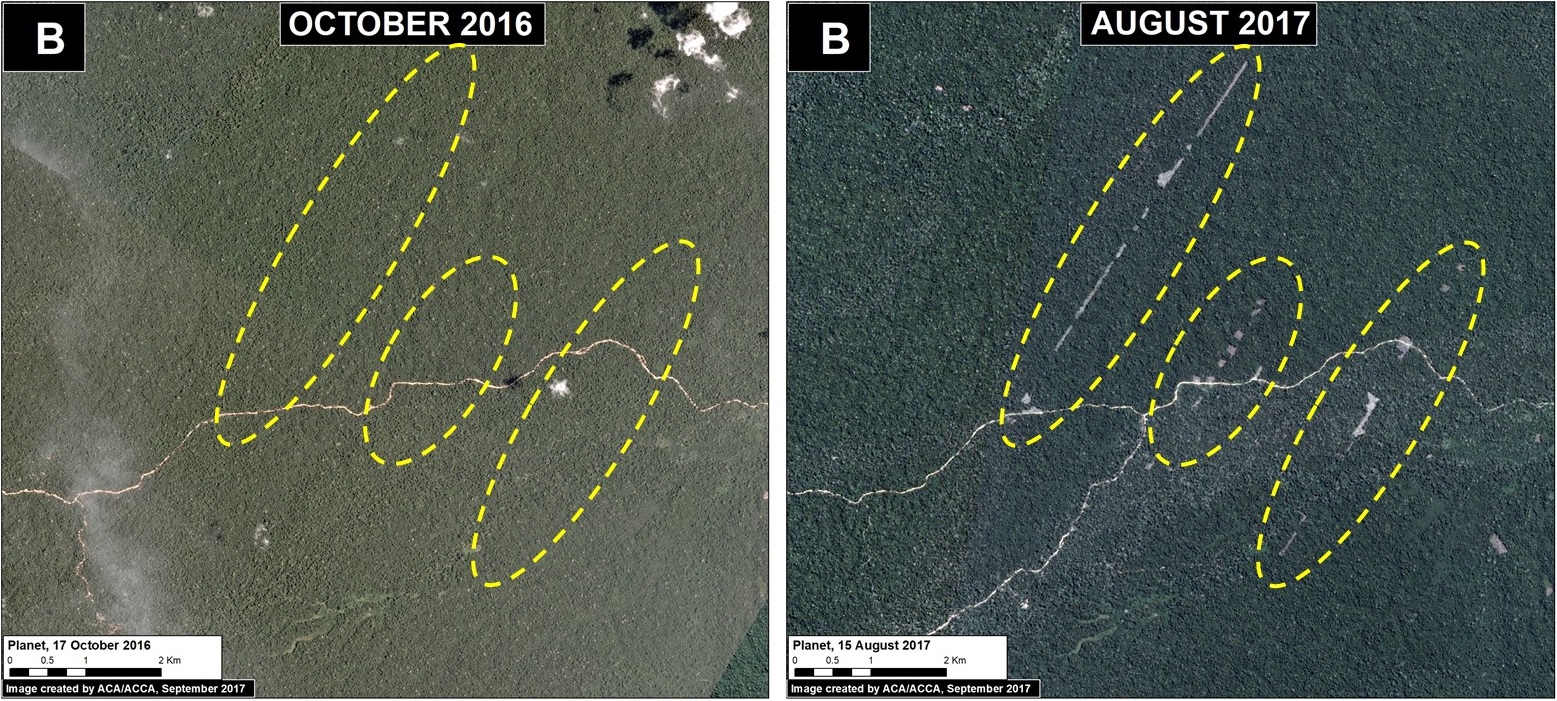
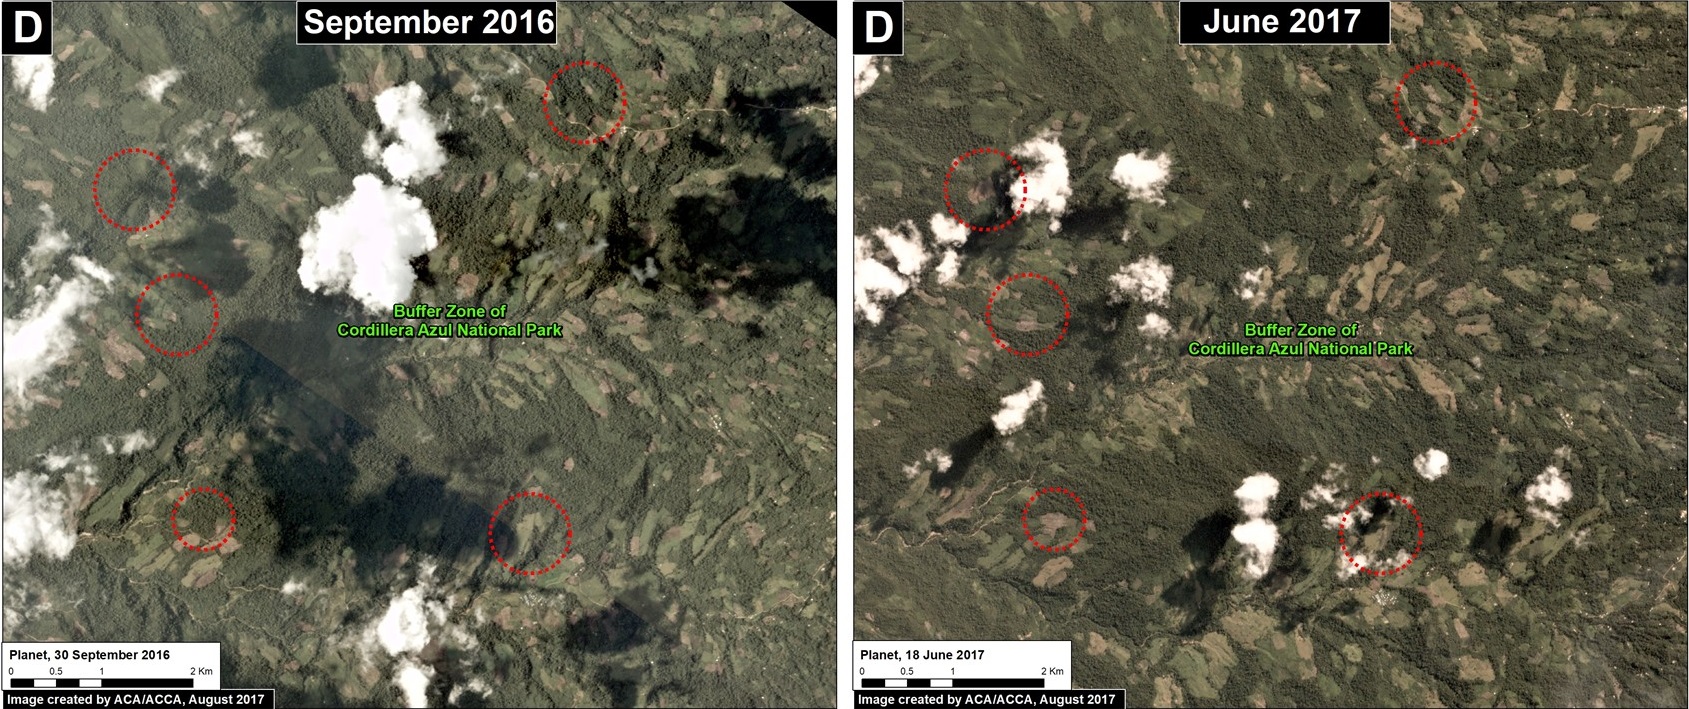
Amarakaeri Communal Reserve (gold mining)
In June 2015, we revealed the deforestation of 11 hectares in Amarakaeri Communal Reserve due to an illegal gold mining invasion. The Reserve, located in the southern Peruvian Amazon, is an important protected area that is co-managed by indigenous communities (ECA Amarakaeri) and SERNANP, Peru’s protected areas agency (see MAAP #6). In the following weeks, the Peruvian government, led by SERNANP, cracked down on the illegal mining activities. A year later, we showed that the deforestation had been stopped, with no further expansion into the Reserve (MAAP #44). In fact, we showed that there were signs of recovering vegetation on the recently mined areas.
Image 64d shows the gold mining deforestation approaching (2011-12) and entering (2013-15) Amarakaeri Communal Reserve (yellow circles indicate areas of invasion). However, it also shows how, following action by the government and ECA Amarakaeri, the deforestation was halted and did not expand in 2016-17.
Image 64d. Data: NASA/USGS, Sentinel/ESA, RapidEye/Planet
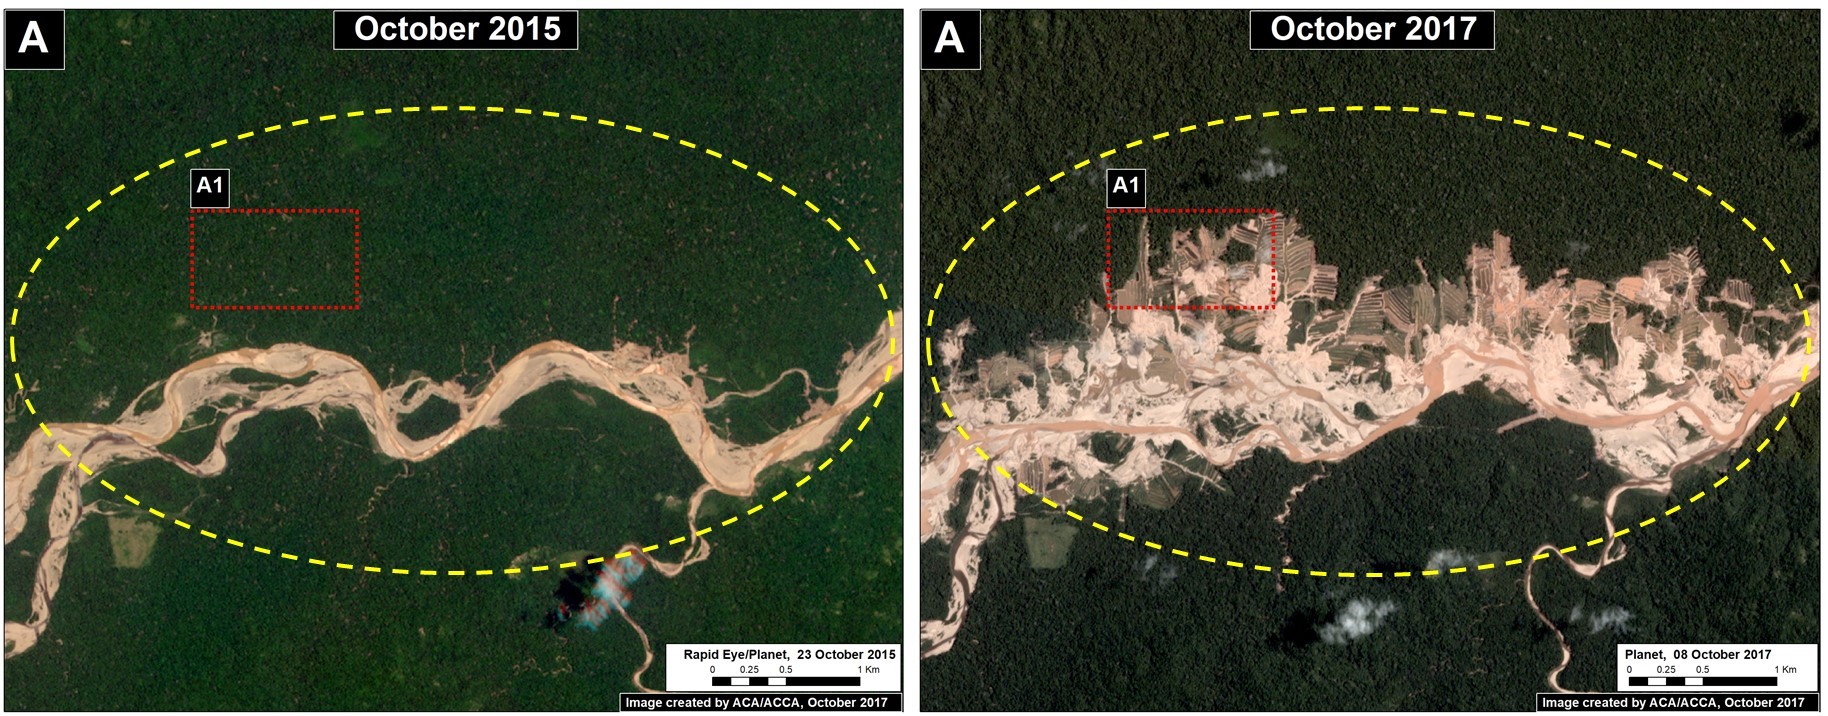
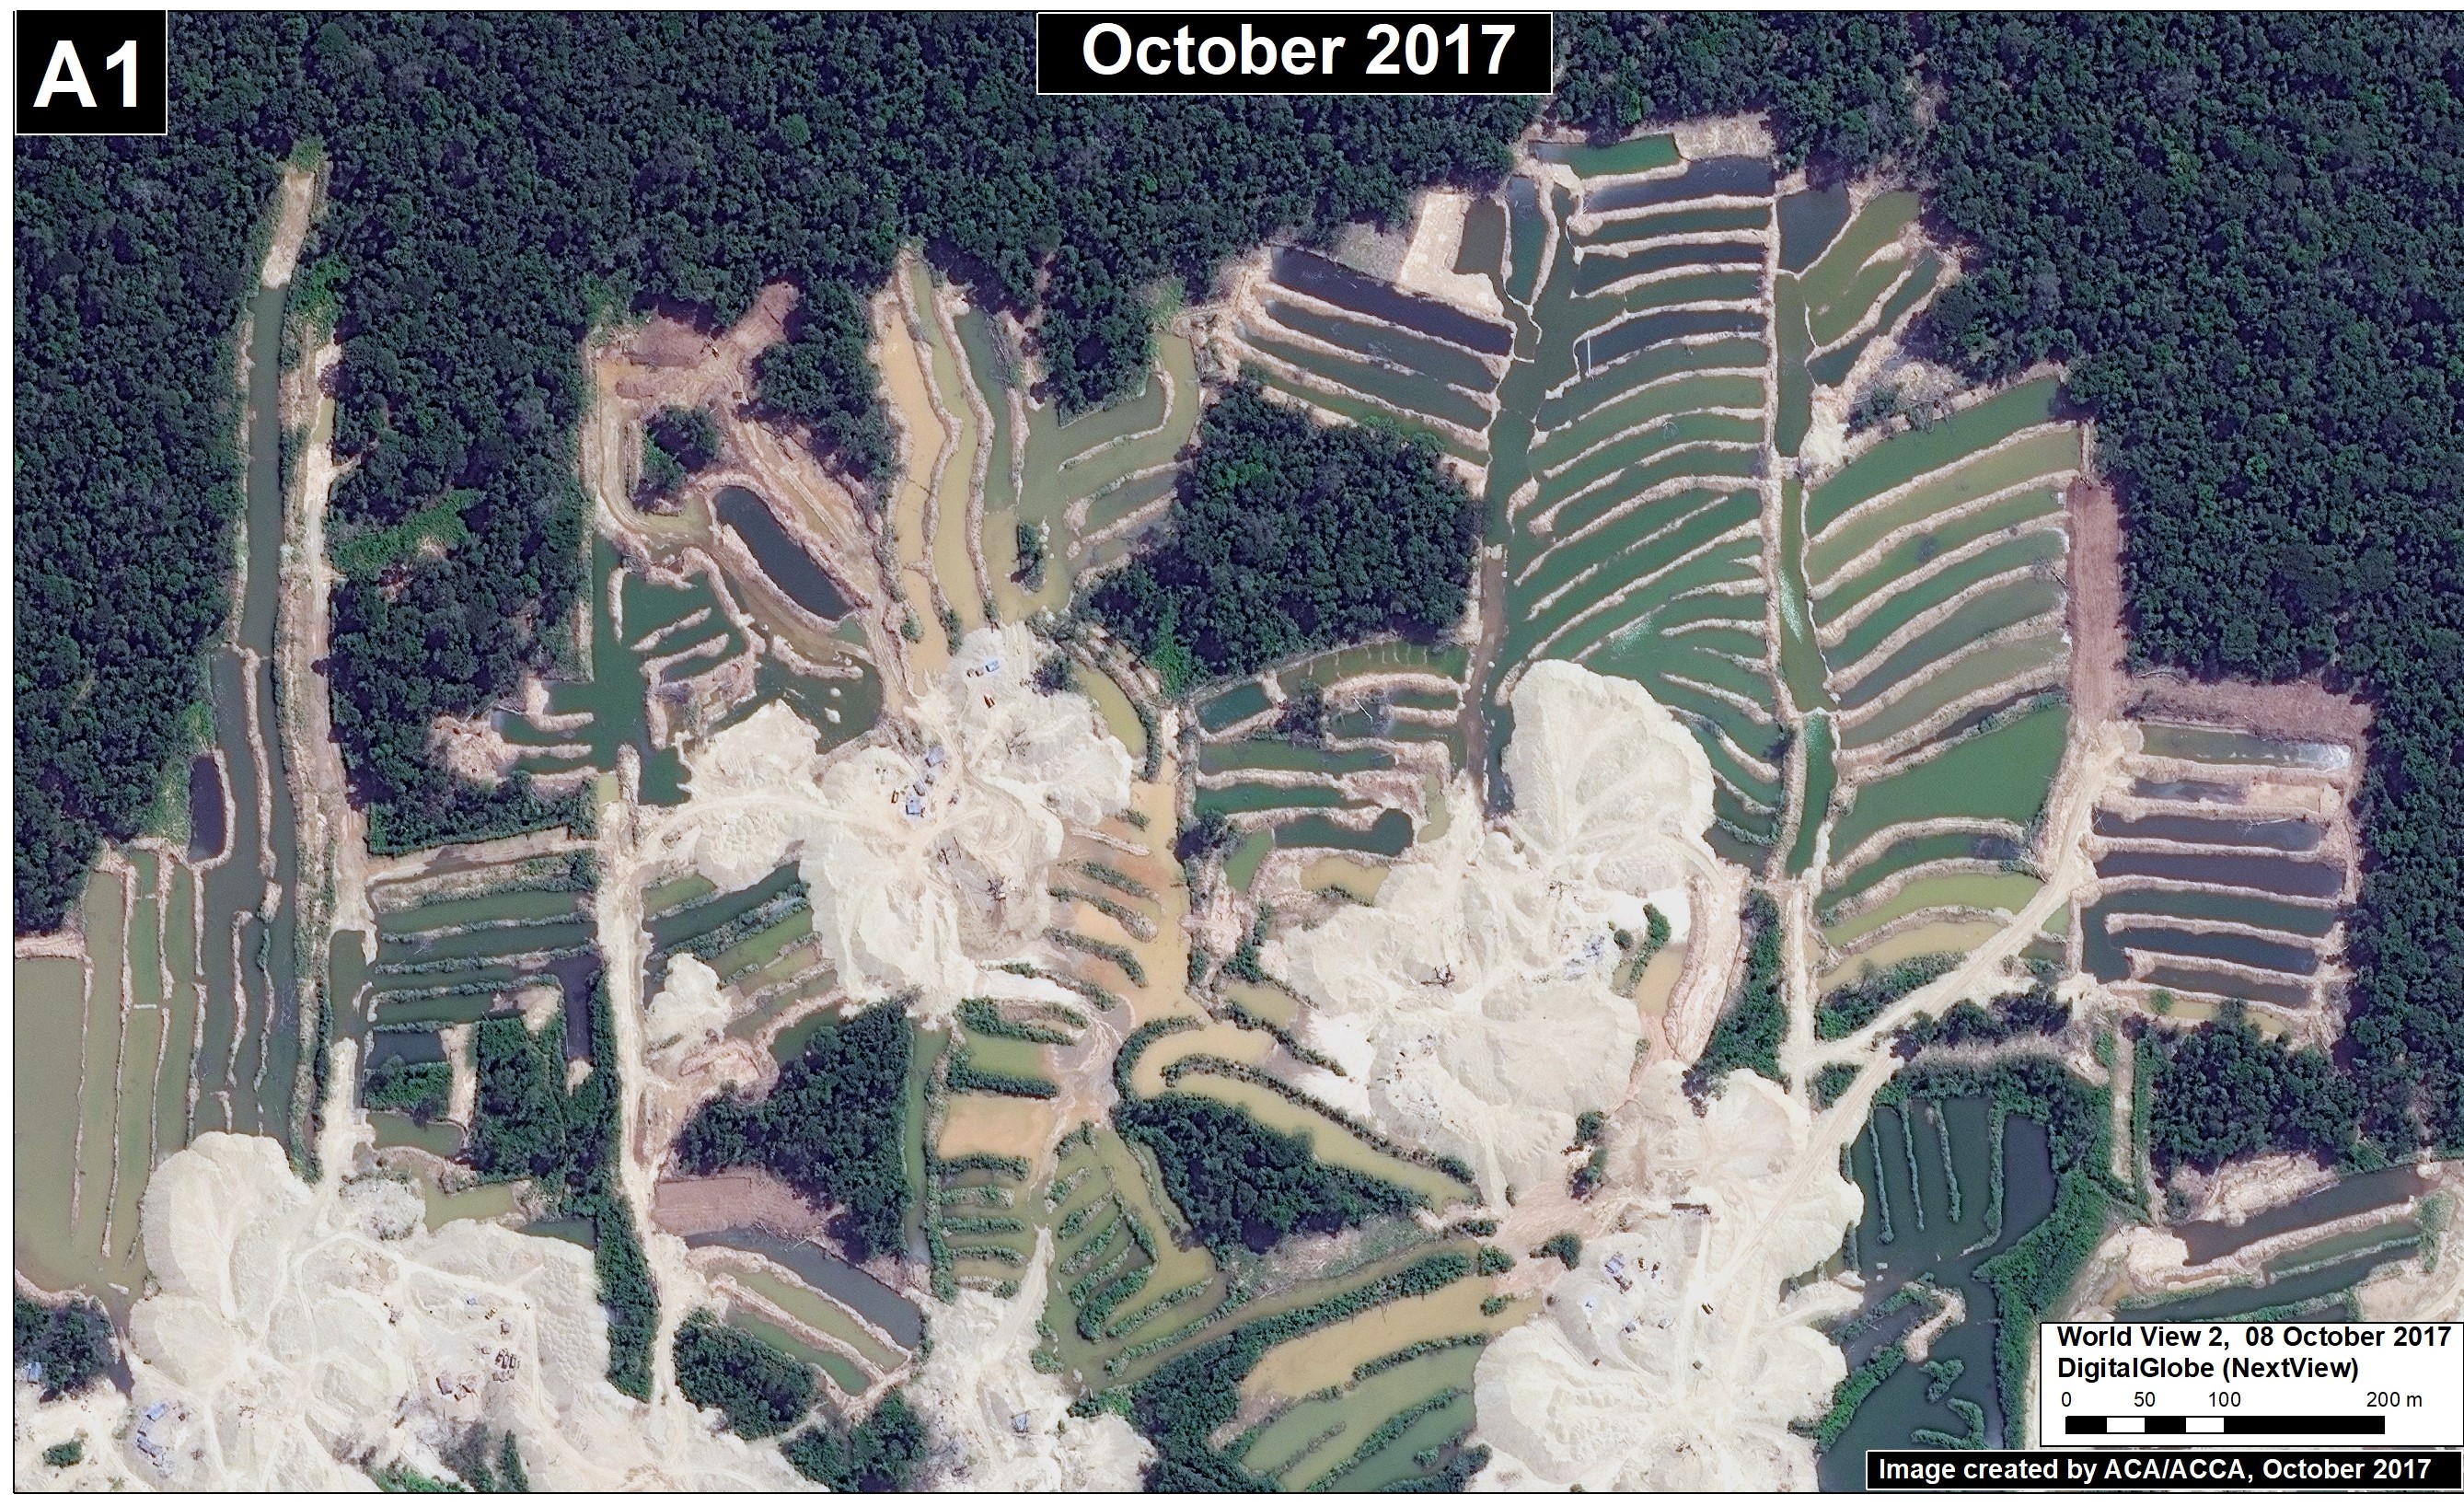
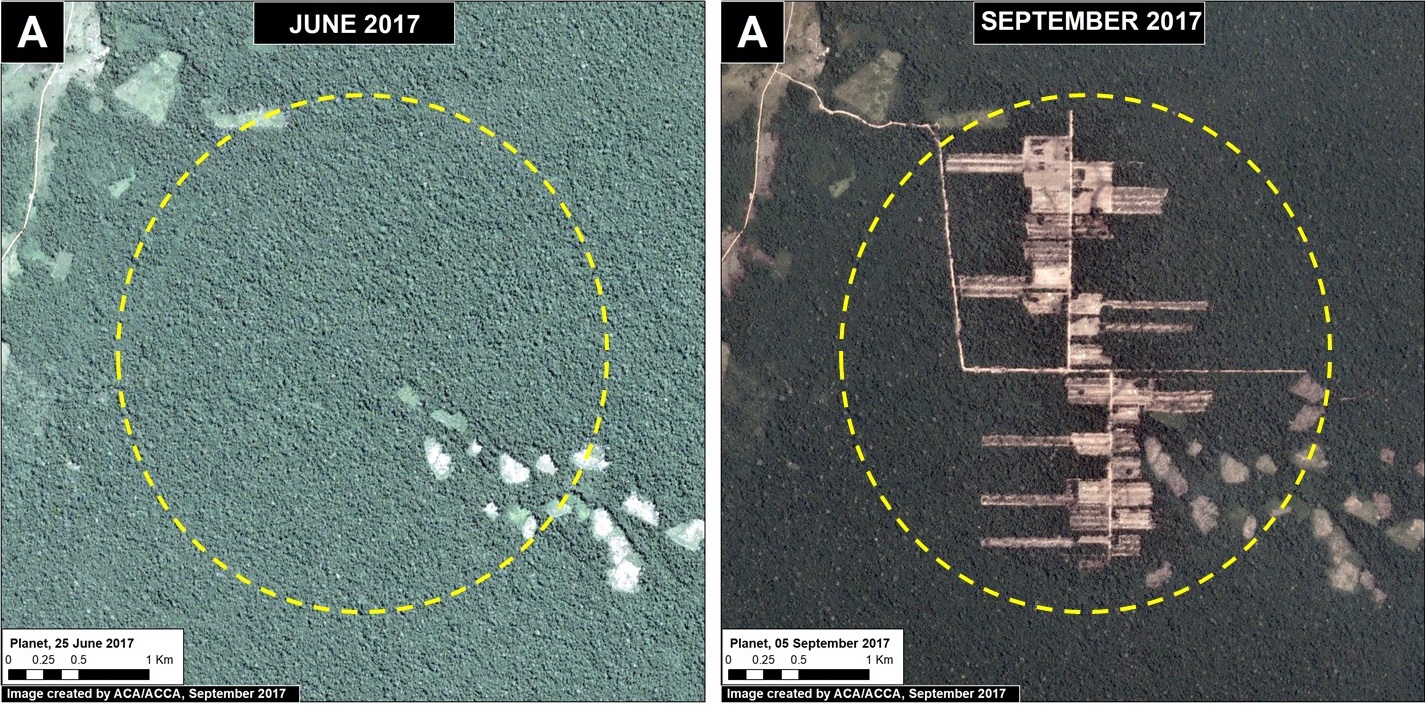
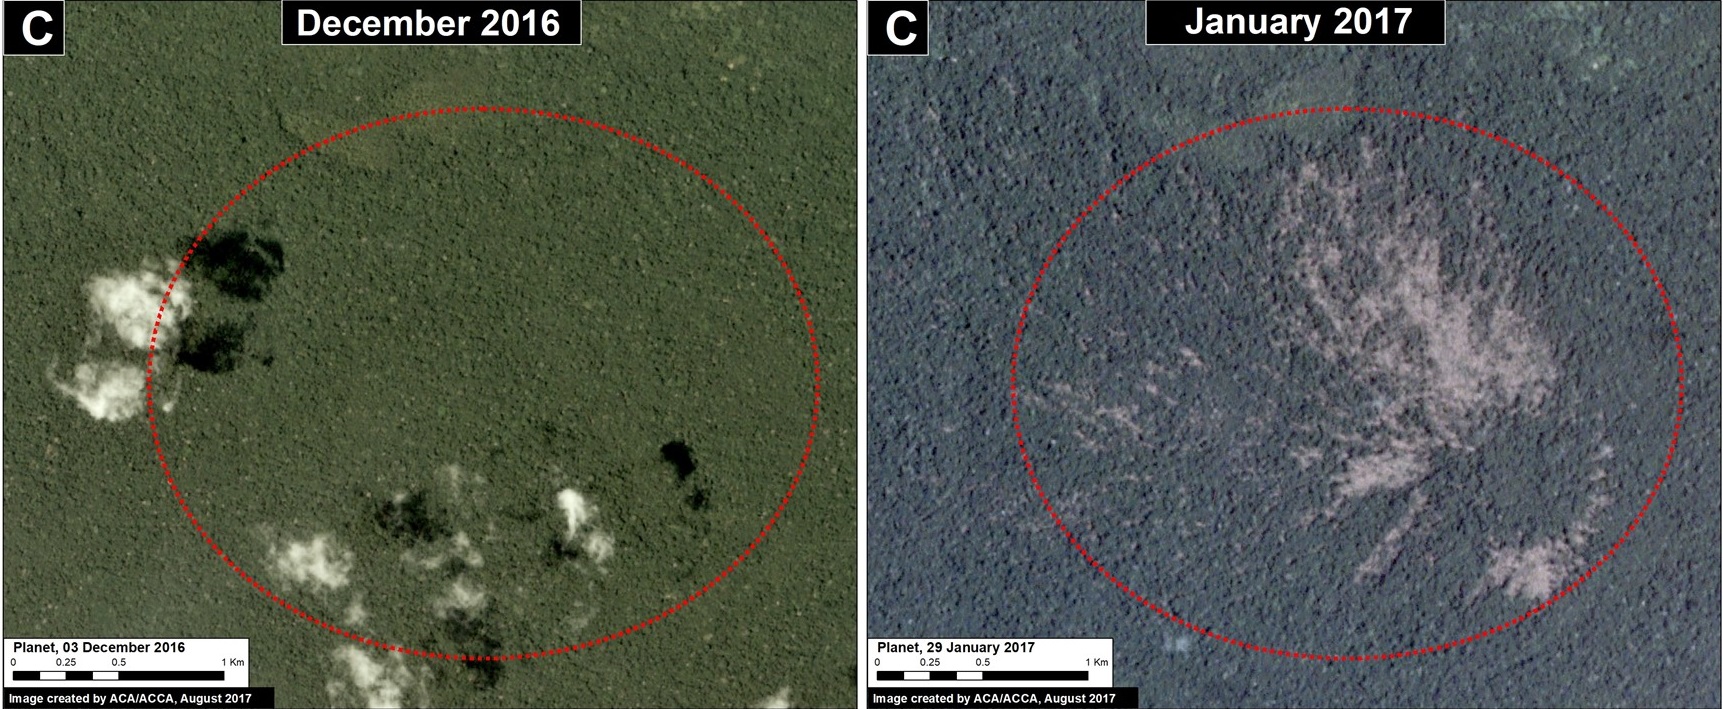
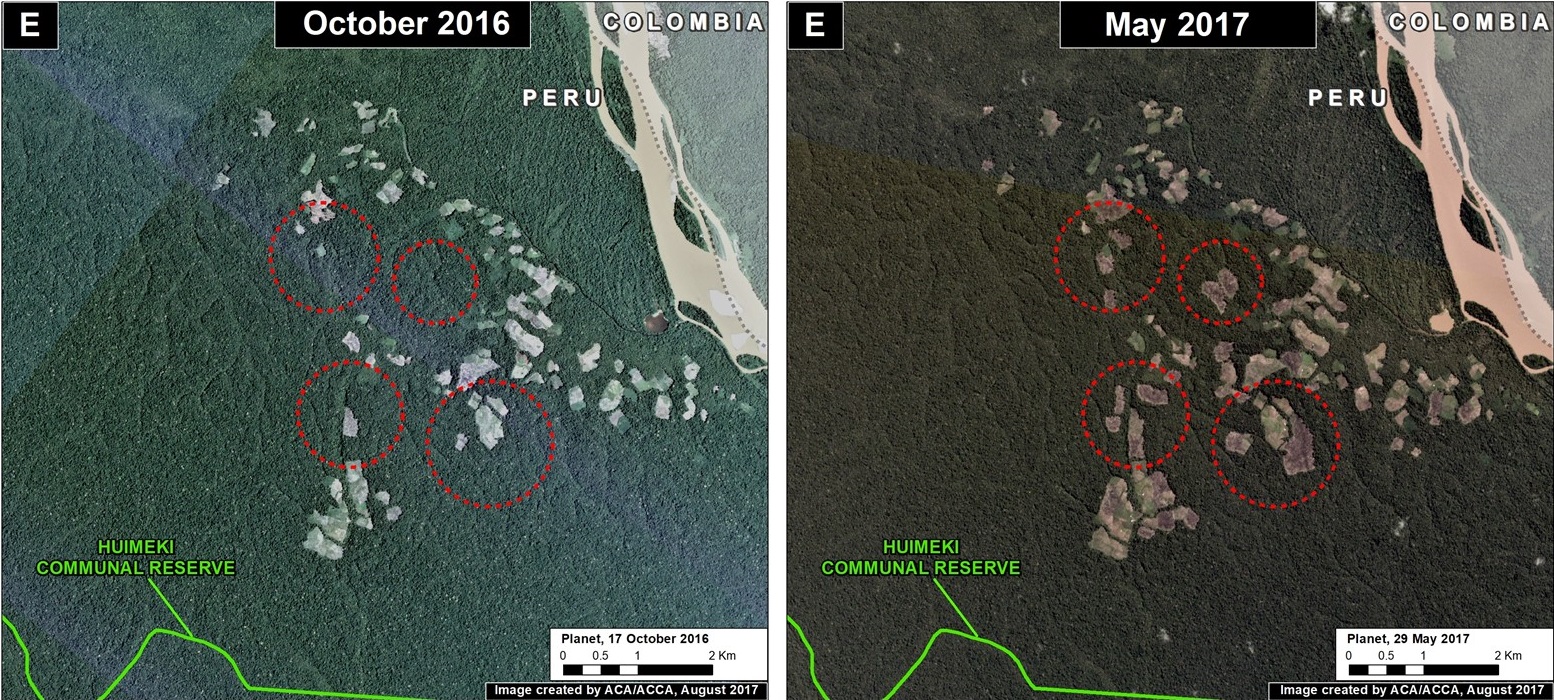
Tambopata National Reserve (gold mining)
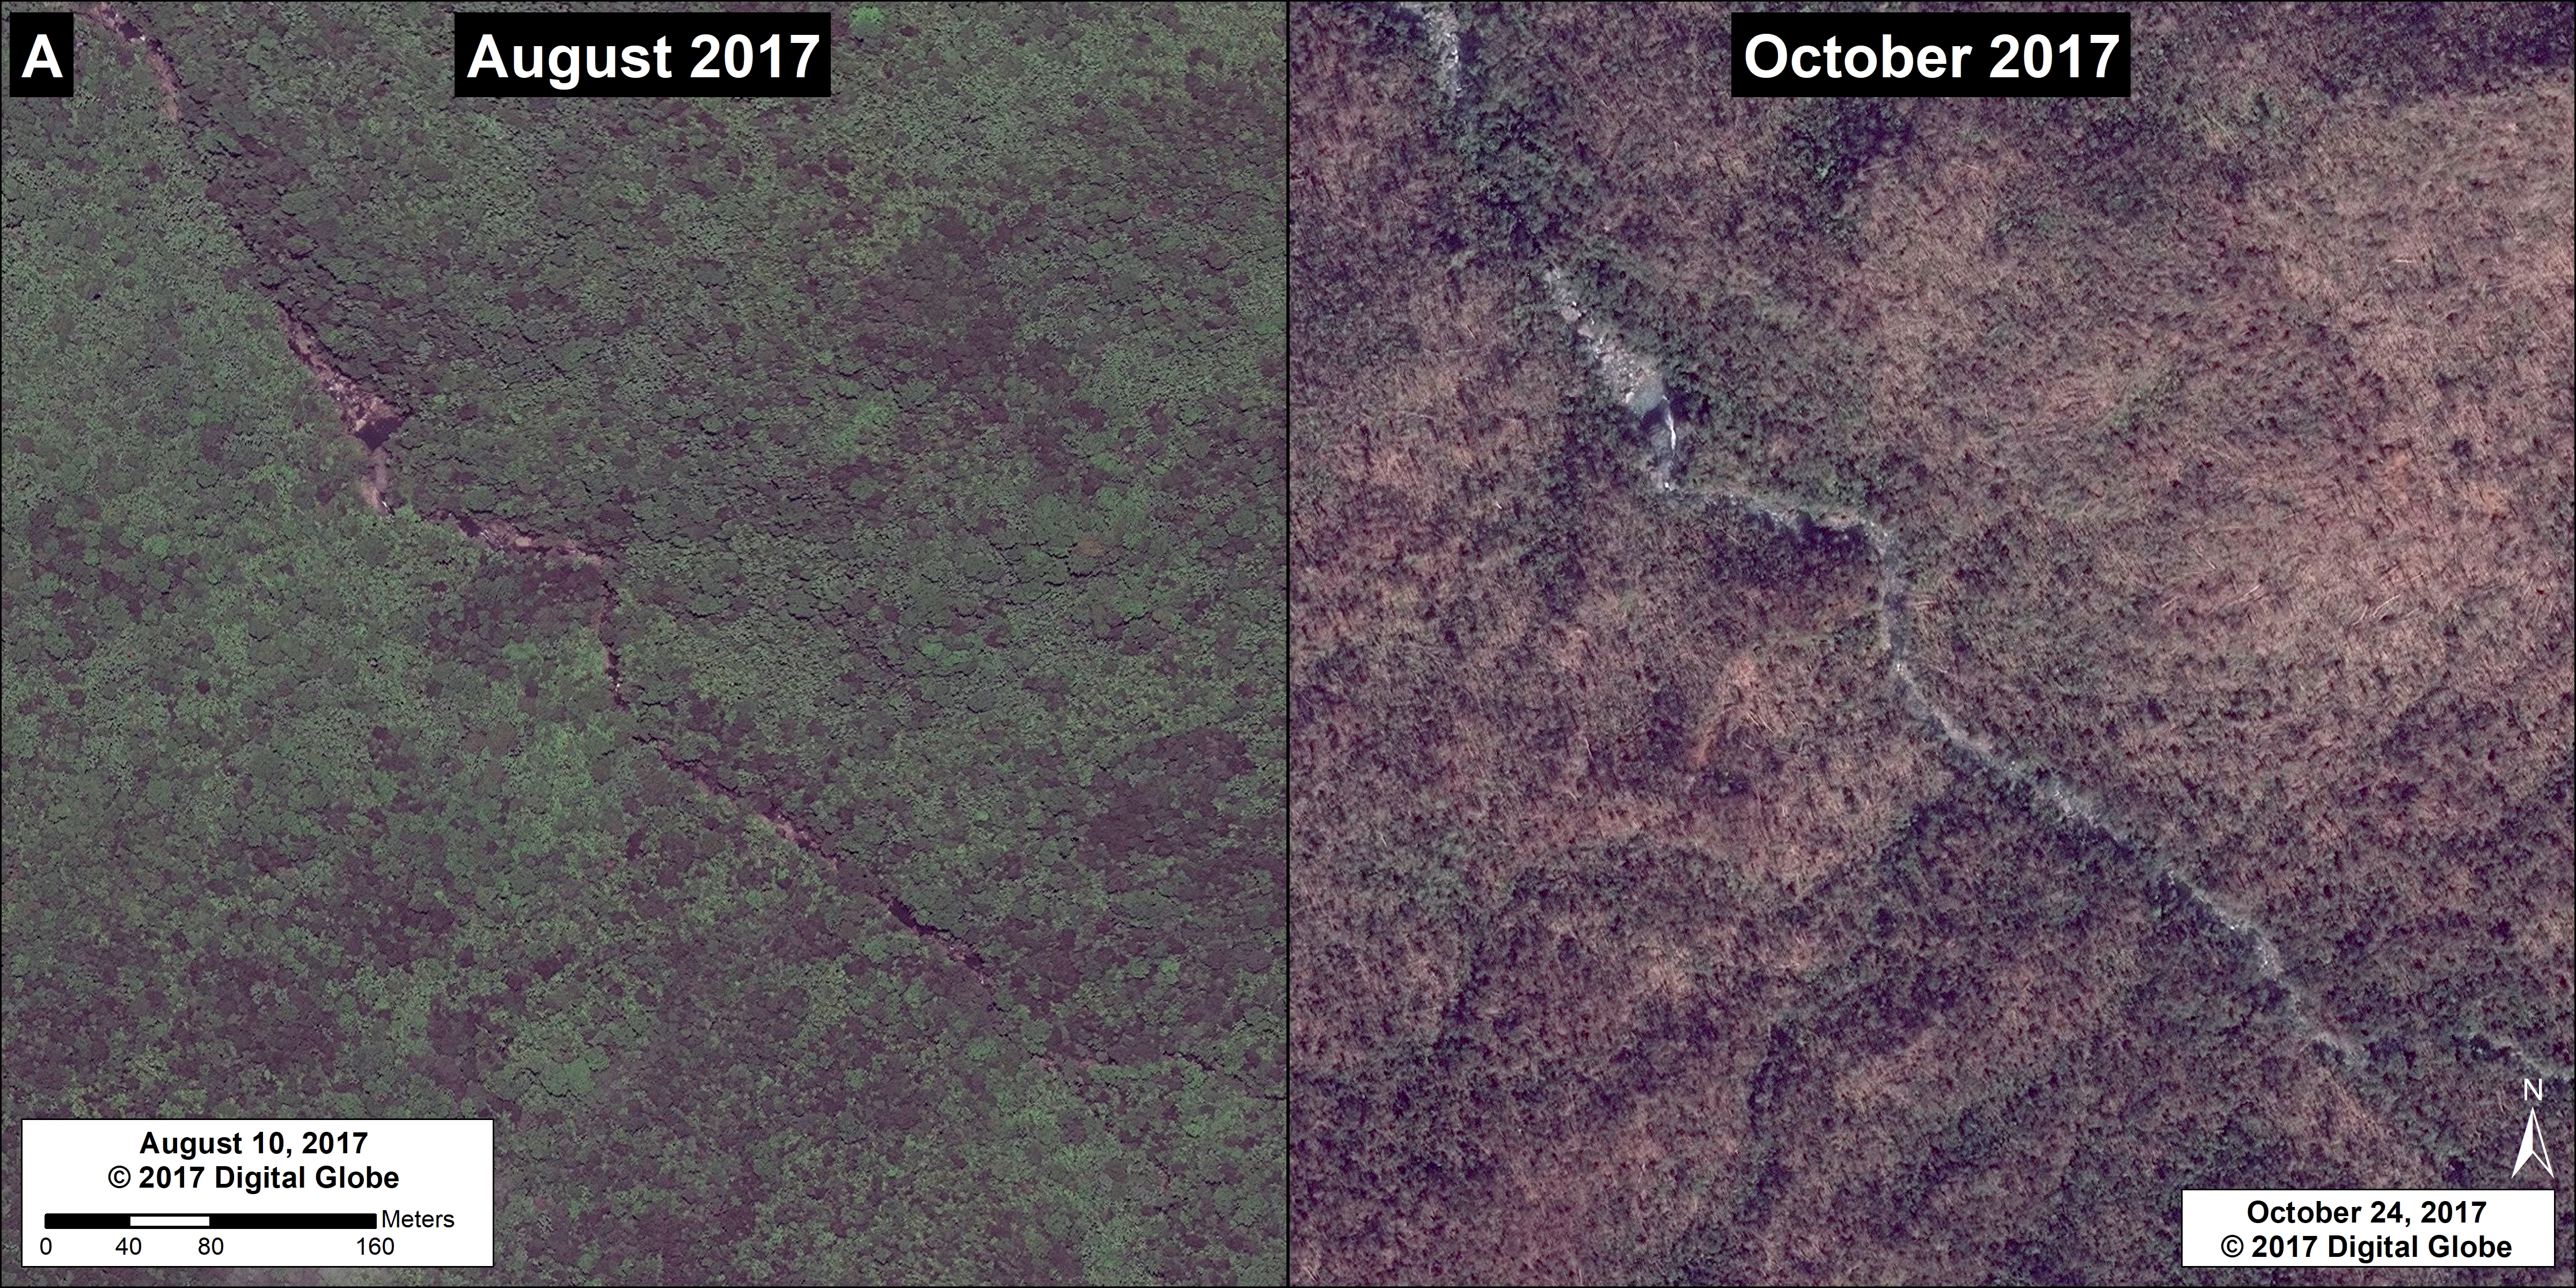
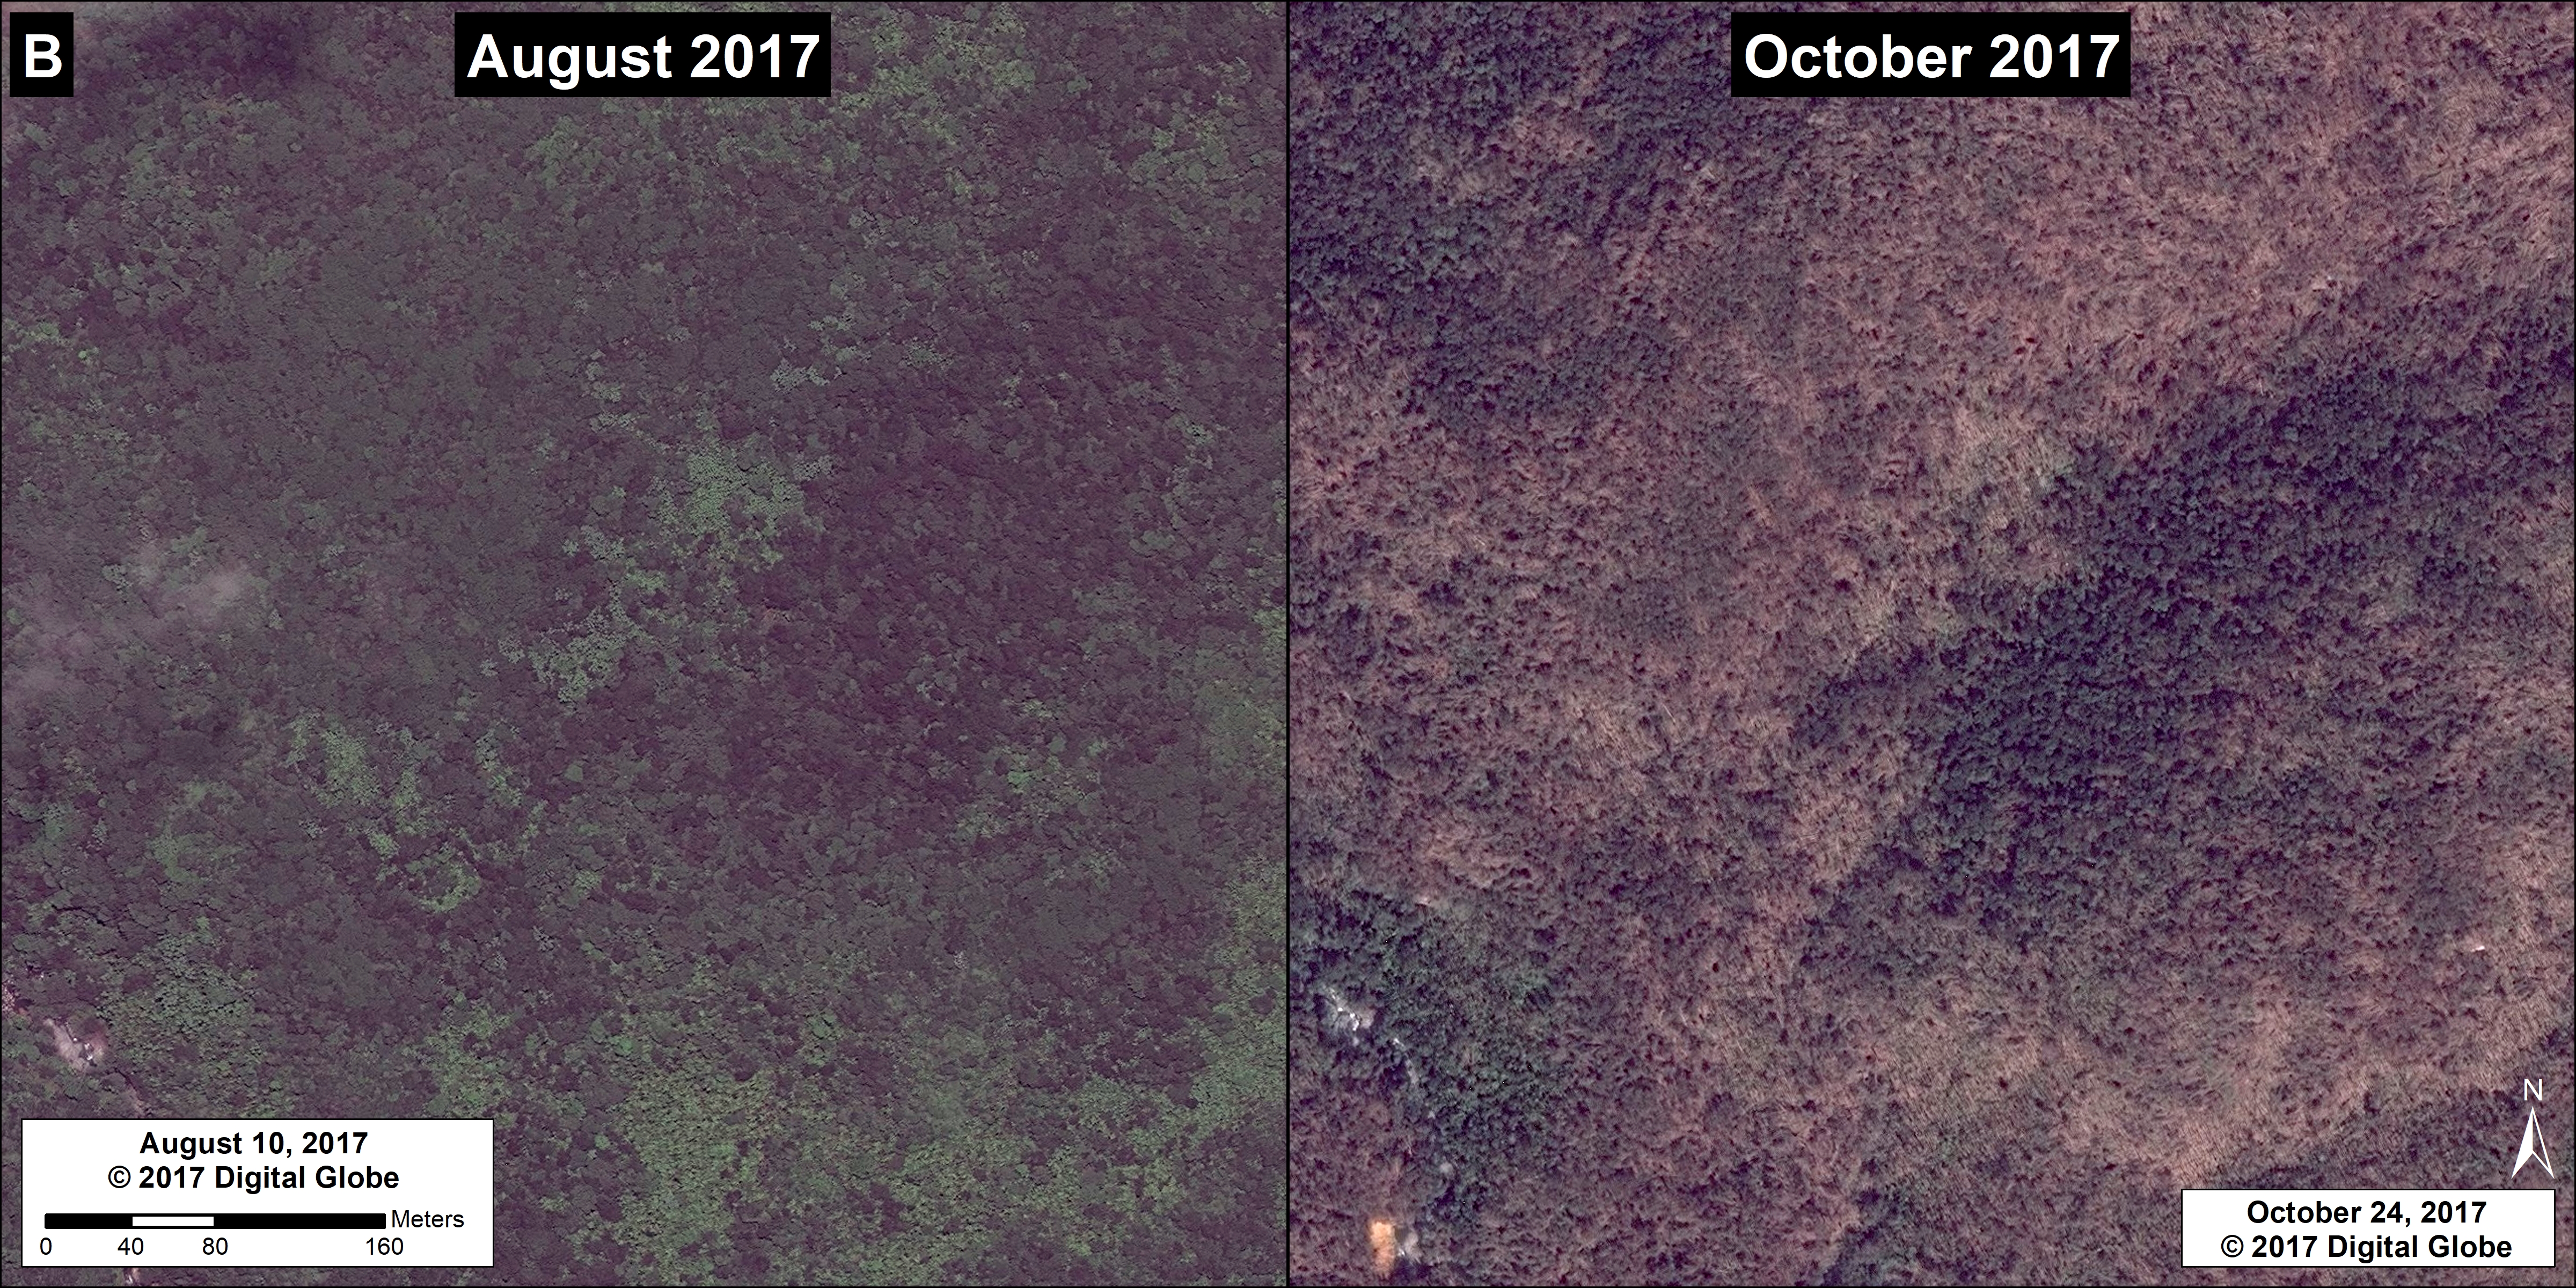
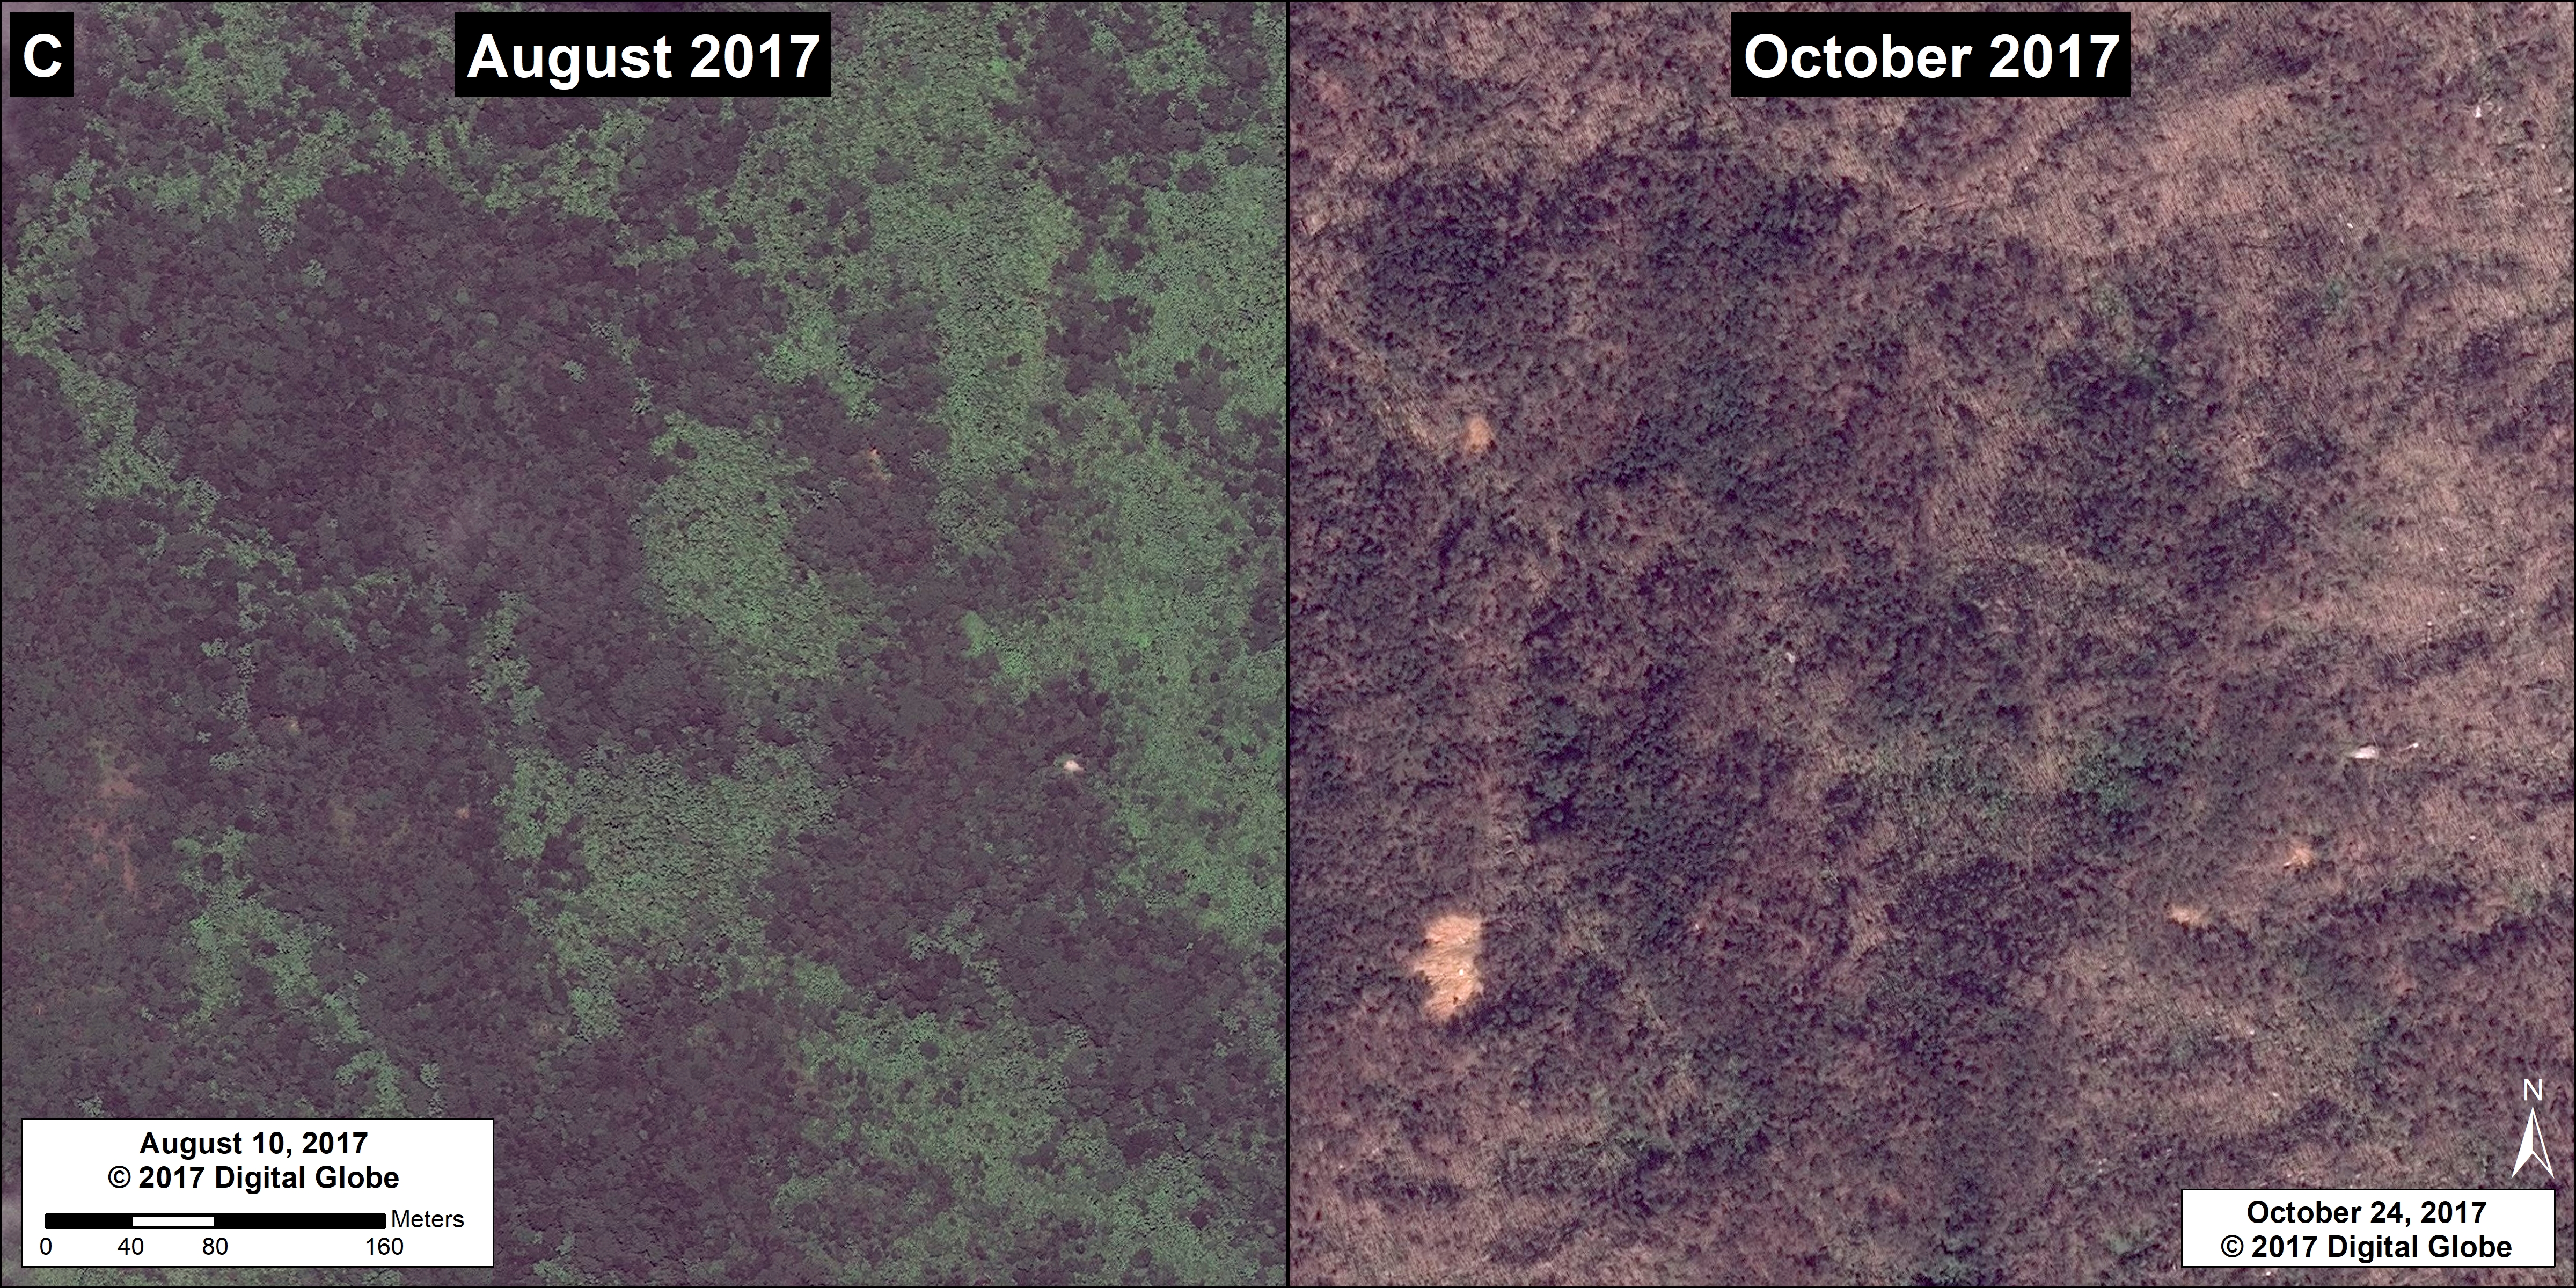
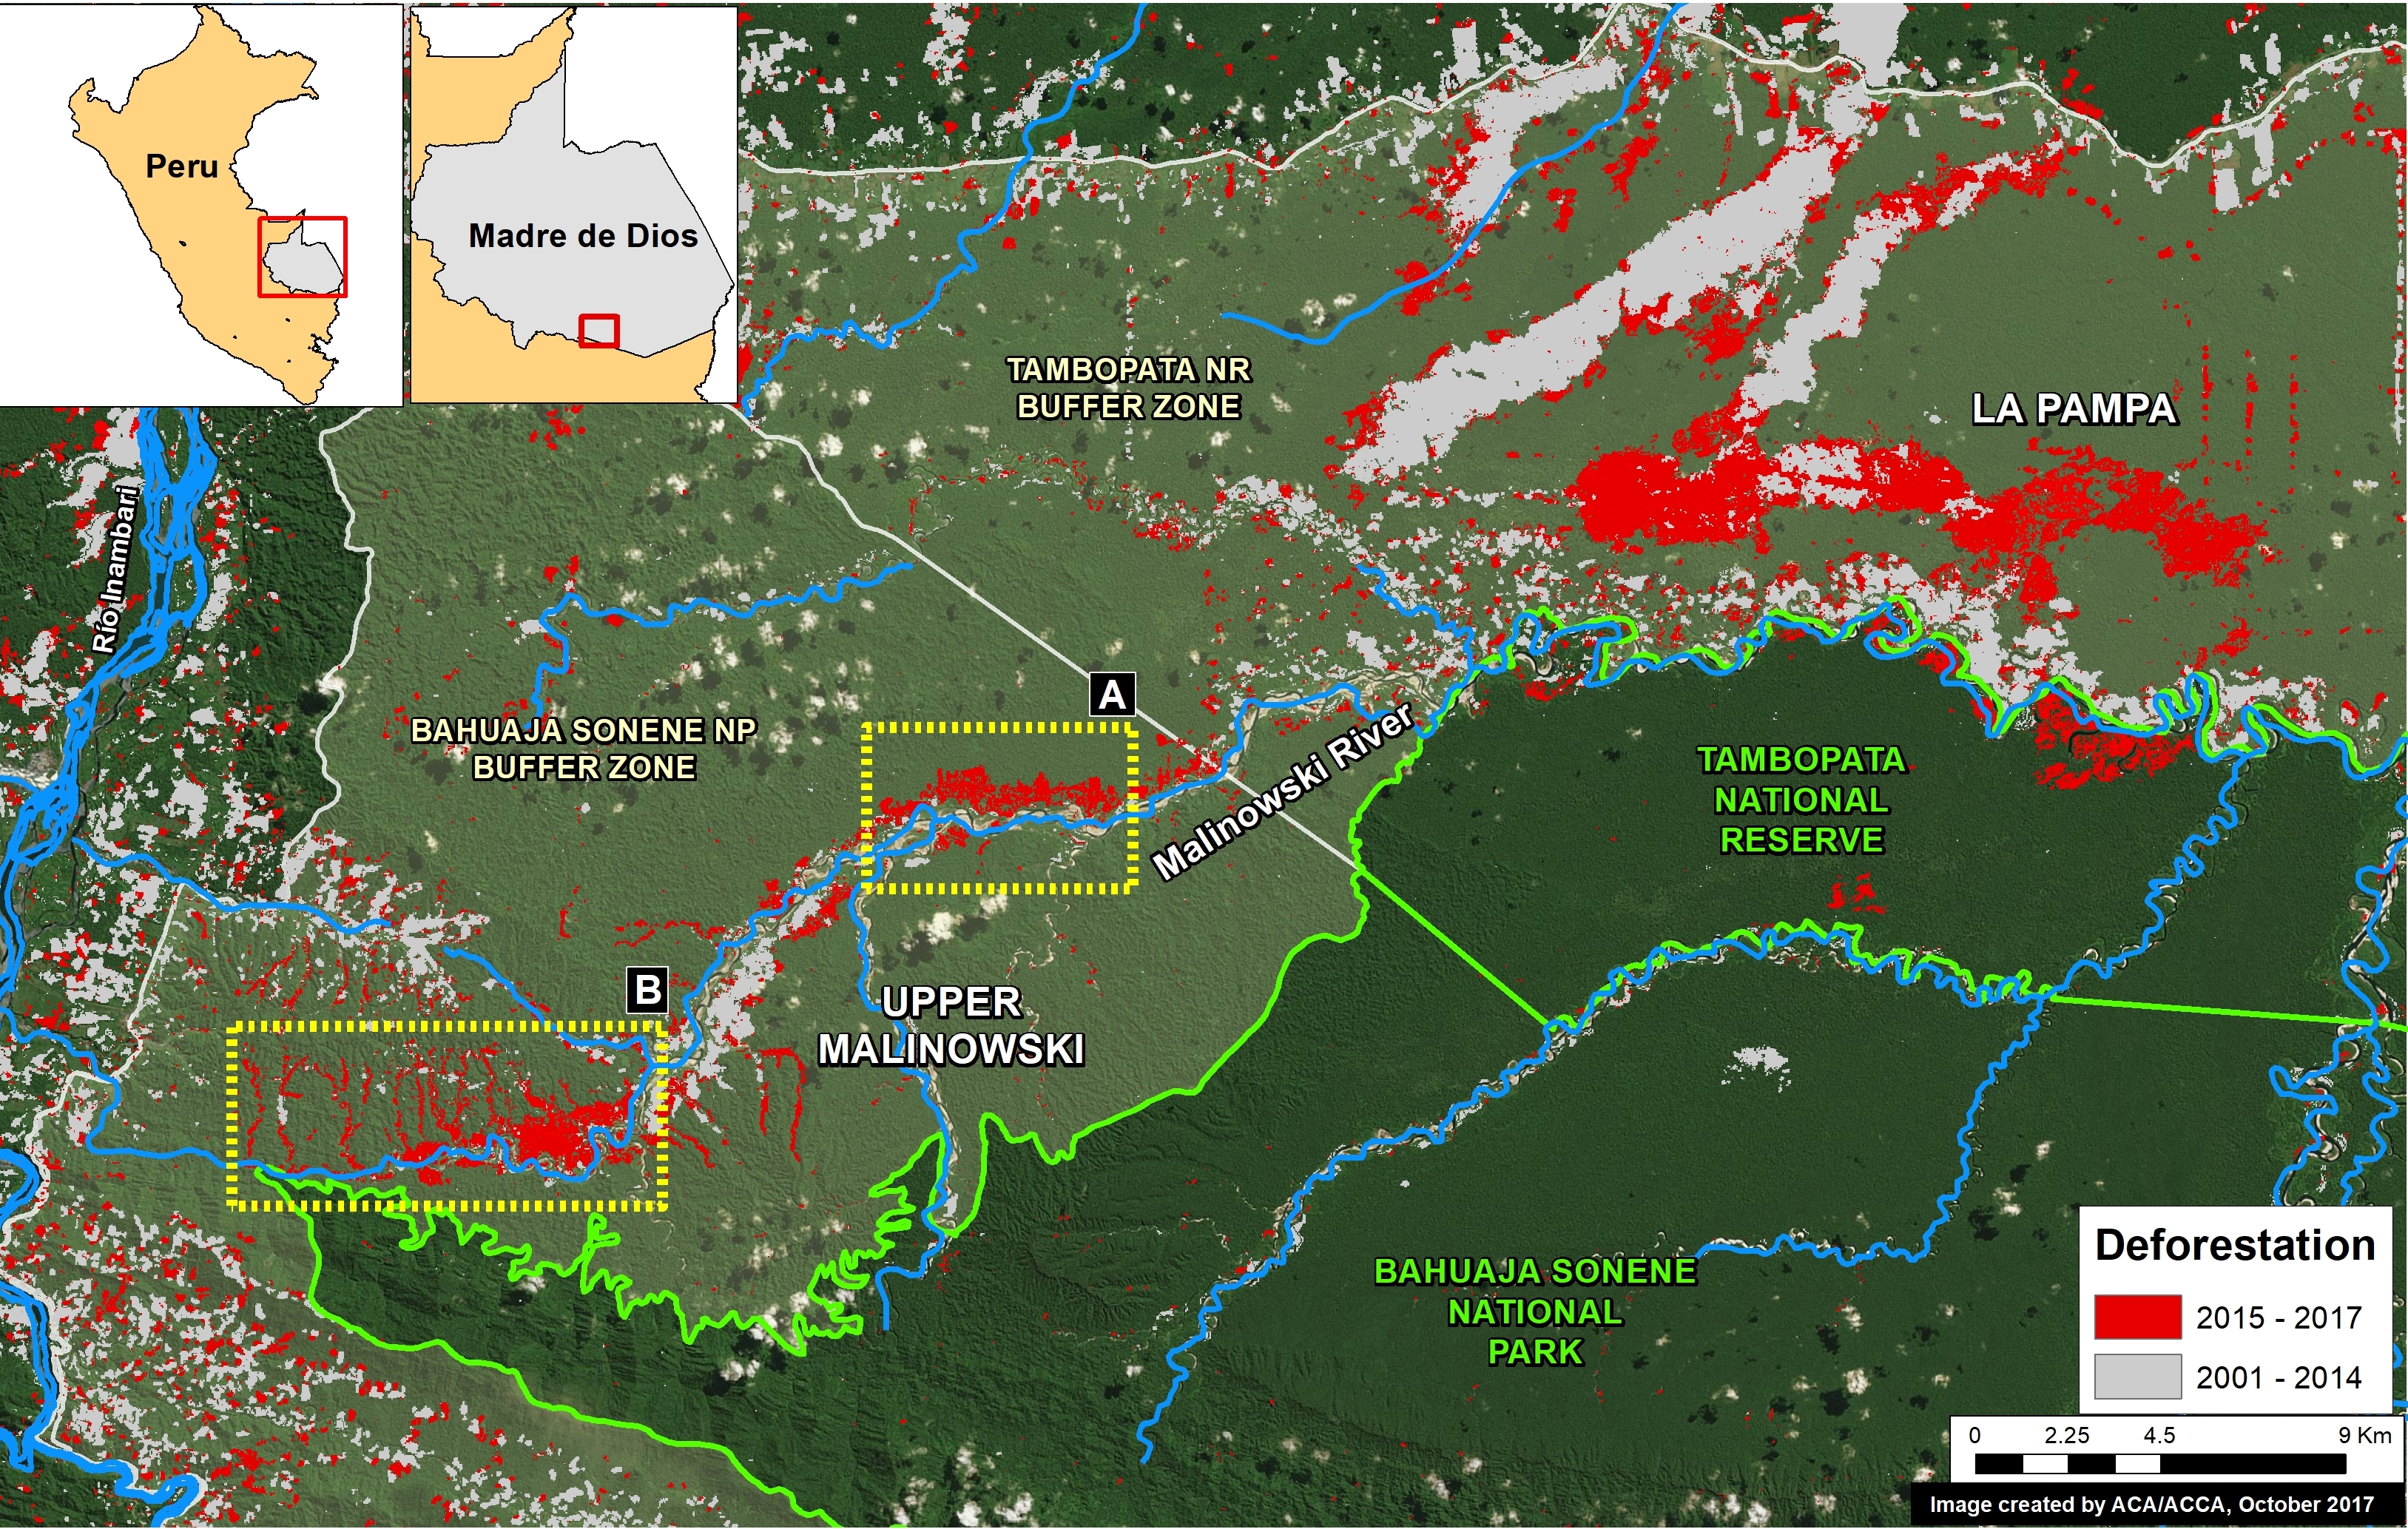
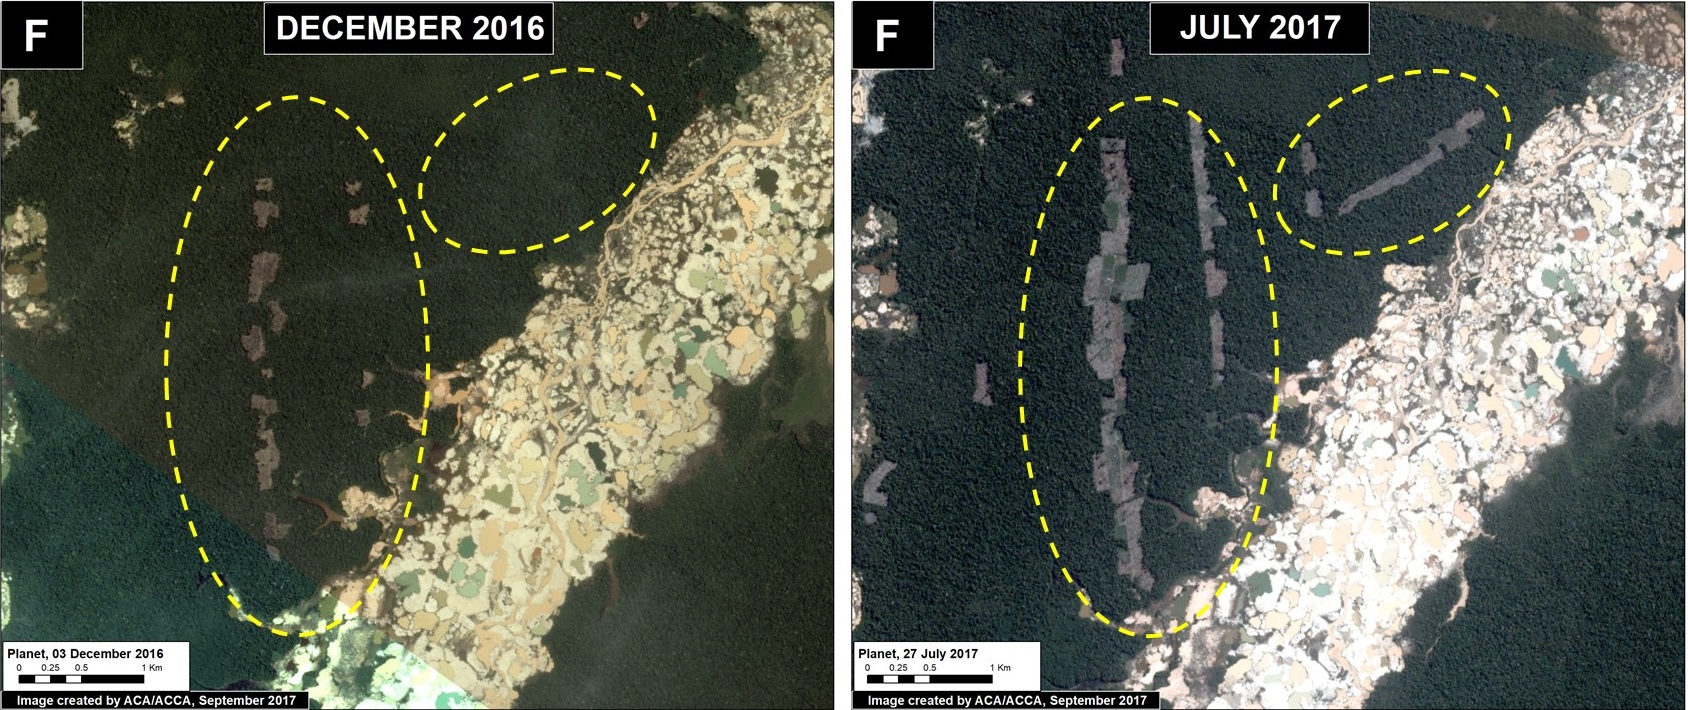
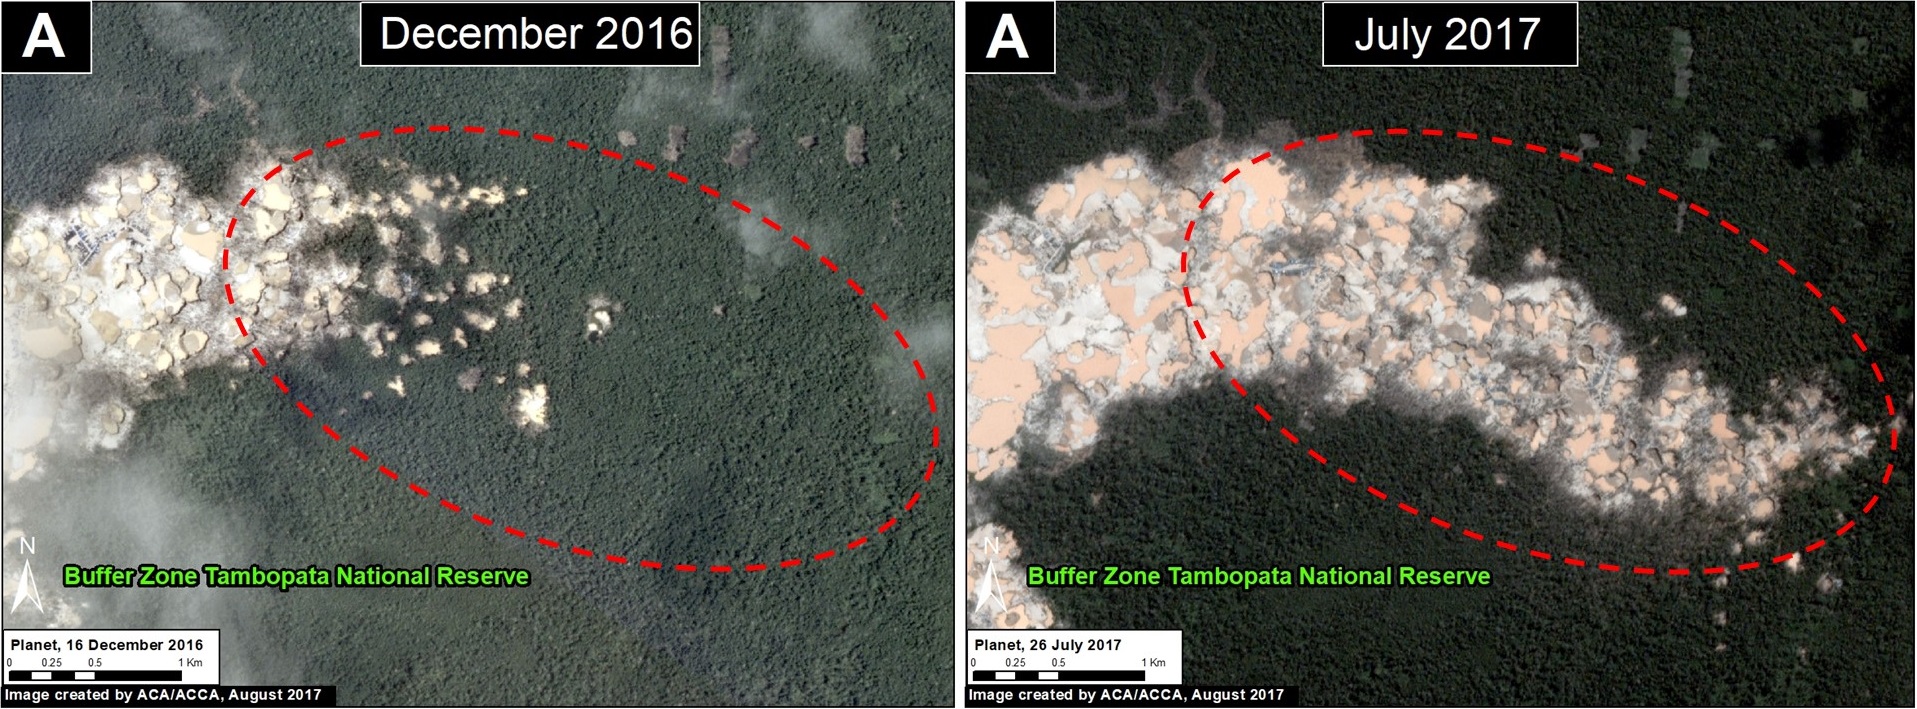
In September 2015, illegal gold miners started to invade Tambopata National Reserve, an important protected area in the southern Peruvian Amazon with world renowned biodiversity. In a series of MAAP articles, we tracked the invasion as it intensified in 2016, and eventually reached 1,360 acres (550 hectares) by early 2017. However, by late 2016, the Peruvian Government intensified its interventions against the illegal mining activity, and the rate of deforestation quickly and sharply decreased. In the most recent satellite imagery, we have not detected any major new expansion of illegal gold mining within the Reserve.
Image 64e shows the initial invasion of Tambopata National Reserve between September 2015 and January 2016. The deforestation within the Reserve intensifies during 2016, but slows significantly in 2017. The yellow circles indicate areas of invasion.
Image 64e. Data: Planet, SERNANP
References
Planet Team (2017). Planet Application Program Interface: In Space for Life on Earth. San Francisco, CA. https://api.planet.com.
Citation
Finer M, Novoa S, Olexy T, Scott A (2017) Good News Deforestation Stories (Peruvian Amazon). MAAP: 64.