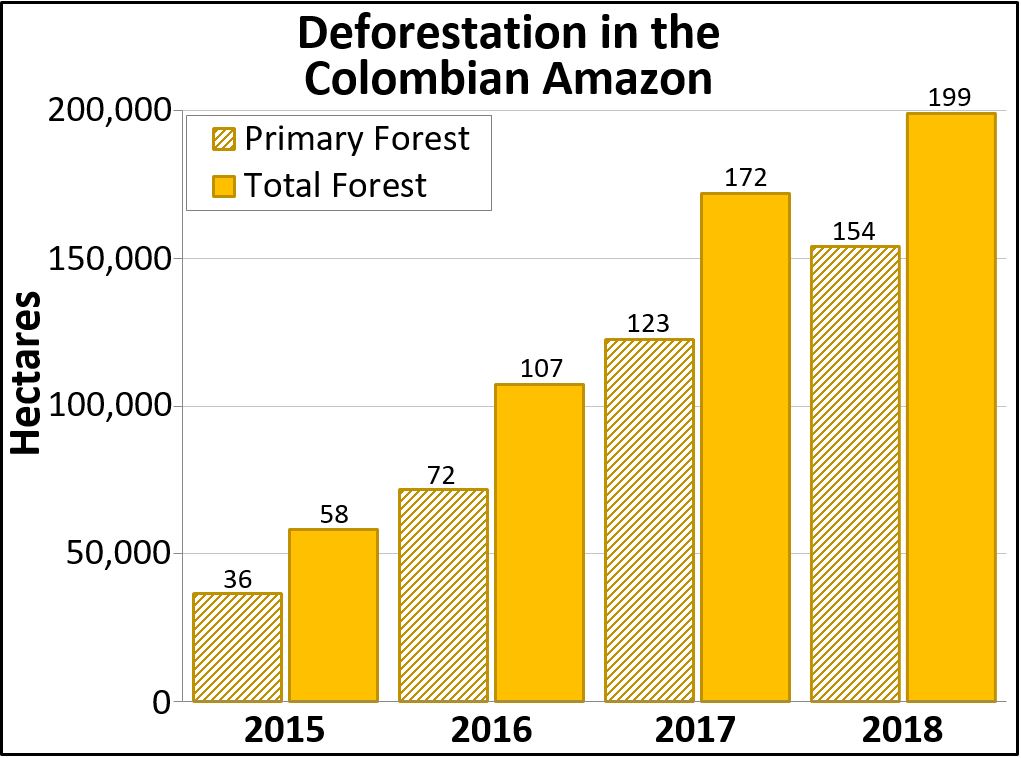
Table 1. Deforestation in the Colombian Amazon. Data: Hansen/UMD/Google/USGS/NASA
We continue our focus on the northwest Colombian Amazon,* one of the most intense deforestation hotspots in the western Amazon (see MAAP# 100).
Here, we analyze deforestation data over the past five years (2015-19) to better understand current trends and patterns.
We found a major increase in deforestation as of 2016. The Colombian Amazon lost nearly 1.2 million acres (478,000 hectares) of forest between 2016 and 2018. Of this, 73% (860,000 acres) was primary forest (see Table 1).
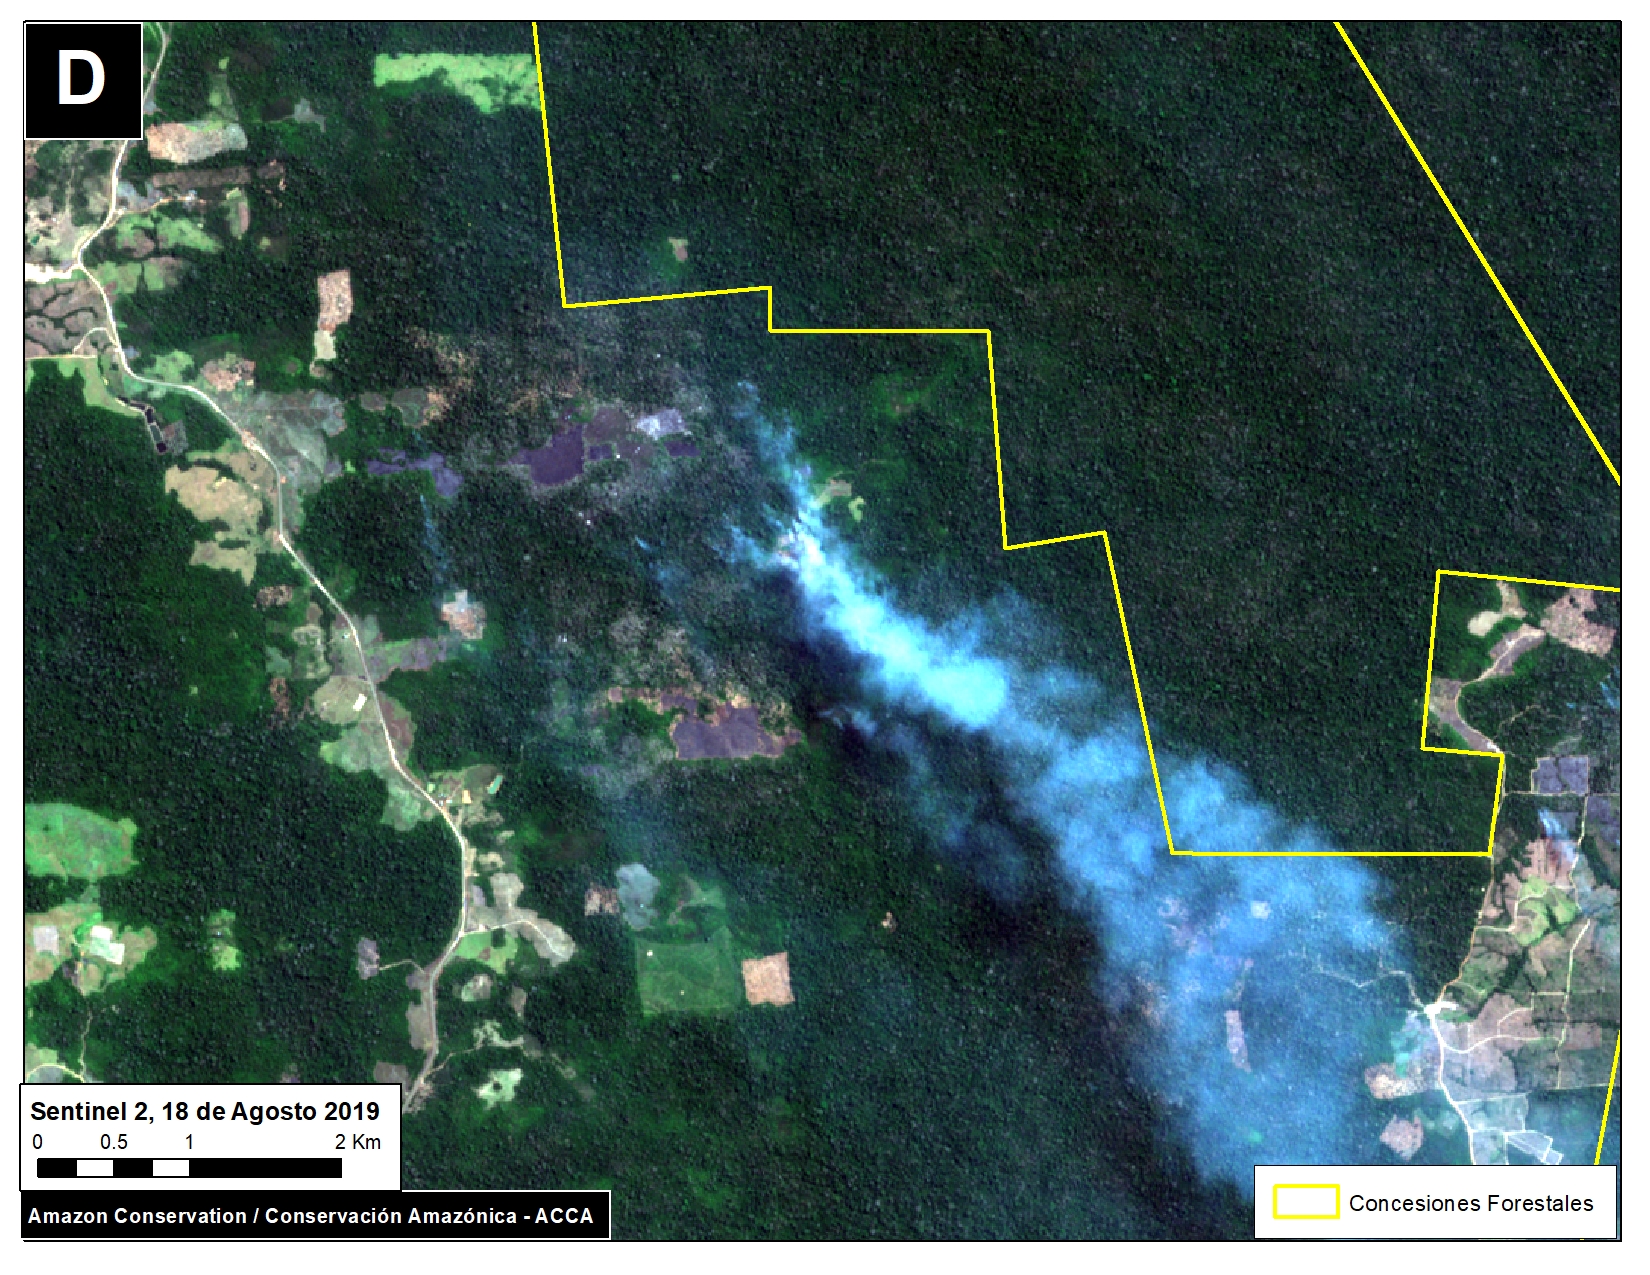
One of the main deforestation drivers in the region is conversion to pasture for land grabbing or cattle ranching.
Next, we provide a real-time update of 2019, based on early warning forest alerts (GLAD alerts) from the University of Maryland/Global Forest Watch), updated through July 25, 2019.
*MAAP in Colombia represents a collaboration between Amazon Conservation and its Colombian partner, the Foundation for Conservation and Sustainable Development (FCDS).”

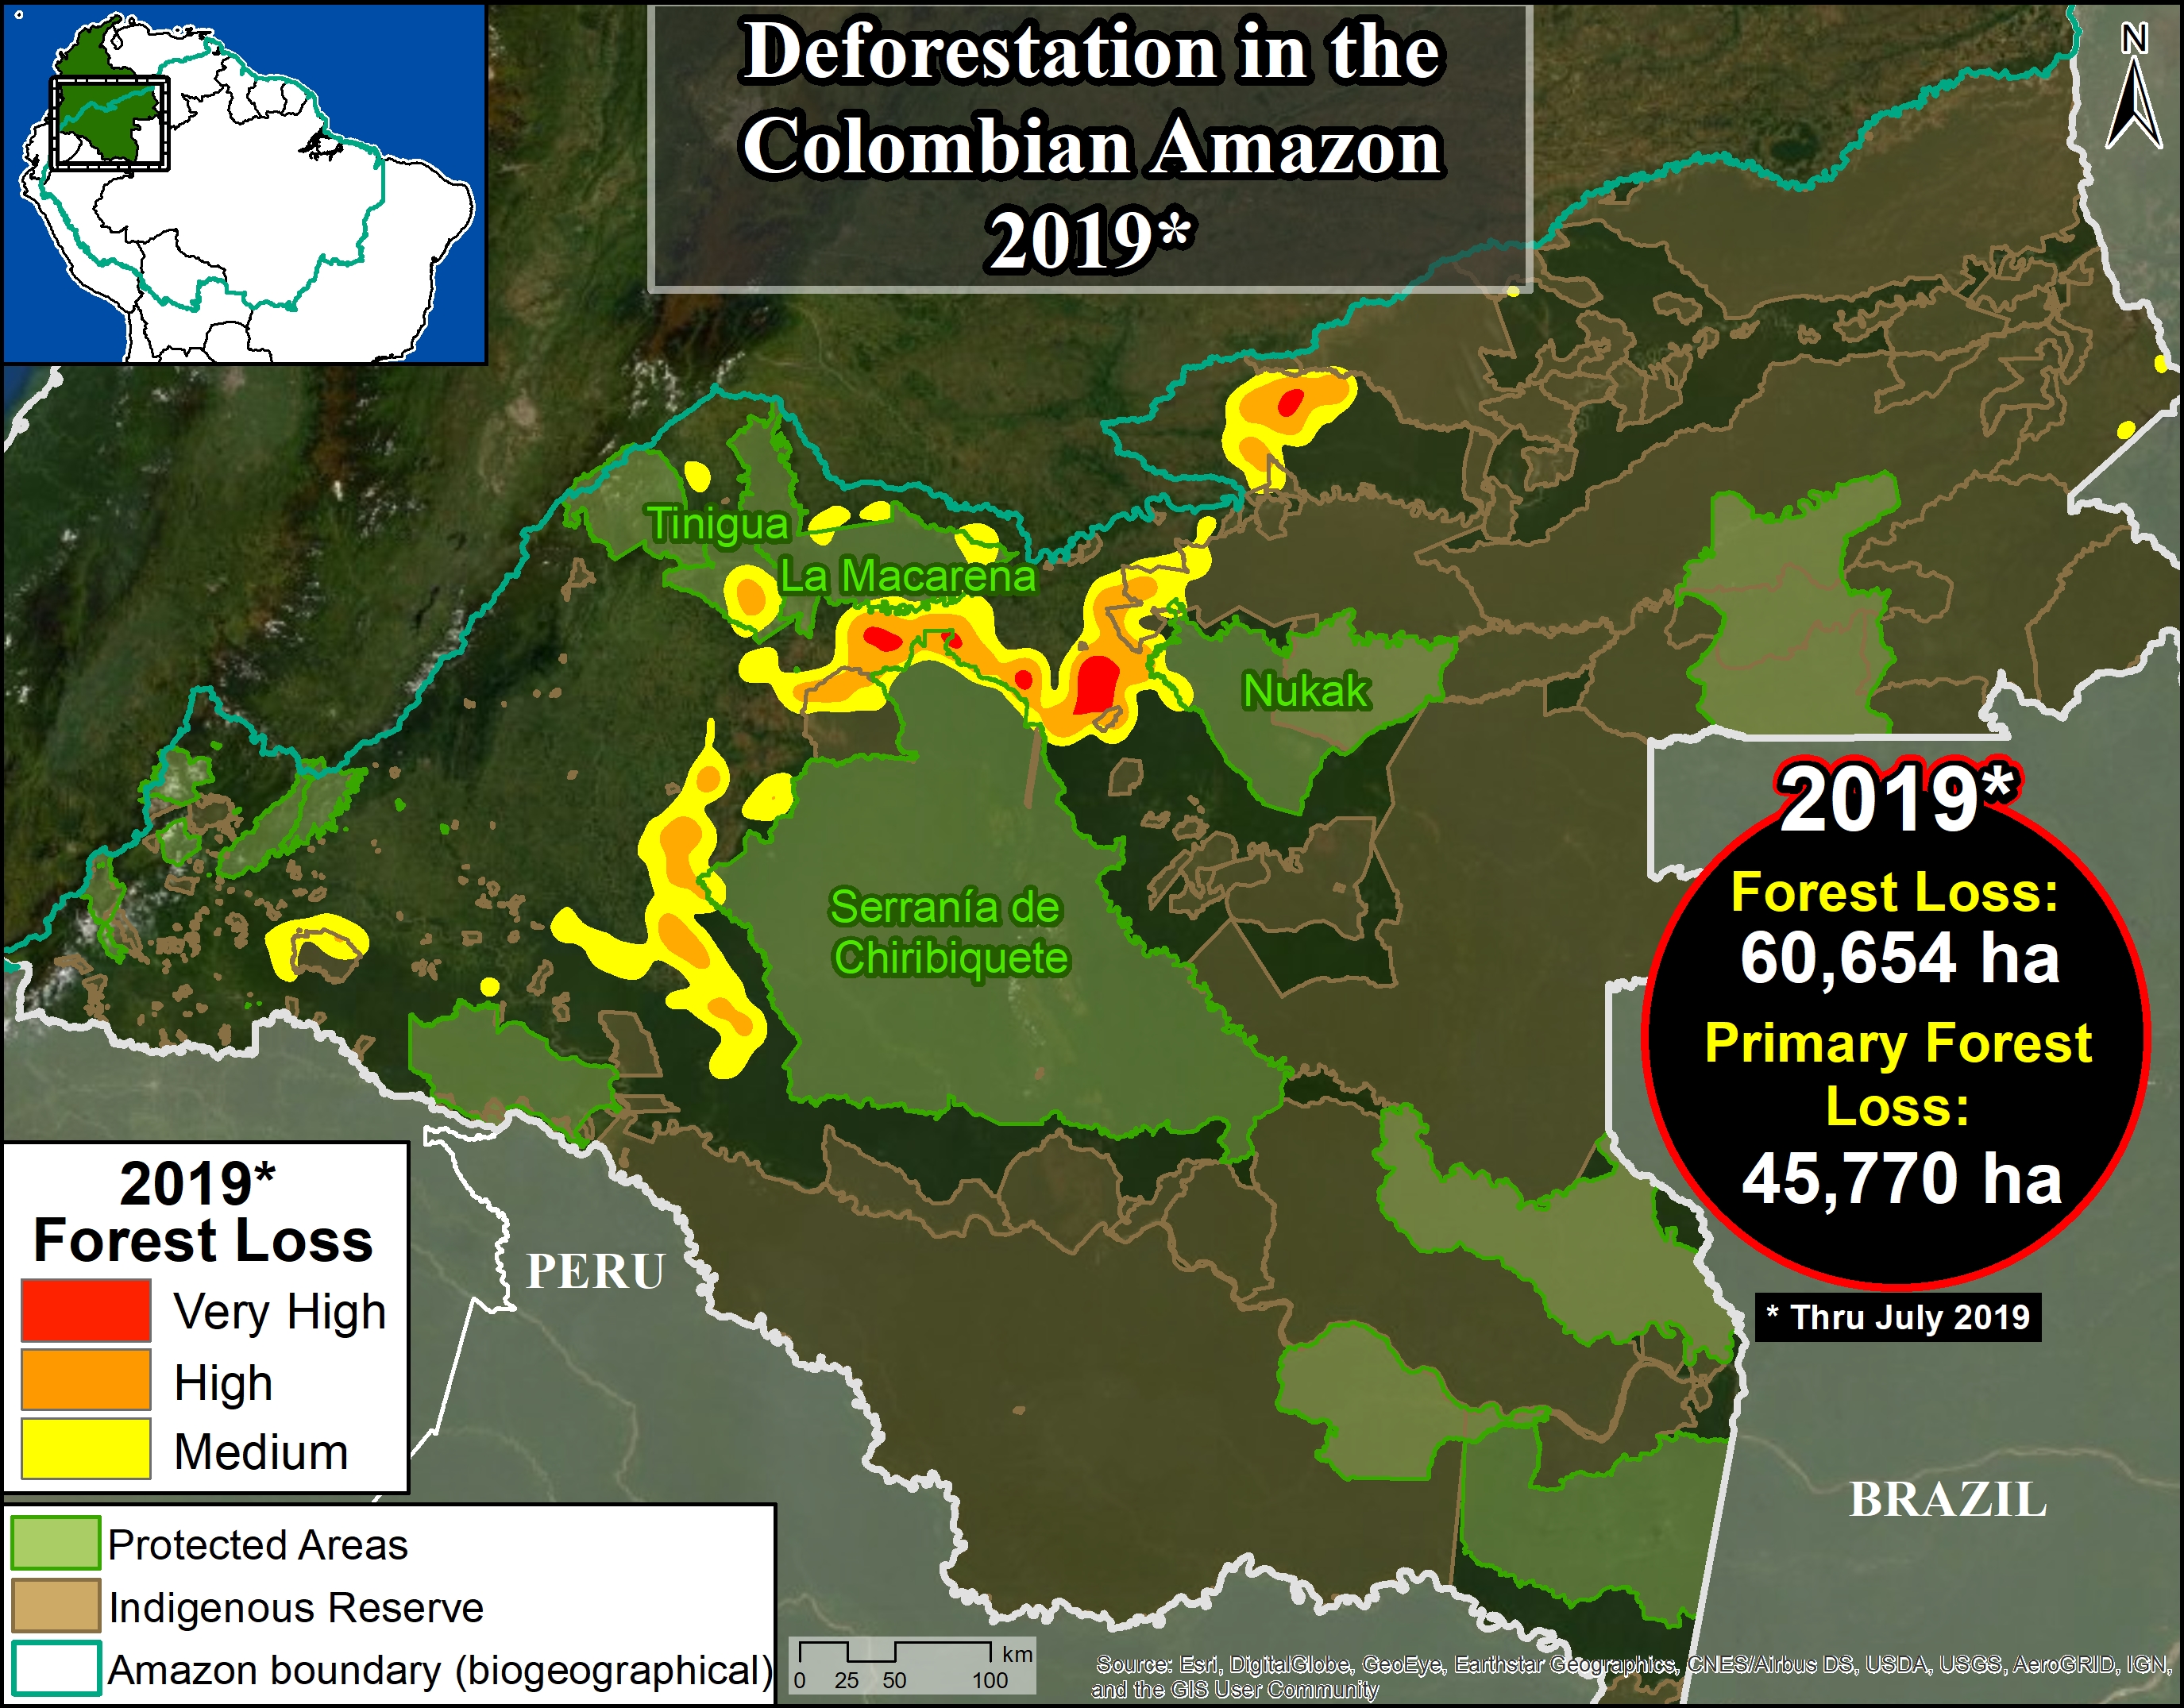
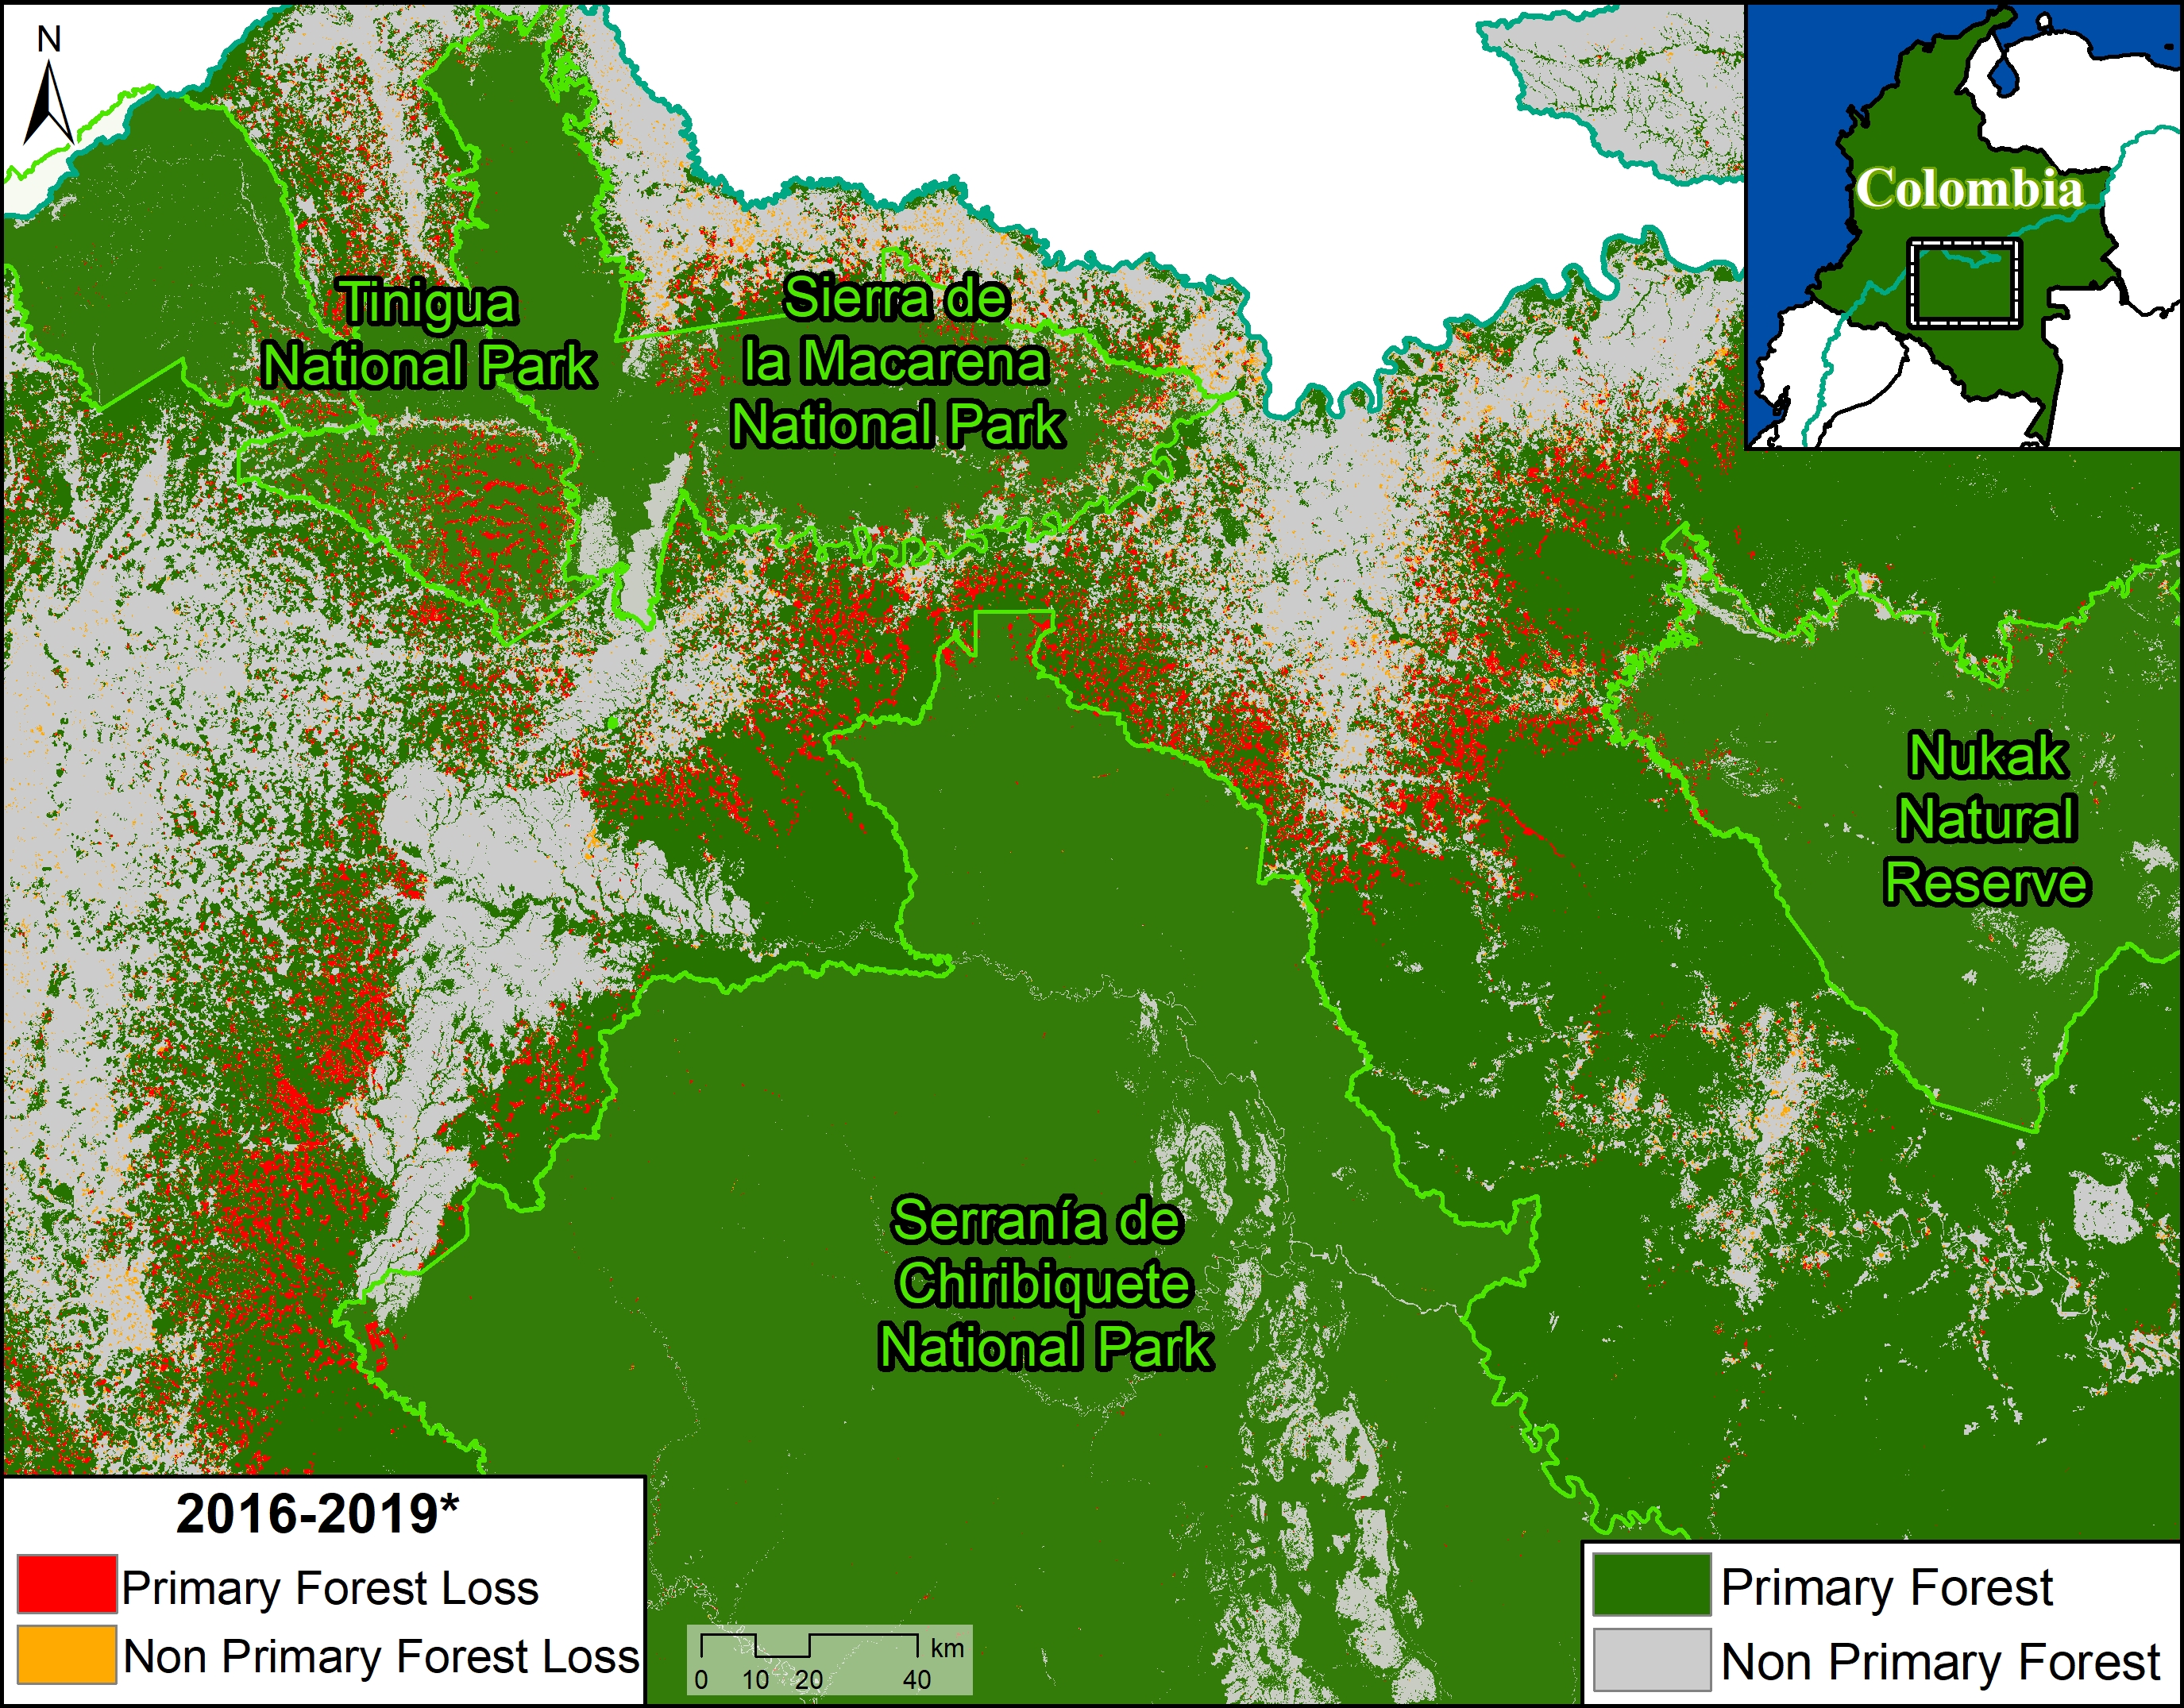
Base Map. Deforestation hotspots in Colombian Amazon. Data: UMD/GLAD, RUNAP, RAISG
Deforestation 2019
The GLAD alerts estimate the additional loss of 150,000 acres (60,654 hectares) in the first 7 months of 2019 (through end of July). Of this, 75% (113,000 acres) was primary forest.
The Base Map shows that 2019 deforestation primarily impacts 4 protected areas* in the northwest Colombian Amazon: Tinigua, Serranía de Chiribiquete, and Sierra de la Macarena National Parks, and Nukak National Reserve.
Next, we detail the recent deforestation in these four protected areas of the Colombian Amazon, including the presentation of a series of satellite-based images.
*There are other protected areas in the Colombian Amazon with recent deforestation (such as Picachos and La Paya National Parks), but here we focus on the four with the highest deforestation thus far during 2019.
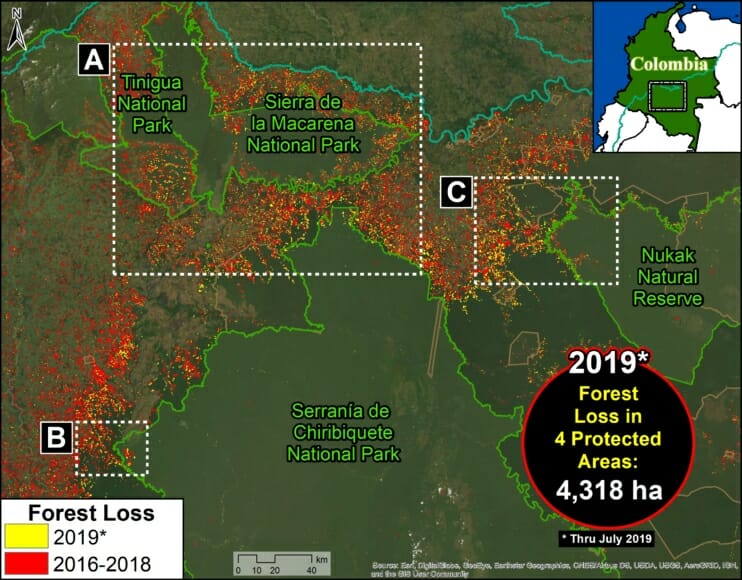
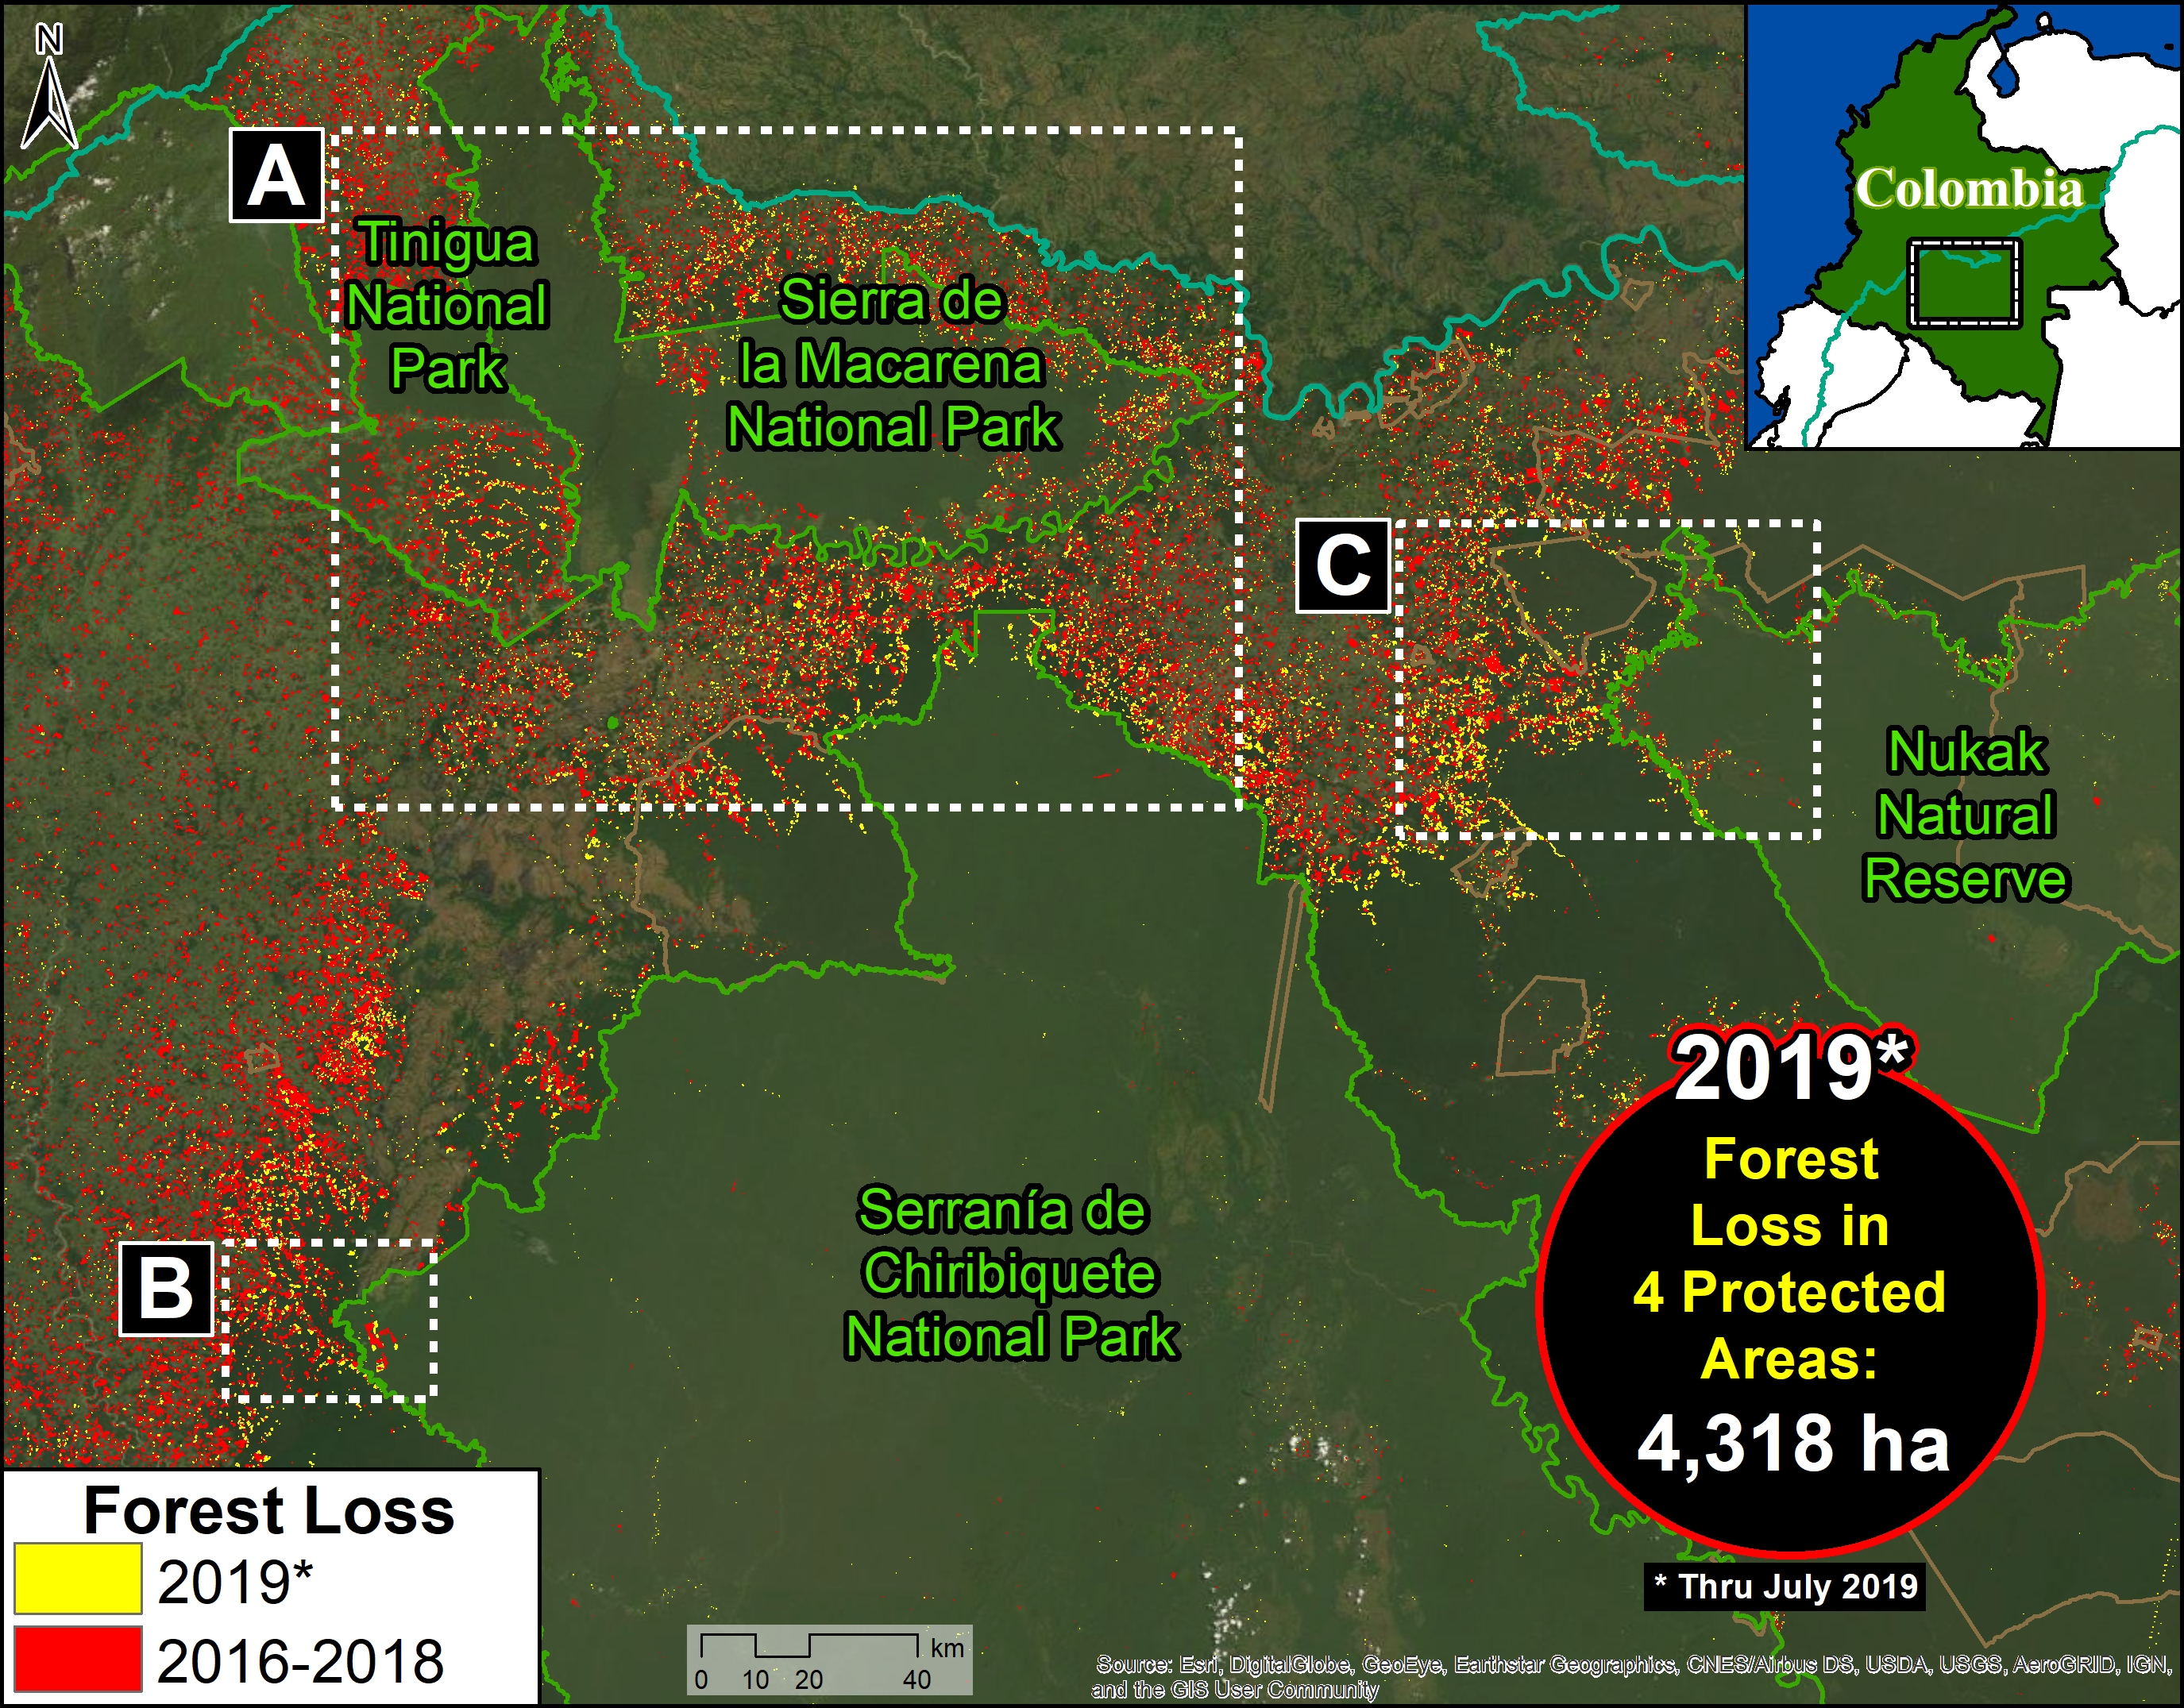
Protected Areas Zoom Map. Deforestation in four protected areas of the Colobian Amazon. Data: UMD/GLAD, Hansen/UMD/Google/USGS/NASA, RUNAP, RAISG
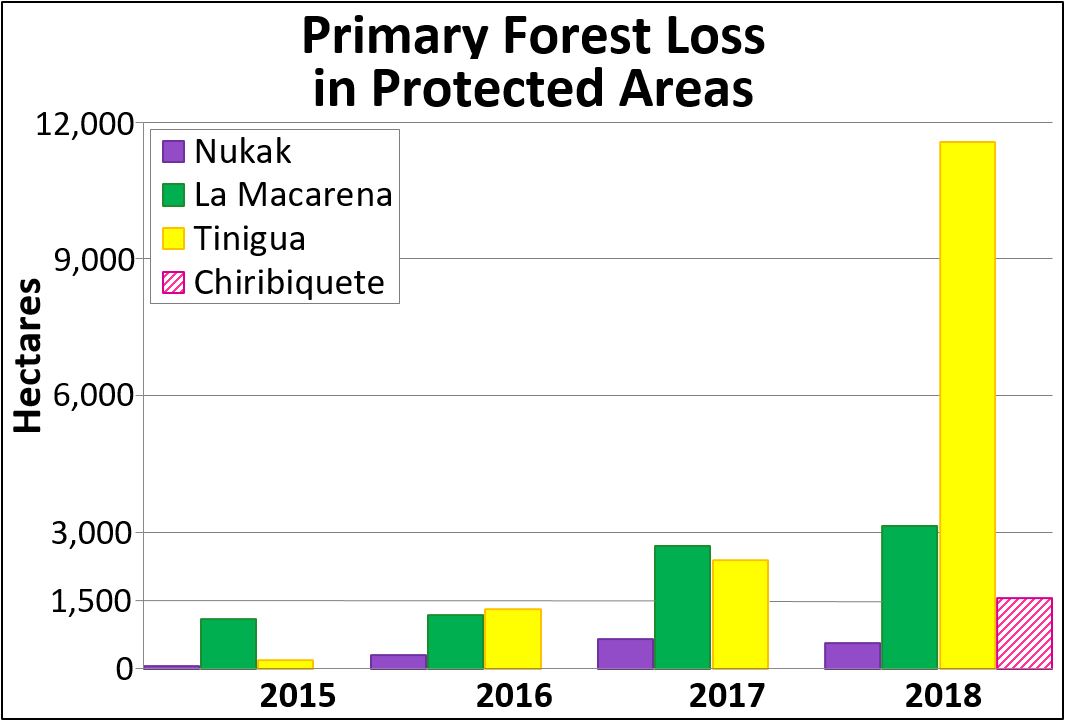
Deforestation in Protected Areas
We conducted a deforestation analys within the 4 protected areas noted above (Chiribiquete, Tinigua, Macarena, and Nukak), generating the following key results:
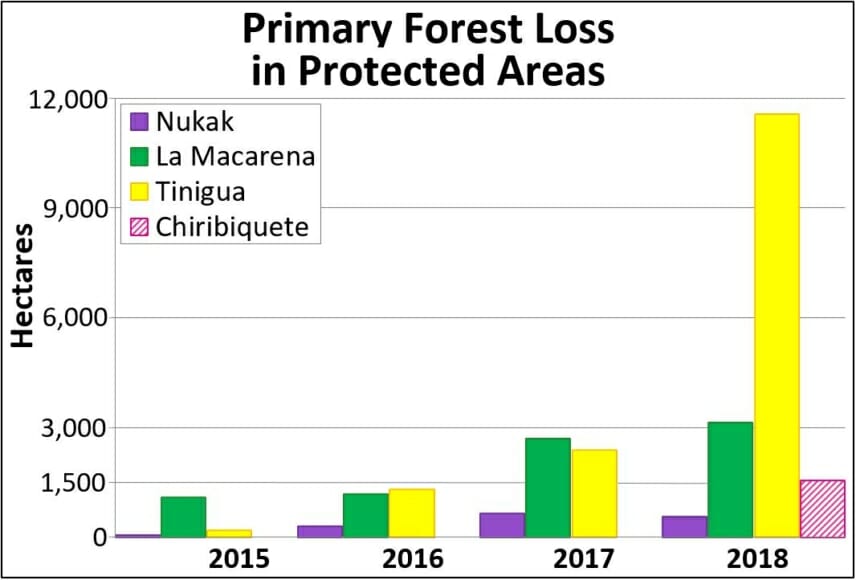
- From 2016-18, deforestation claimed over 70,000 acres (29,000 ha) in the four protected areas, 86% of which were primary forests (62,000 acres).
.
- Thus far in 2019 (through July 25), deforestation claimed an additional 10,600 acres (4,300 ha), 87% of which were primary forests (9,200 acres).
.
- Tinigua National Park has been the most impacted protected area, as deforestation claimed 39,500 acres (16,000 ha) from 2017-19 (96% of which were primary forests). Note the major deforestation spike in 2018.
.
- Deforestation has claimed 6,400 acres (2,600 ha) in Chiribiquete National Park since its expansion in July 2018 (96% of which were primary forests).
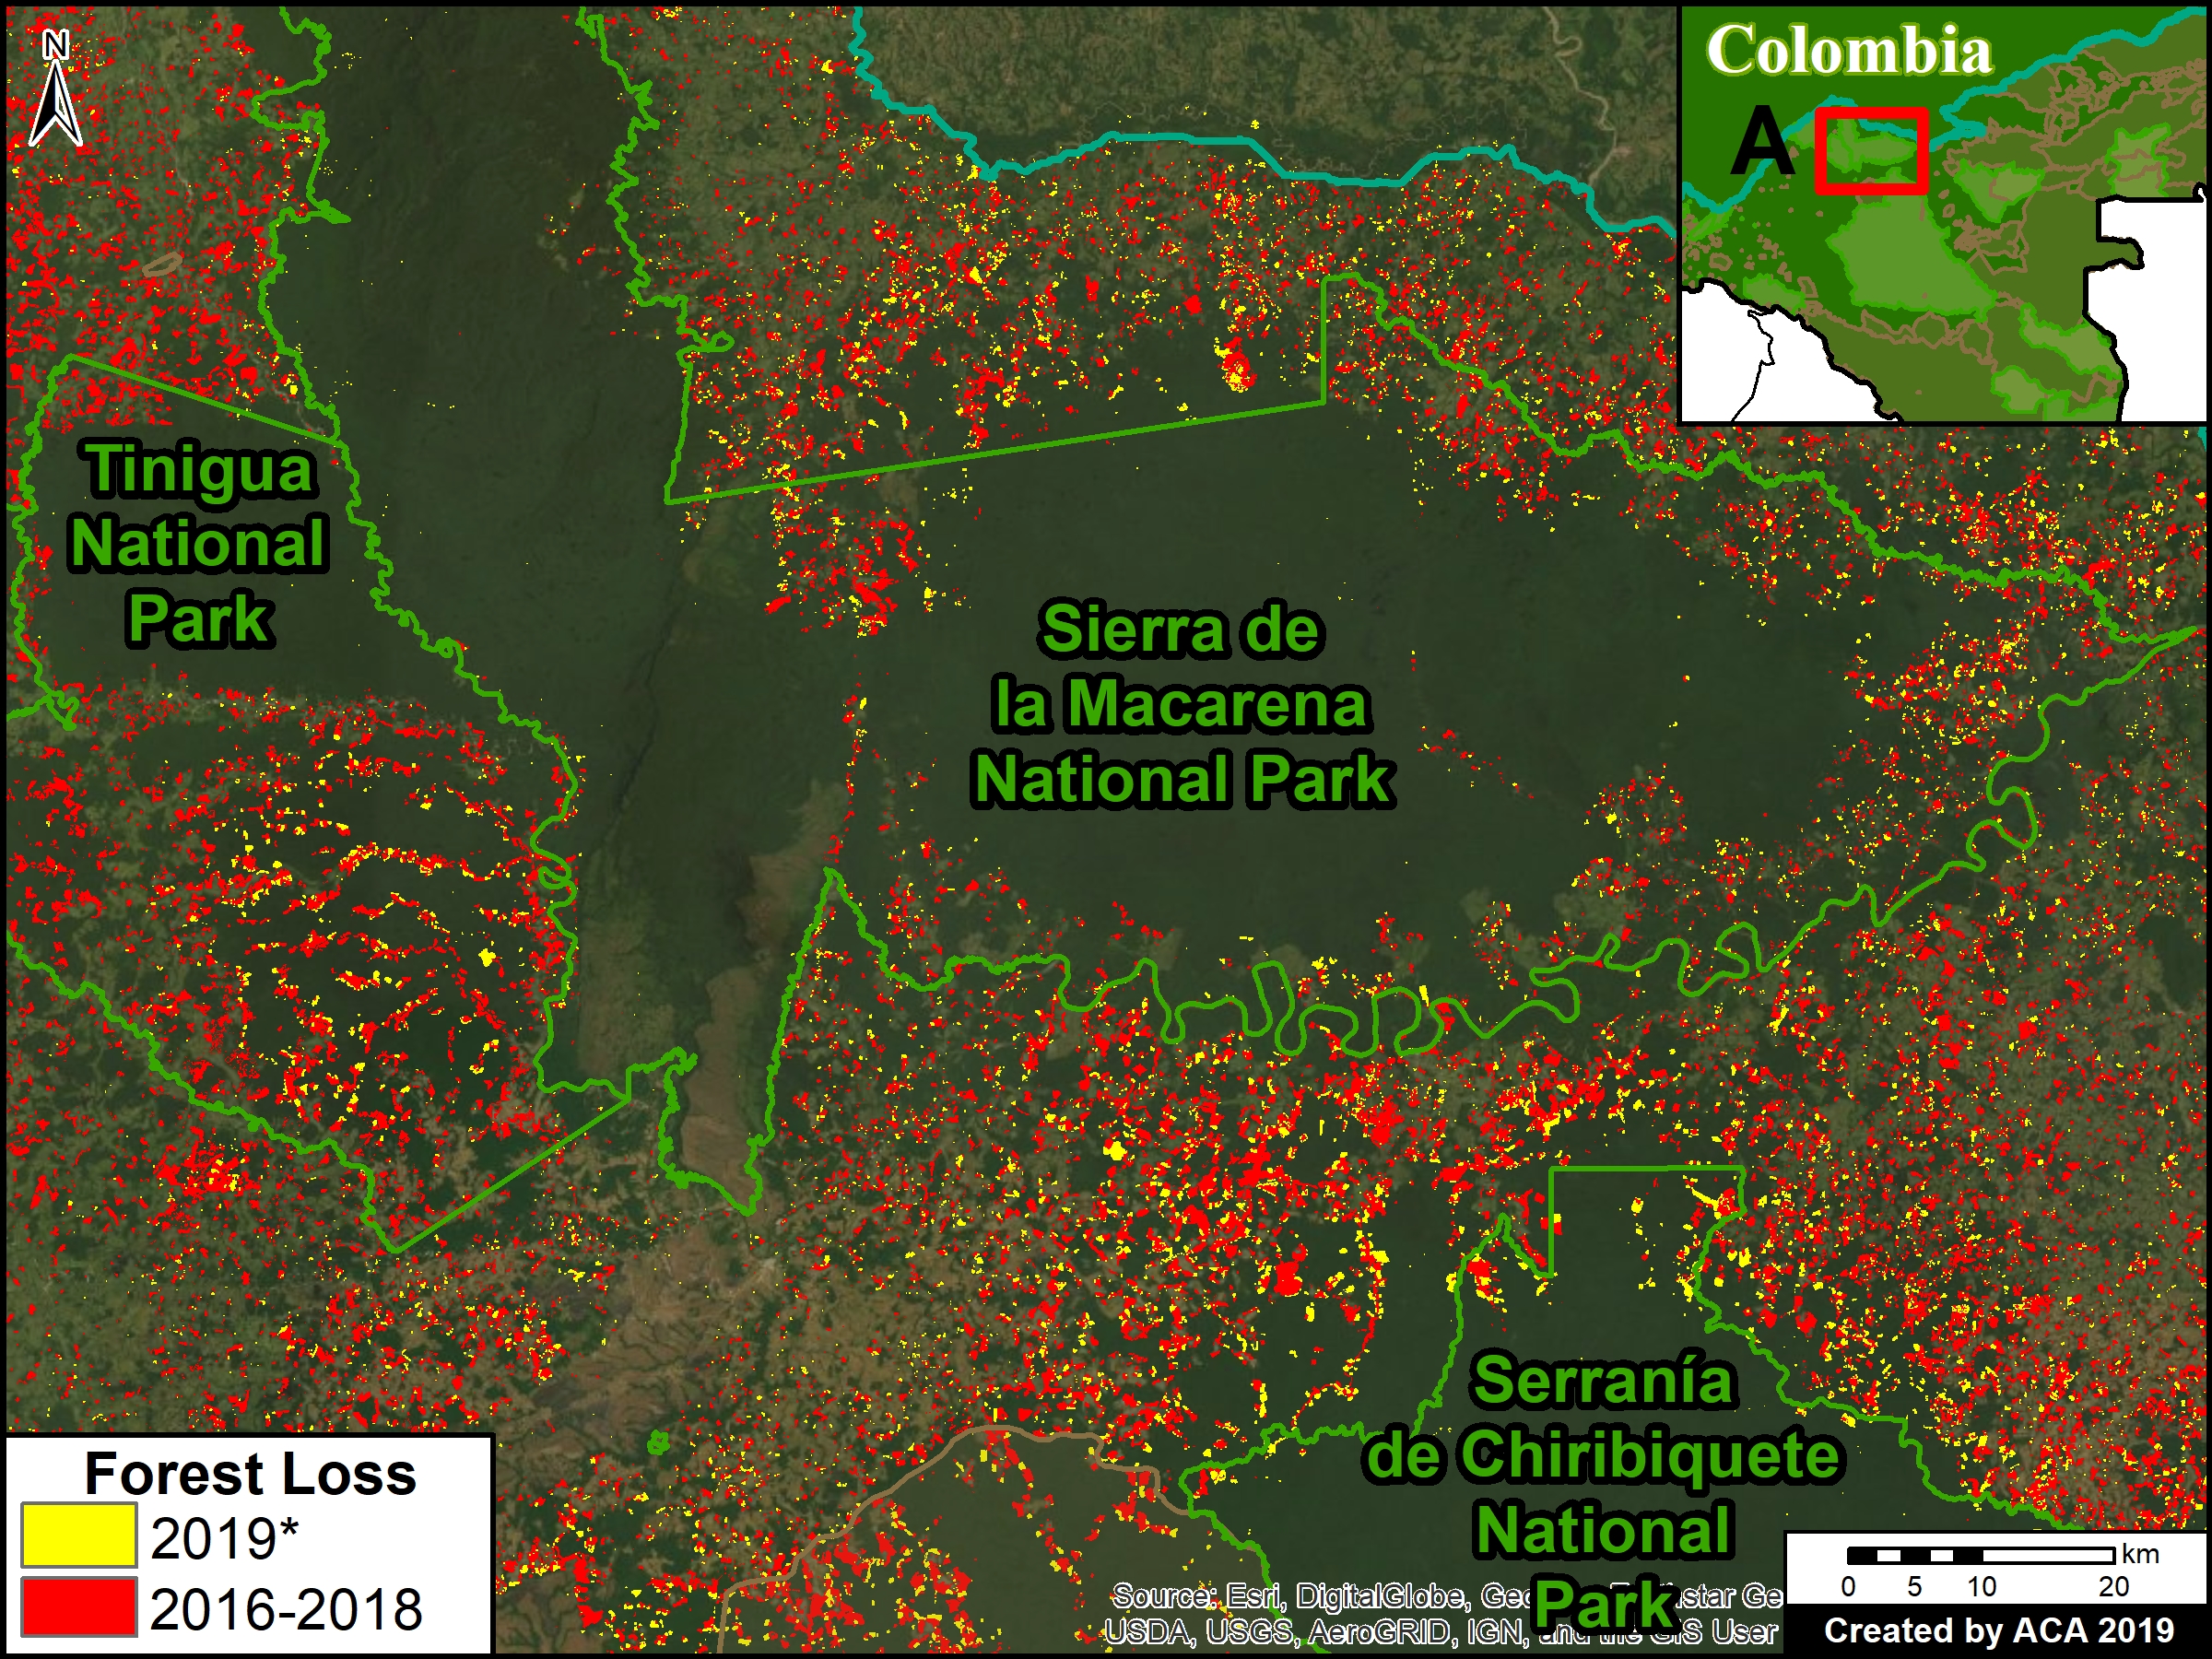
Zoom A: Deforestation in Tinigua, Chiribiquete, and Macarena National Parks
See location of Zooms A-C in Protected Areas Zoom Map above. Data updated through July 25, 2019.
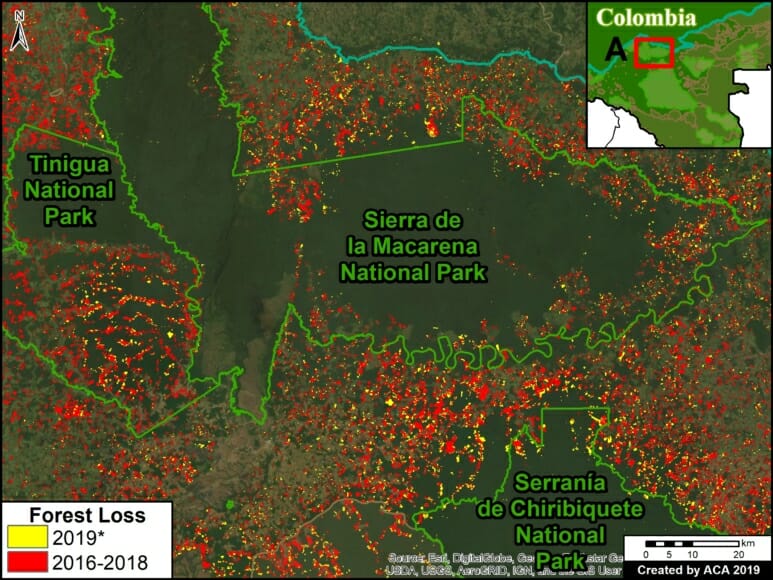
Zoom A. Deforestation in Tinigua, Serranía de Chiribiquete, and Sierra de la Macarena National Parks, *through July 25, 2019. Data: UMD/GLAD, Hansen/UMD/Google/USGS/NASA, RUNAP, RAISG
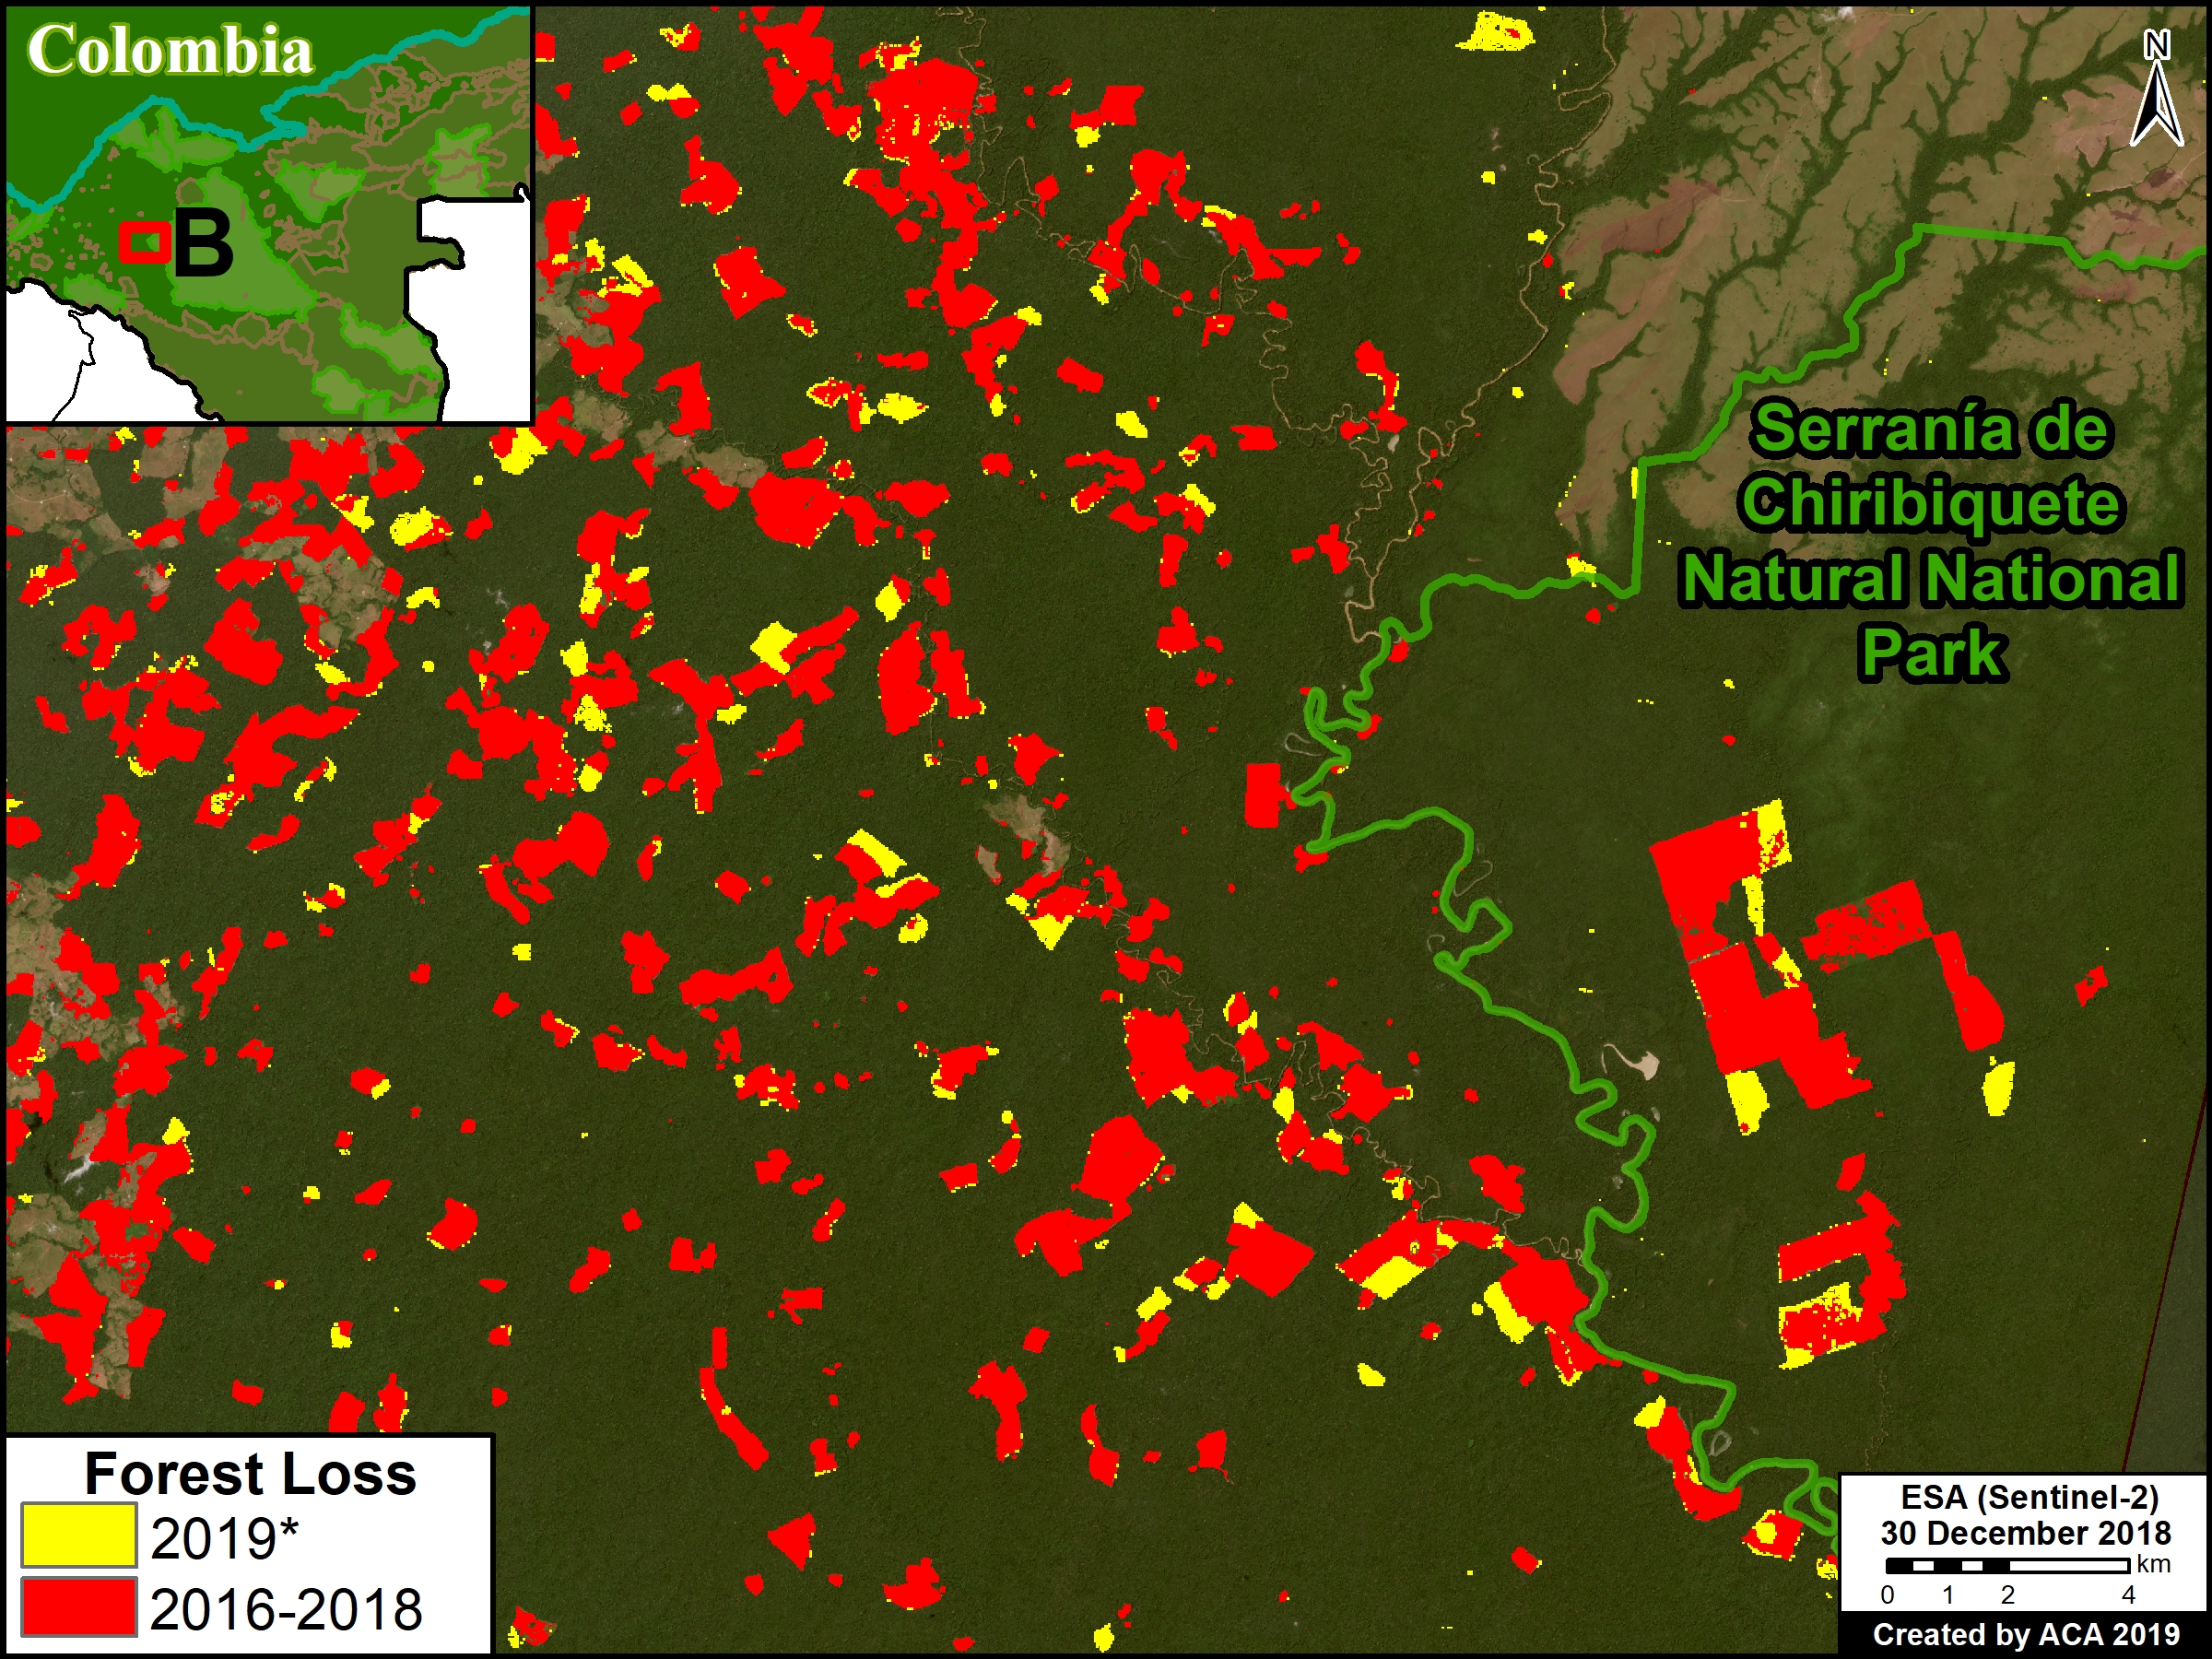
Zoom B. Deforestation in Chiribiquete National Park (western sector)

Zoom B. Deforestation Serranía de Chiribiquete National Park (western sector), *through July 25, 2019. Data: UMD/GLAD, Hansen/UMD/Google/USGS/NASA, RUNAP, RAISG
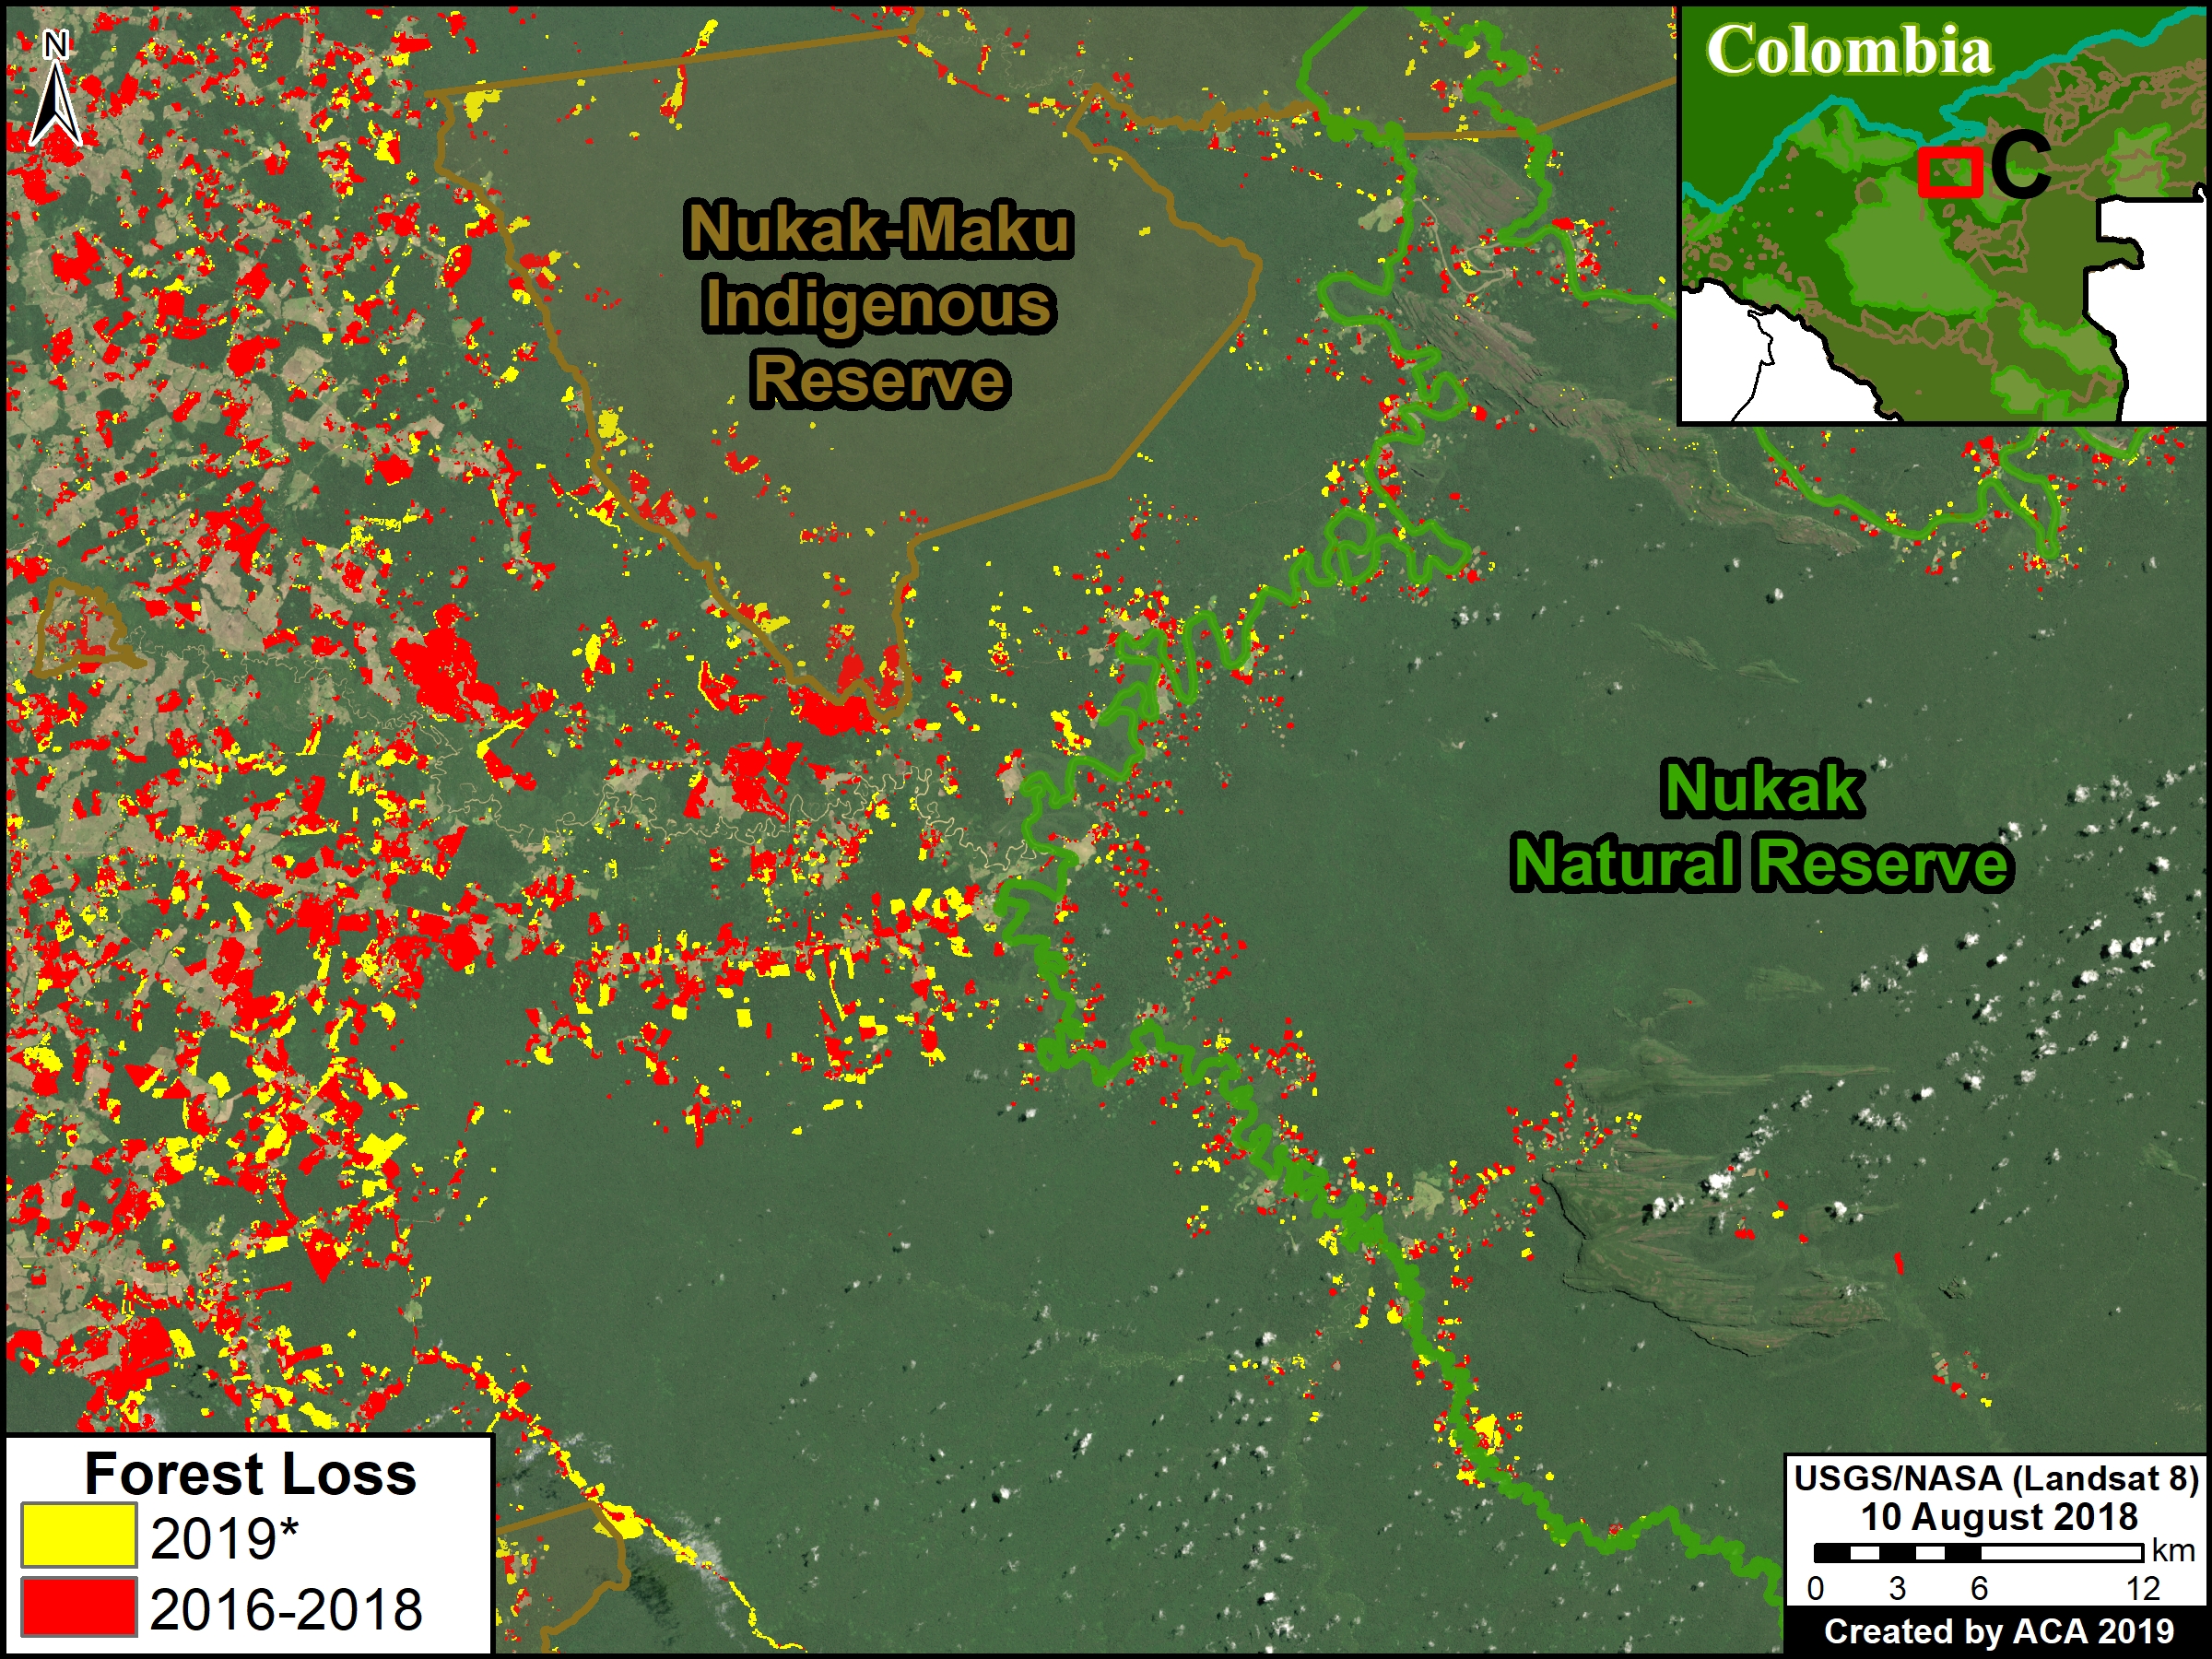
Zoom C. Deforestation in Nukak National Reserve
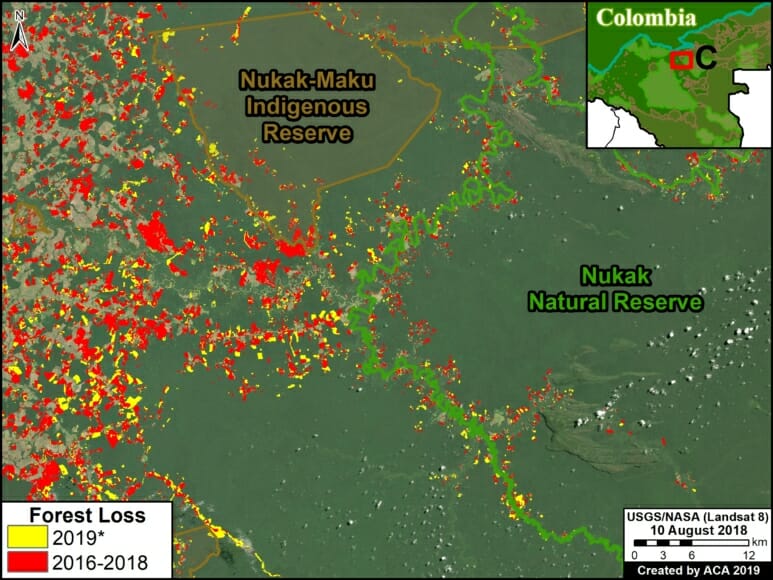
Zoom C. Deforestation in Nukak National Reserve *through July 25, 2019. Data: UMD/GLAD, Hansen/UMD/Google/USGS/NASA, RUNAP, RAISG
Annex 1: Table
Deforestation of Primary Forest in four protected areas (2015-18)
Annex 2: Map
Deforestation of Primary Forest in four protected areas (2016-19)

Annex 2. Data: Turubanova 2018, UMD/GLAD, Hansen/UMD/Google/USGS/NASA, RUNAP, RAISG
Methodology
We primarily used data generated by the GLAD laboratory of the University of Maryland, available on Global Forest Watch. This data is based on moderate resolution Landsat imagery (30 m). For 2017-18, we analyzed annual data (Hansen et al 2013), and for 2019 we analyzed GLAD alerts (Hansen et al 2016).
For our deforestation estimates, we multiplied the annual “forest cover loss” data by the density percentage of the “tree cover” from the year 2000 (values >30%). Including this percentage allows us to look at the precise area of each pixel, thus improving the preciseness of the results.
We define primary forest as “mature natural humid tropical forest cover that has not been completely cleared and regrown in recent history,” following the definition from Turubanova et al 2018. For our primary forest deforestation estimates, we intersected the forest cover loss data with the additional dataset “primary humid tropical forests” as of 2001 (Turubanova et al 2018). For more details on this part of the methodology, see the Technical Blog from Global Forest Watch (Goldman and Weisse 2019).
All data were processed under the geographical coordinate system WGS 1984. To calculate the areas in metric units the UTM (Universal Transversal Mercator) projection was used: Colombia 18 North.
To identify the deforestation hotspots in the Base Map, we conducted a kernel density estimate. This type of analysis calculates the magnitude per unit area of a particular phenomenon, in this case forest cover loss. We conducted this analysis using the Kernel Density tool from Spatial Analyst Tool Box of ArcGIS. We used the following parameters:
Search Radius: 15000 layer units (meters)
Kernel Density Function: Quartic kernel function
Cell Size in the map: 200 x 200 meters (4 hectares)
Everything else was left to the default setting.
For the Base Map, we used the following concentration percentages: Medium: 10%-25%; High: 26%-50%; Very High: >50%.
References
Hansen, M. C., P. V. Potapov, R. Moore, M. Hancher, S. A. Turubanova, A. Tyukavina, D. Thau, S. V. Stehman, S. J. Goetz, T. R. Loveland, A. Kommareddy, A. Egorov, L. Chini, C. O. Justice, and J. R. G. Townshend. 2013. “High-Resolution Global Maps of 21st-Century Forest Cover Change.” Science 342 (15 November): 850–53.
Hansen, M.C., A. Krylov, A. Tyukavina, P.V. Potapov, S. Turubanova, B. Zutta, S. Ifo, B. Margono, F. Stolle, and R. Moore. 2016. Humid tropical forest disturbance alerts using Landsat data. Environmental Research Letters, 11 (3).
Hansen, M.C., A. Krylov, A. Tyukavina, P.V. Potapov, S. Turubanova, B. Zutta, S. Ifo, B. Margono, F. Stolle, and R. Moore. 2016. Humid tropical forest disturbance alerts using Landsat data. Environmental Research Letters, 11 (3).
Turubanova S., Potapov P., Tyukavina, A., and Hansen M. (2018) Ongoing primary forest loss in Brazil, Democratic Republic of the Congo, and Indonesia. Environmental Research Letters.
Acknowledgements
We thank R. Botero (FCDS), A. Rojas (FCDS) y G. Palacios for helpful comments to earlier versions of this report.
This work was supported by the following major funders: MacArthur Foundation, International Conservation Fund of Canada (ICFC), Metabolic Studio, and Global Forest Watch Small Grants Fund (WRI).
Citation
Finer M, Mamani N (2019) Deforestation impacts 4 protected areas in the Colombian Amazon (2019). MAAP: 106.