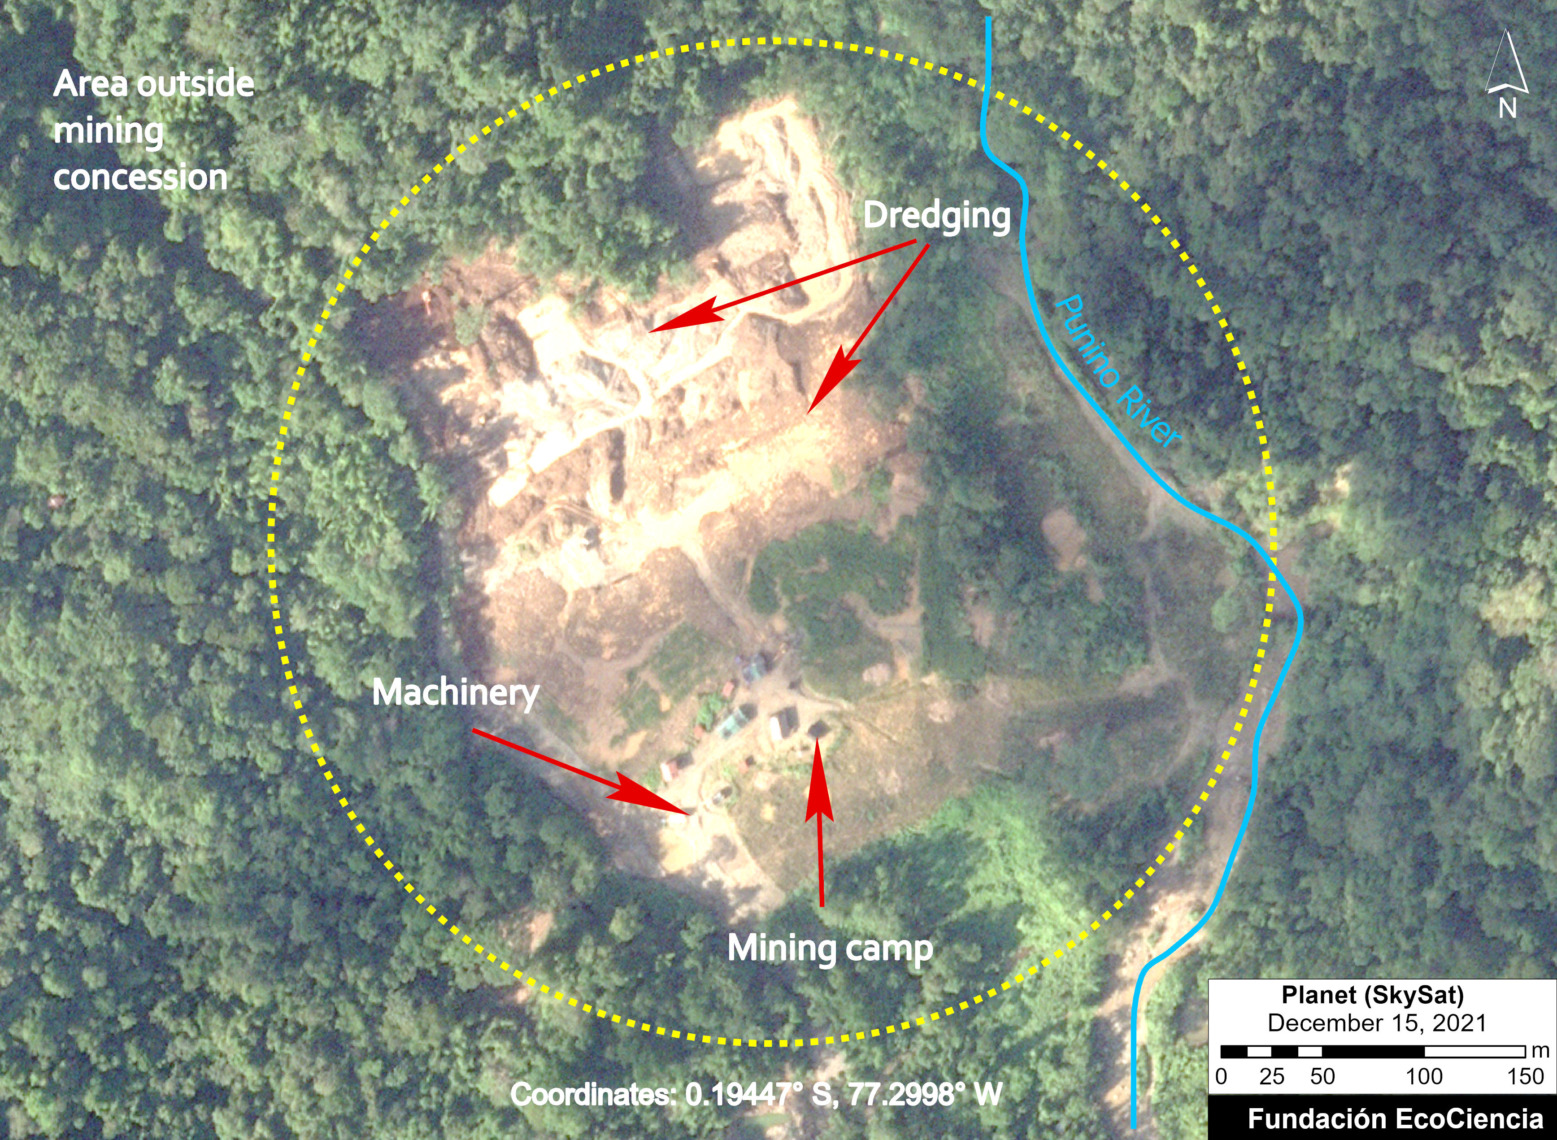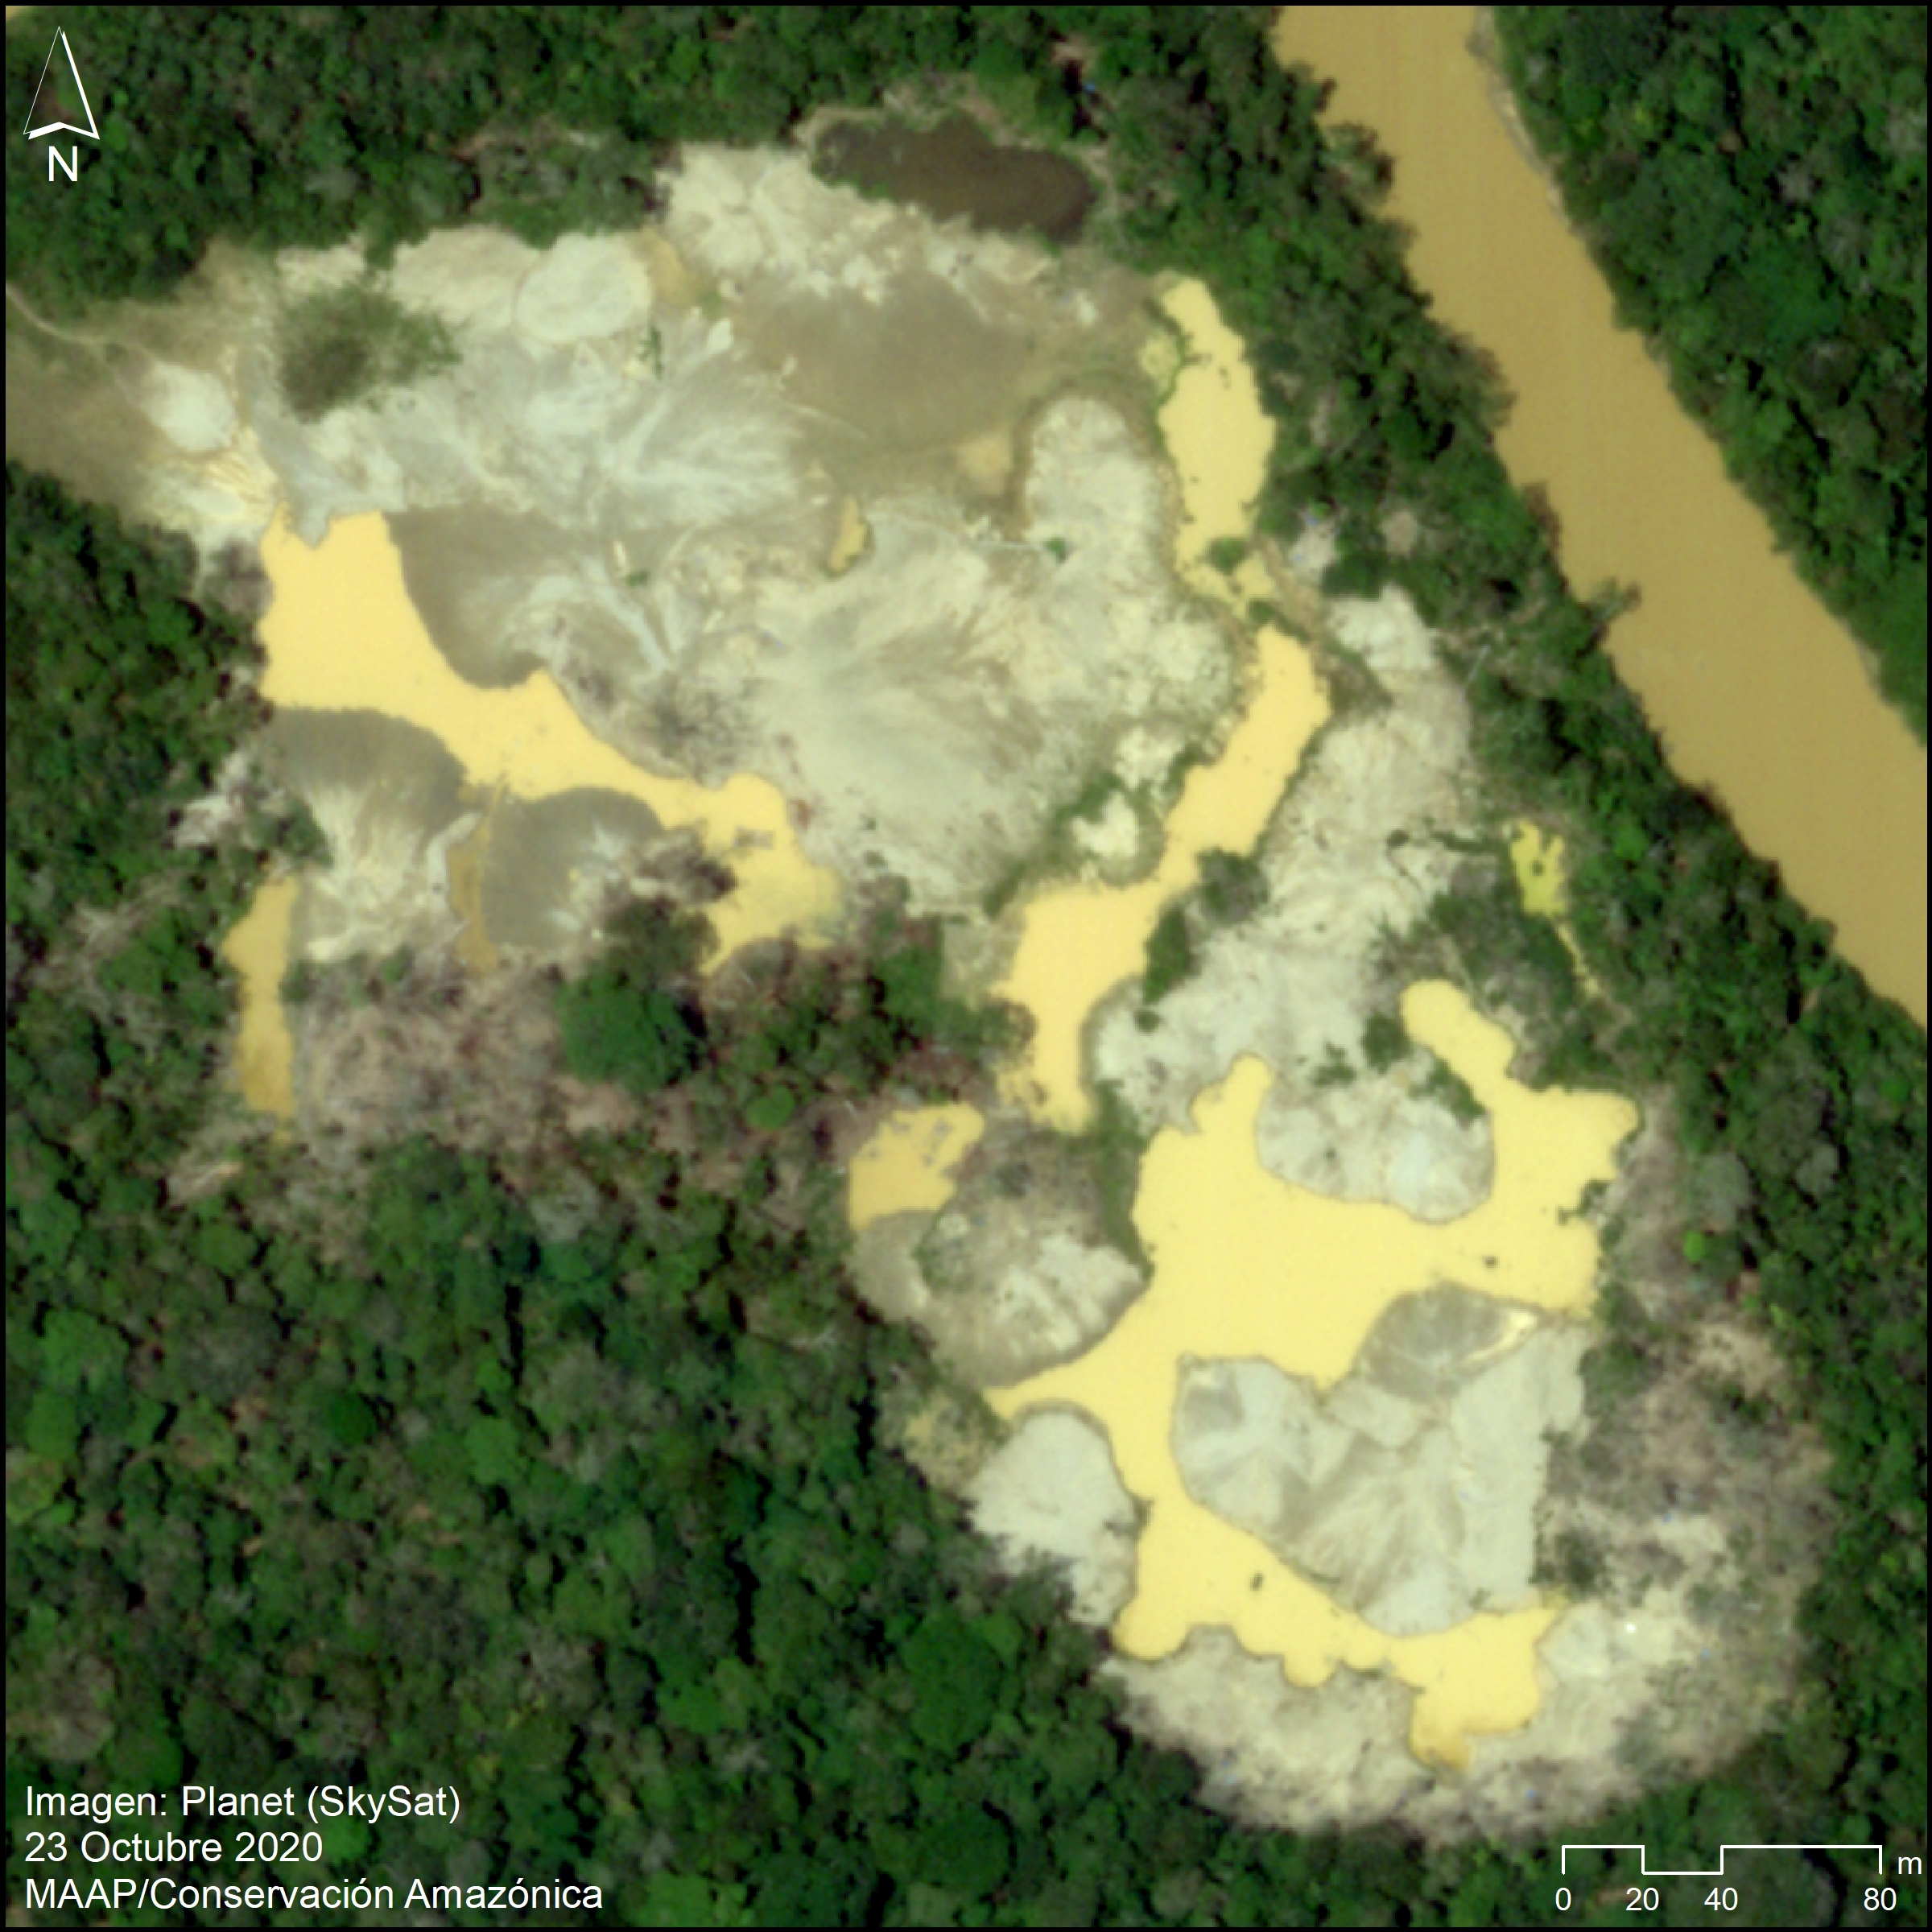
Image: Skysat (Planet). Analysis: MAAP/Amazon Conservation.
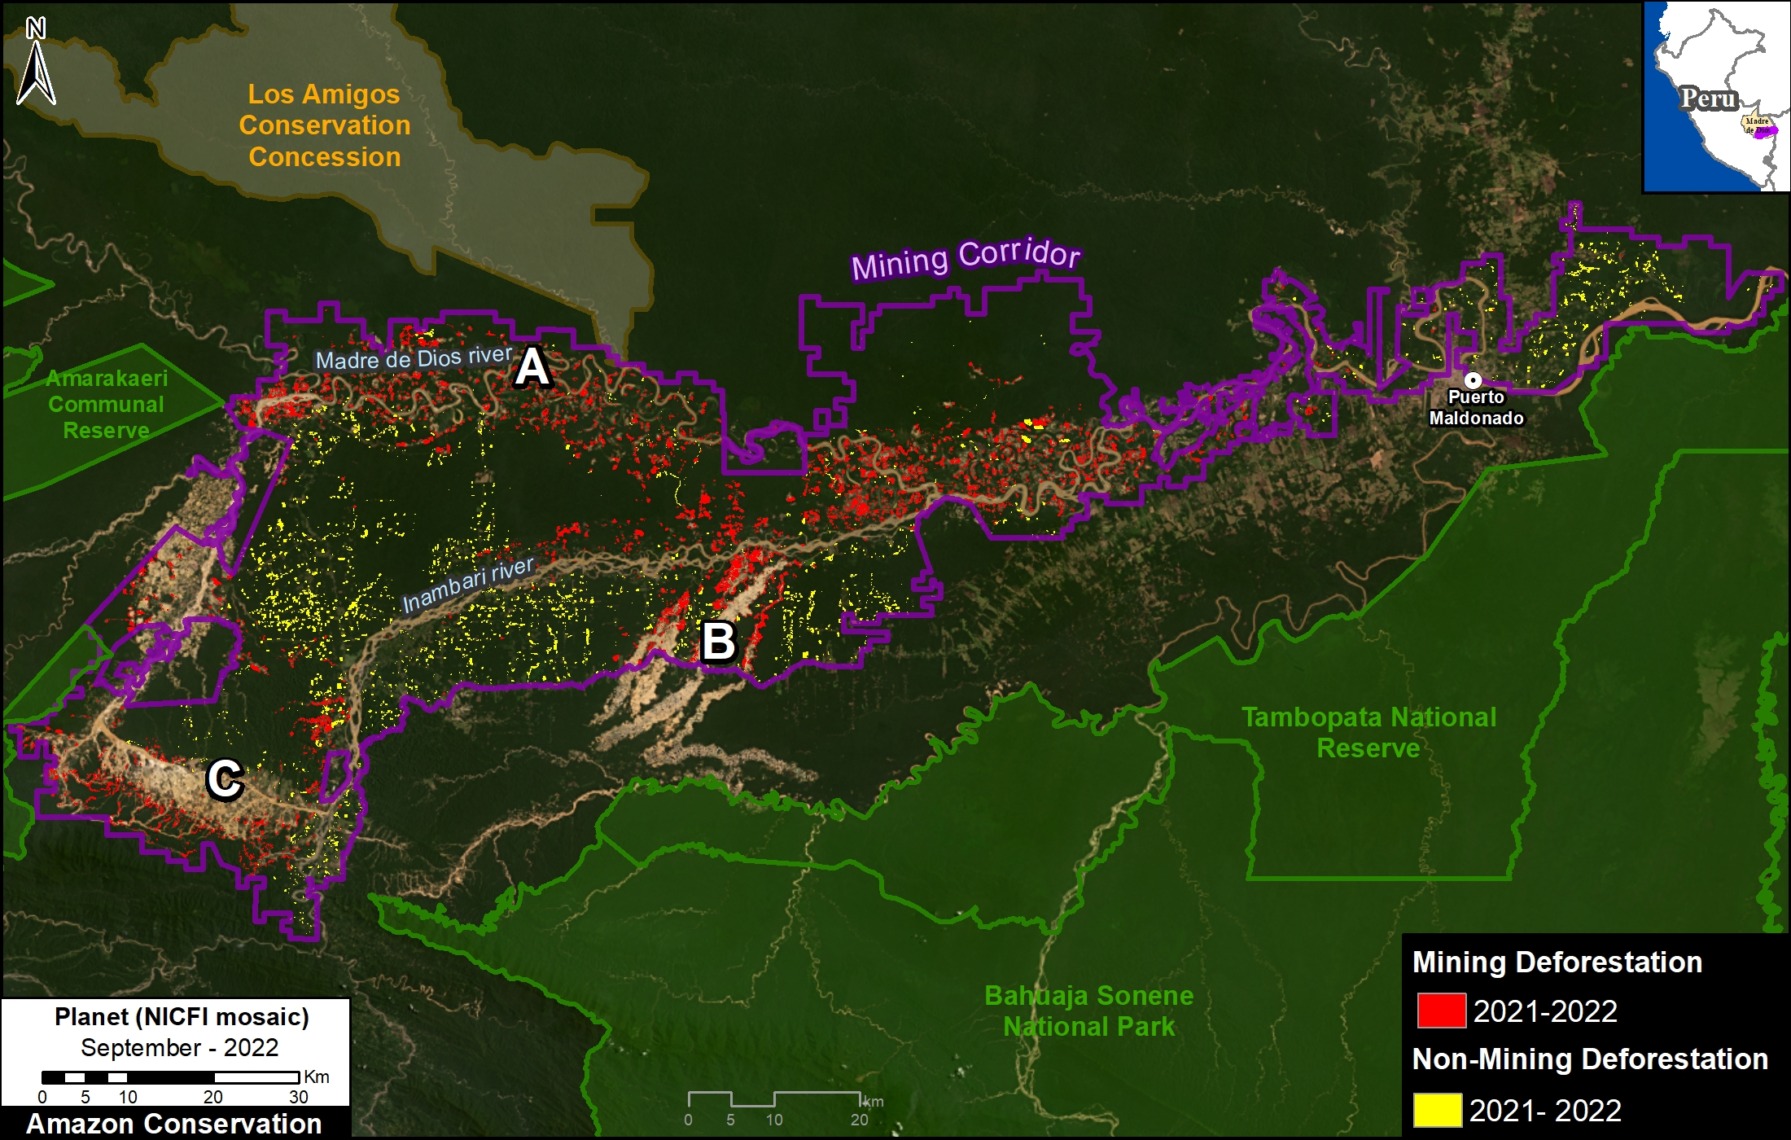
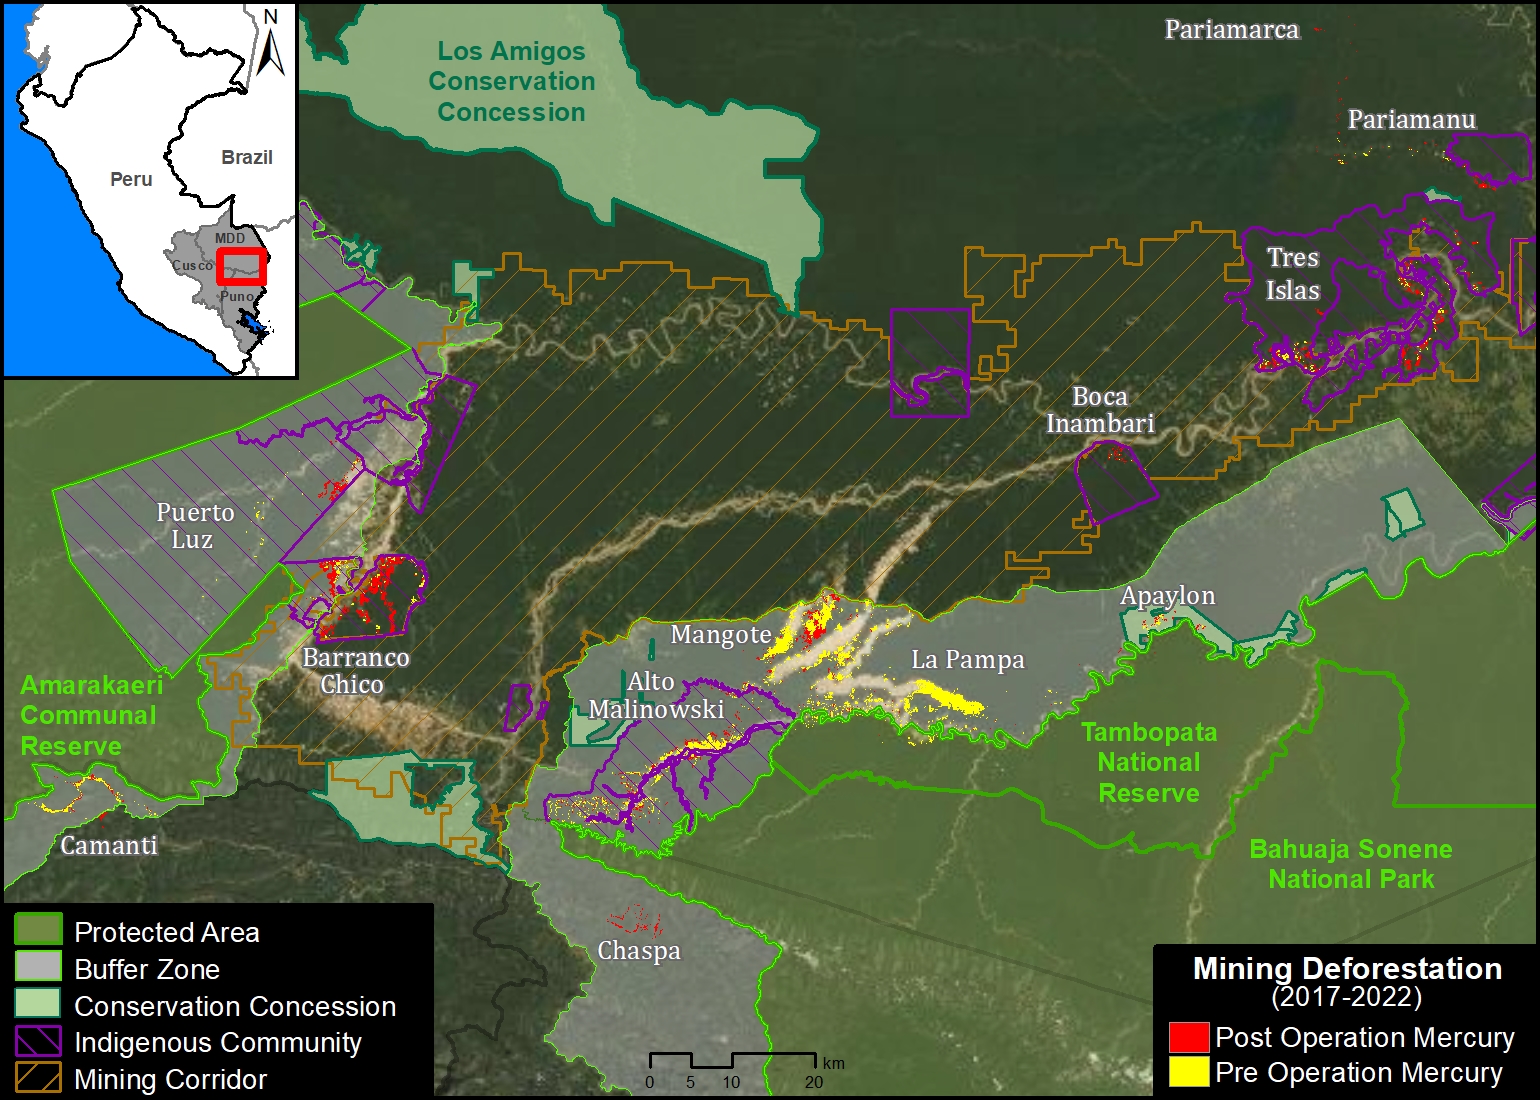
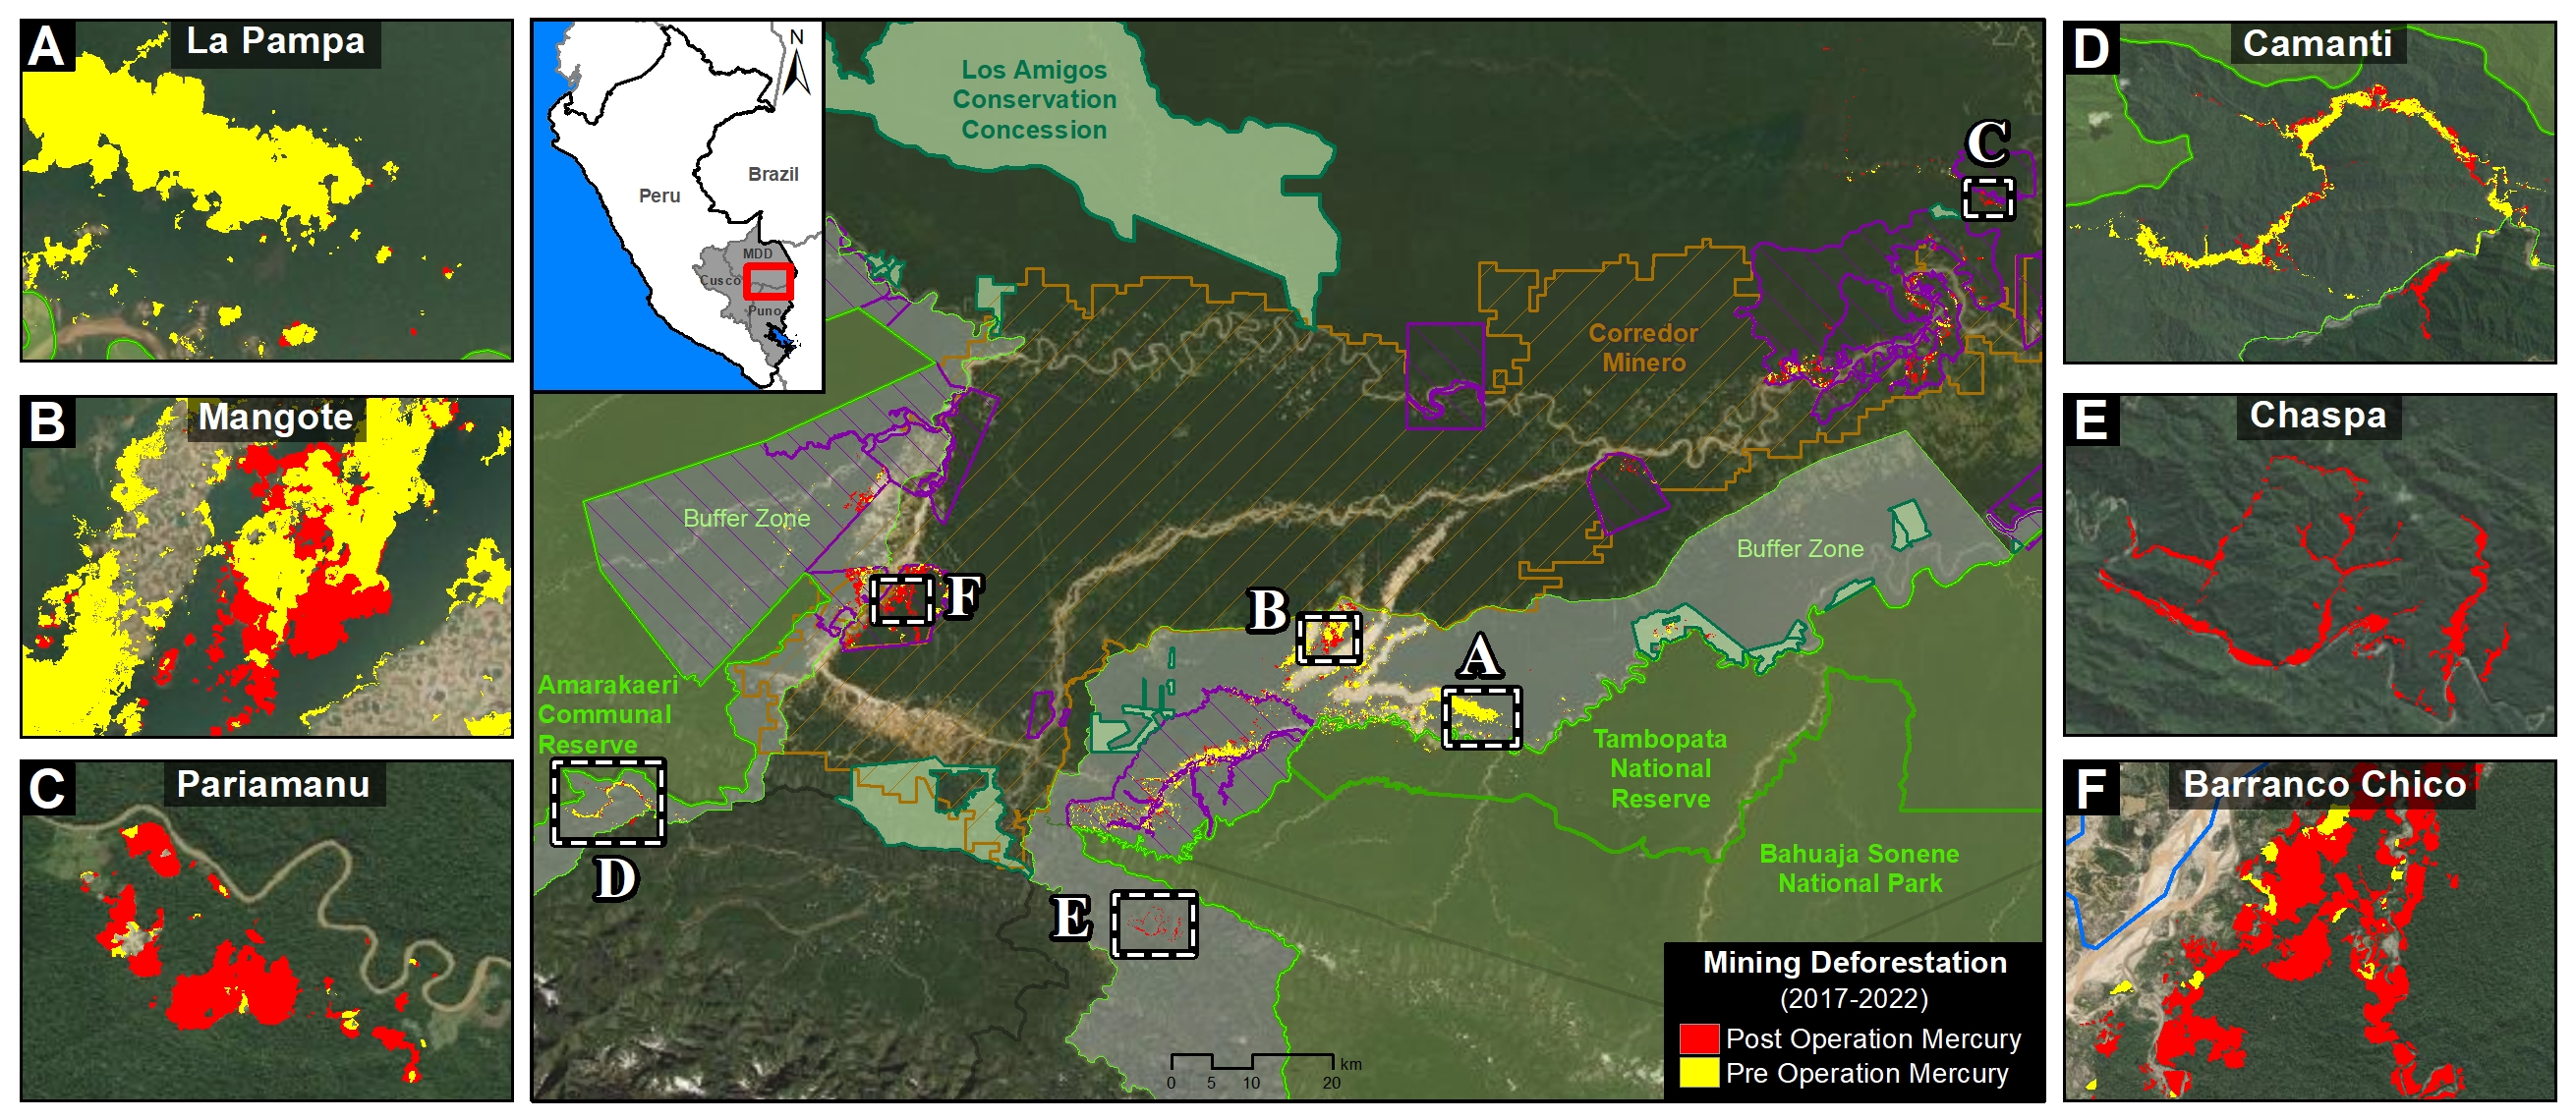
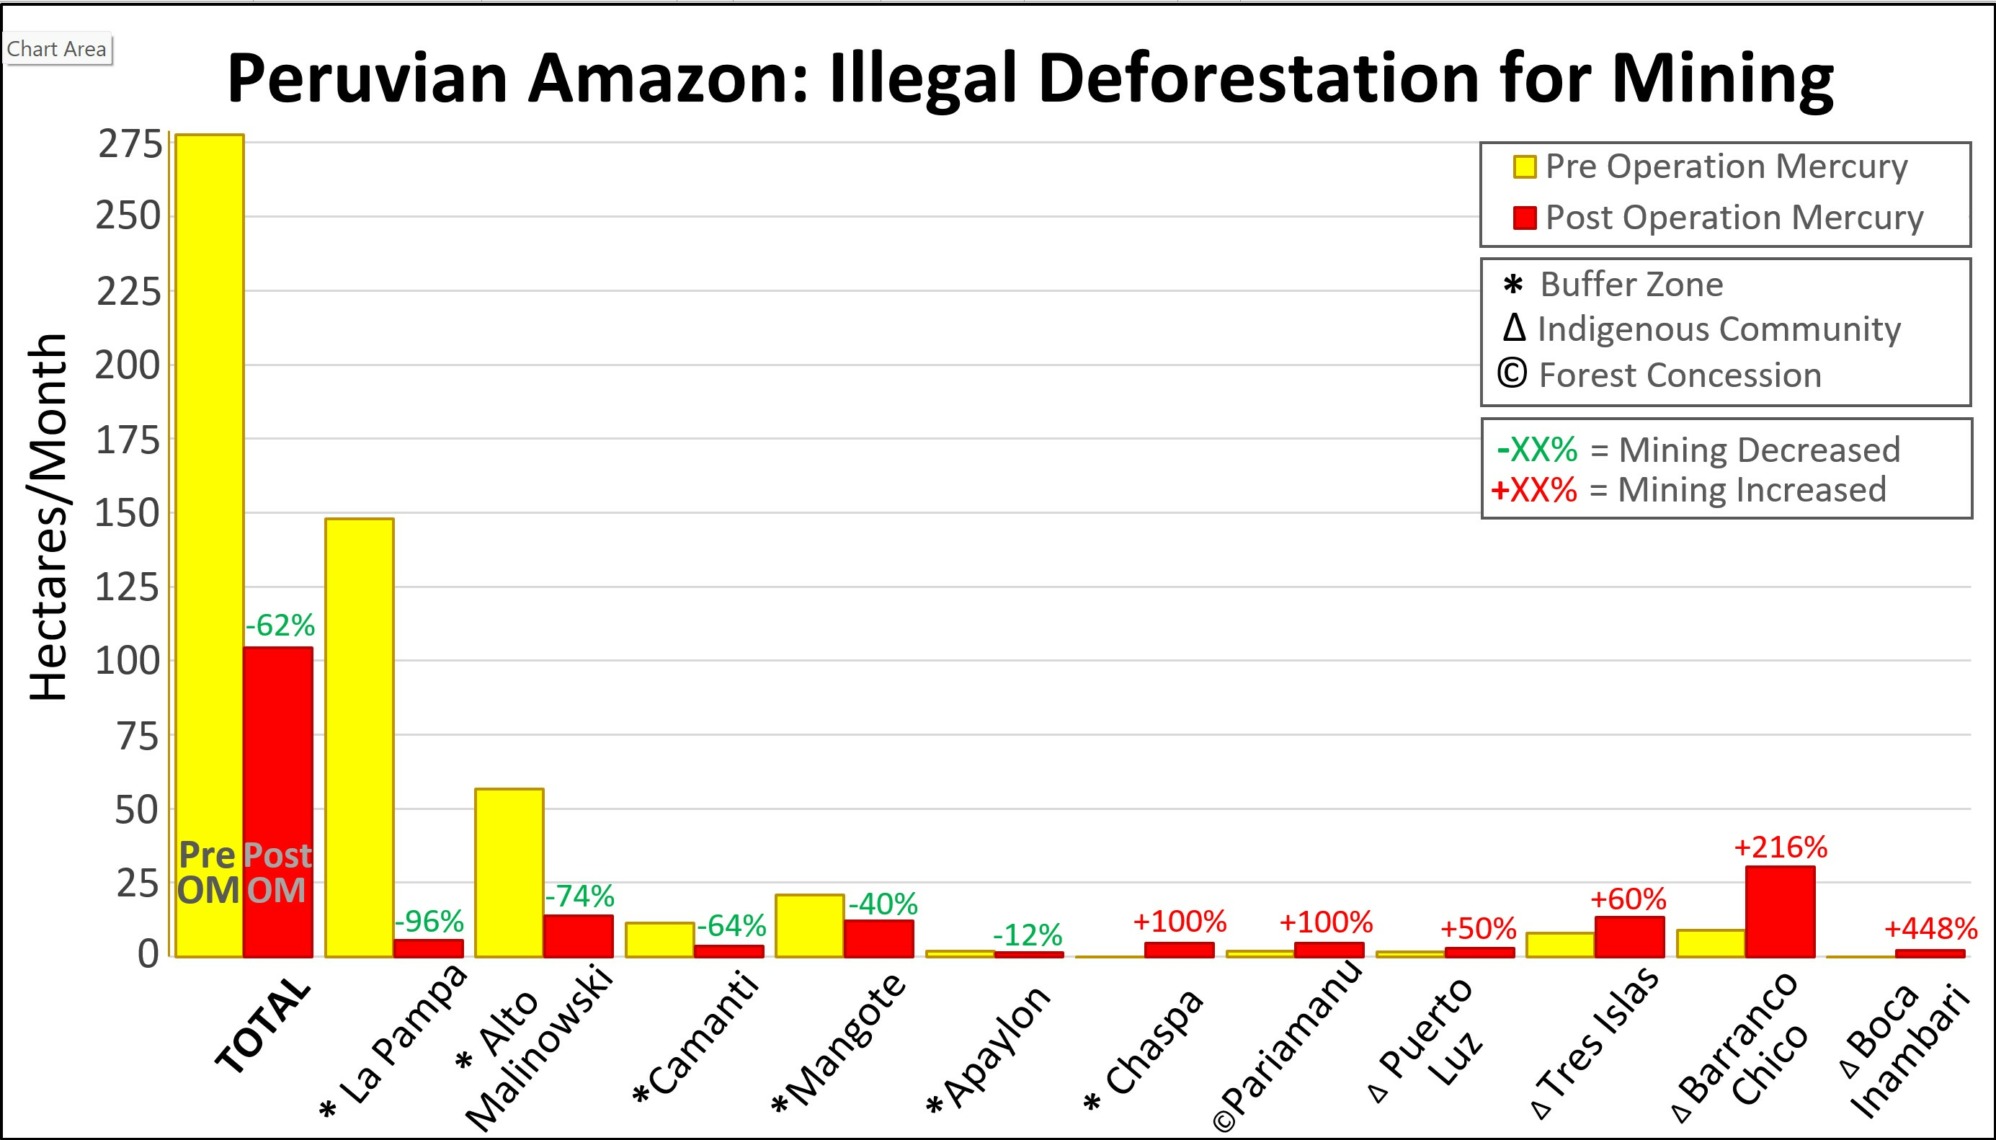
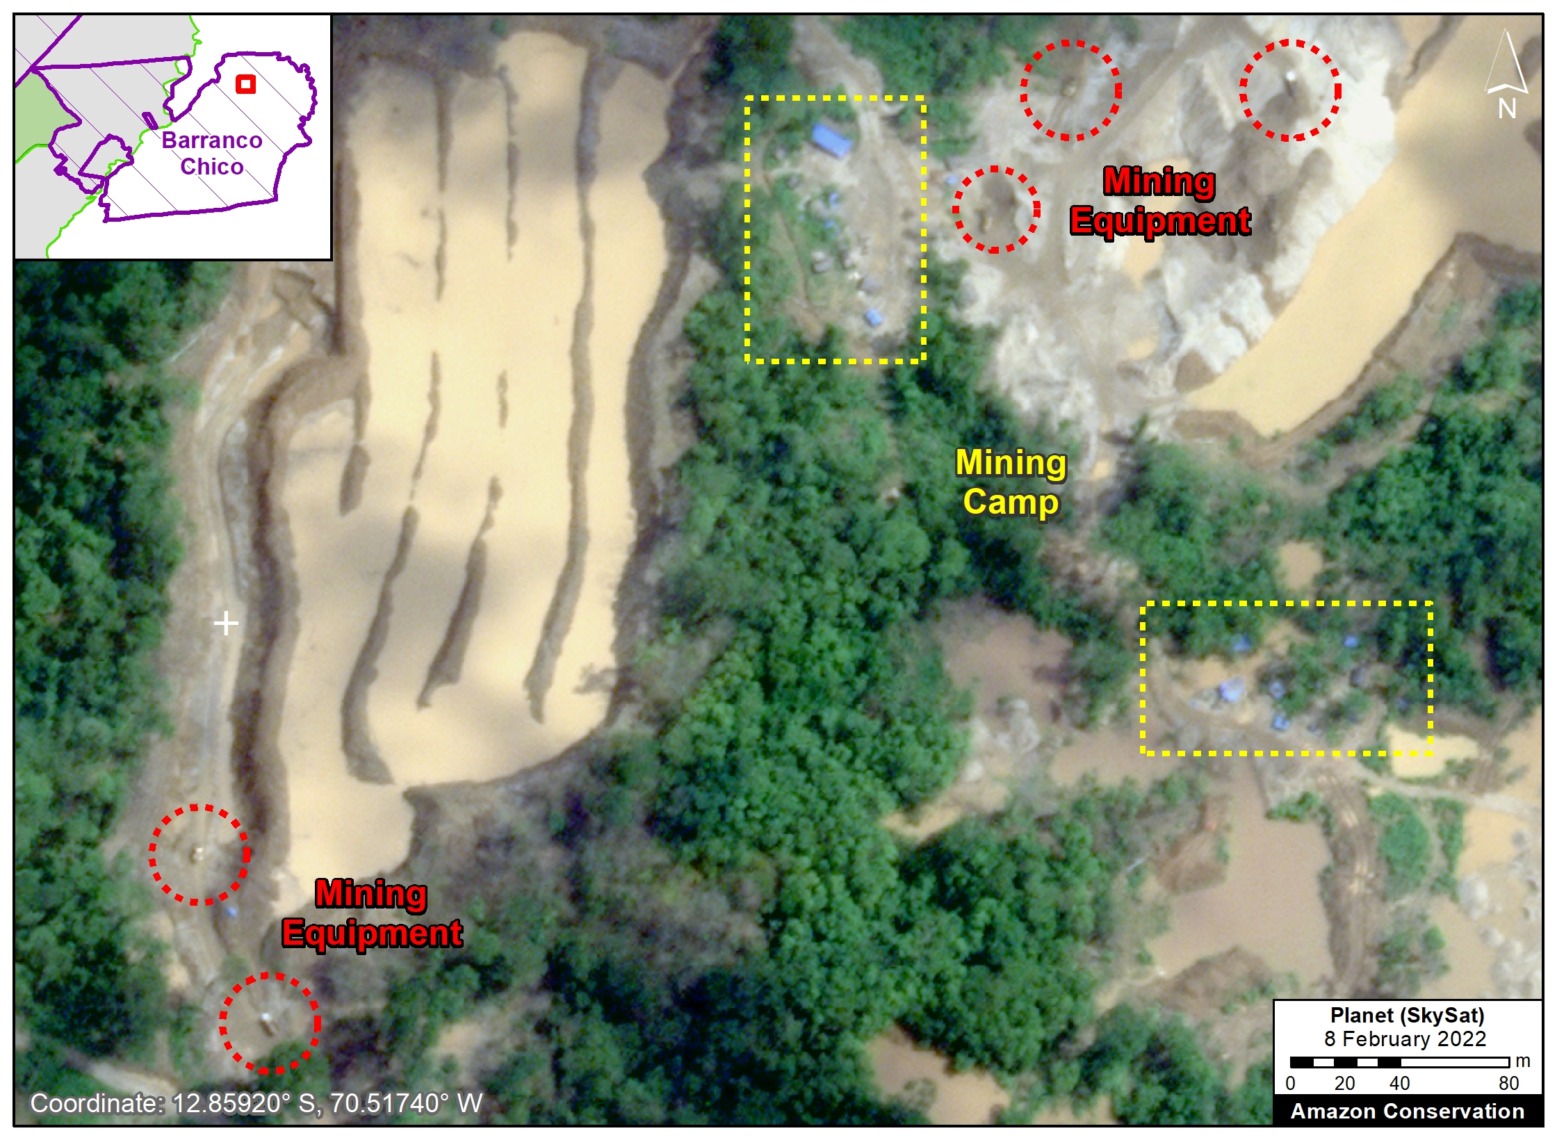
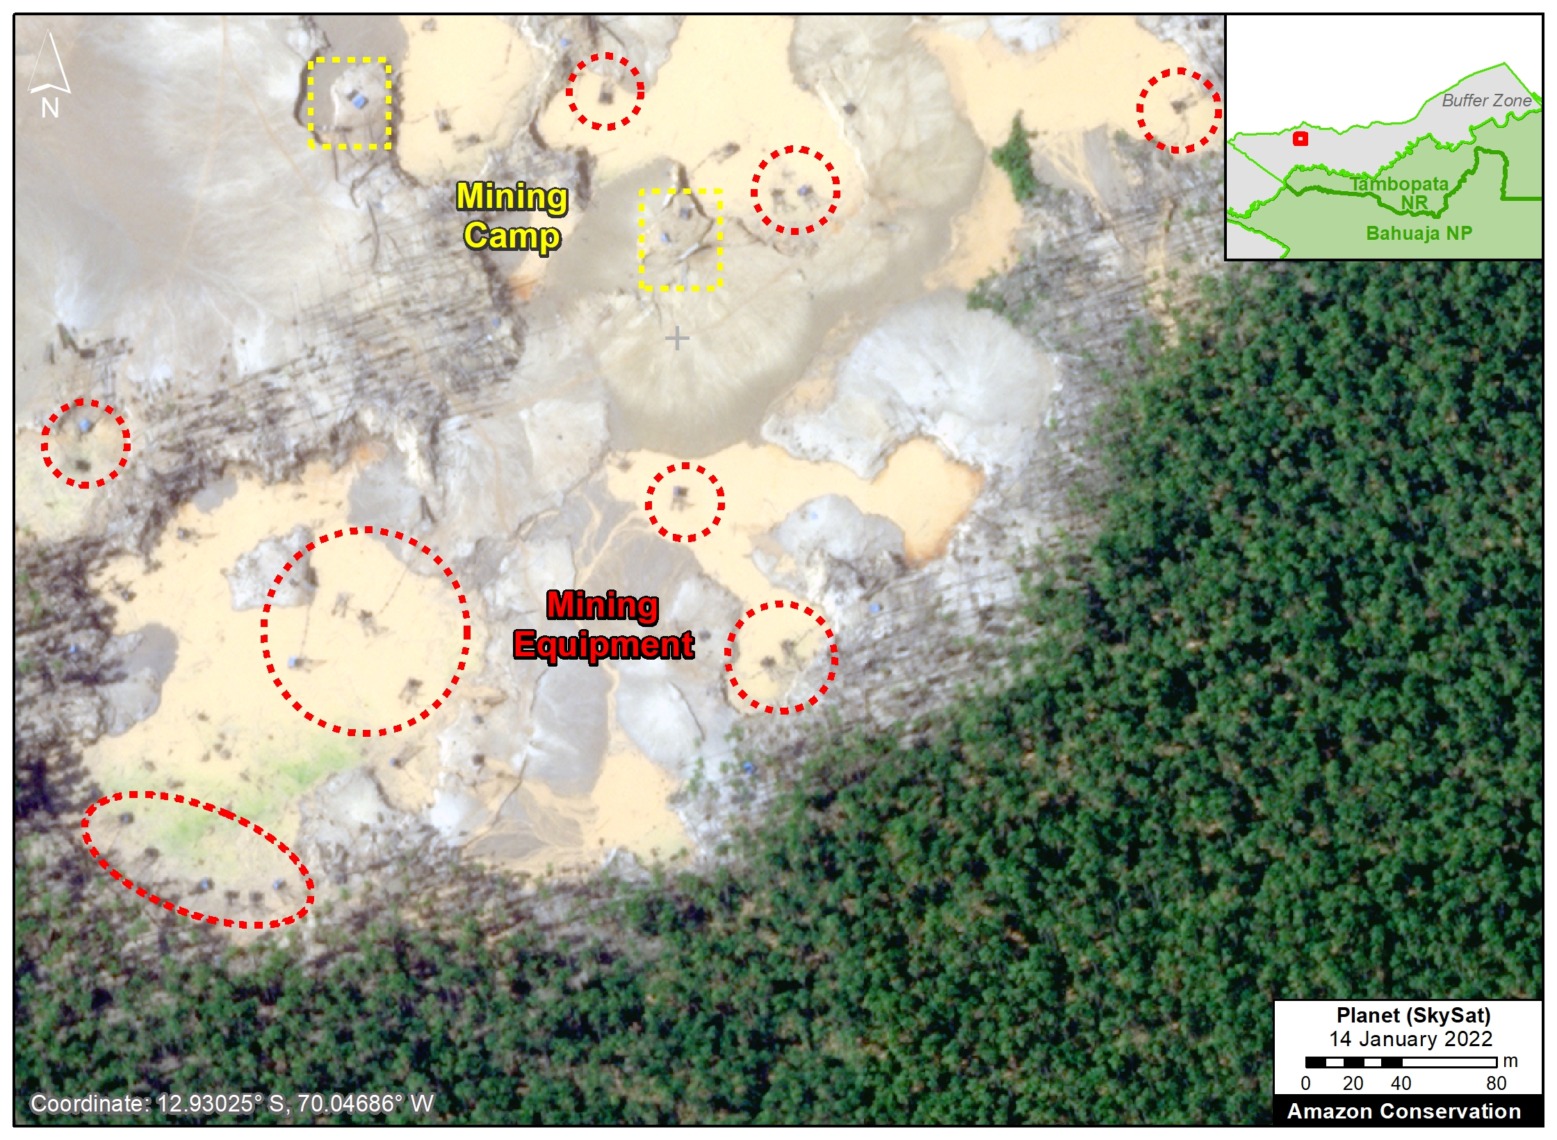
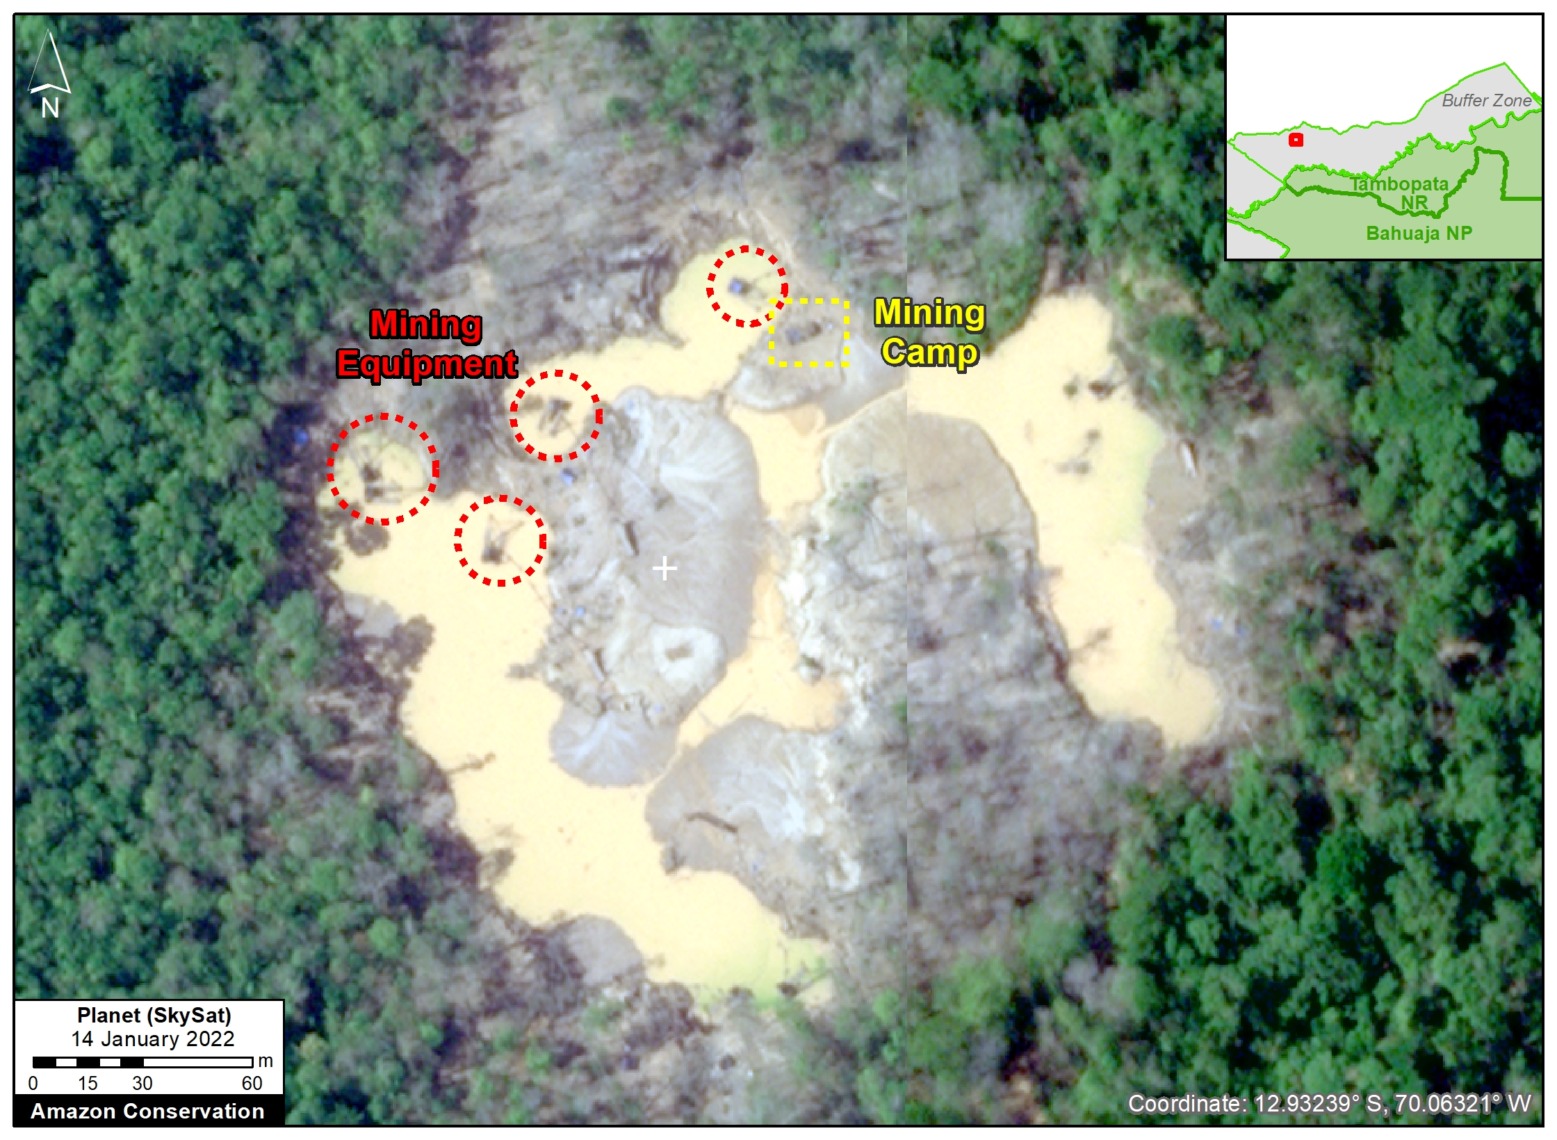
Illegal gold mining is a widespread problem in the southern Peruvian Amazon (Madre de Dios region), where it has caused river contamination and the deforestation of more than 100,000 hectares.
This activity has also emerged in the northern Peruvian Amazon (Loreto region), where it is not yet causing deforestation and the main threat is the contamination of rivers and important water resources.
This type of gold mining activity in water bodies (such as rivers) is illegal in Peru (see the “Legal situation” section below).
Identifying this type of mining (that is, in rivers and not causing deforestation) is difficult because the small mining boats (known as dragas) are mobile and imperceptible to medium and high-resolution satellites.
In this report, we test a novel technique based on tasking very high-resolution specialized satellites (in this case, Skysat with a spatial resolution of 0.5 meters) to detect illegal gold mining in the rivers of Loreto.
Below, we demonstrate how we used Skysat to detect illegal mining boats in the Nanay and Pintuyacu rivers, the main sources of drinking water for the city of Iquitos (capital of Loreto).
It is important to emphasize that this new technique has great potential for public institutions (national and regional levels) and local actors to detect and respond to illegal activity in real-time with appropriate measures (see the “Conclusion” section below).
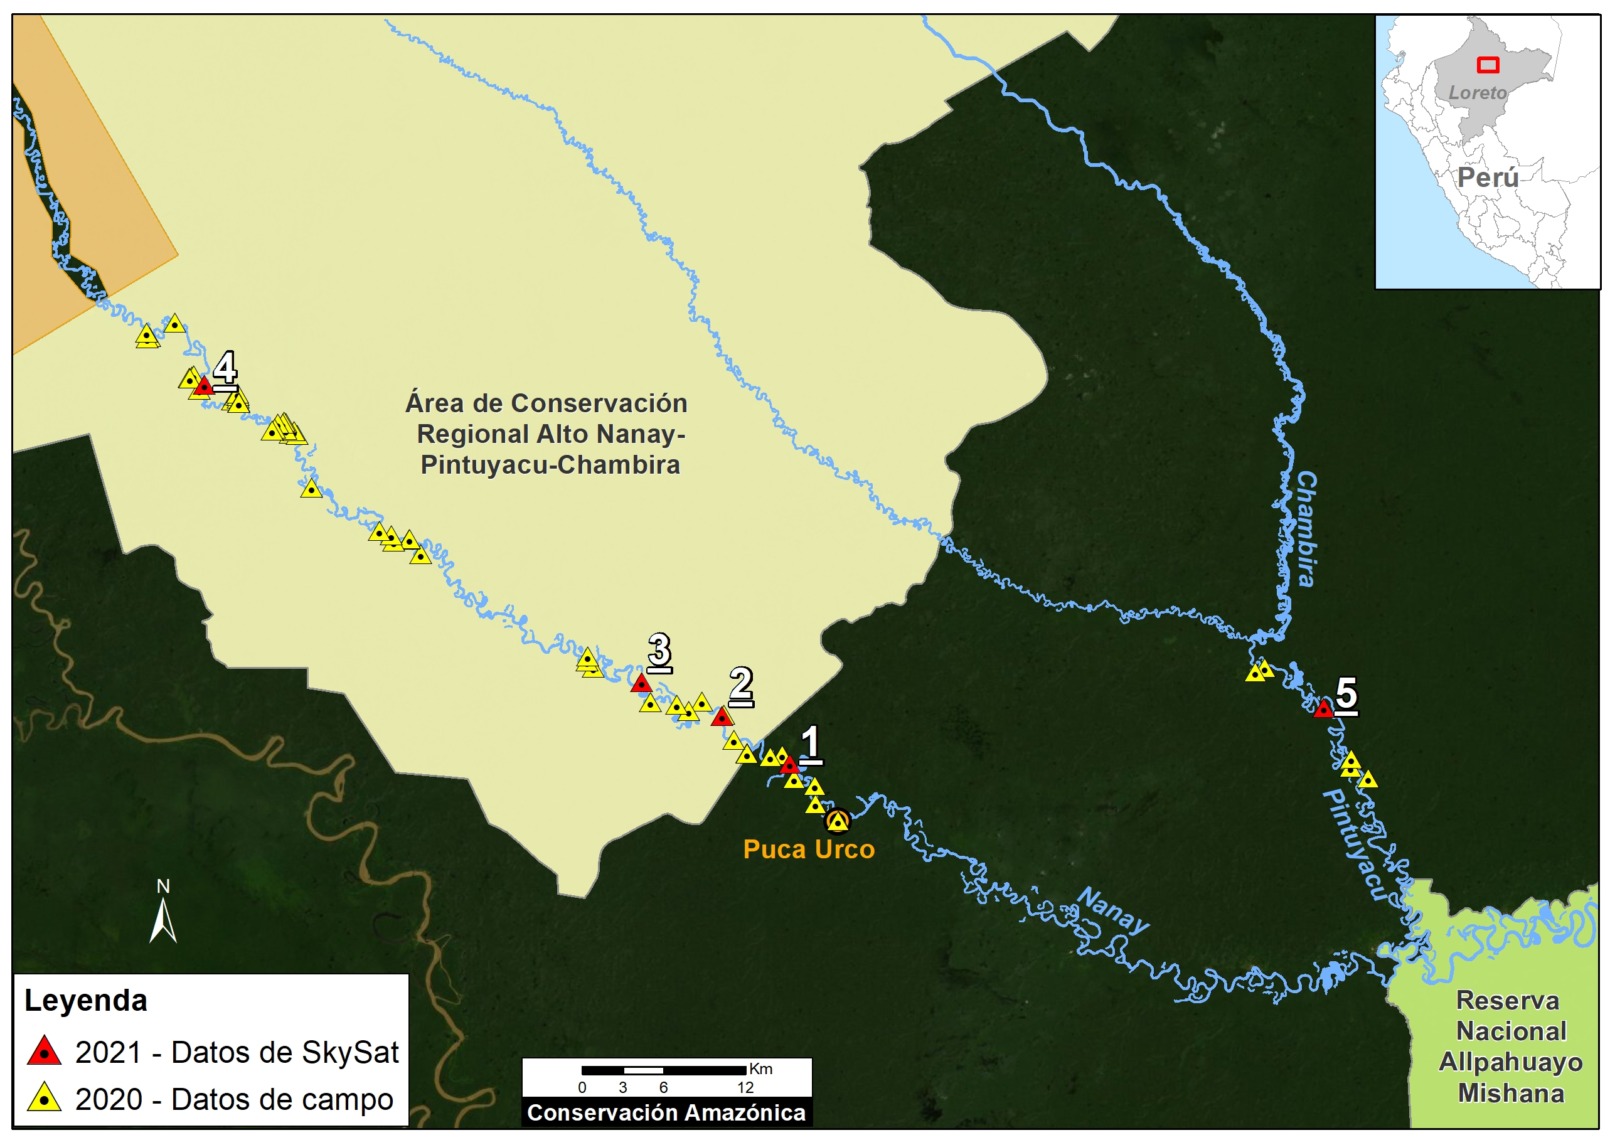
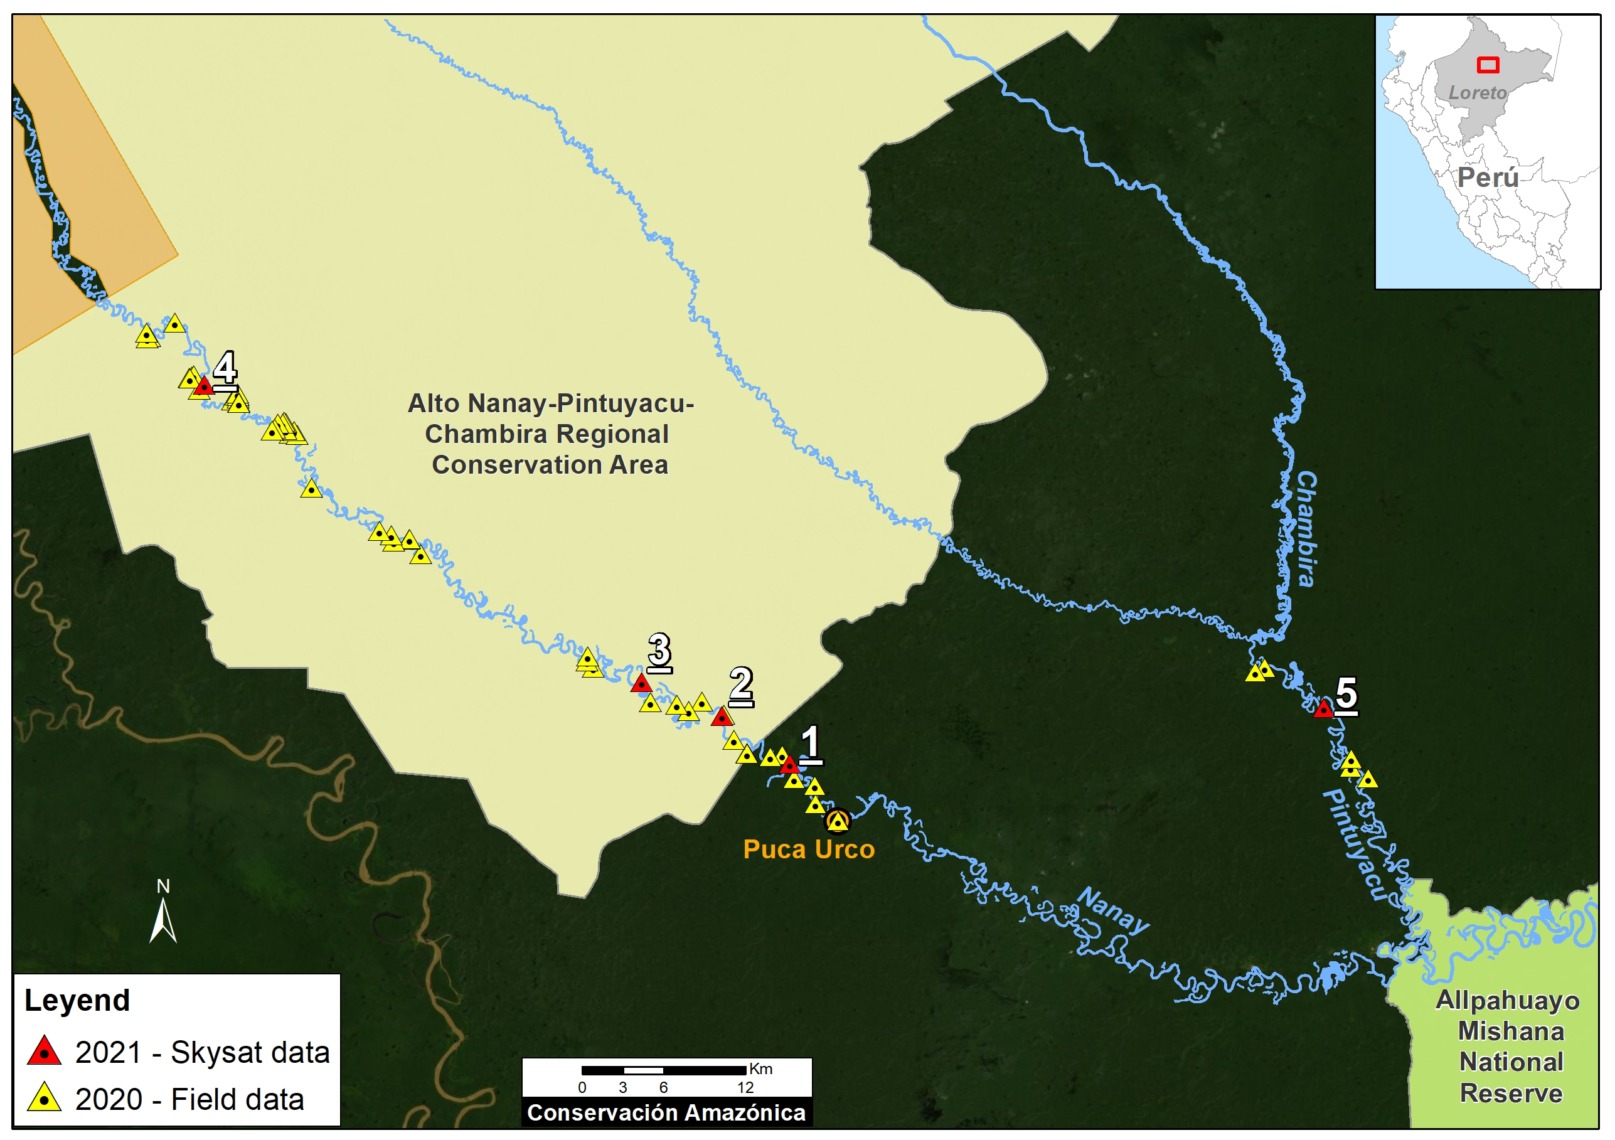
Base Map: Mining in Nanay and Pintuyacu Rivers (Loreto region)
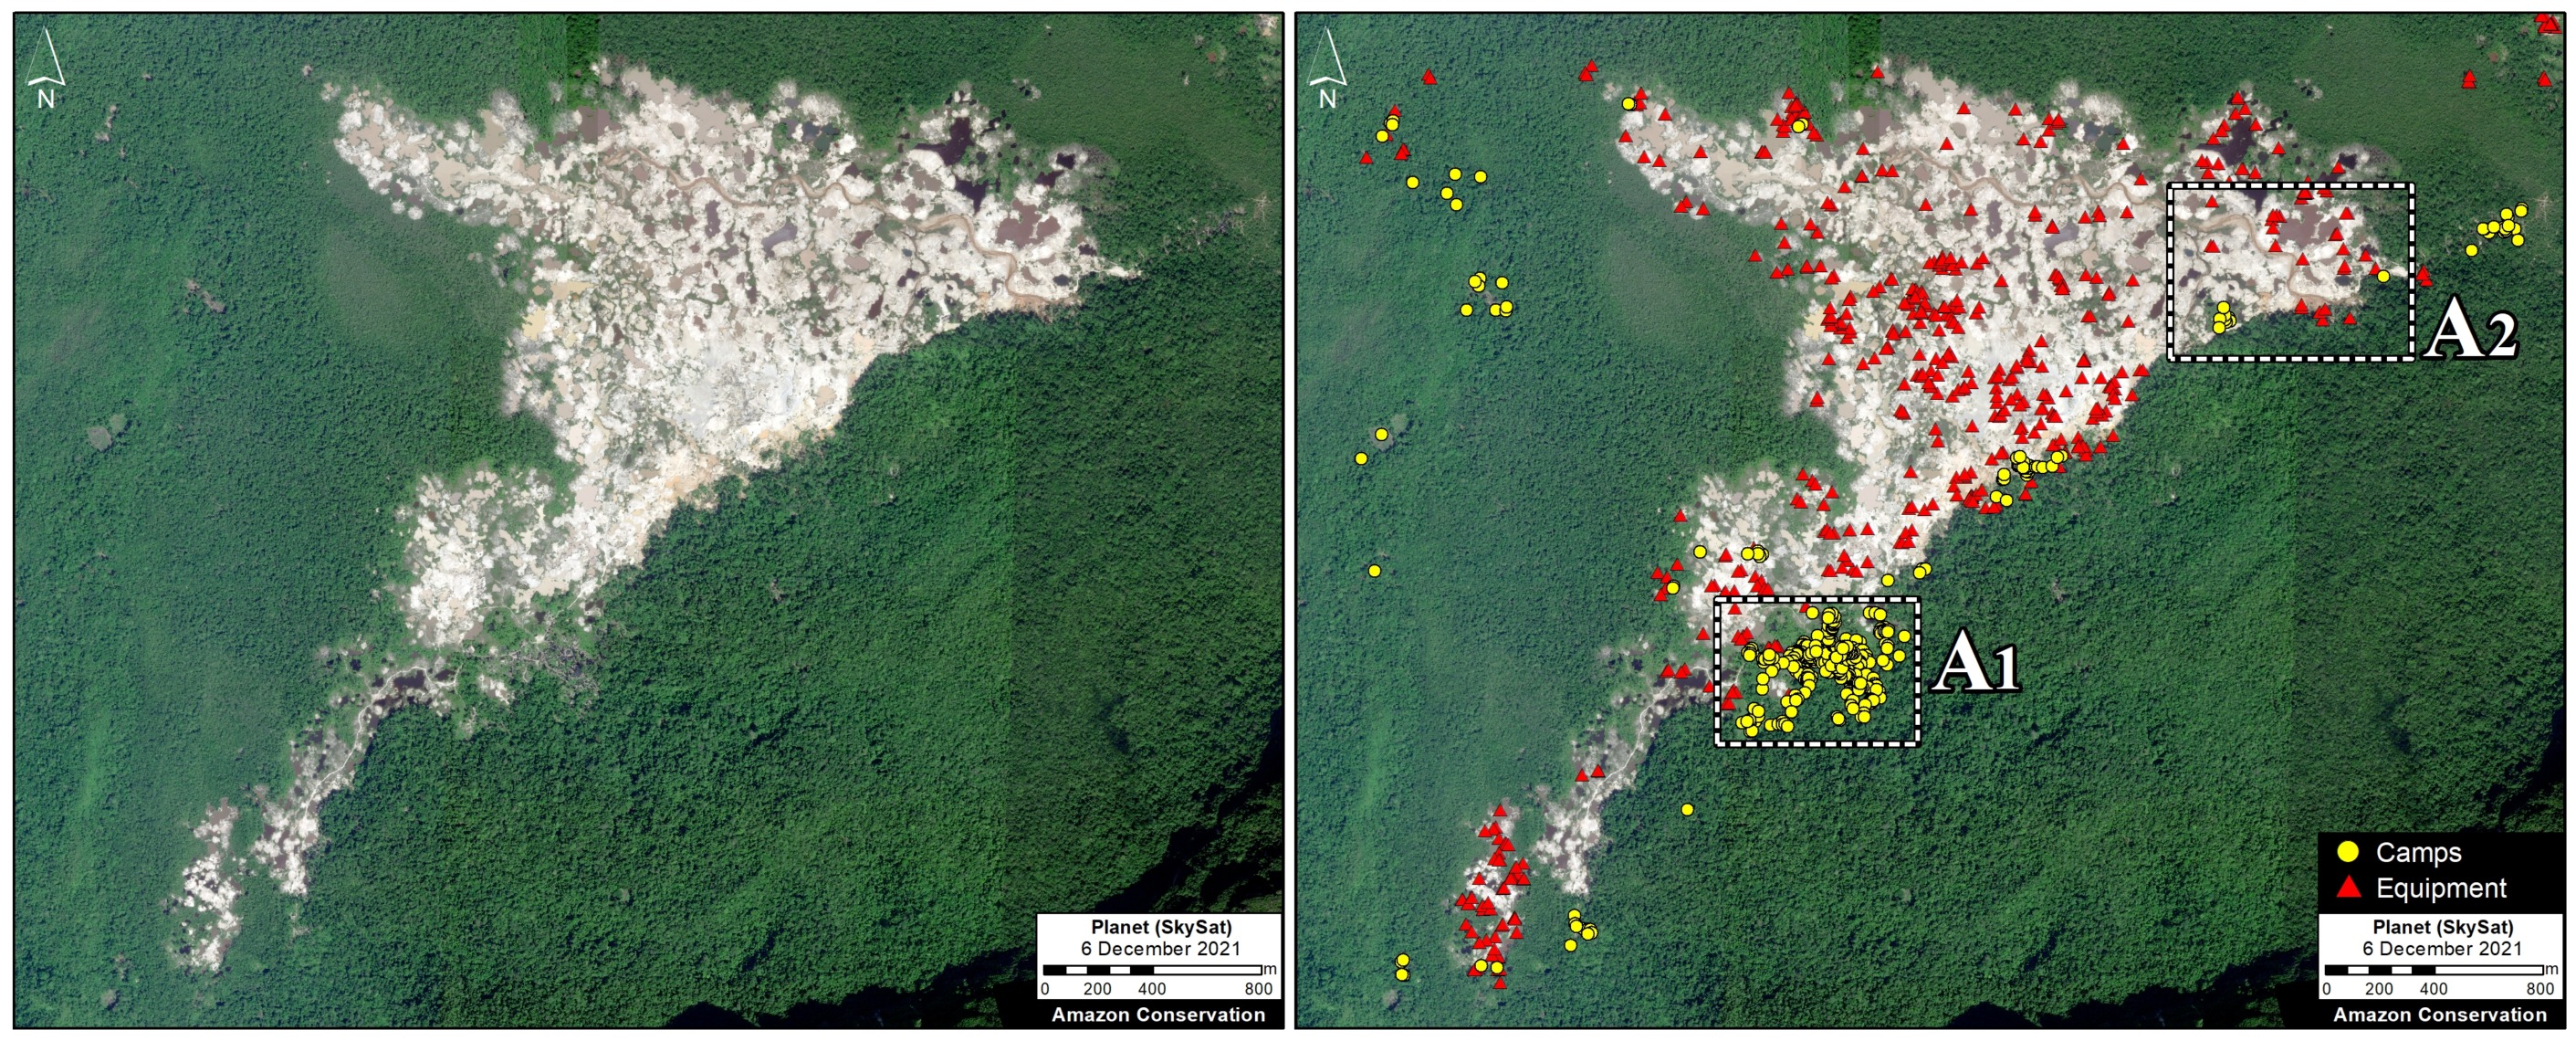
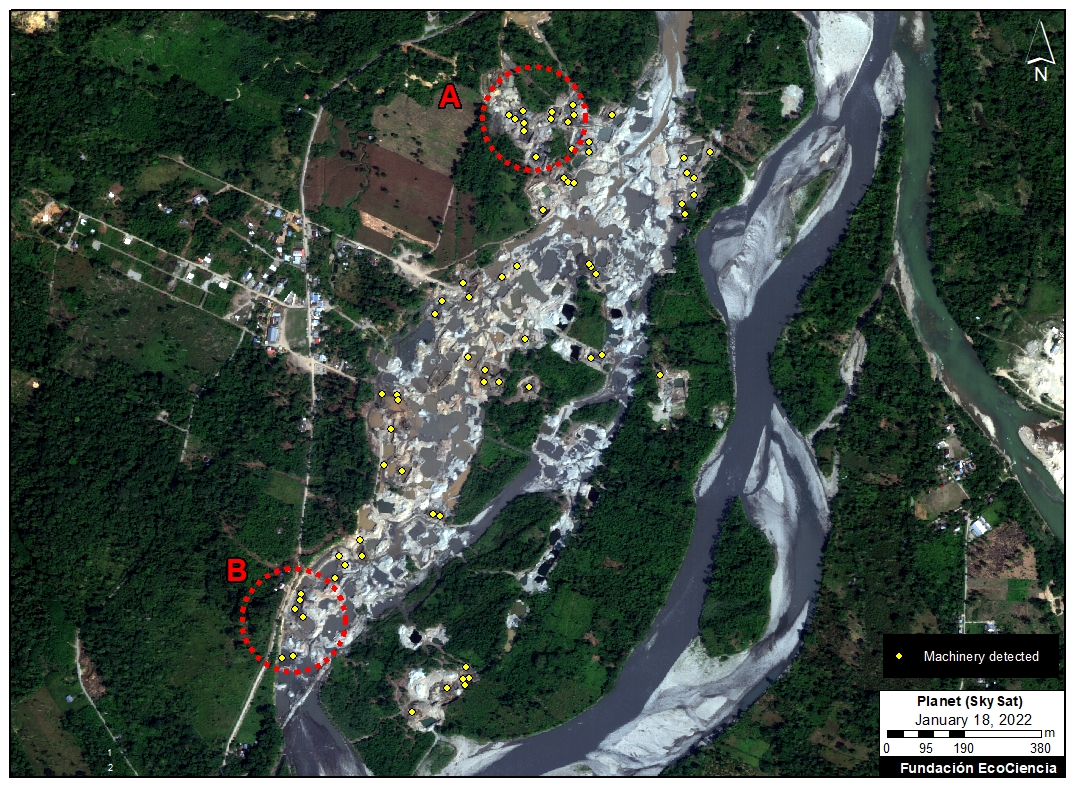
The Base Map below shows the precise points where illegal gold mining activity was found during 2020 and 2021 in the Nanay and Pintuyacu rivers of the Loreto region. For context, the map also includes the two nearby protected areas (one national, Allpahuayo Mishana, and another regional, Alto Nanay-Pintuyacu-Chambira). All the identified mining activity is illegal because there are no mining concessions in the area, in addition to the fact that it is occurring in bodies of water.
The yellow triangles indicate the illegal activity detected in 2020, based on field data or observations corroborated by specialists.
Based on this information, between March and May 2021, we tasked and analyzed very high-resolution satellite images (Skysat from the company Planet) for various strategic locations along both rivers. For images with possible mining activity, we consulted with field specialists for confirmation. The red triangles indicate the locations of illegal gold mining detected by Skysat and confirmed by the experts.
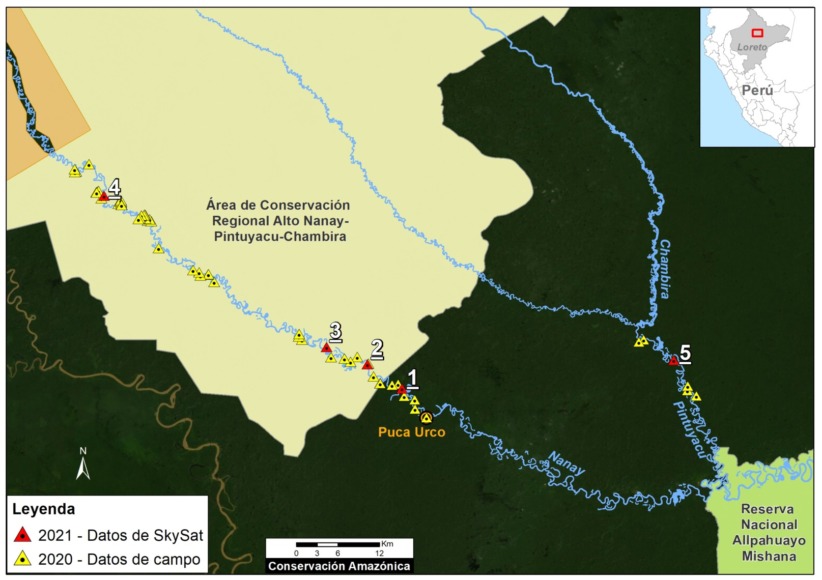
Base Map. Data: FEMA, MAAP, SERNANP.

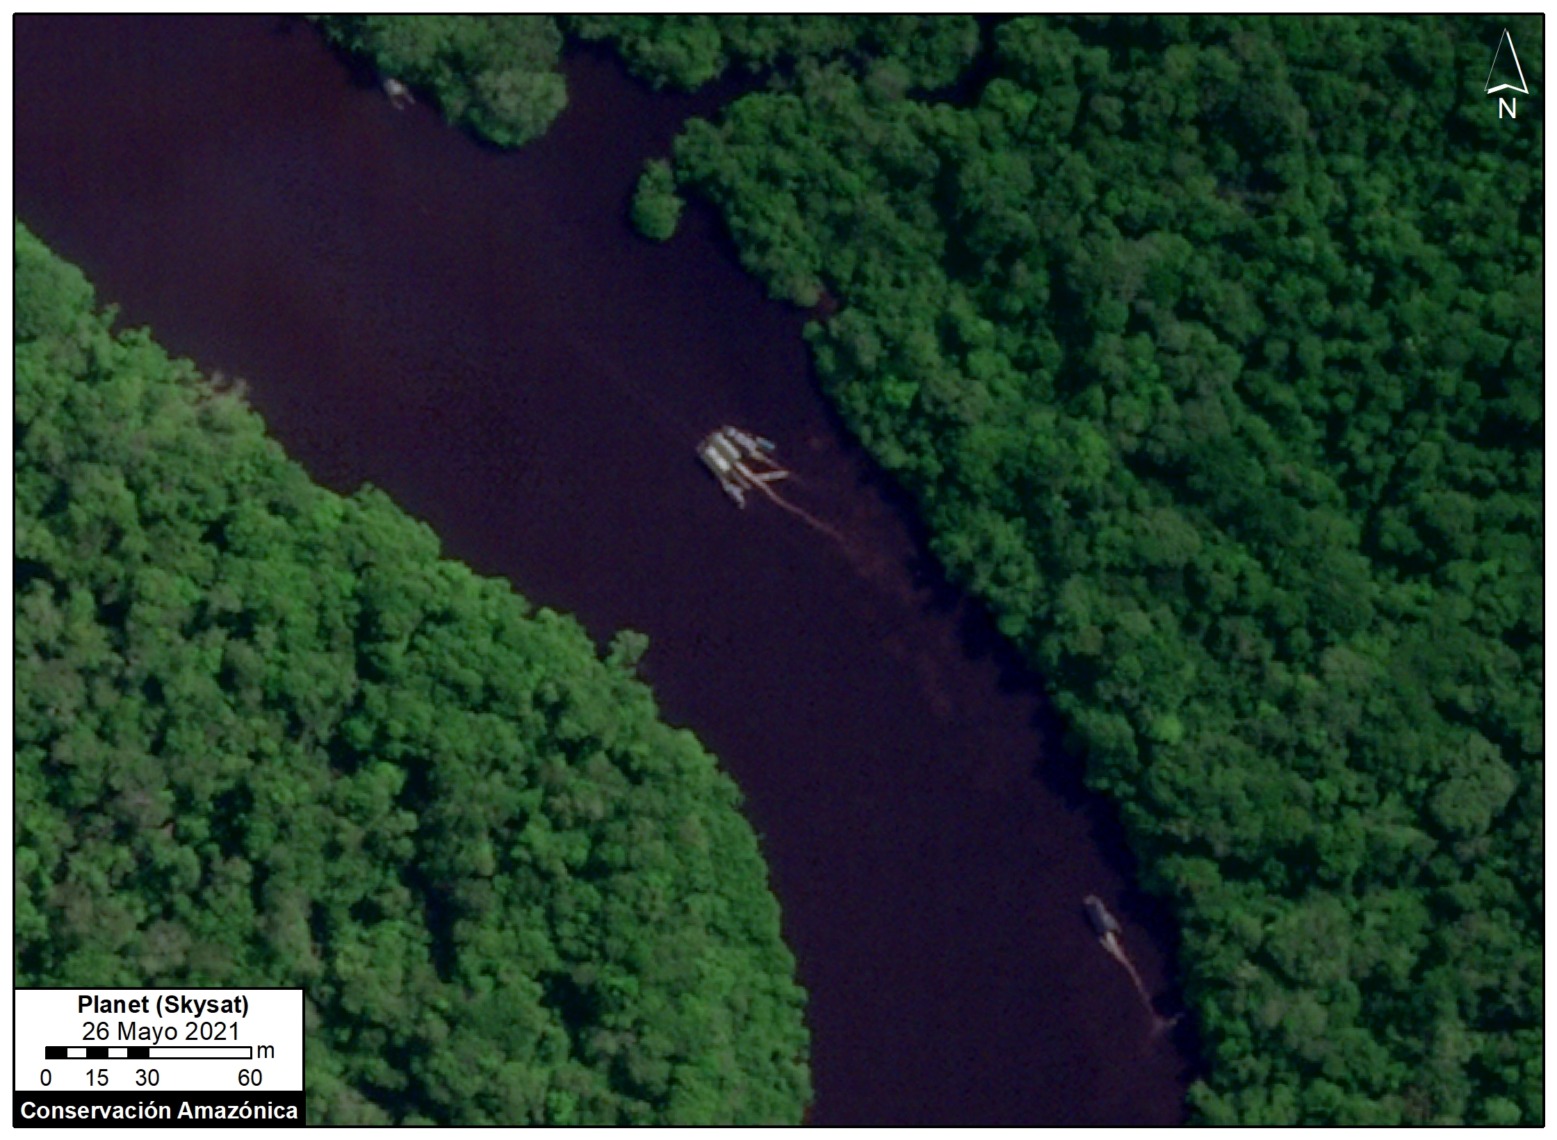
Very High-resolution Satellite Images (Skysat)
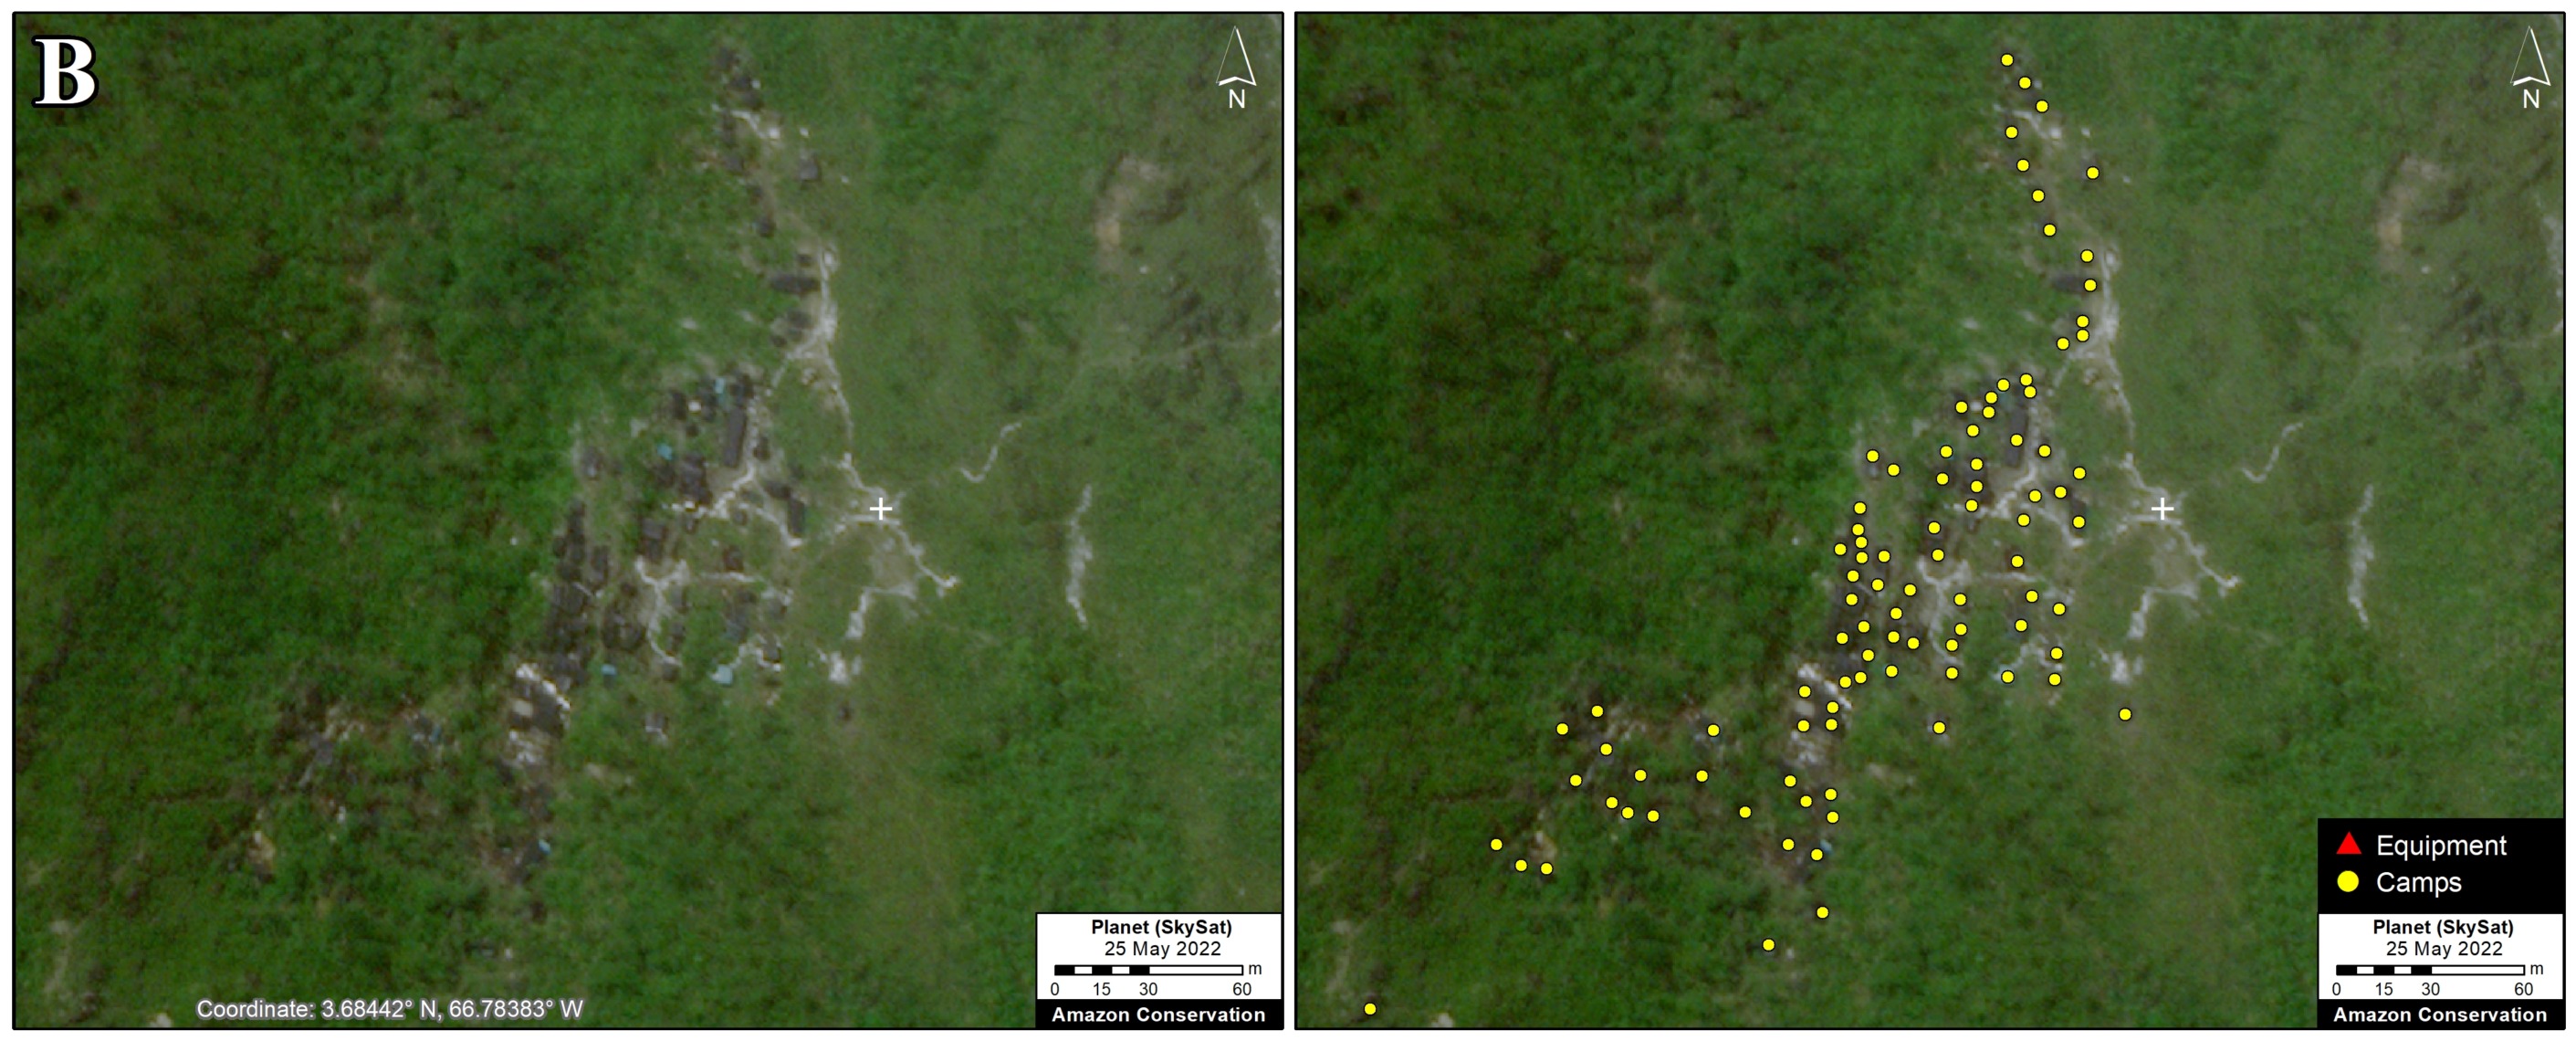
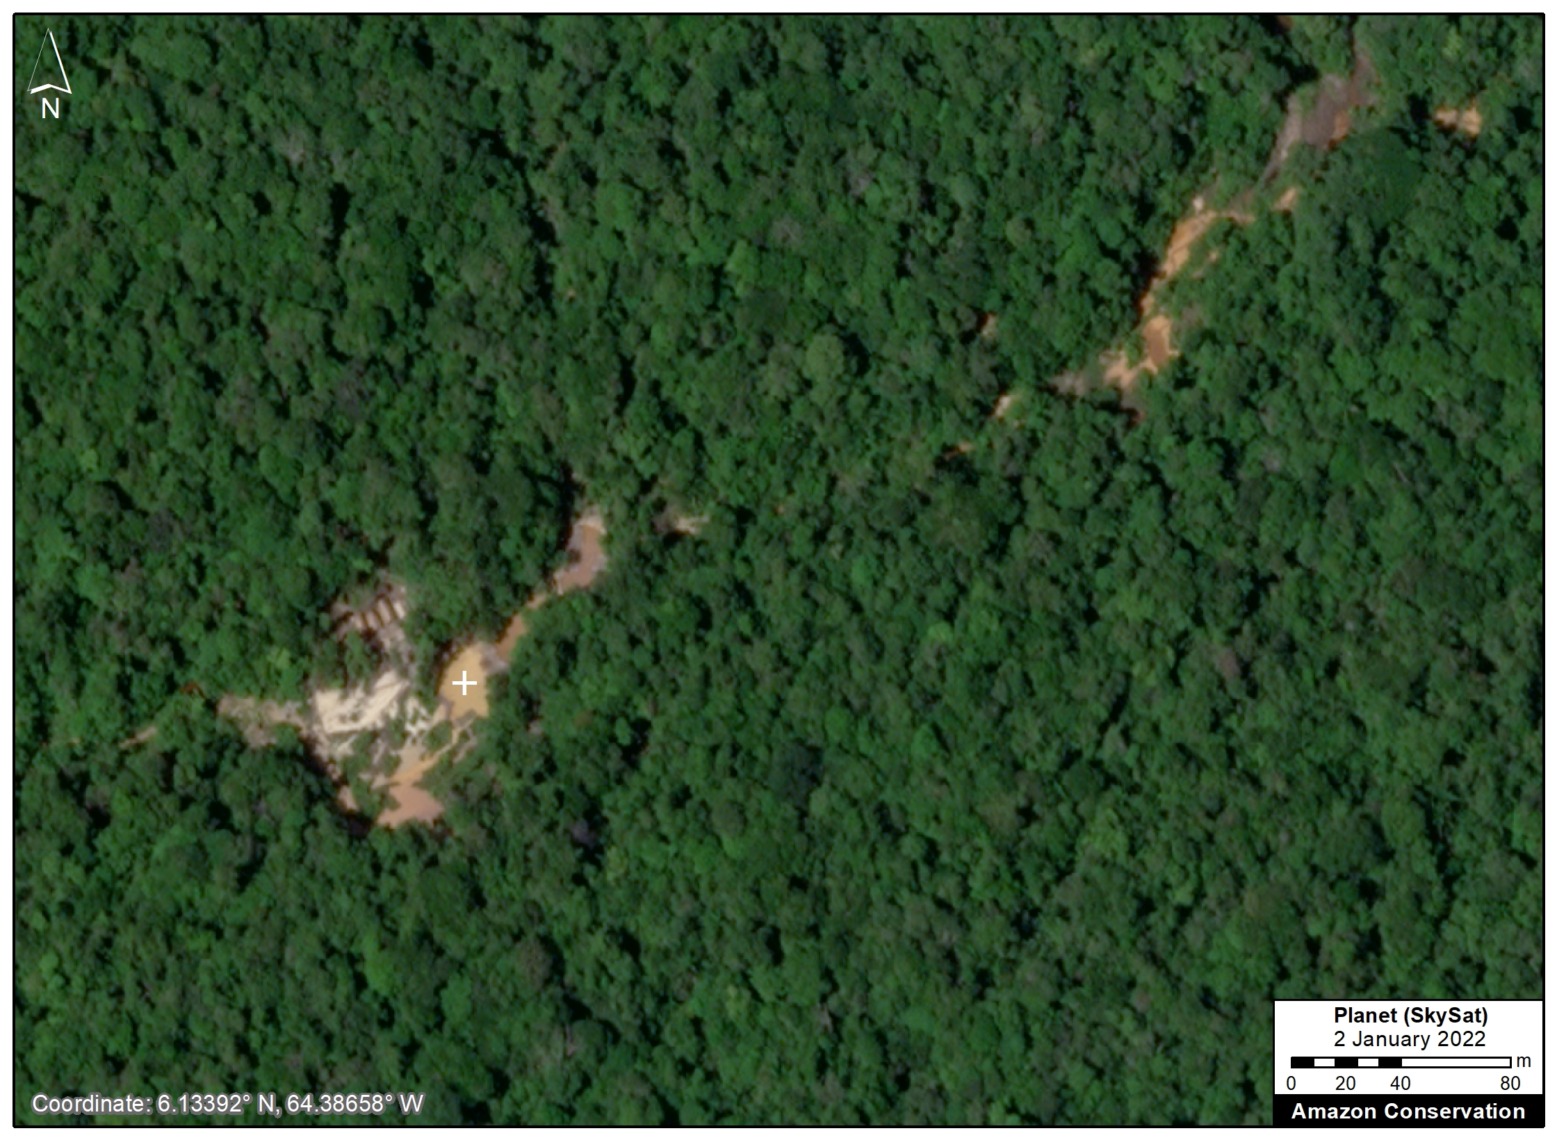
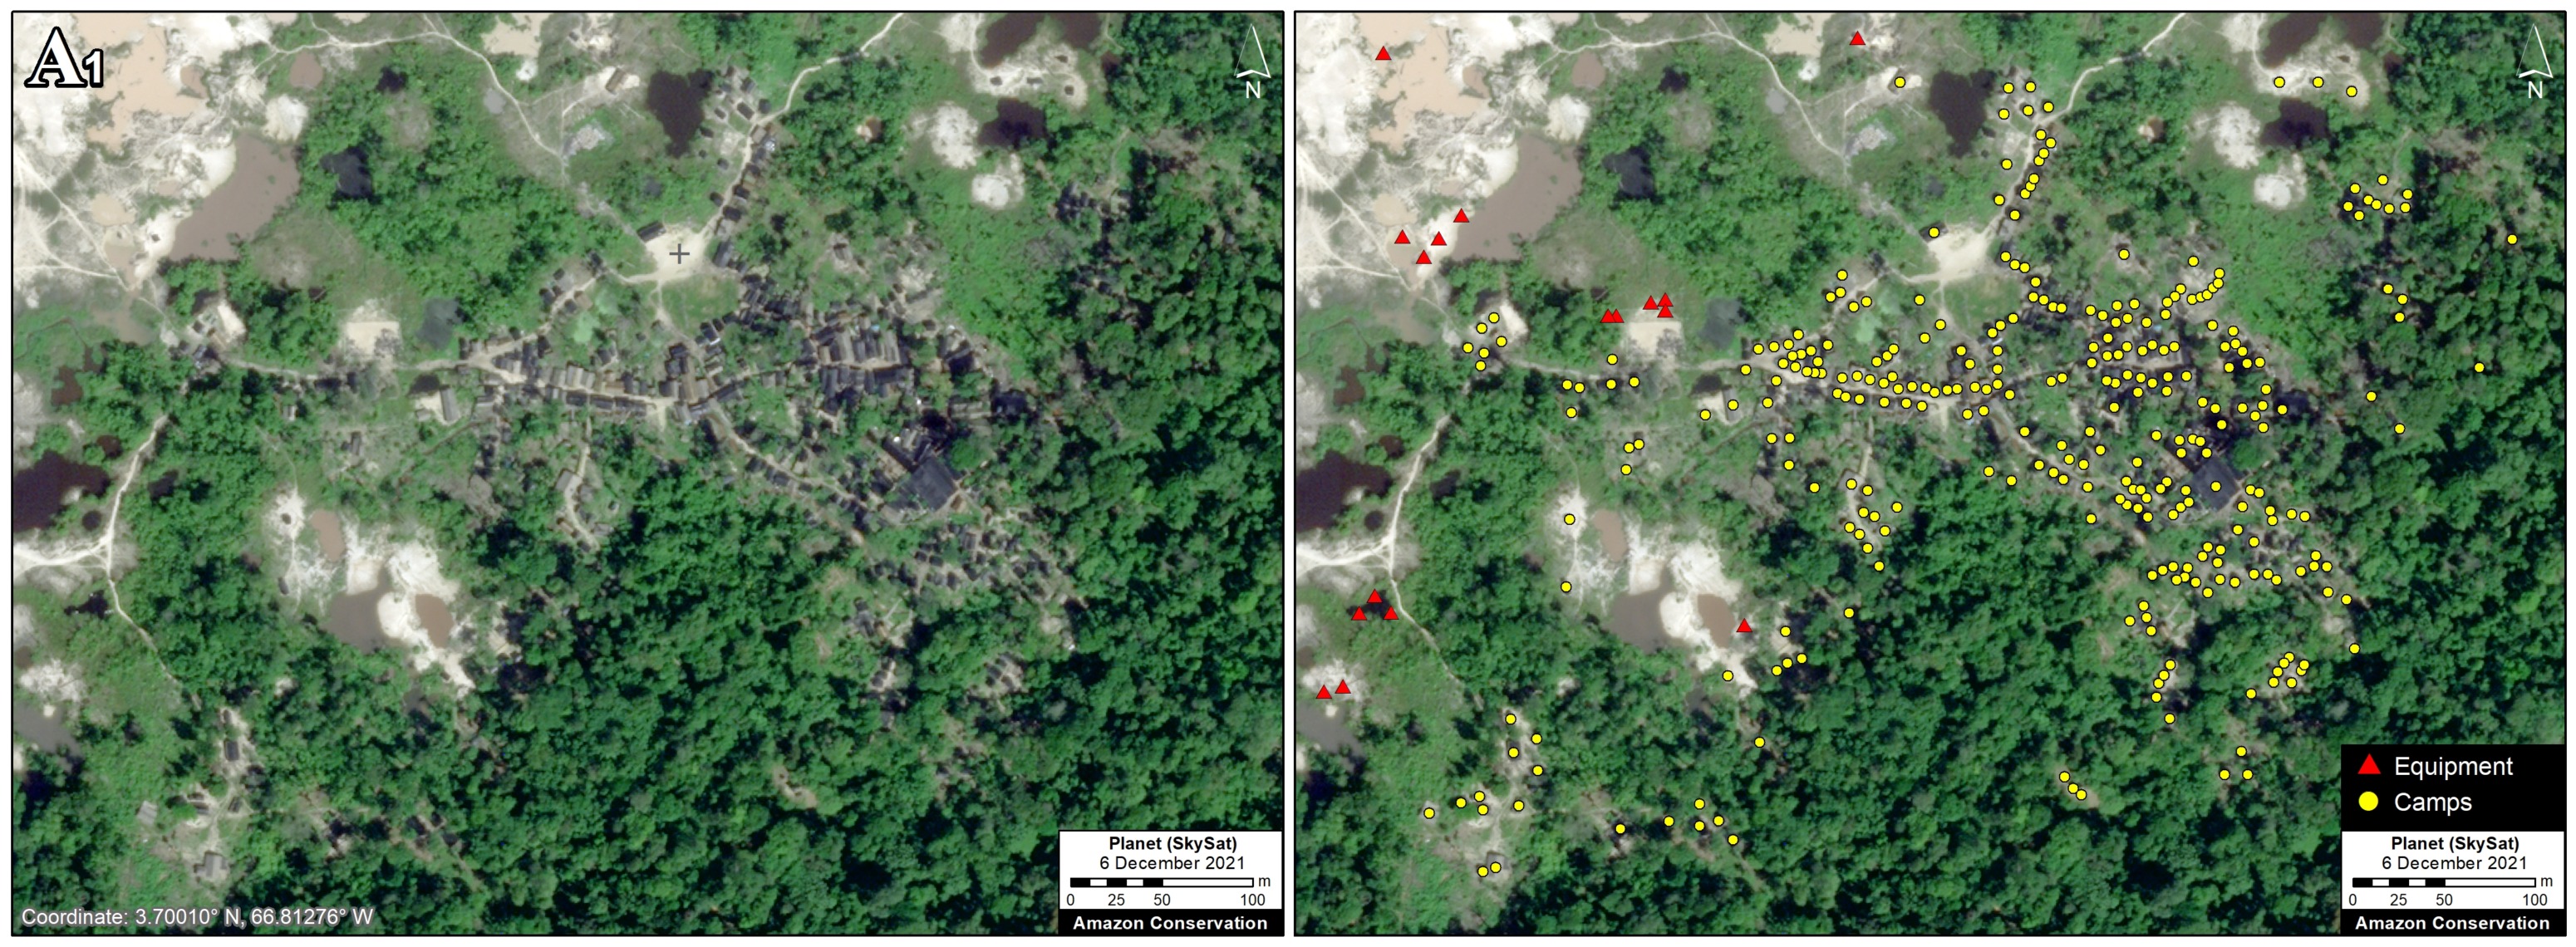
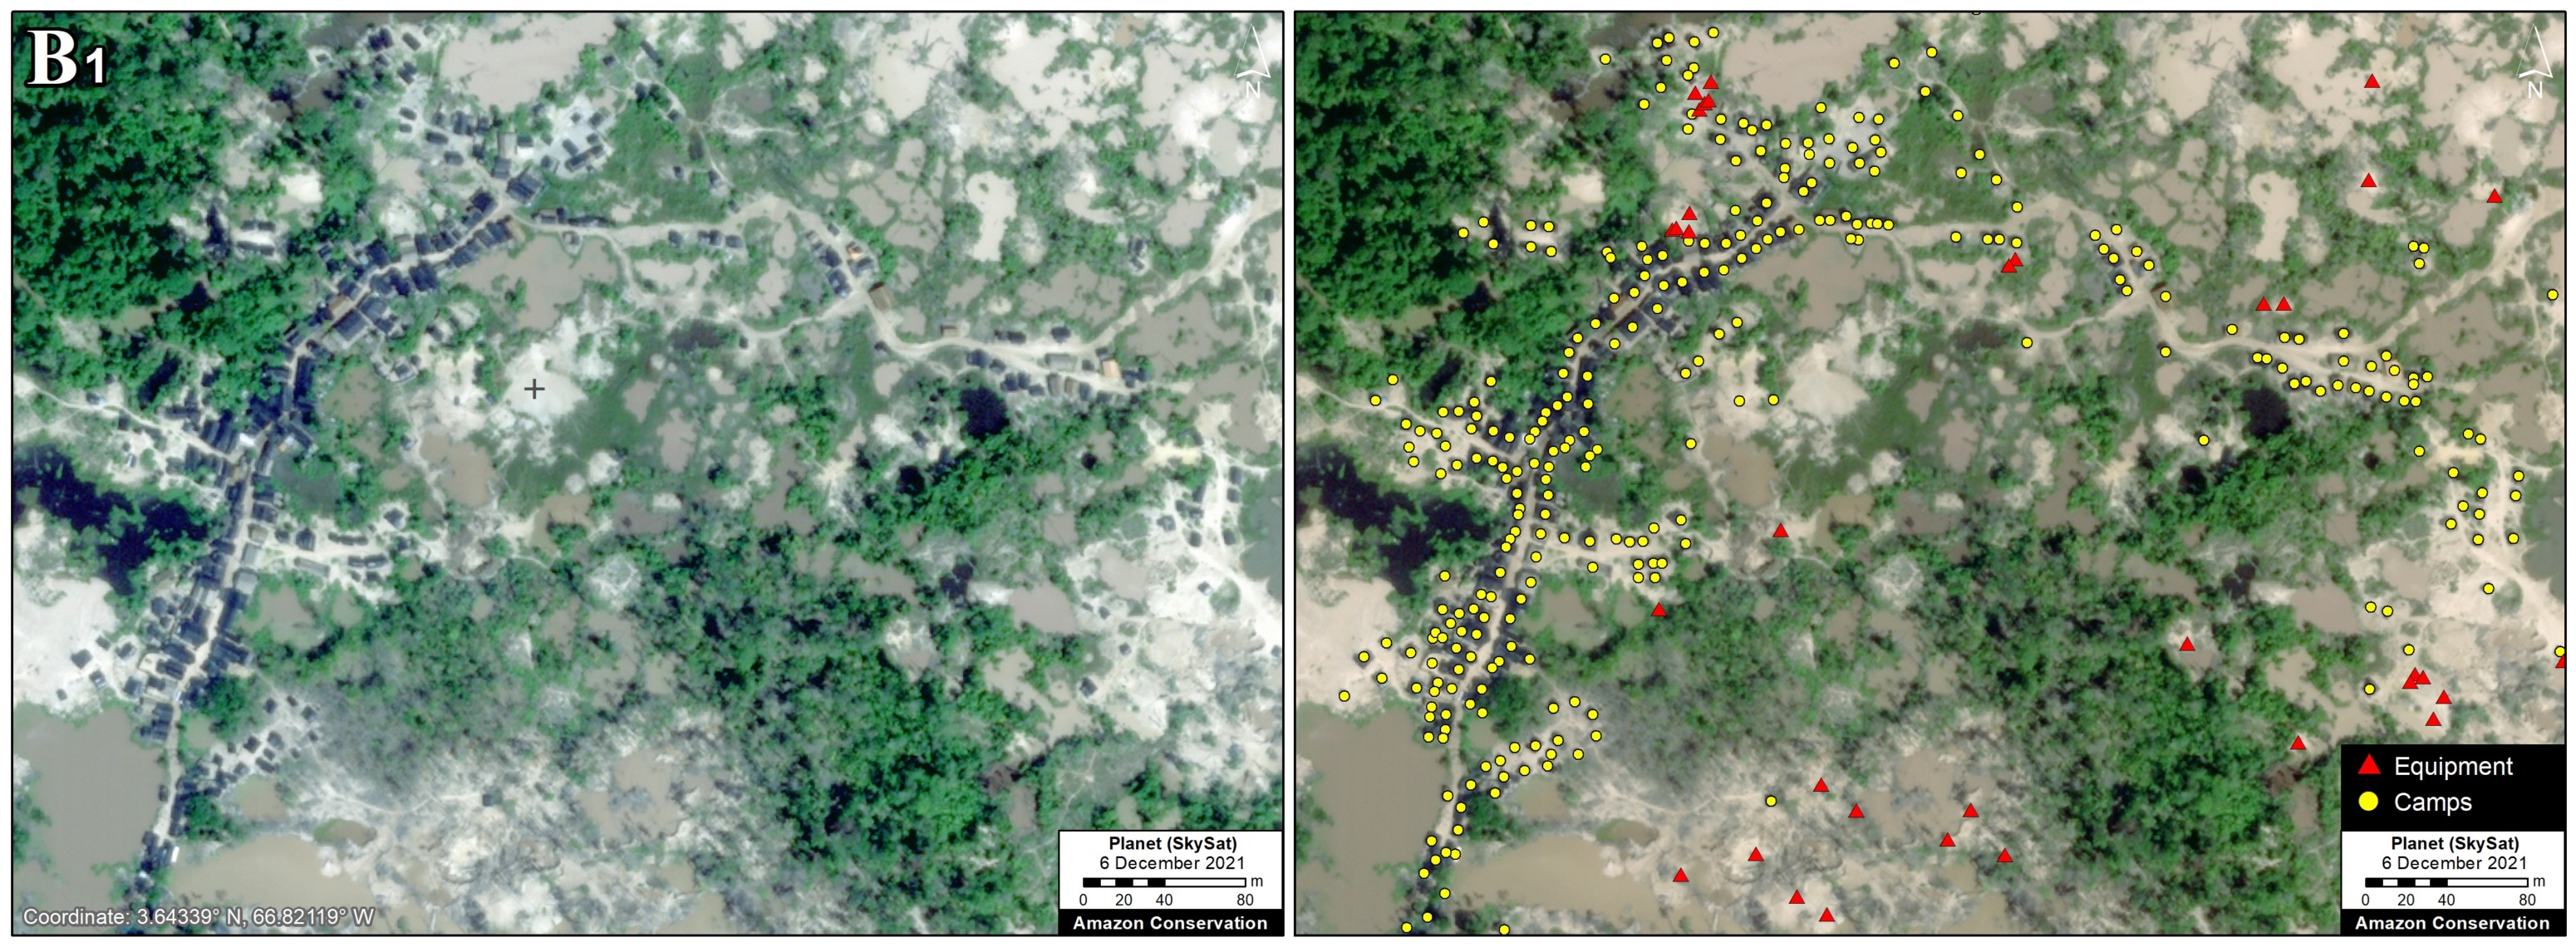
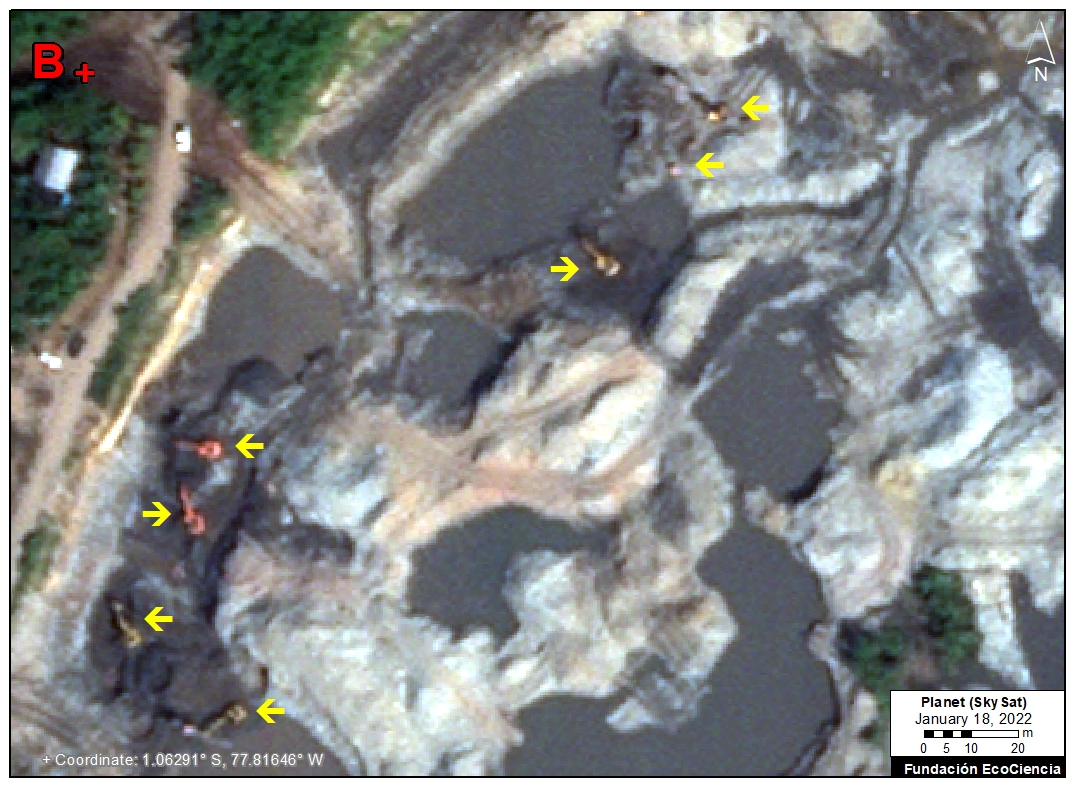
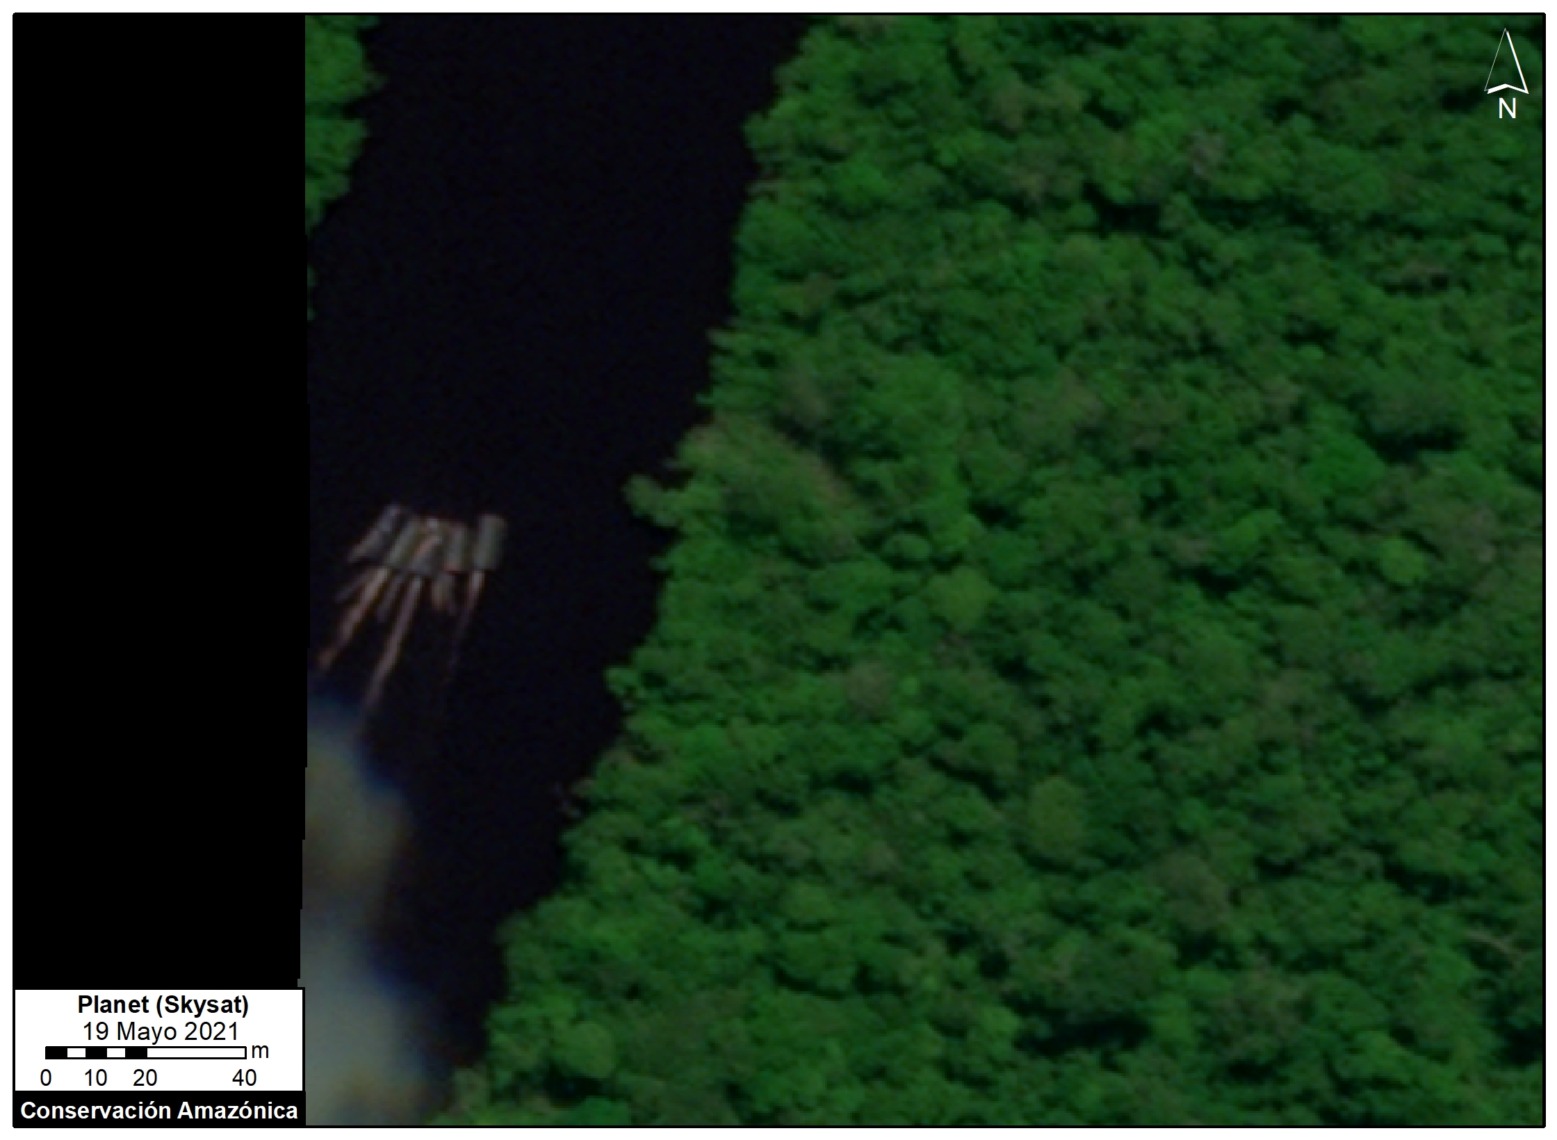
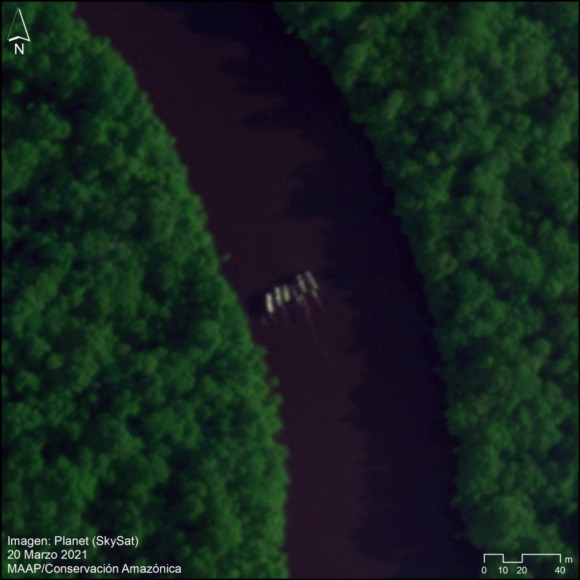
Next, we show a series of striking images of illegal gold mining detected by Skysat and confirmed by experts. Note that with the very high resolution (0.5 meters), one can actually visualize the detail of a small mining boat. Image 1 shows several mining boats together in the Nanay River (near the town of Puca Urco). There are previous examples from the field of mining boats lining up together during their illegal activity (see the “Annex” section below).
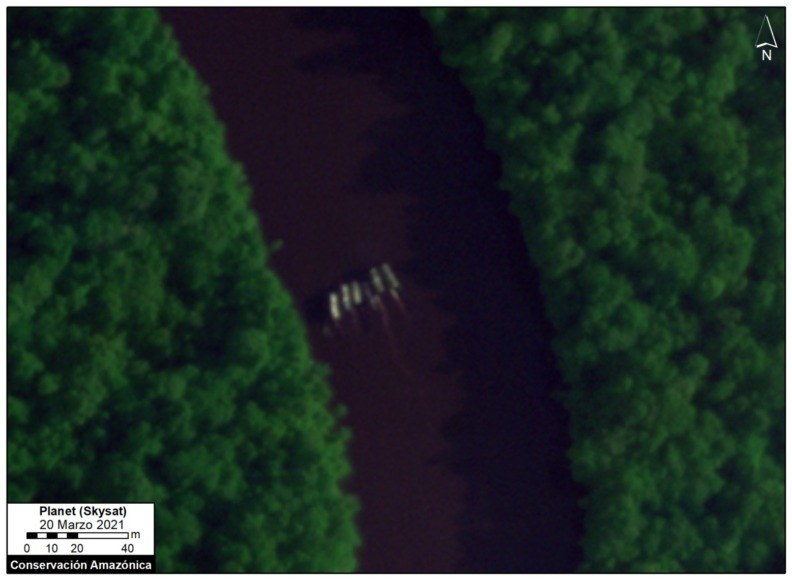
Image 1. Mining boats in the Nanay River. Image: Skysat (Planet). Analysis: MAAP/Amazon Conservation.
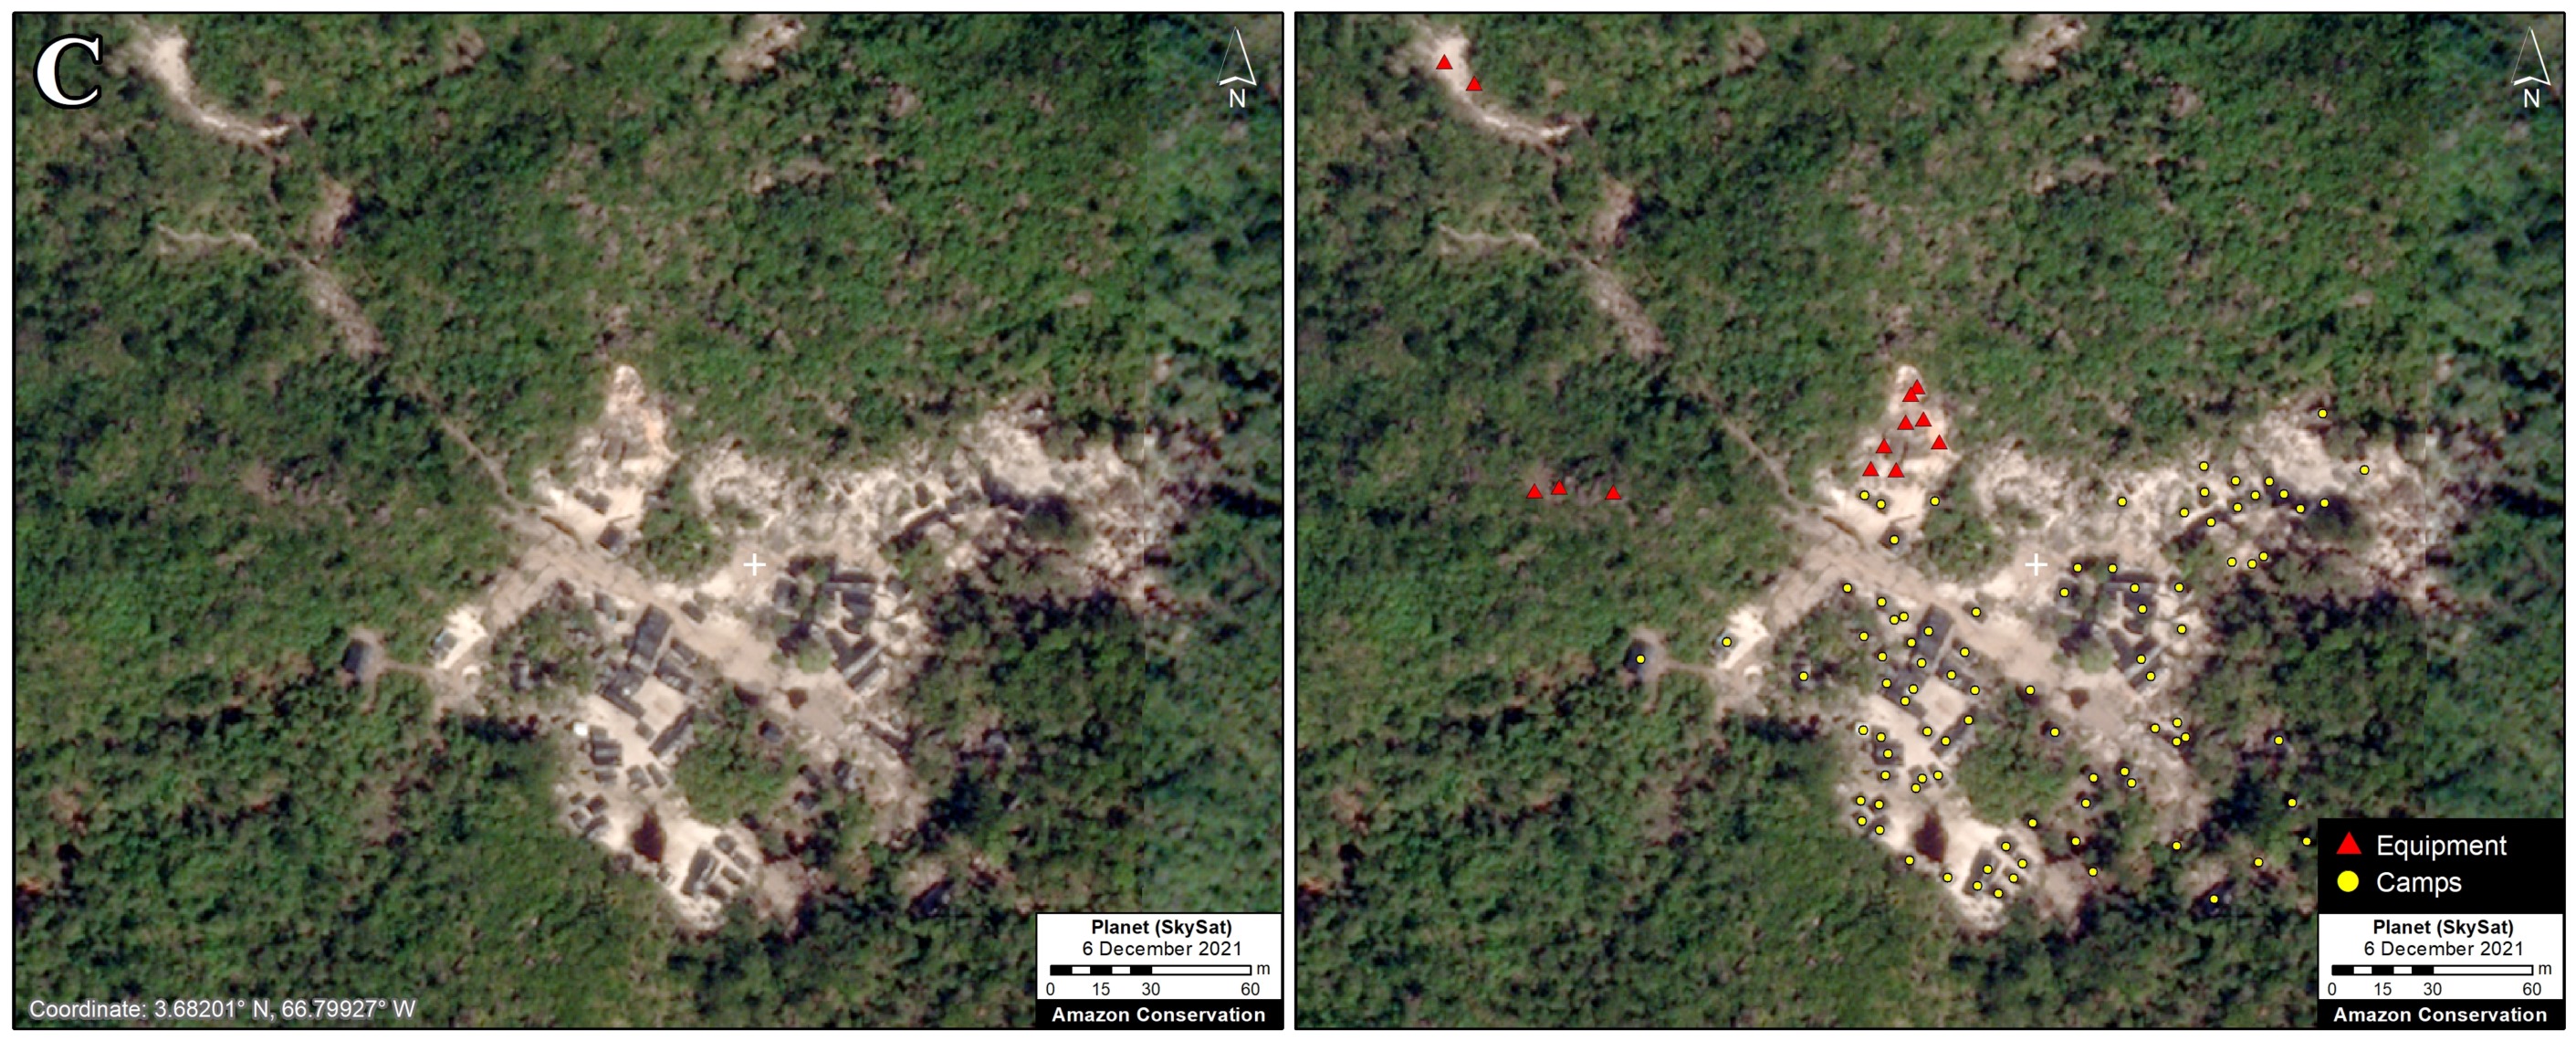
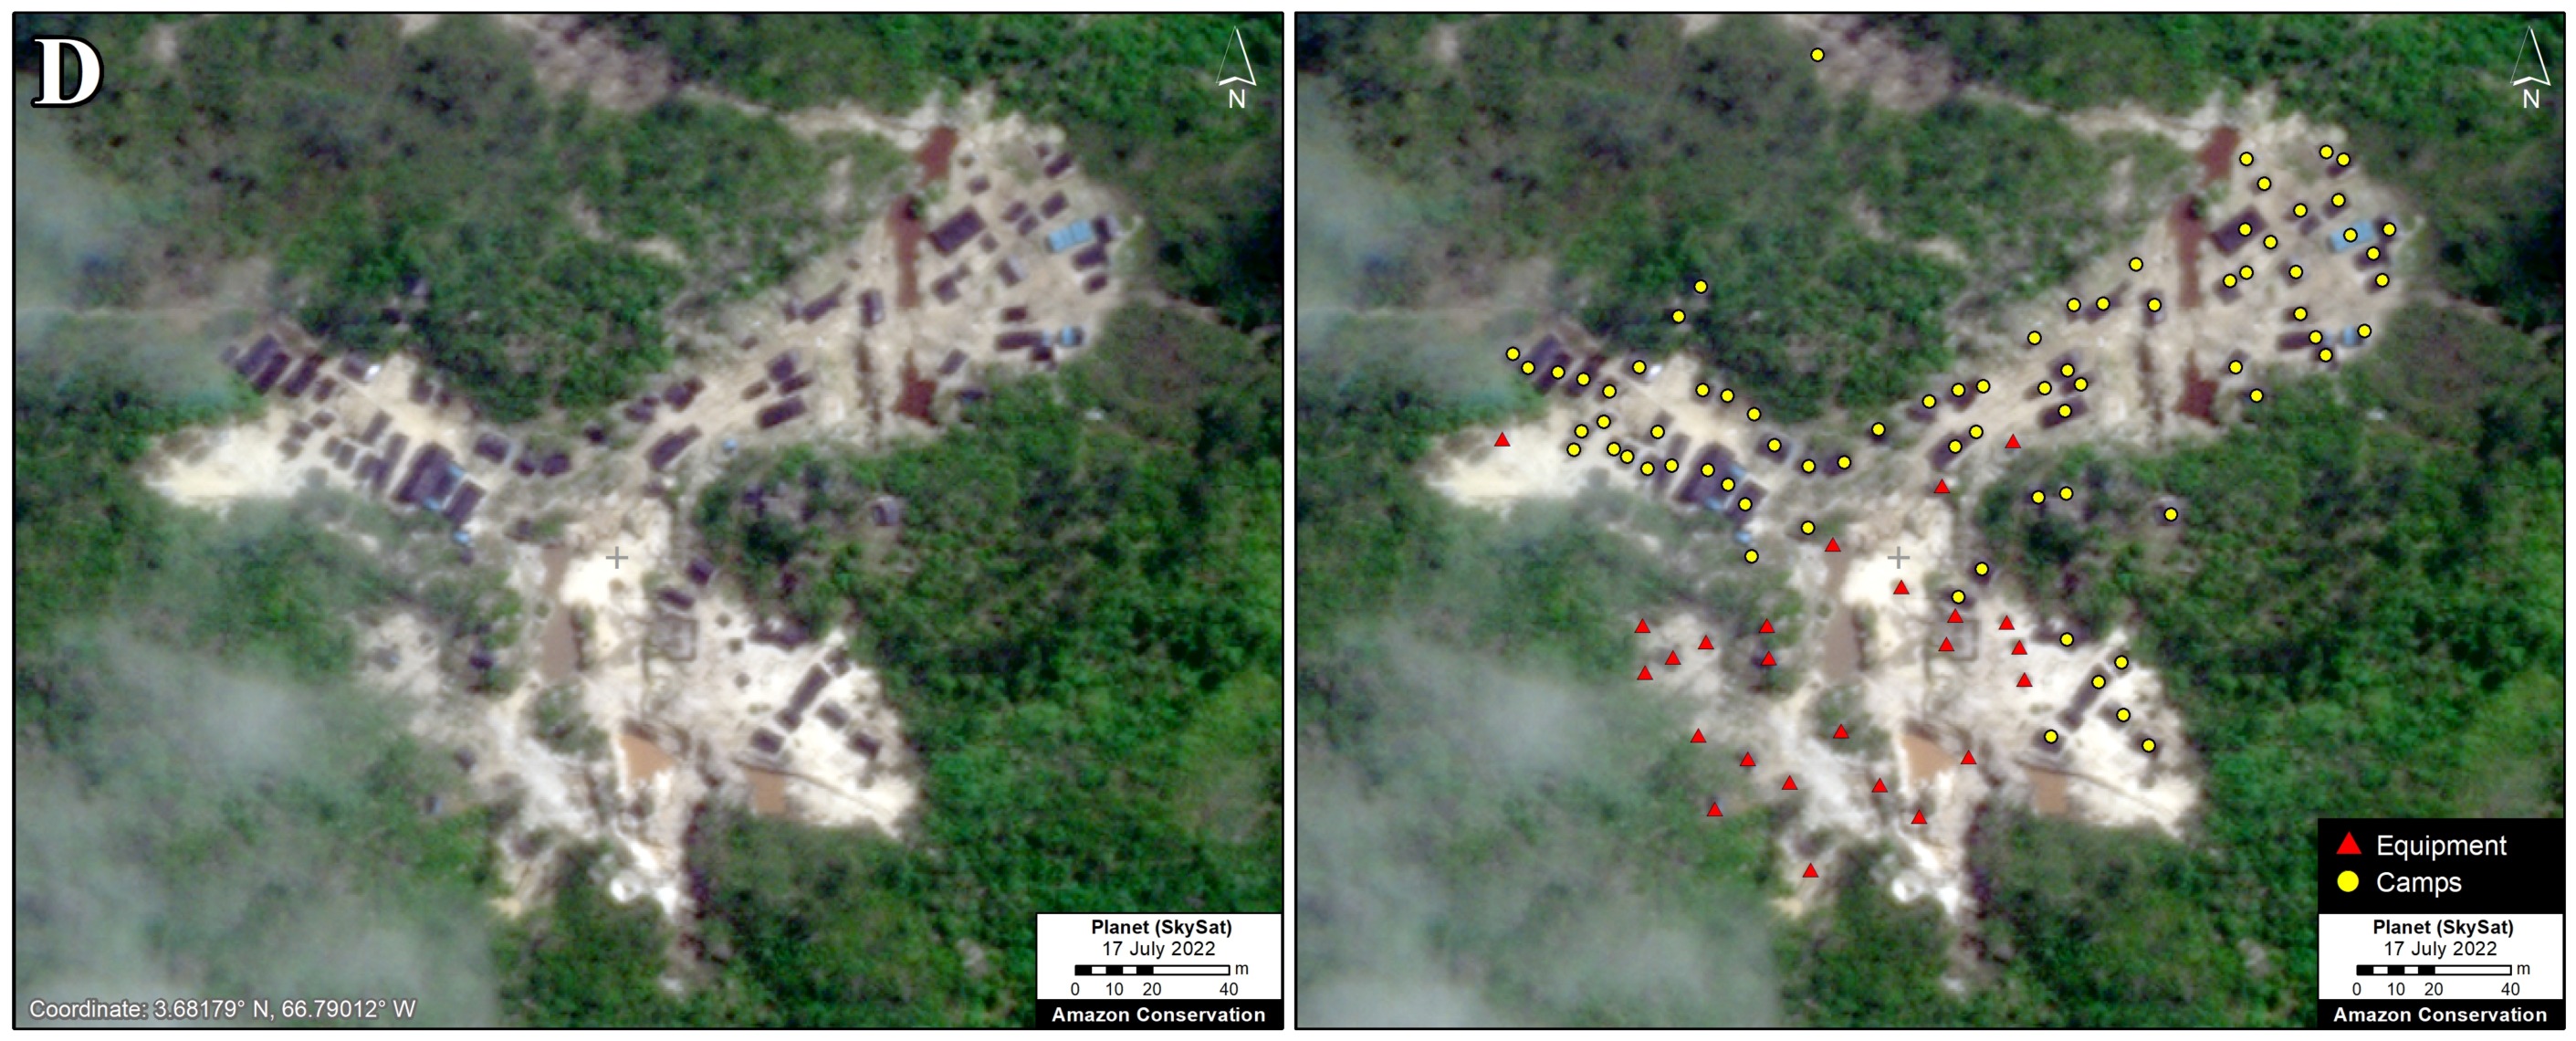
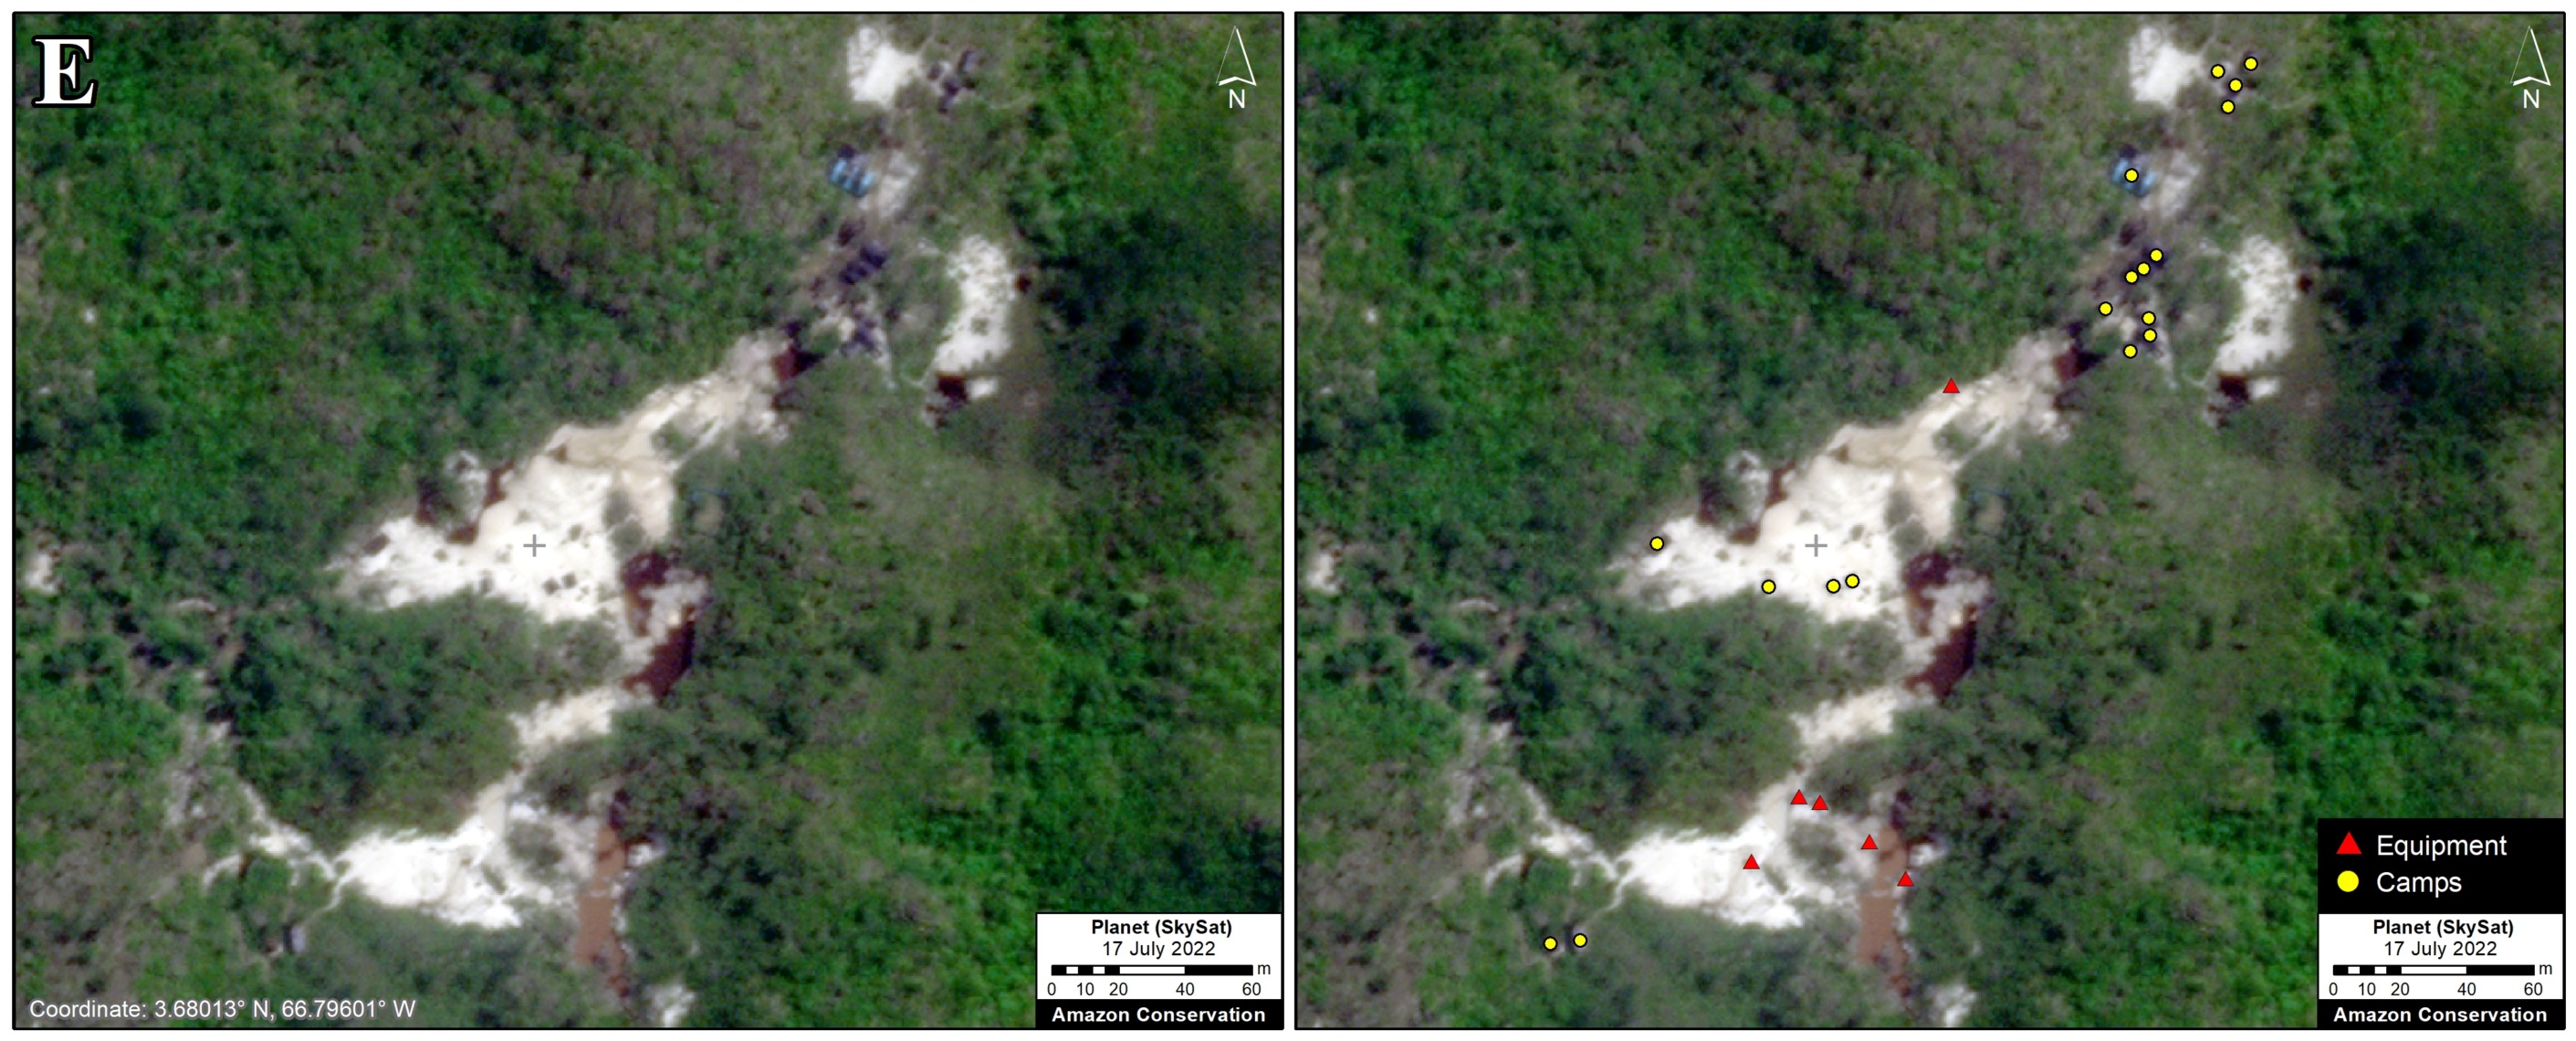
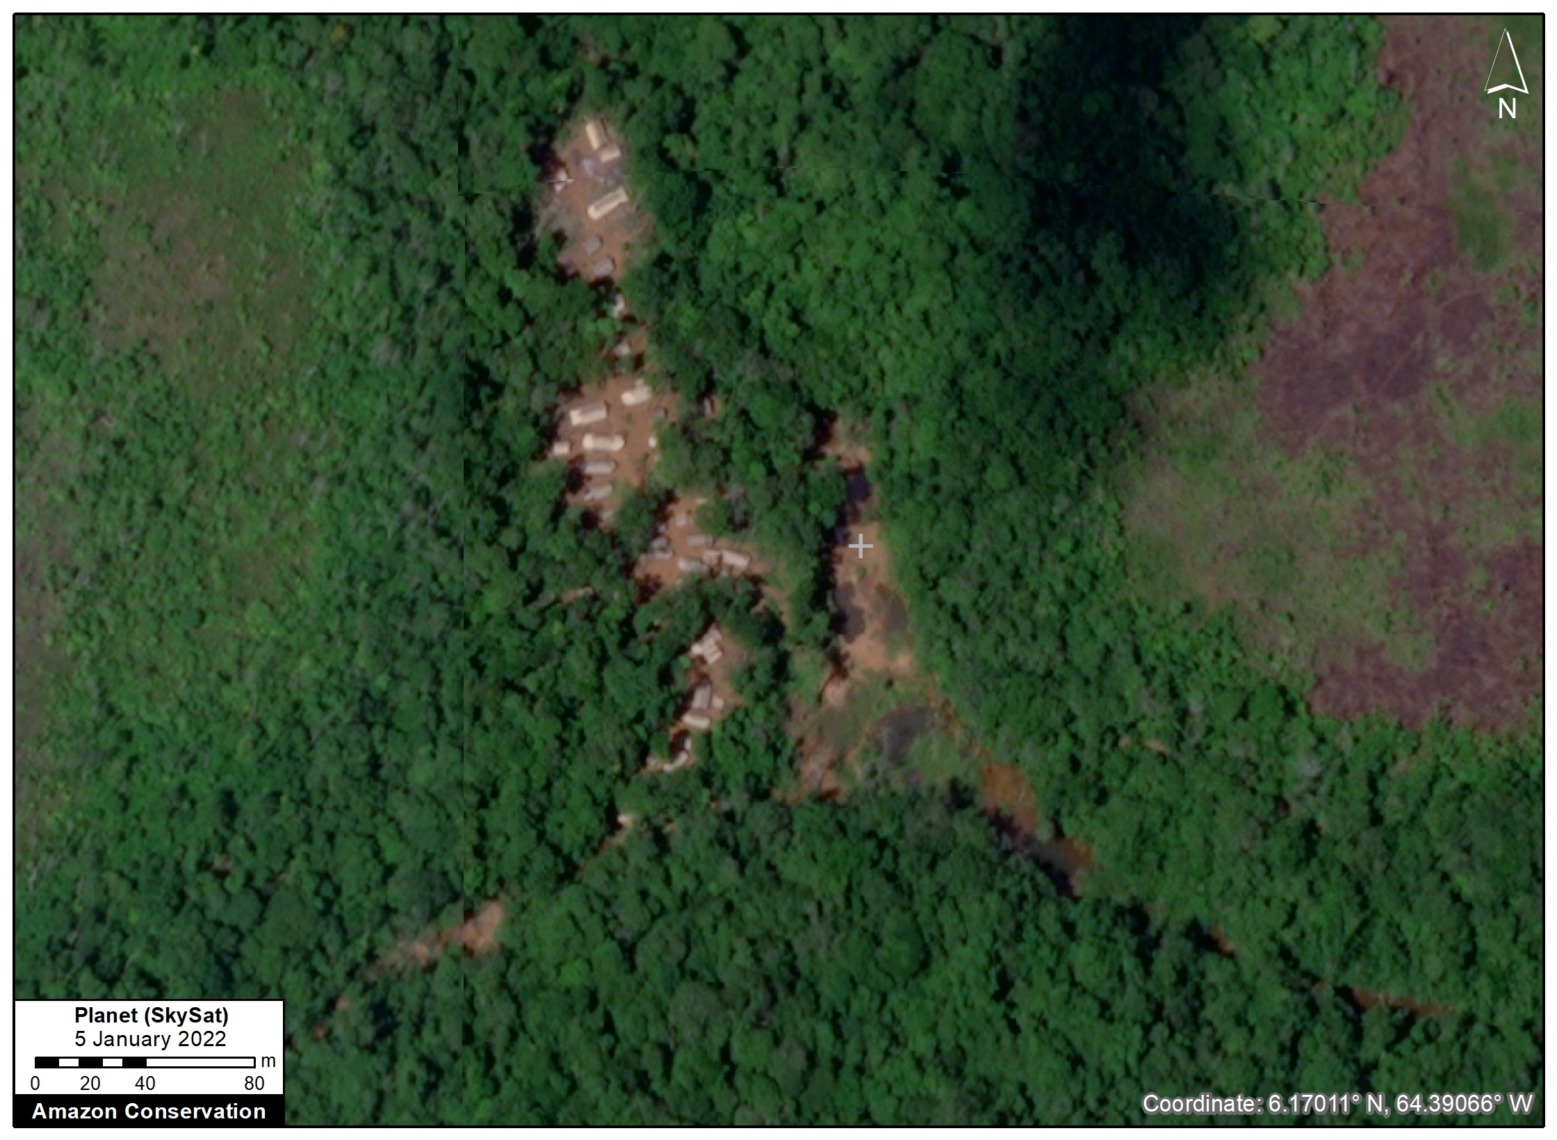
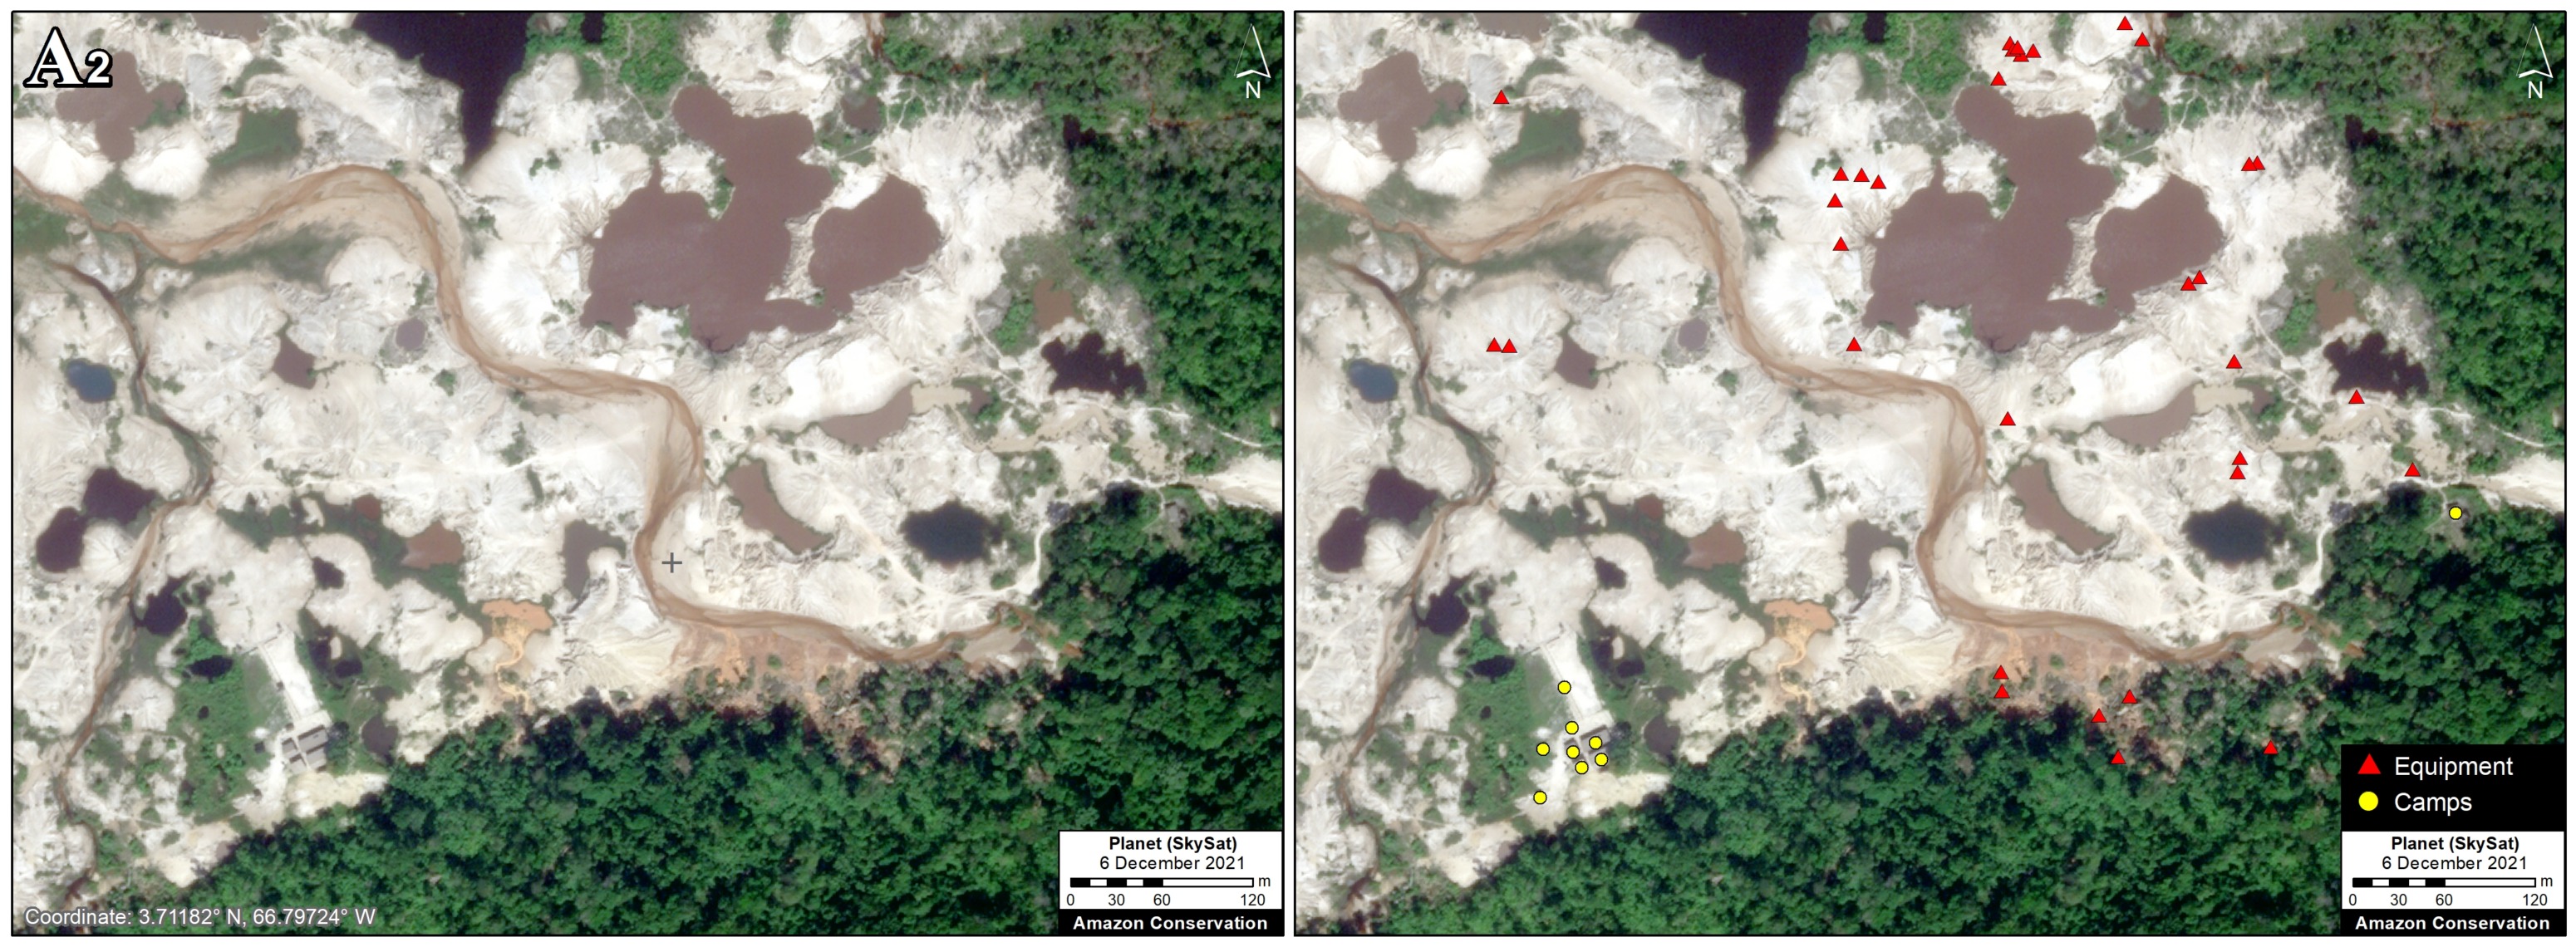
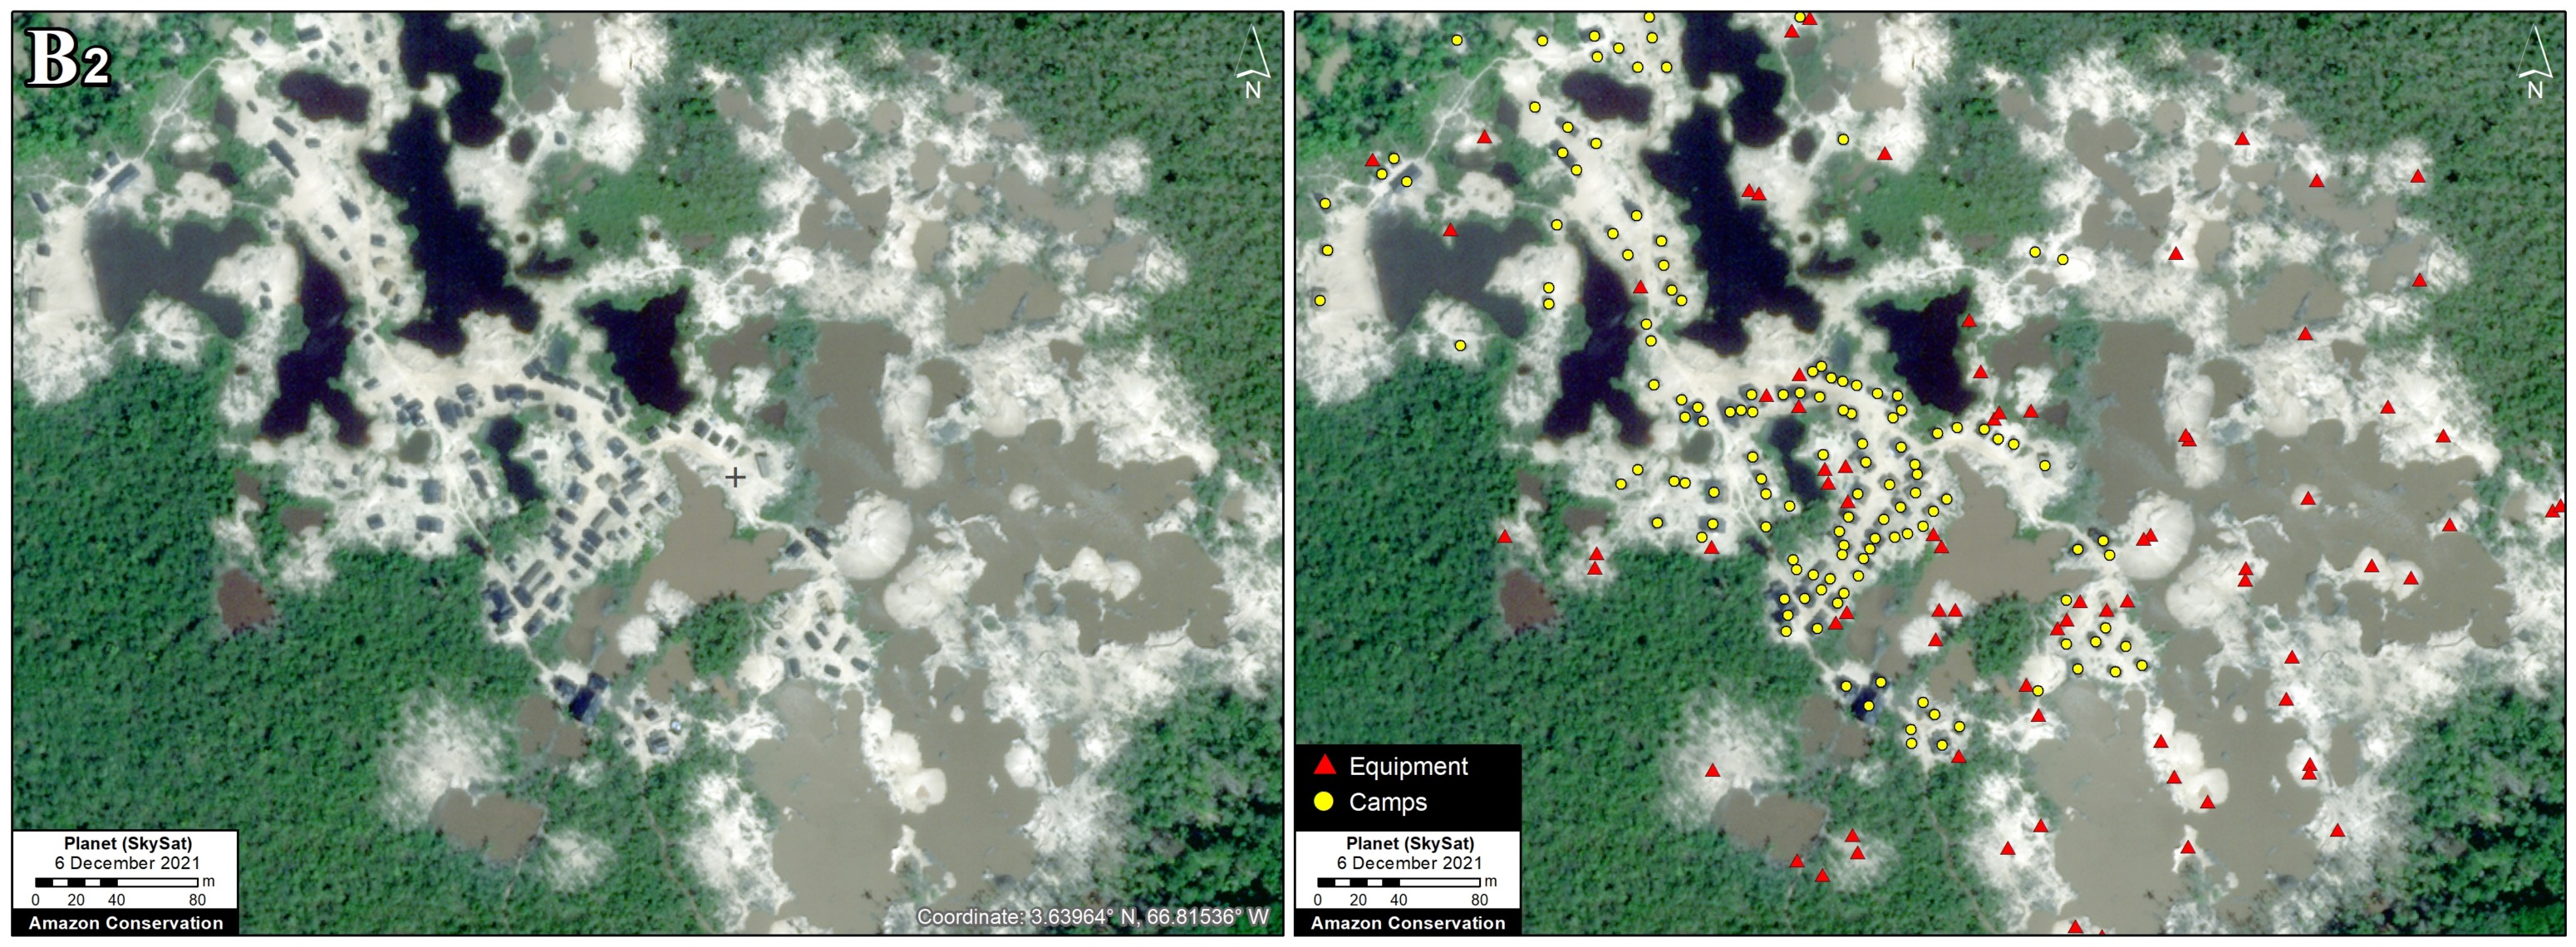
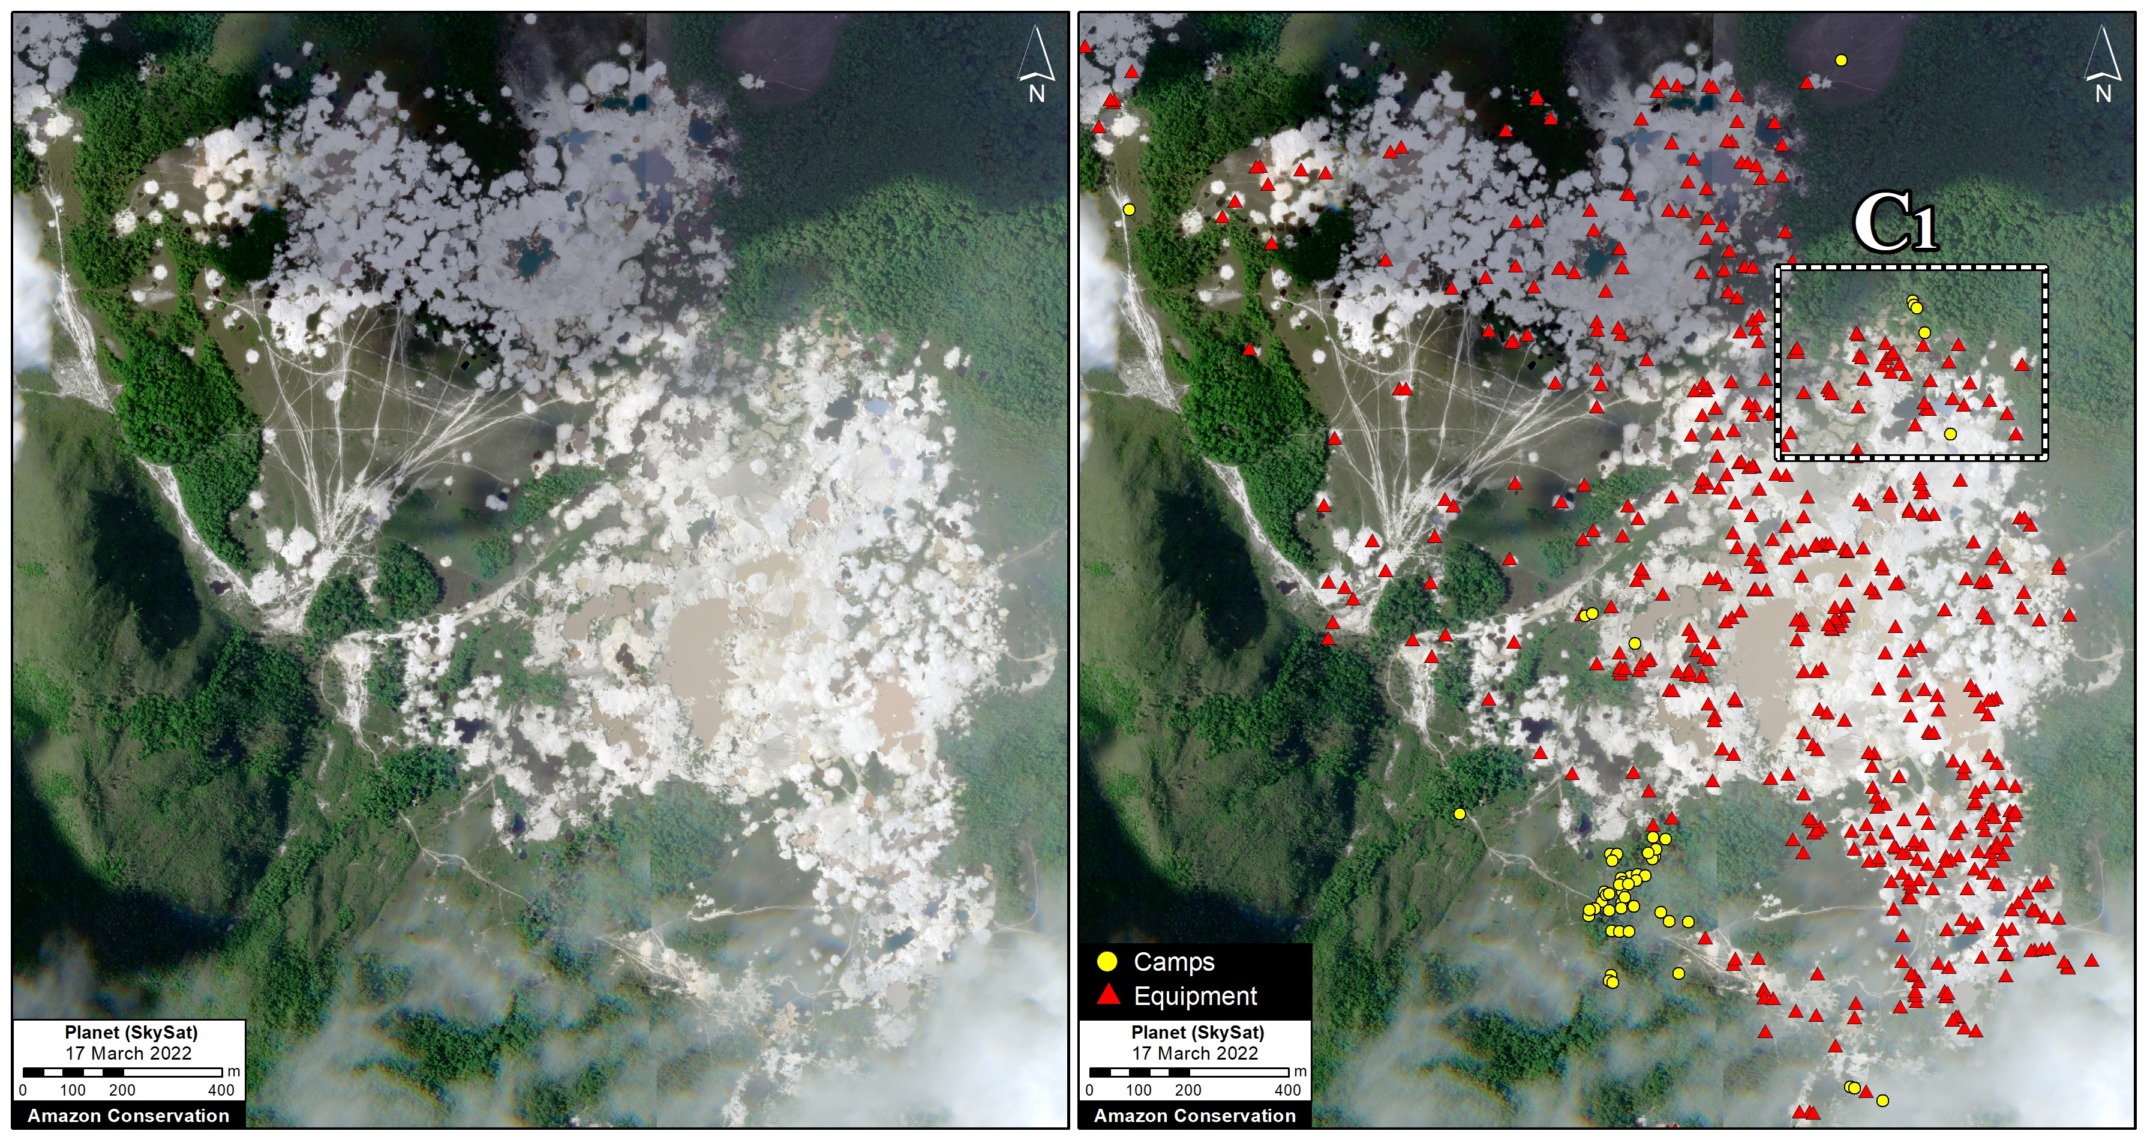
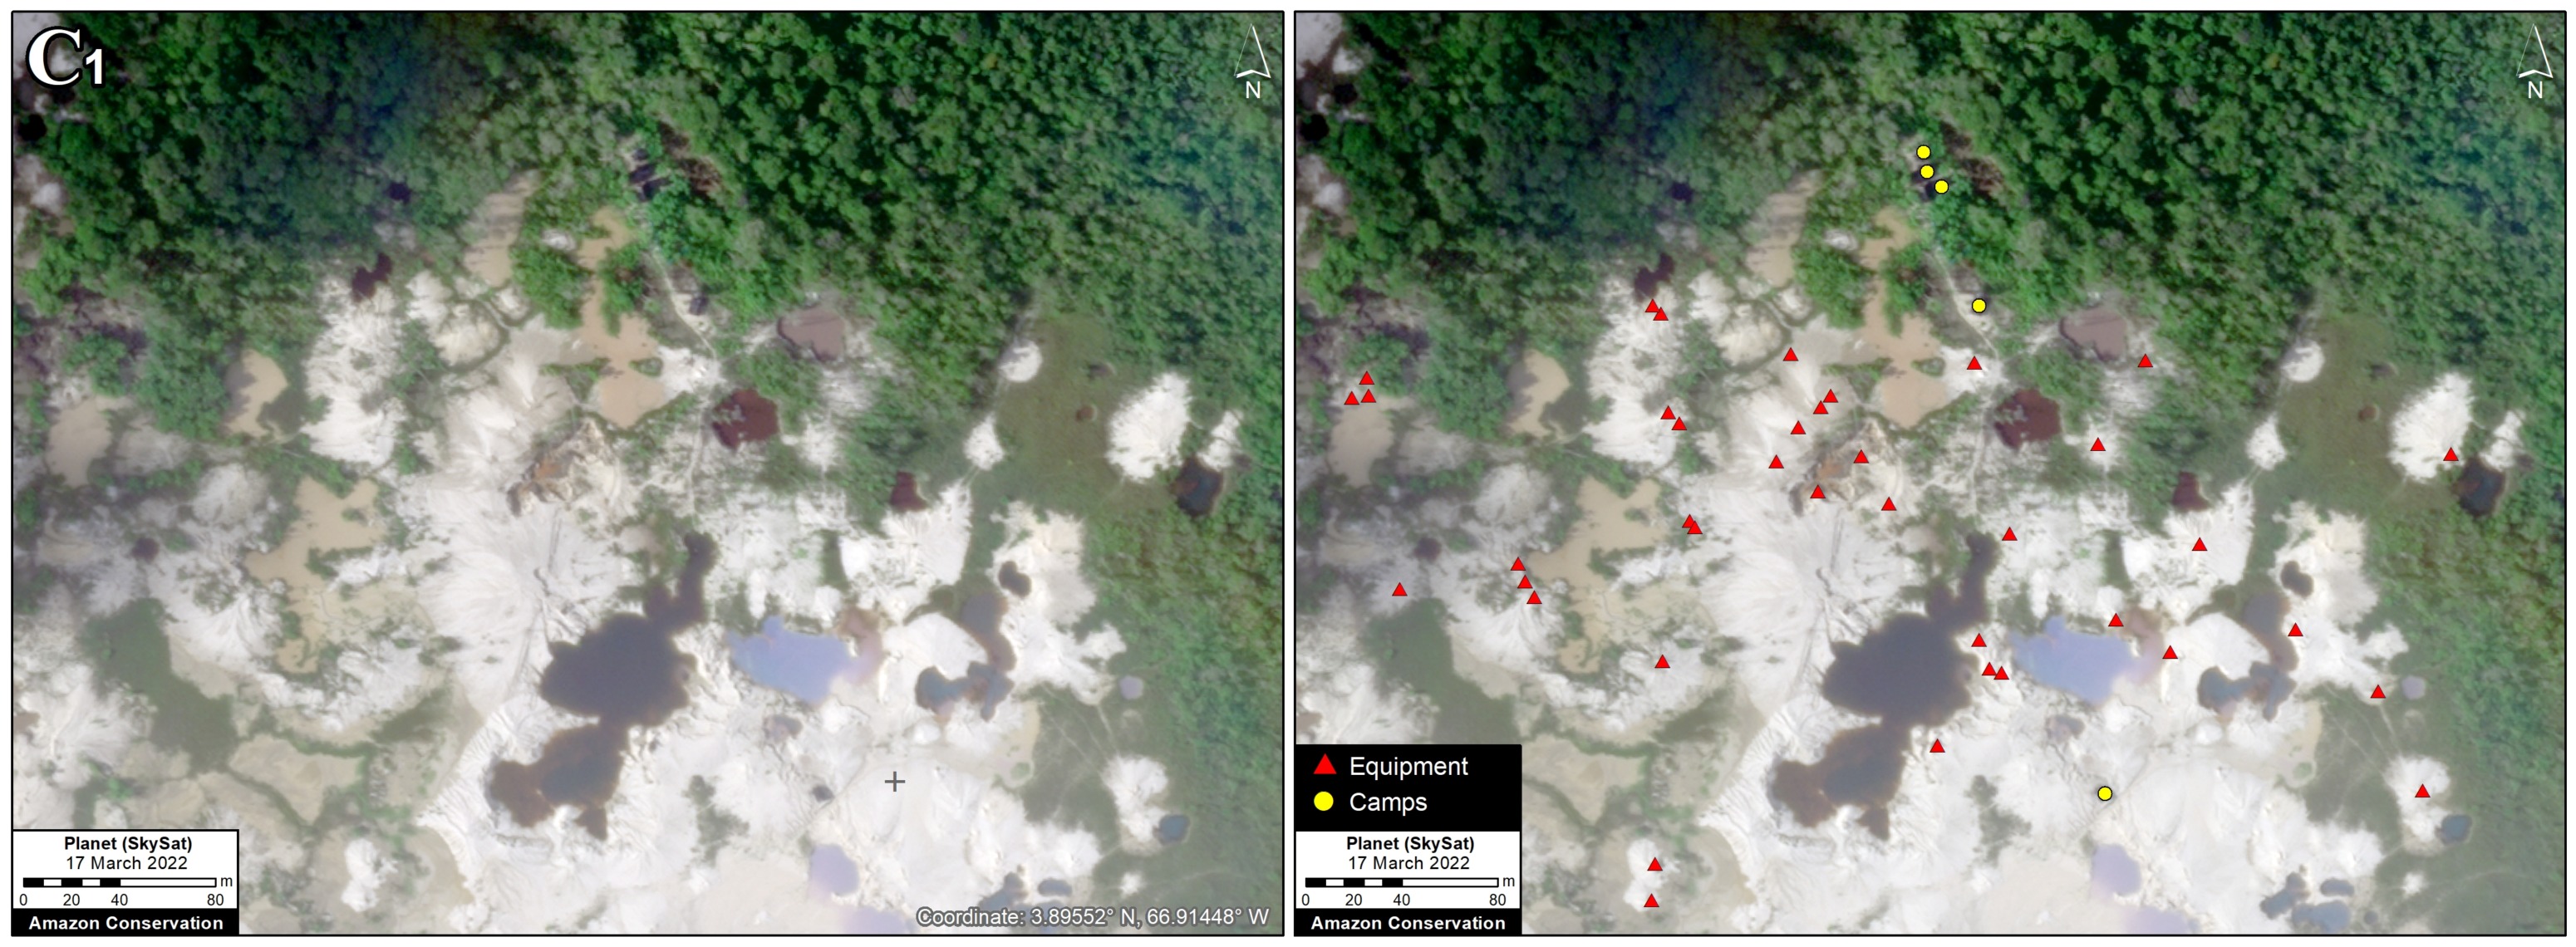
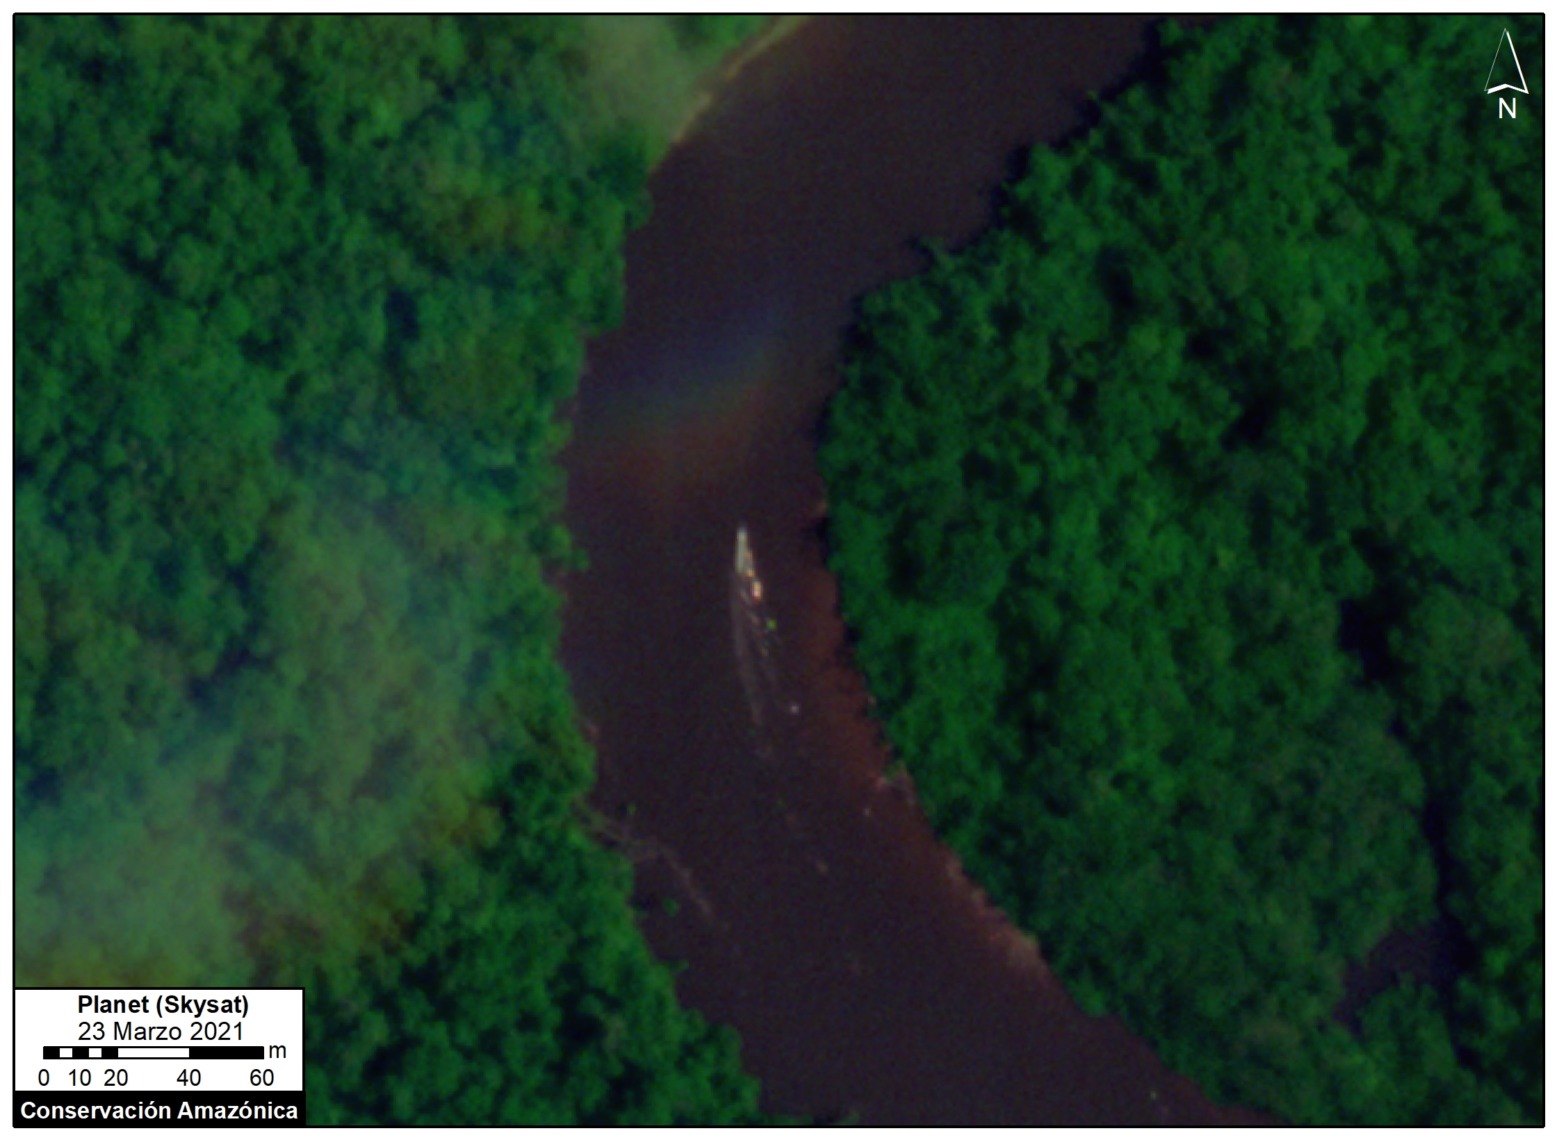
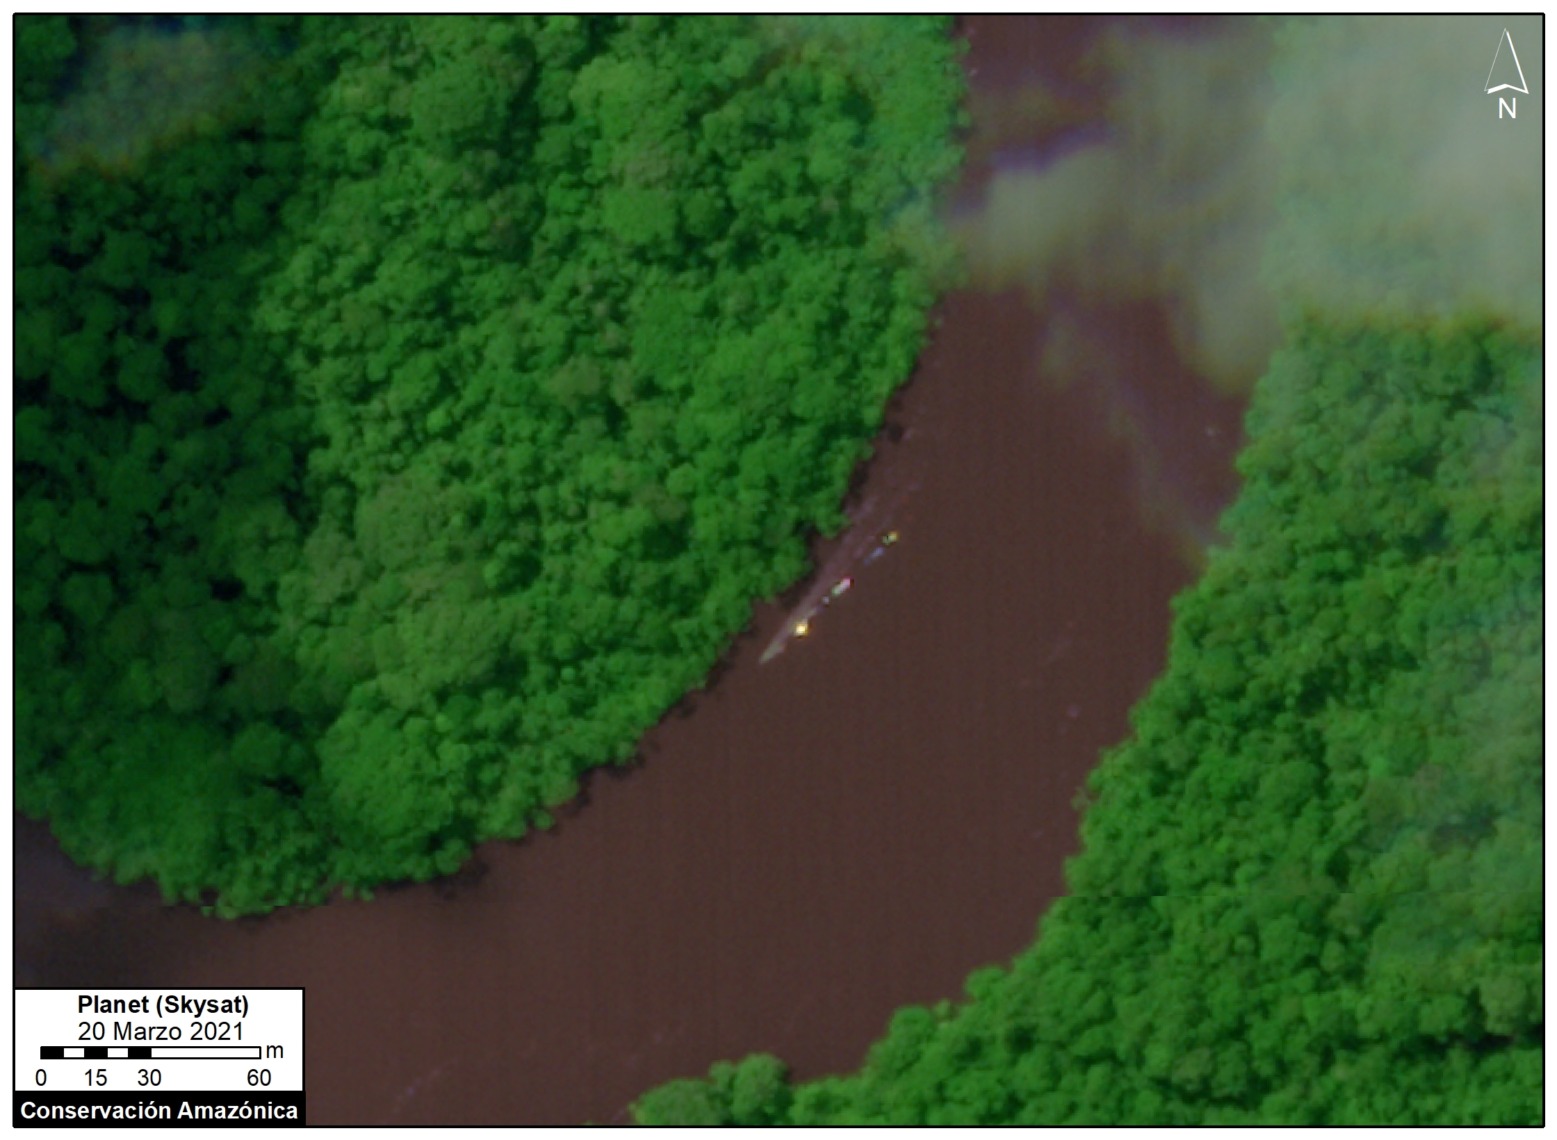
Images 2-4 show other examples of likely mining boats in the Nanay River, this time within a national protected area (Alto Nanay-Pintuyacu-Chambira Regional Conservation Area). Note that these cases are also characterized by the presence of several boats lined up together.
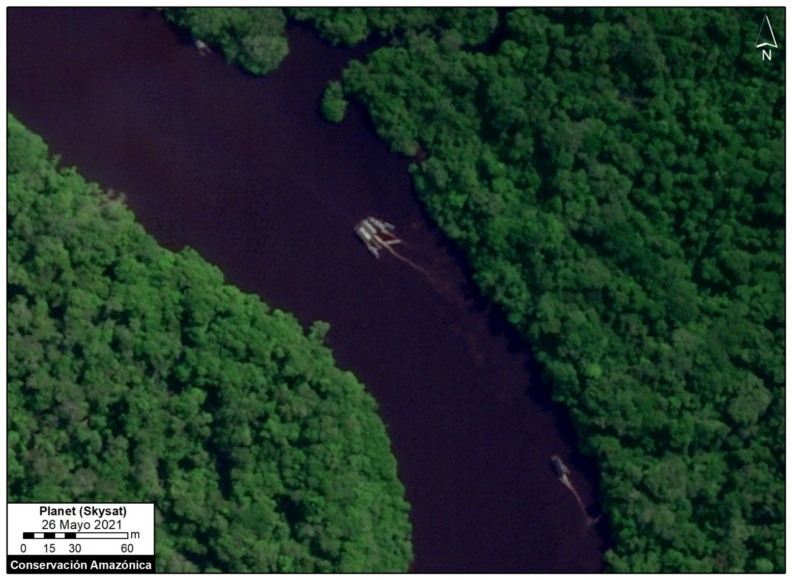
Image 2. Mining boats in the Nanay River, in the Alto Nanay-Pintuyacu-Chambira Regional Conservation Area. Image: Skysat (Planet), Analysis: MAAP/Amazon Conservation.

Image 3. Mining boats in the Nanay River, in the Alto Nanay-Pintuyacu-Chambira Regional Conservation Area. Image: Skysat (Planet), Analysis: MAAP/Amazon Conservation.
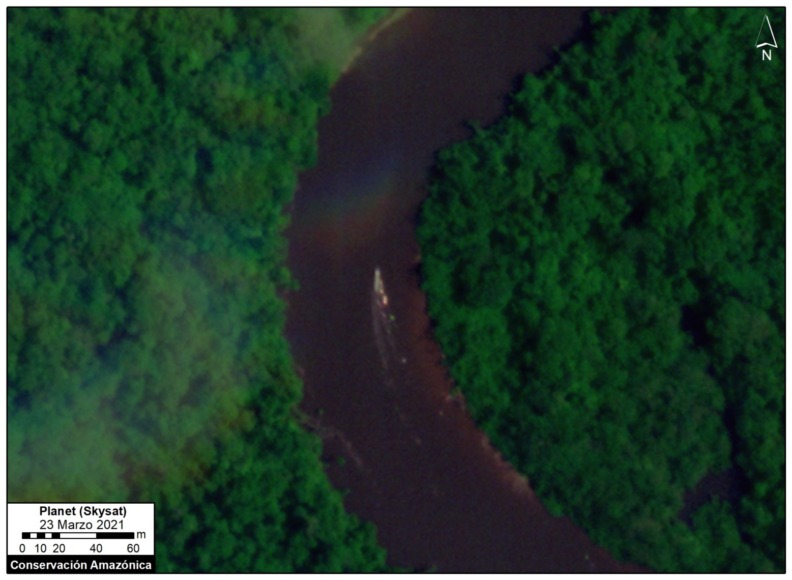
Image 4: Mining boats in the Nanay River. Image: Skysat (Planet), Analysis: MAAP/Amazon Conservation.
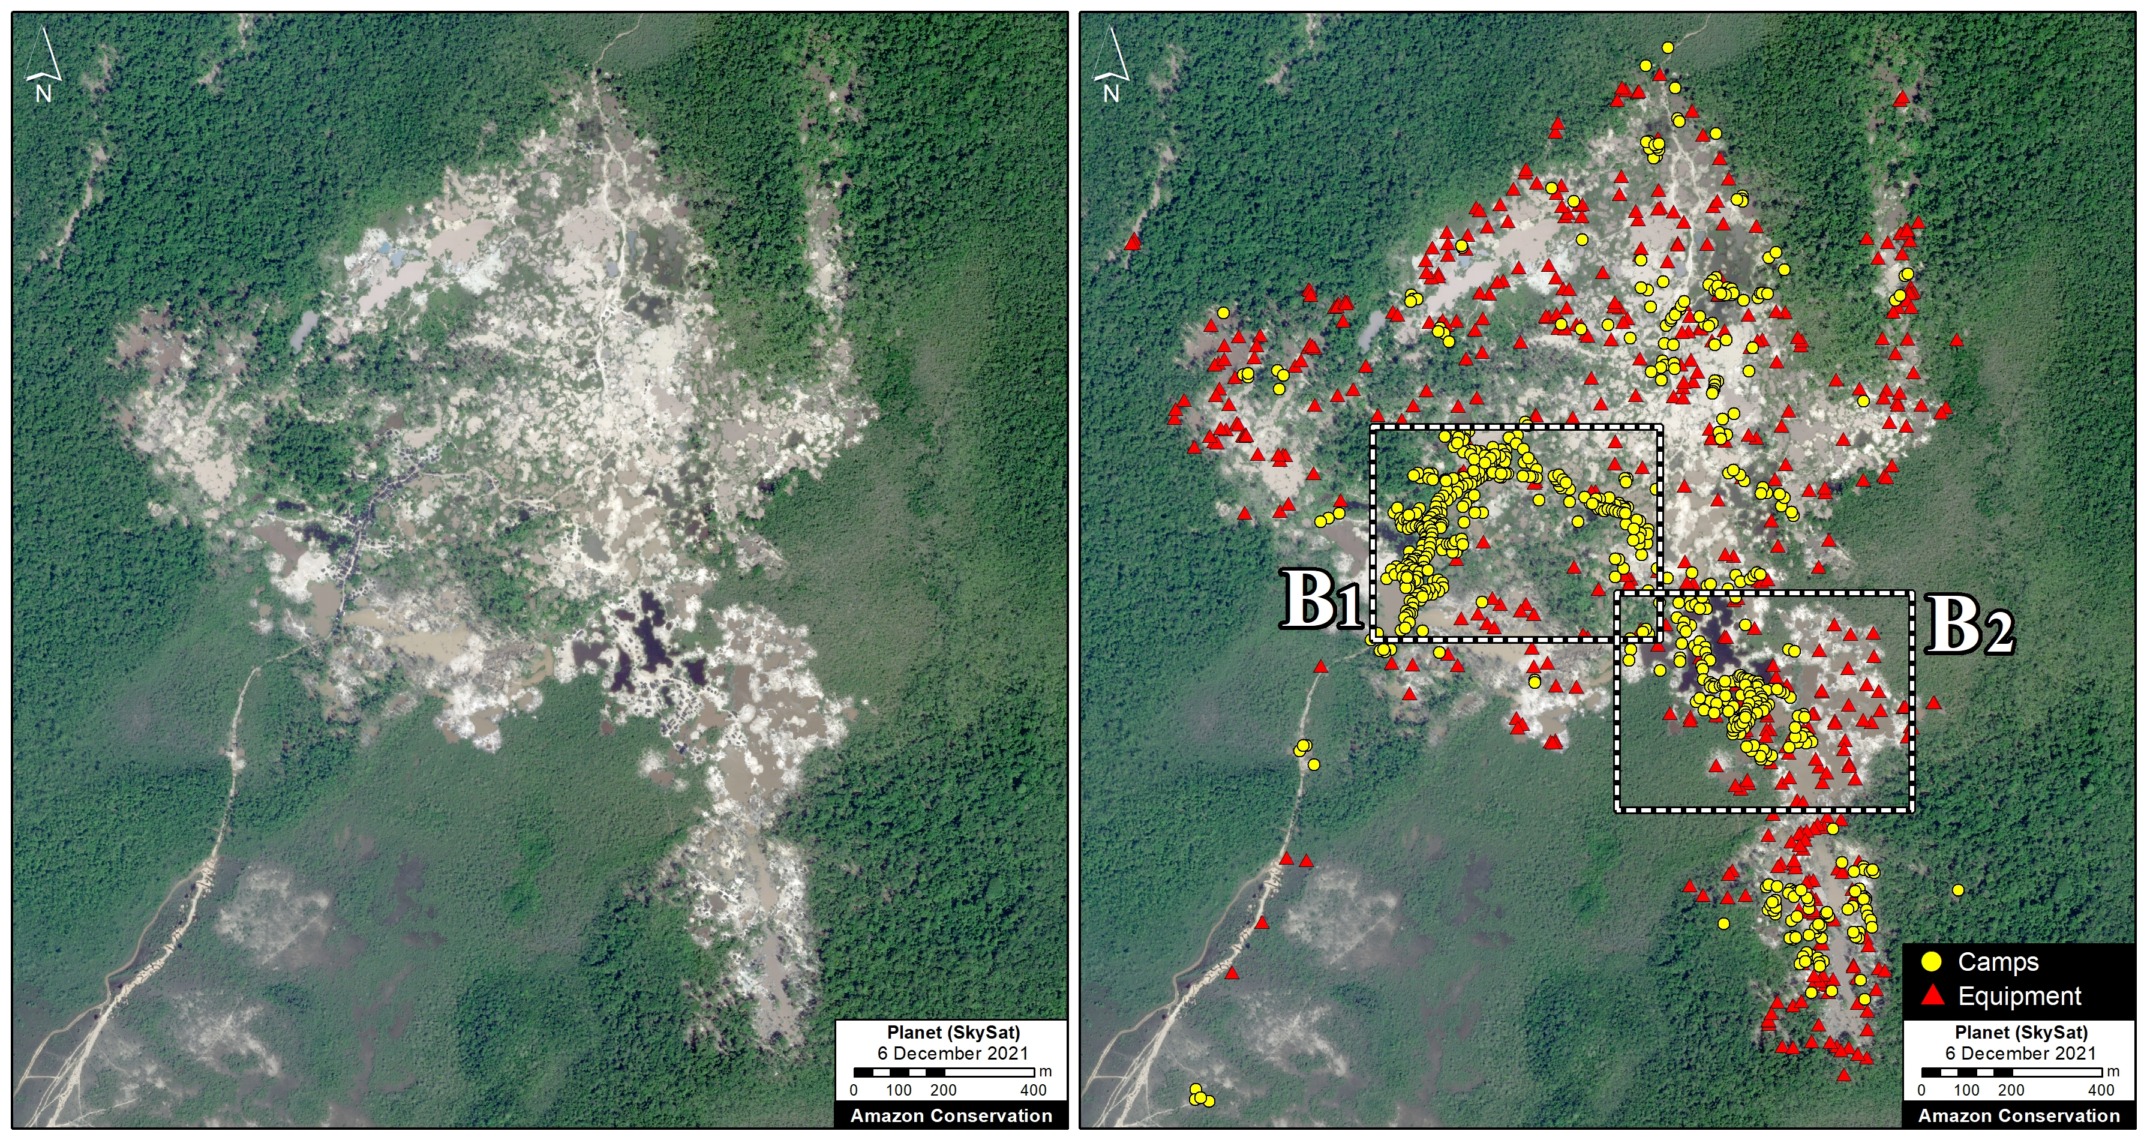
Image 5 shows the presence of illegal mining boats in the Pintuyacu River.
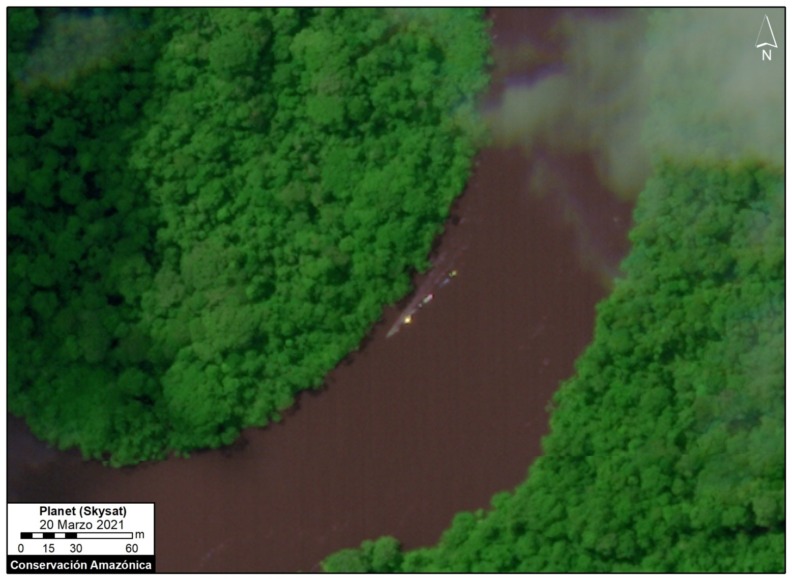
Image 5: Mining boats in the Pintuyacu River. Image: Skysat (Planet), Analysis: MAAP/Amazon Conservation.
Conclusion
Unlike the dire situation in the southern Peruvian Amazon (Madre de Dios region), the illegal gold mining in northern Peru (Loreto region) does not cause deforestation and is caused by small mining boats in the rivers, making it practically invisible to medium and high-resolution satellites. This report presents a novel technique based on the strategic tasking of very high-resolution satellite images (Skysat) to detect this type of river-based illegal mining in real-time. With these images, we demonstrate the unprecedented capability to detect and visualize illegal activity in vast and remote areas, even down to the level of a small mining boat.
This new technique may allow public institutions and local actors to better respond to illegal activity in real-time with appropriate monitoring and control protocols. For example, key actors, such as the Peruvian Special Environmental Prosecutor’s Office (FEMA) can use this type of imagery in the planning and execution of their field interventions.
It is also important to highlight that the neighboring countries of Colombia and Bolivia experience the same problem of gold mining in rivers, so there is potential to replicate this model in other countries of the Amazon.
Annex
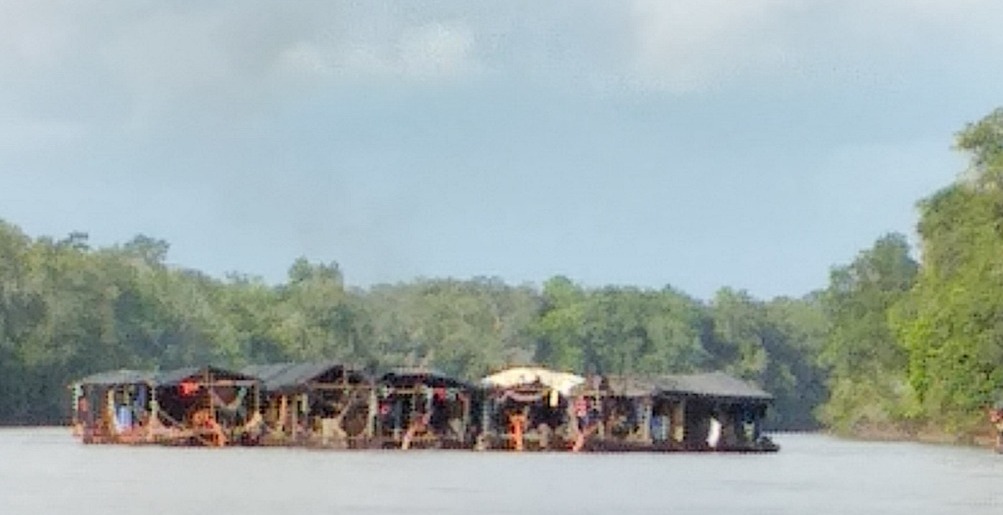
Here we show a photo from the field (Nanay River) of how the mining boats may line up during their illegal activity. This photo is for reference only and does not directly correspond to the cases described above.

Reference image of mining boats lined up during illegal activity. Source: ACRANPC.
Situación legal (in Spanish only)
El Decreto Legislativo N.° 1100 prohíbe, en el ámbito de la pequeña minería y minería artesanal, el uso de dragas y otros artefactos similares en todos los cursos de agua, ríos, lagos, lagunas, cochas, espejos de agua, humedales y aguajales. Por lo tanto, toda actividad enmarcada en este supuesto es considerada minería ilegal.
Mediante el Decreto Supremo N.° 150-2020-PCM se declara en emergencia varios distritos de Loreto por la inminente contaminación hídrica del río Nanay. A raíz de esto, se creó una comisión, cuyas actividades giraban en torno a varios operativos conjuntos, entre la Fiscalía Especializada en Materia Ambiental (FEMA), la Policía Nacional del Perú (PNP), la Dirección Regional de Energía y Minas (DREM) y la Autoridad Regional Ambiental (ARA), con el objetivo final de encontrar dragas en dicho río.
Mediante la Ordenanza Regional N.° 006-2003-GR, el Gobierno Regional de Loreto declaró la cuenca del río Nanay “zona de exclusión para actividades de extracción minera y para aquellas que alteren la cobertura vegetal.”
Acknowledgments
We thank Wendy Pineda from Rainforest US and Paul Lopez from the Satellite Monitoring Unit of the Loreto Environmental Specialized Prosecutor’s Office for their technical opinions regarding the confirmation of mining boats identified in the very high-resolution Skysat images.
We also thank Z. Romero (ACCA), G. Palacios (ACA), and G. Ribadeneyra, D. Torres, A. Felix, K. Nielsen, O. Liao and J. Carlos Guerra from USAID’s PREVENT Project, and J. Jara for their helpful comments on this report.
This report was conducted with technical assistance from USAID, via the Prevent project. Prevent is an initiative that is working with the Government of Peru, civil society, and the private sector to prevent and combat environmental crimes in Loreto, Ucayali and Madre de Dios, in order to conserve the Peruvian Amazon.
This publication is made possible with the support of the American people through USAID. Its content is the sole responsibility of the authors and does not necessarily reflect the views of USAID or the US government.
Citation
Finer M, Novoa S, Paz L, Saurez D, Mamani N (2021) Detecting illegal gold mining in rivers with specialized satellites. MAAP: 140.