MAAP #71: Gold Mining Threatens Amarakaeri Communal Reserve, Again

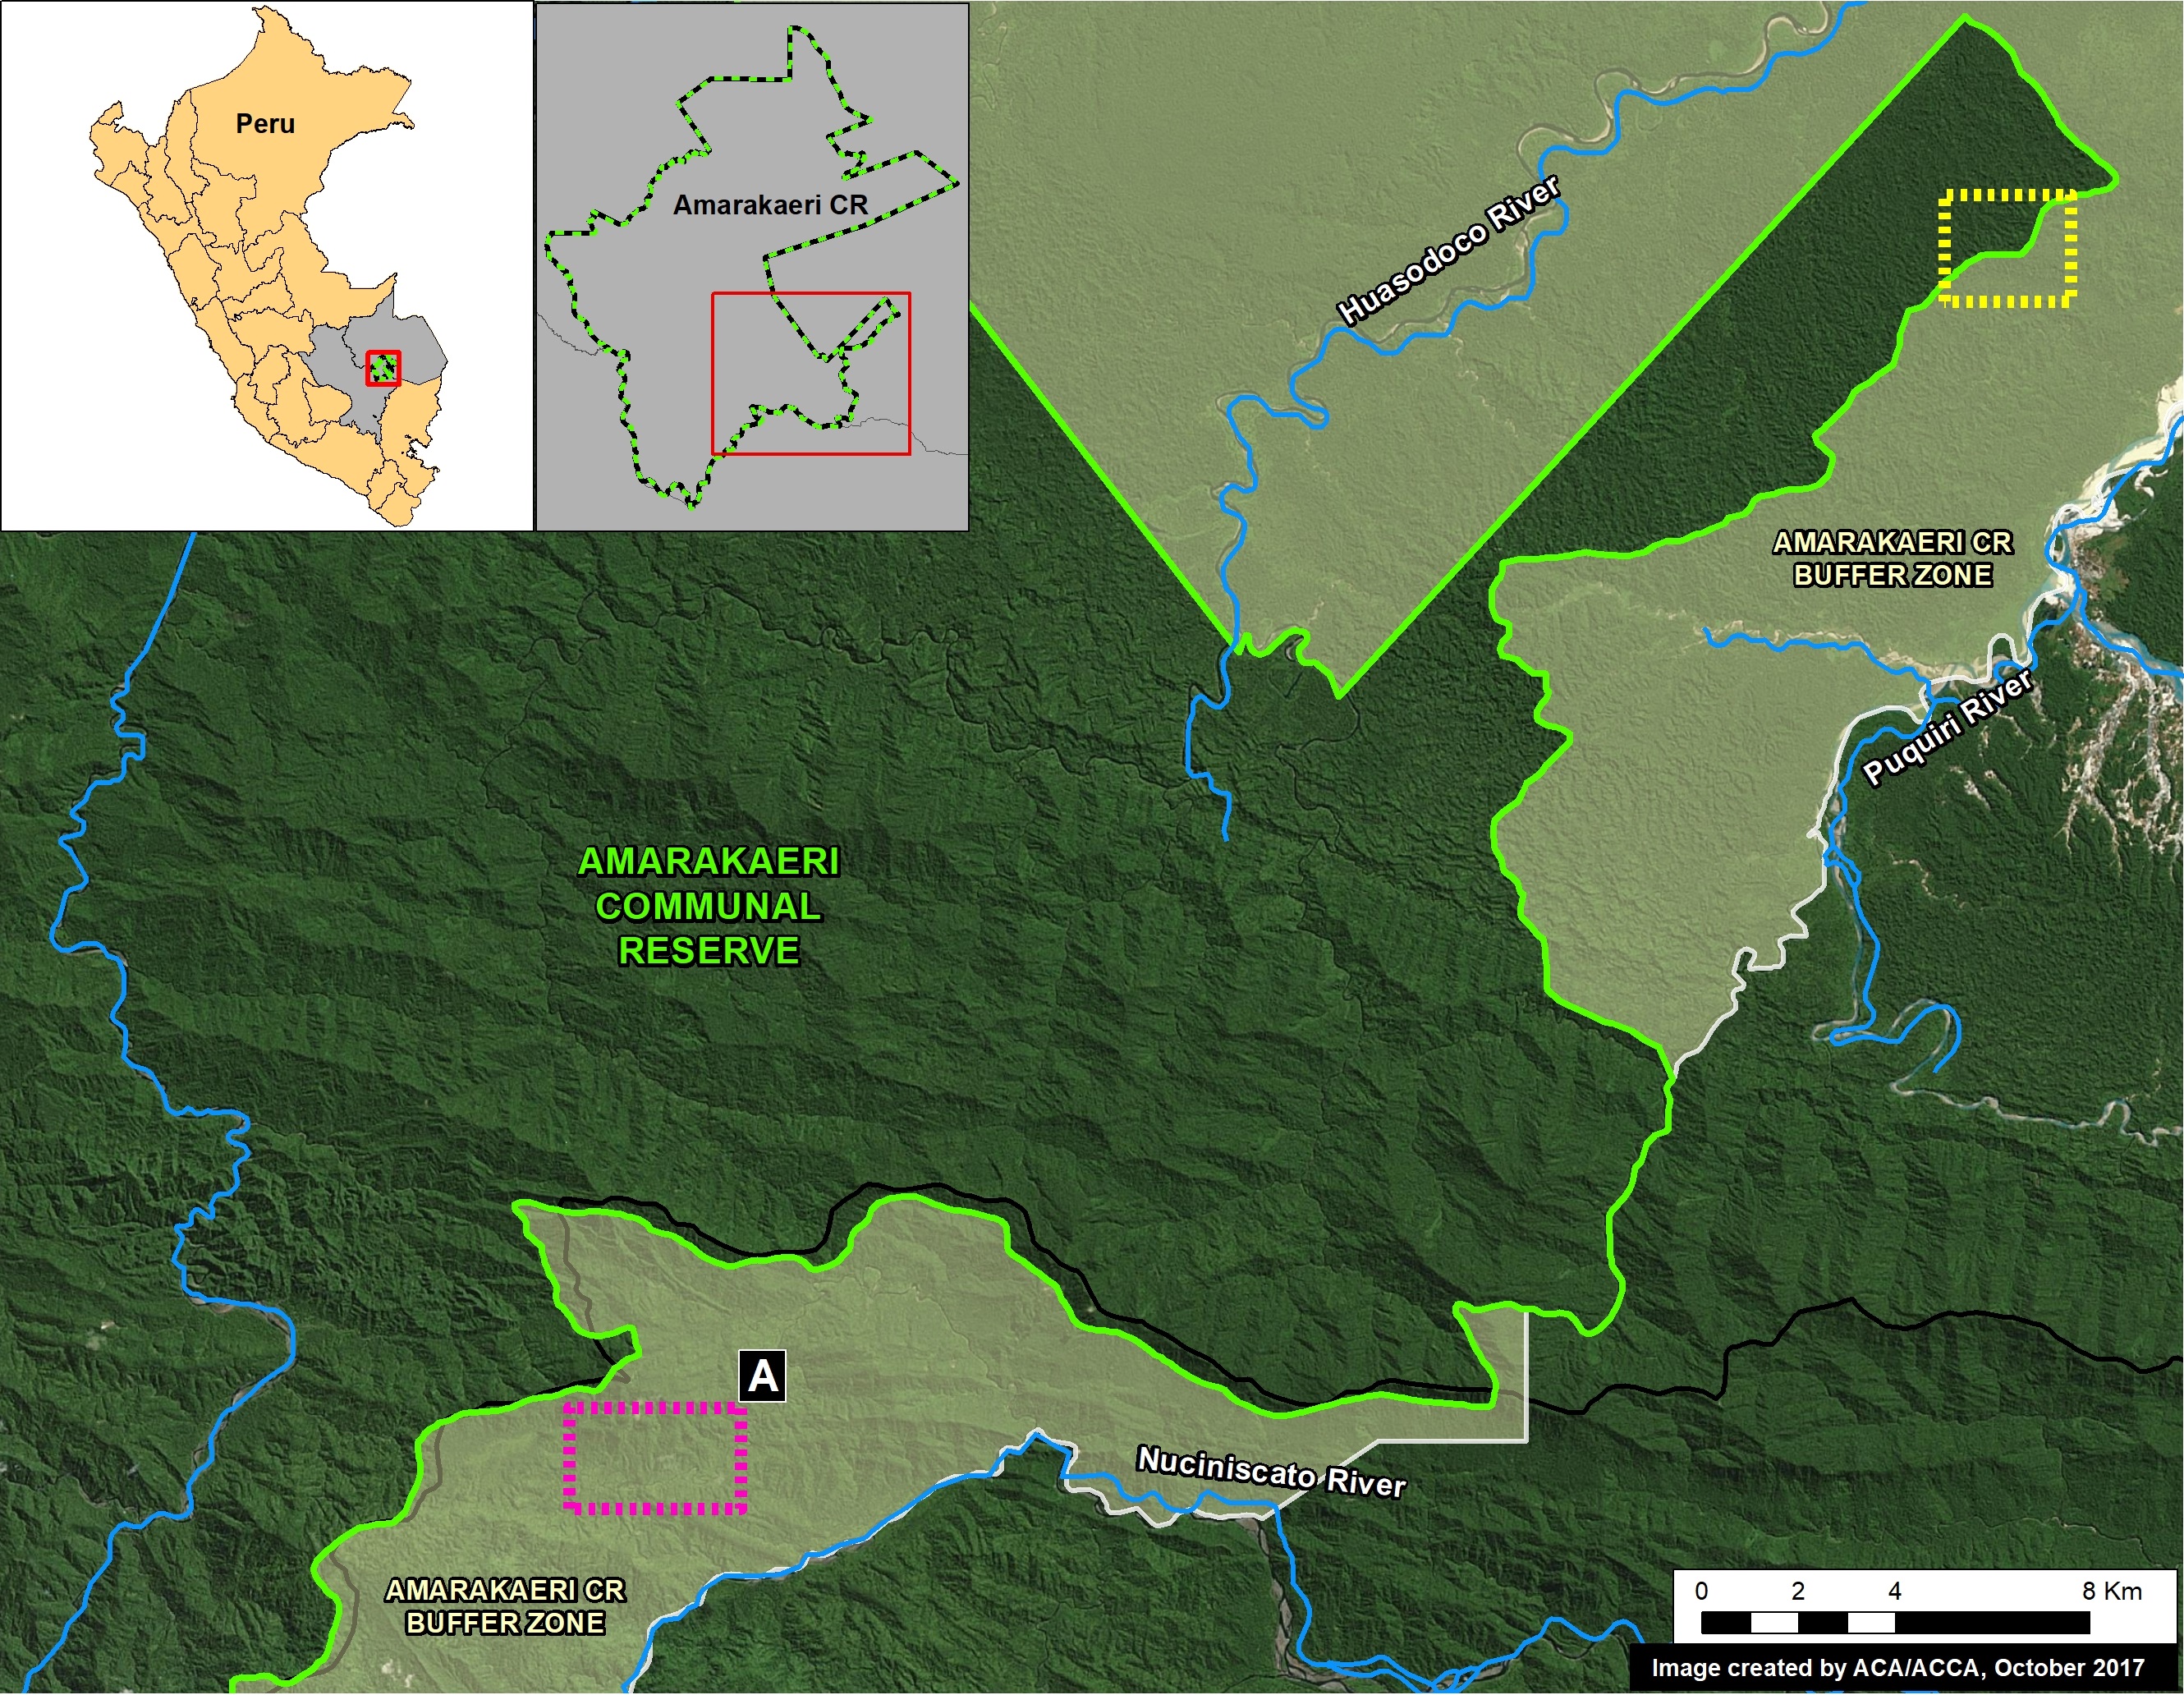
In an earlier series of articles (MAAP #6, MAAP #44, MAAP #64), we showed the illegal gold mining invasion of a section of Amarakaeri Communal Reserve (see yellow box in Base Map), as well as the rapid response by authorities to remove the miners. It was an important case given that Amarakaeri is an important Peruvian protected area, co-managed byPeru’s protected areas agency (SERNANP) and indigenous communities (represented by the ECA Amarakaeri).

However, here we highlight the rapid advance of gold mining deforestation towards another section of Amarakaeri Communal Reserve, in the region of Cusco to the south (see purple box in Base Map).

*According to a statement from SERNANP, they are jointly coordinating with the ECA Amarakaeri and competent authorities such as the National Police, Prosecutor’s Office, and National Forest Service (SERFOR), regarding actions to stop the advance of illegal gold mining, and generating and comprehensive solutions to the problem.

Image 71. Base Map

Advance of New Gold Mining Invasion

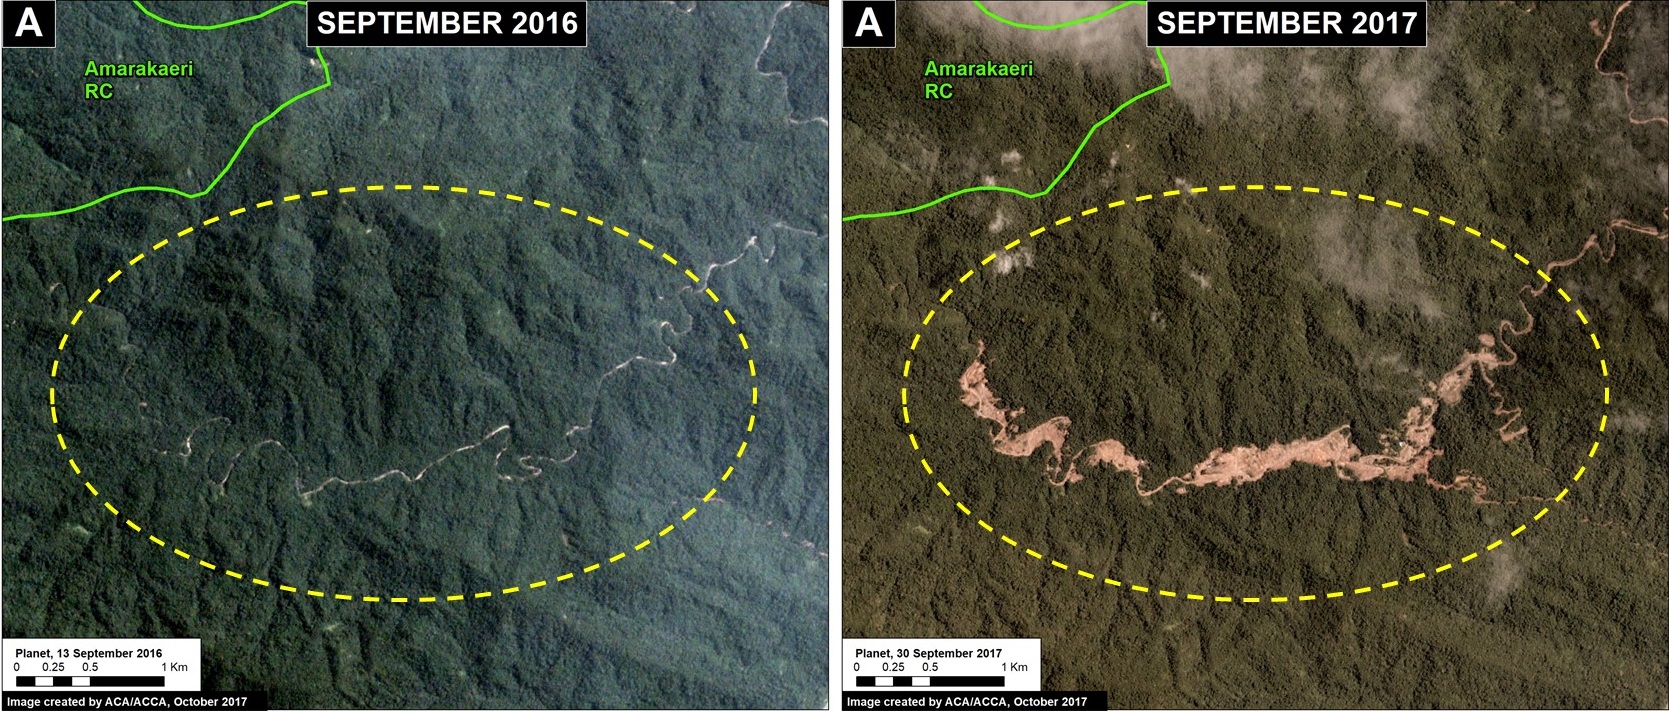
Over the past year, gold mining has rapidly advanced in the buffer zone of the Amarakaeri Communal Reserve, along a tributary of the Nuciniscato River in the Cusco region. This mining activity has caused the deforestation of 158 acres (64 hectares) of primary Amazon rainforest between September 2016 and September 2017 (Image 71a). The most recent deforestation, during September 2017, is only 1 km from the border of the Amarakaeri Communal Reserve.

Image 71a. Data: Planet, SERNANP

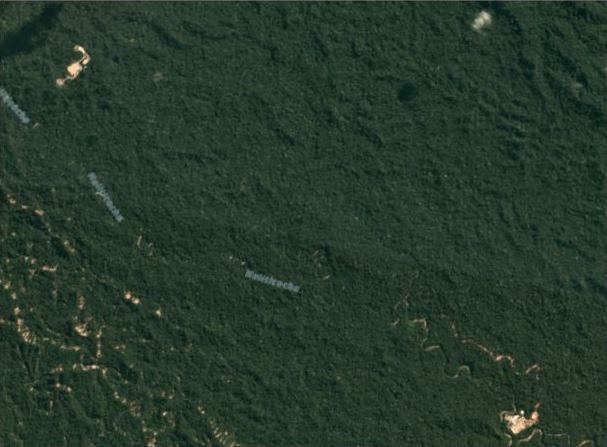
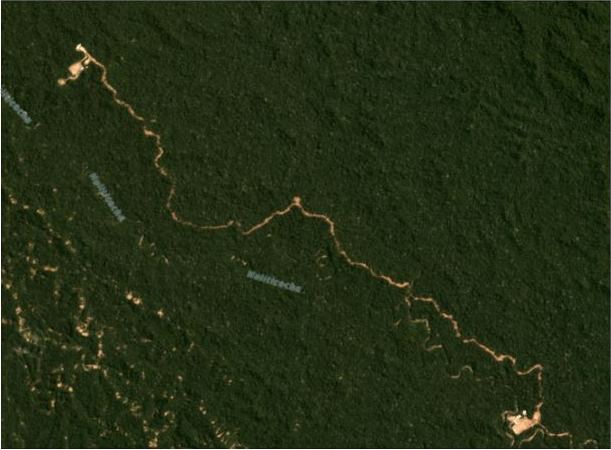
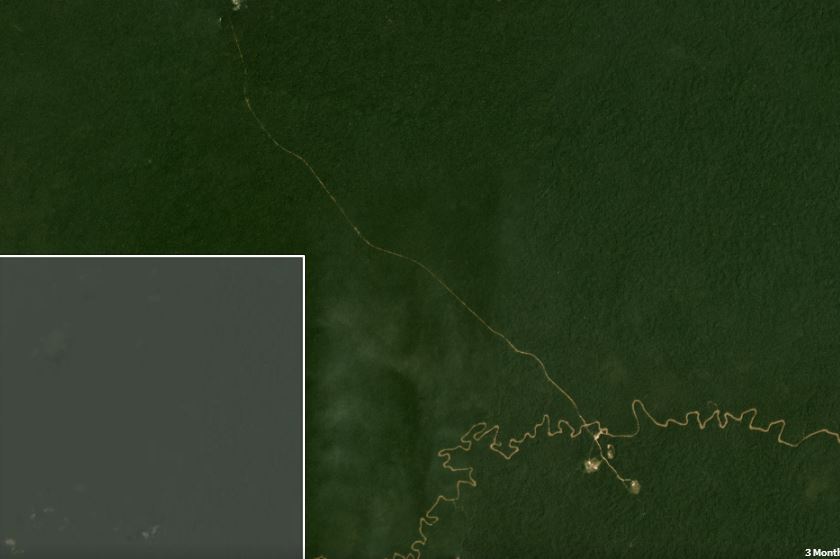
Below, we show a series of satellite images (obtained from the company Planet) showing the rapid advance of gold mining deforestation towards the Communal Reserve during 2017 (May, July, August, and September). To enlarge, click the bottom right of the images.

GIF 71. GIF of a series of images. Planet

Very High Resolution Zoom 

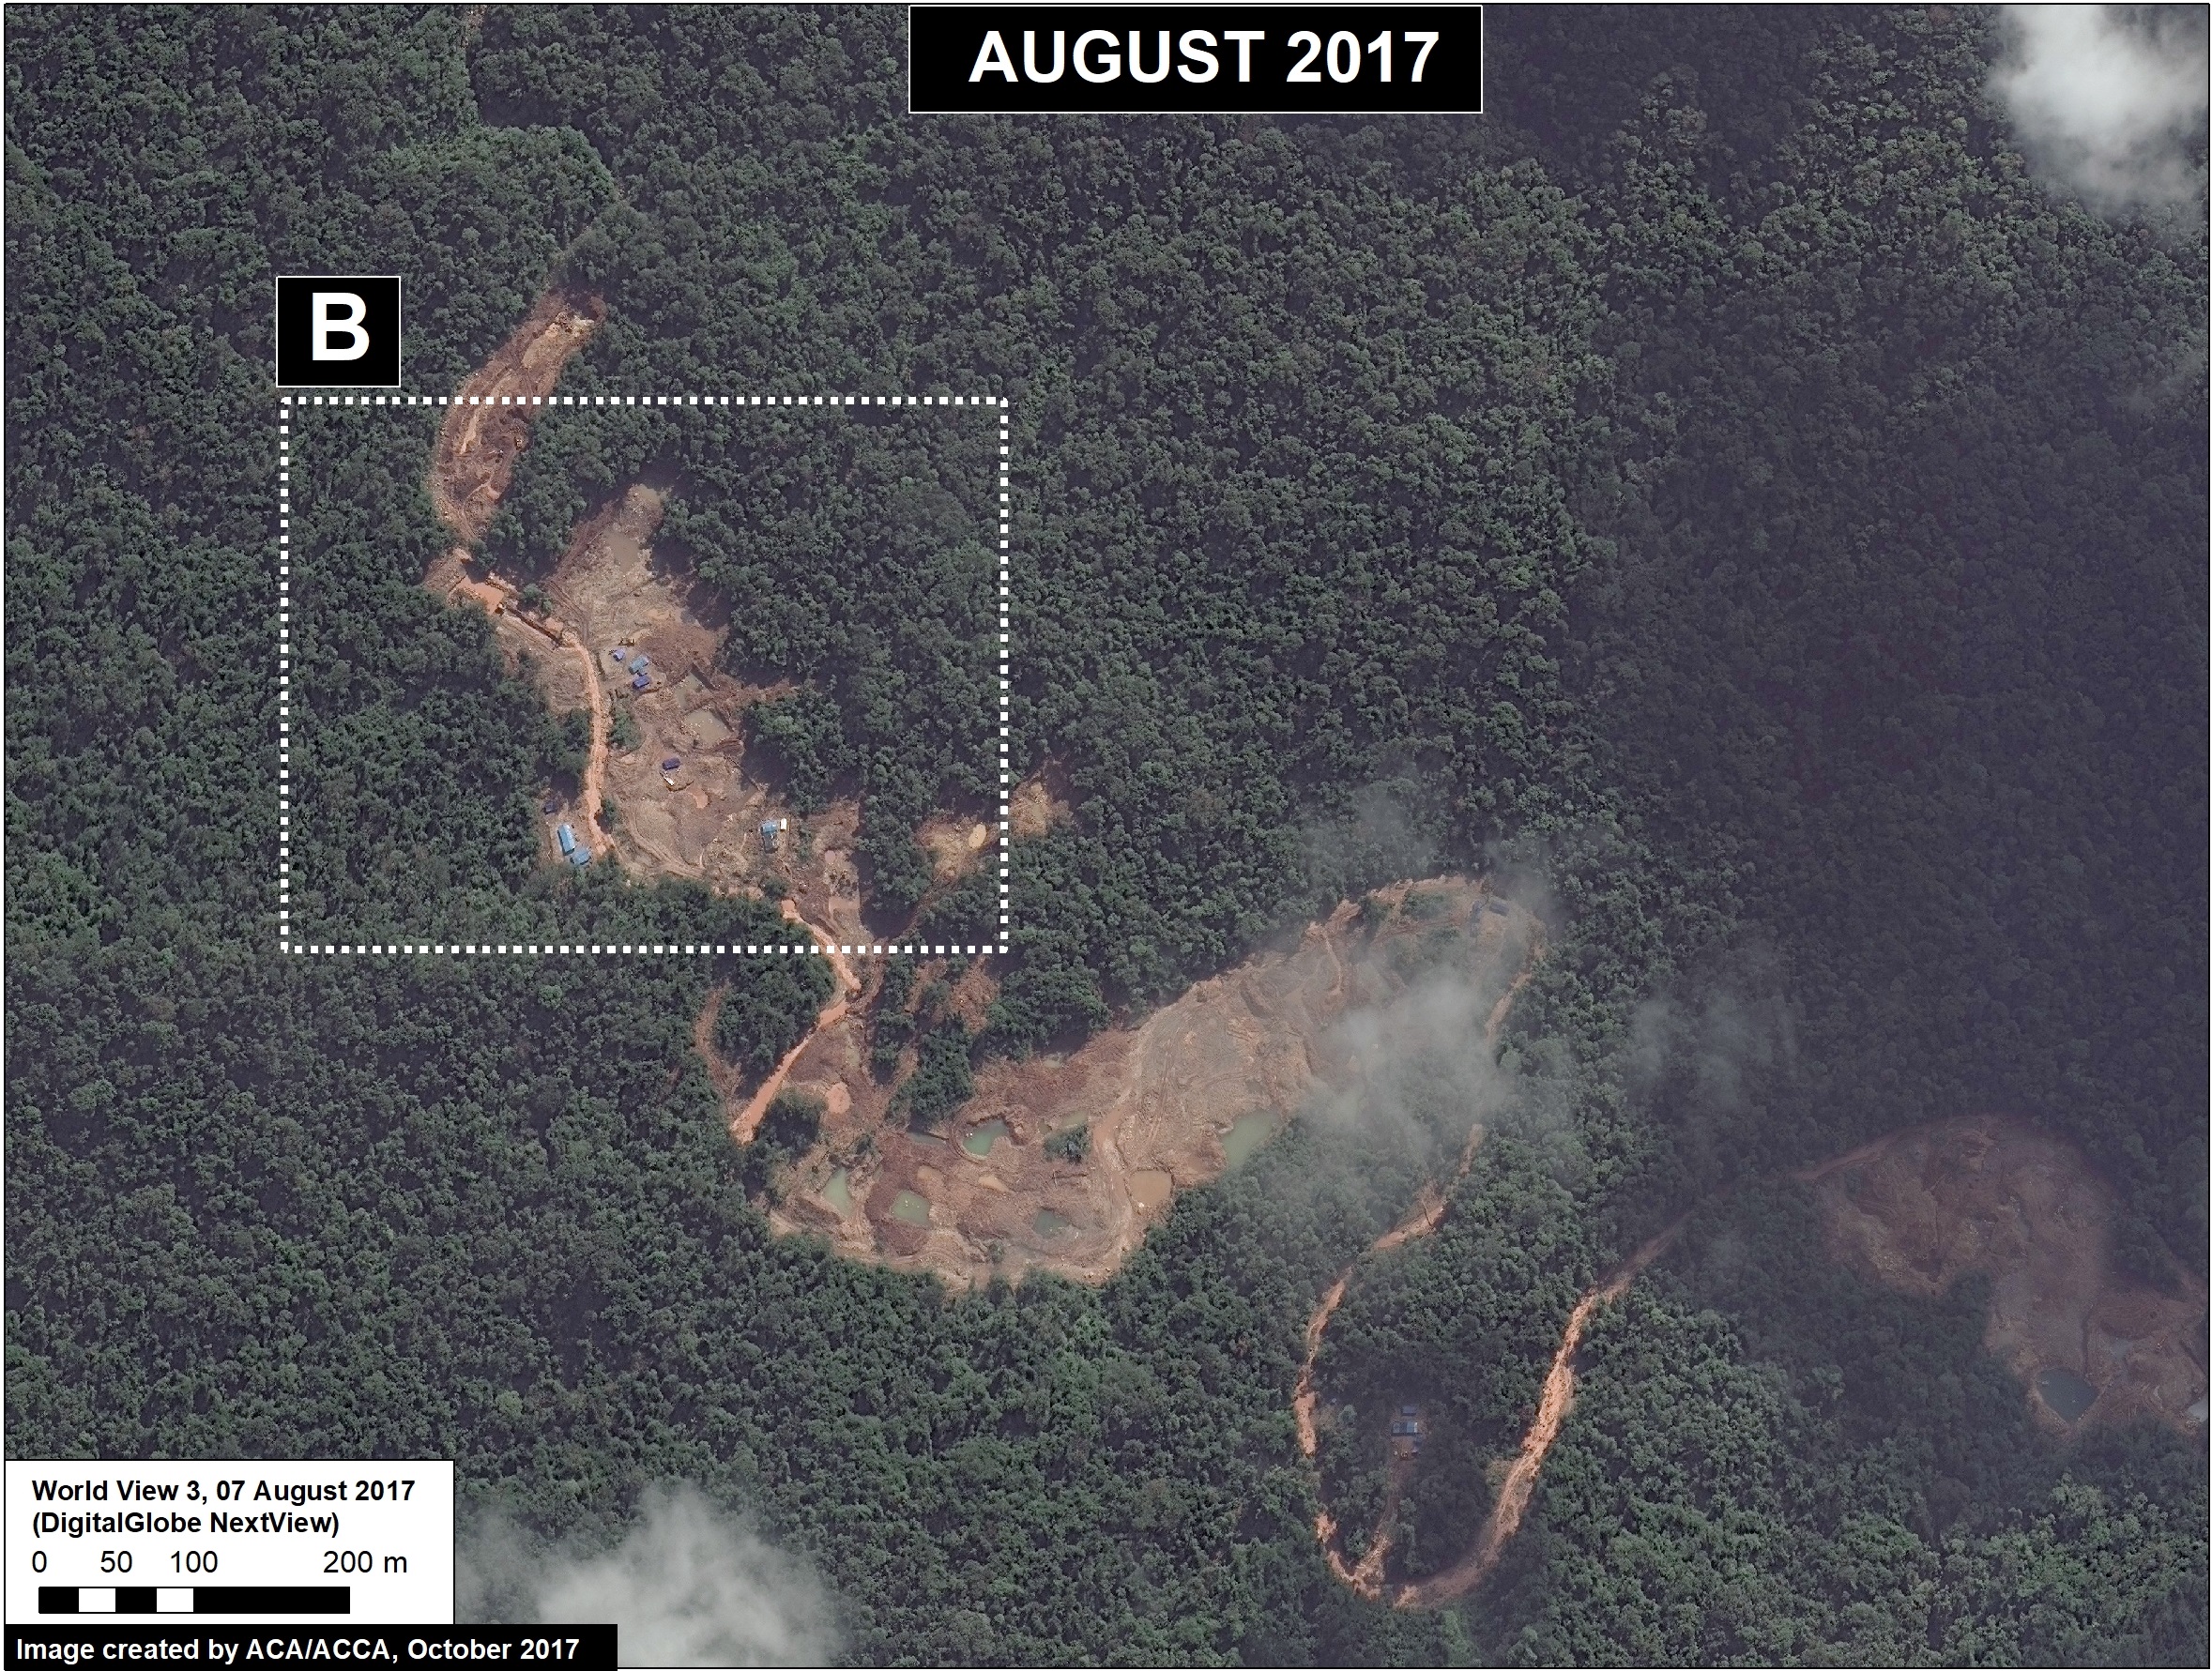
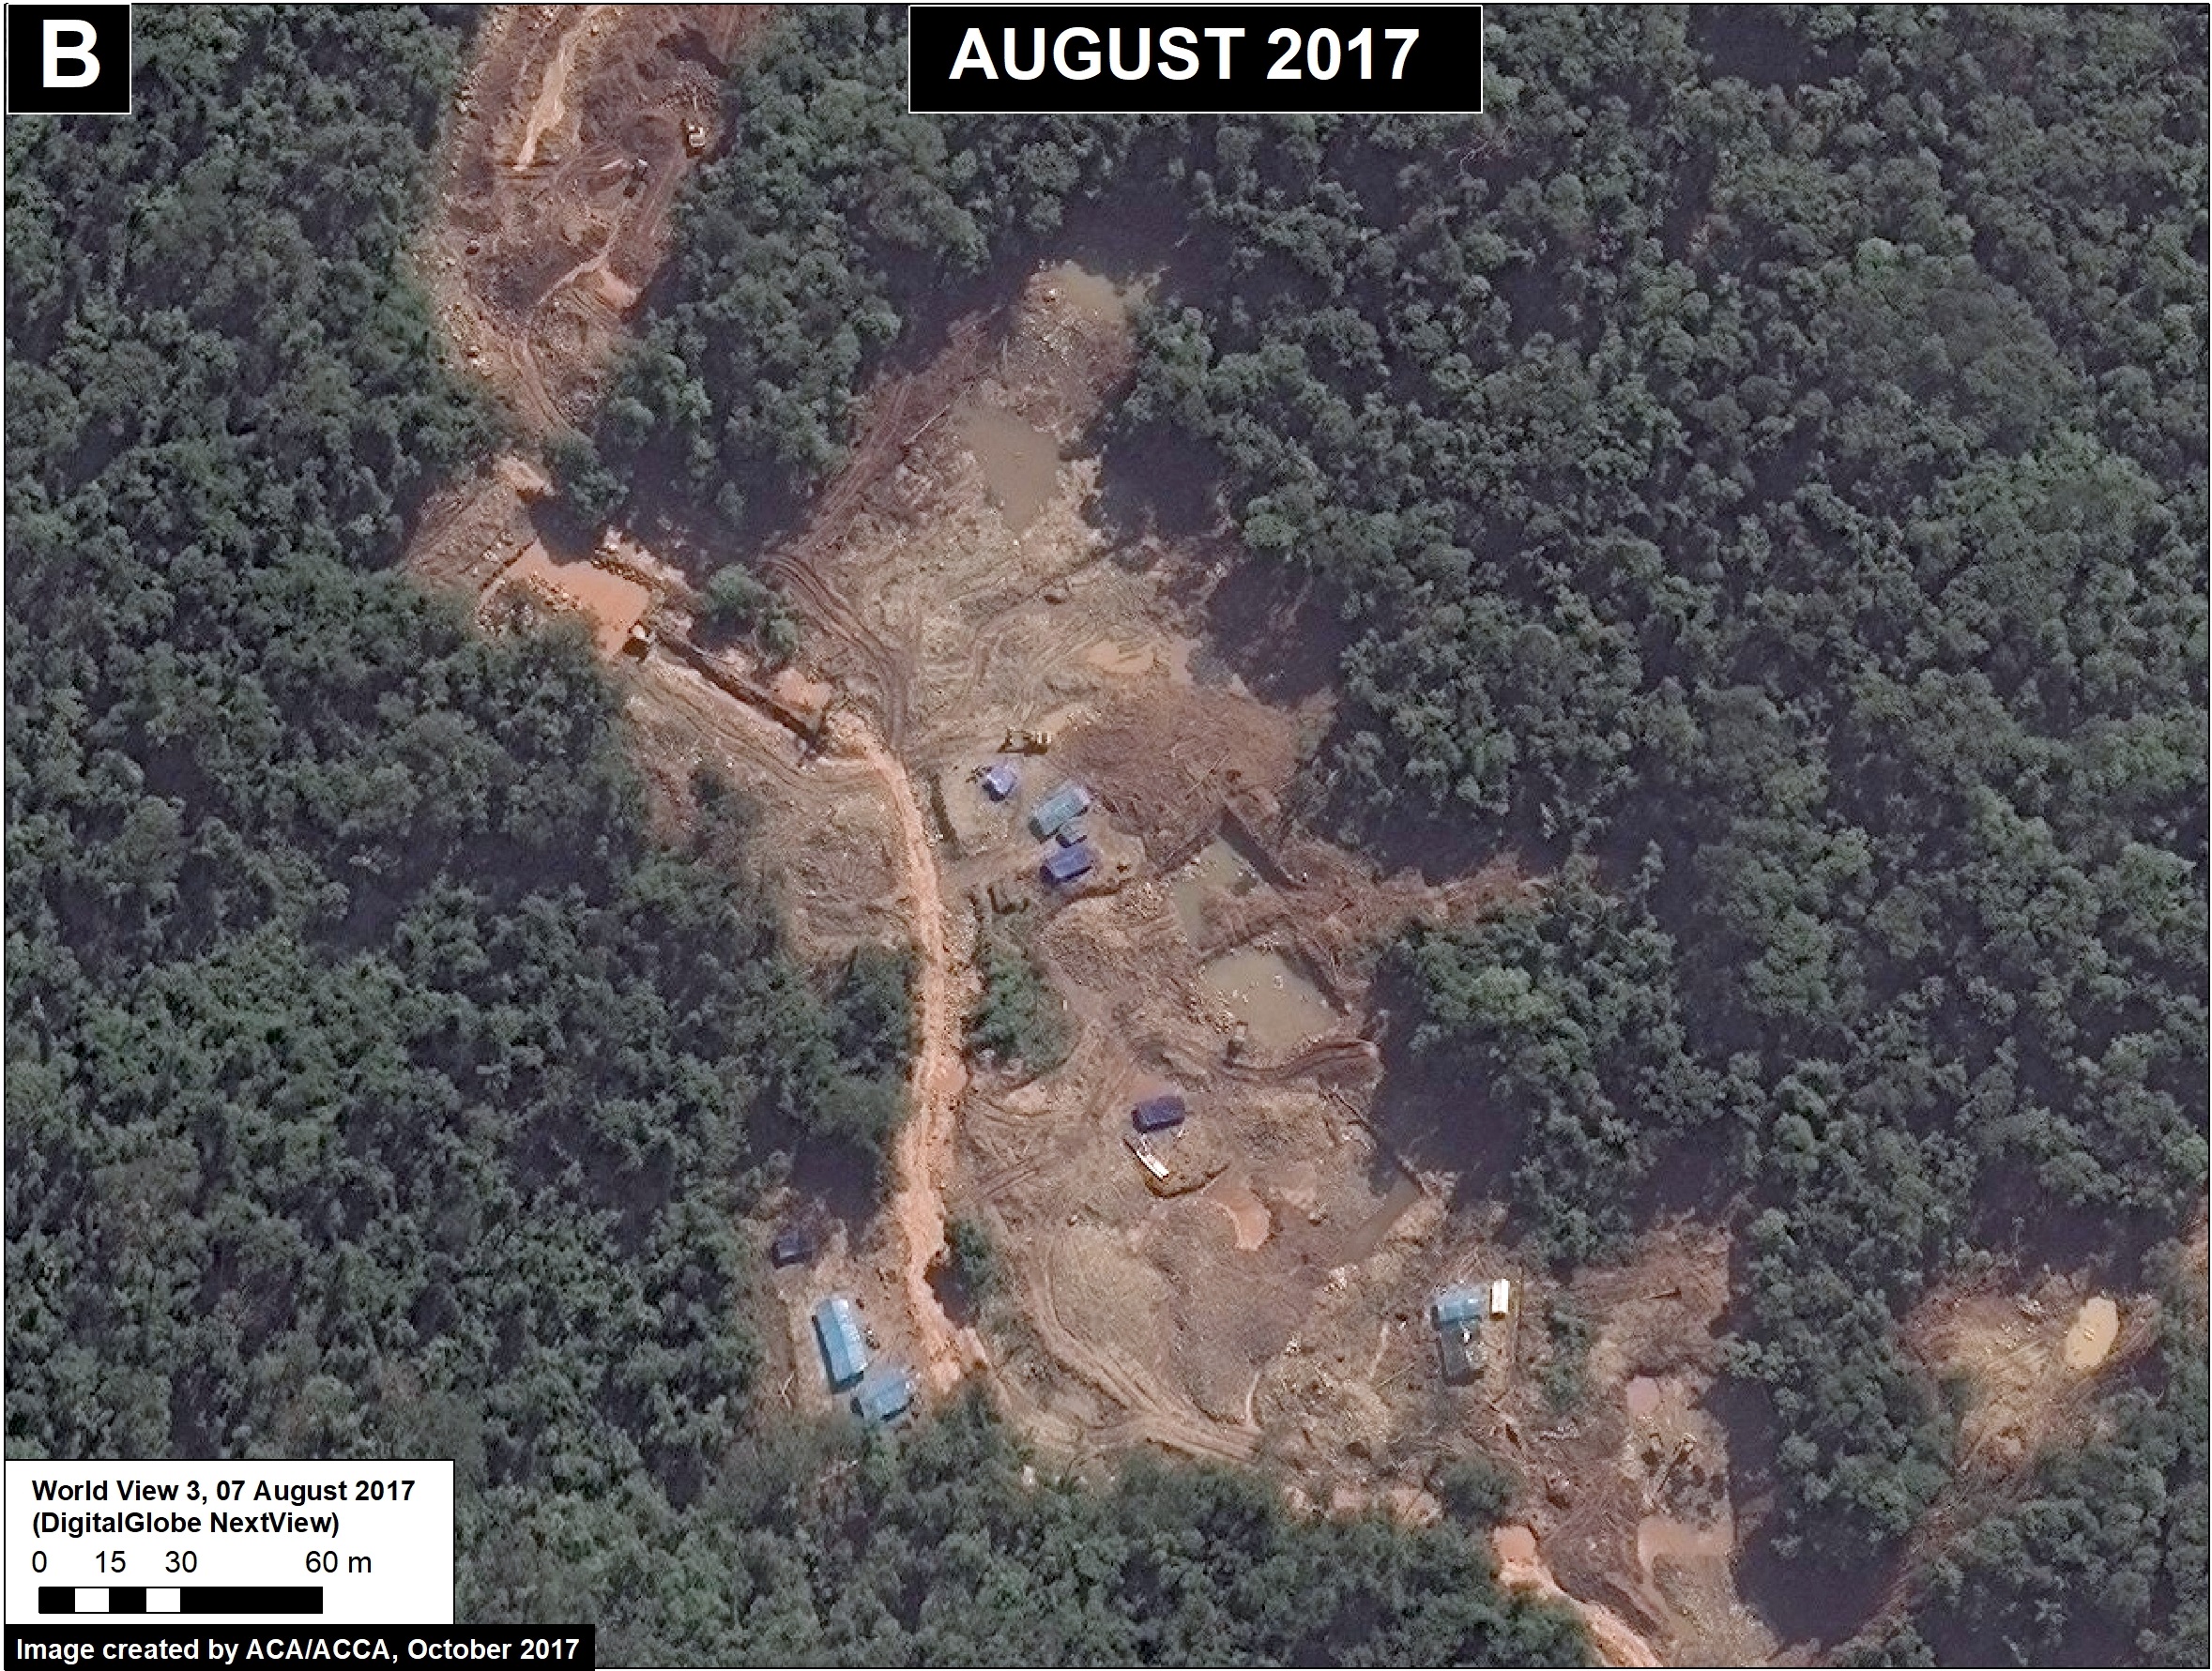
Finally, we show two extraordinary high resolution images (0.38 meters) of the latest gold mining activity closest to the Communal Reserve. In the images, gold mining ponds, heavy machinery, and mining camps are clearly seen.

Source: DigitalGlobe 2017 (Nextview)

Reference

Planet Team (2017). Planet Application Program Interface: In Space for Life on Earth. San Francisco, CA. https://api.planet.com

Citation

Finer M, Novoa S (2017) Gold Mining Threatens the Amarakaeri Communal Reserve, Again. MAAP: 71.

MAAP #70: “Hurricane Winds” in the Peruvian Amazon, a 13 Year Analysis

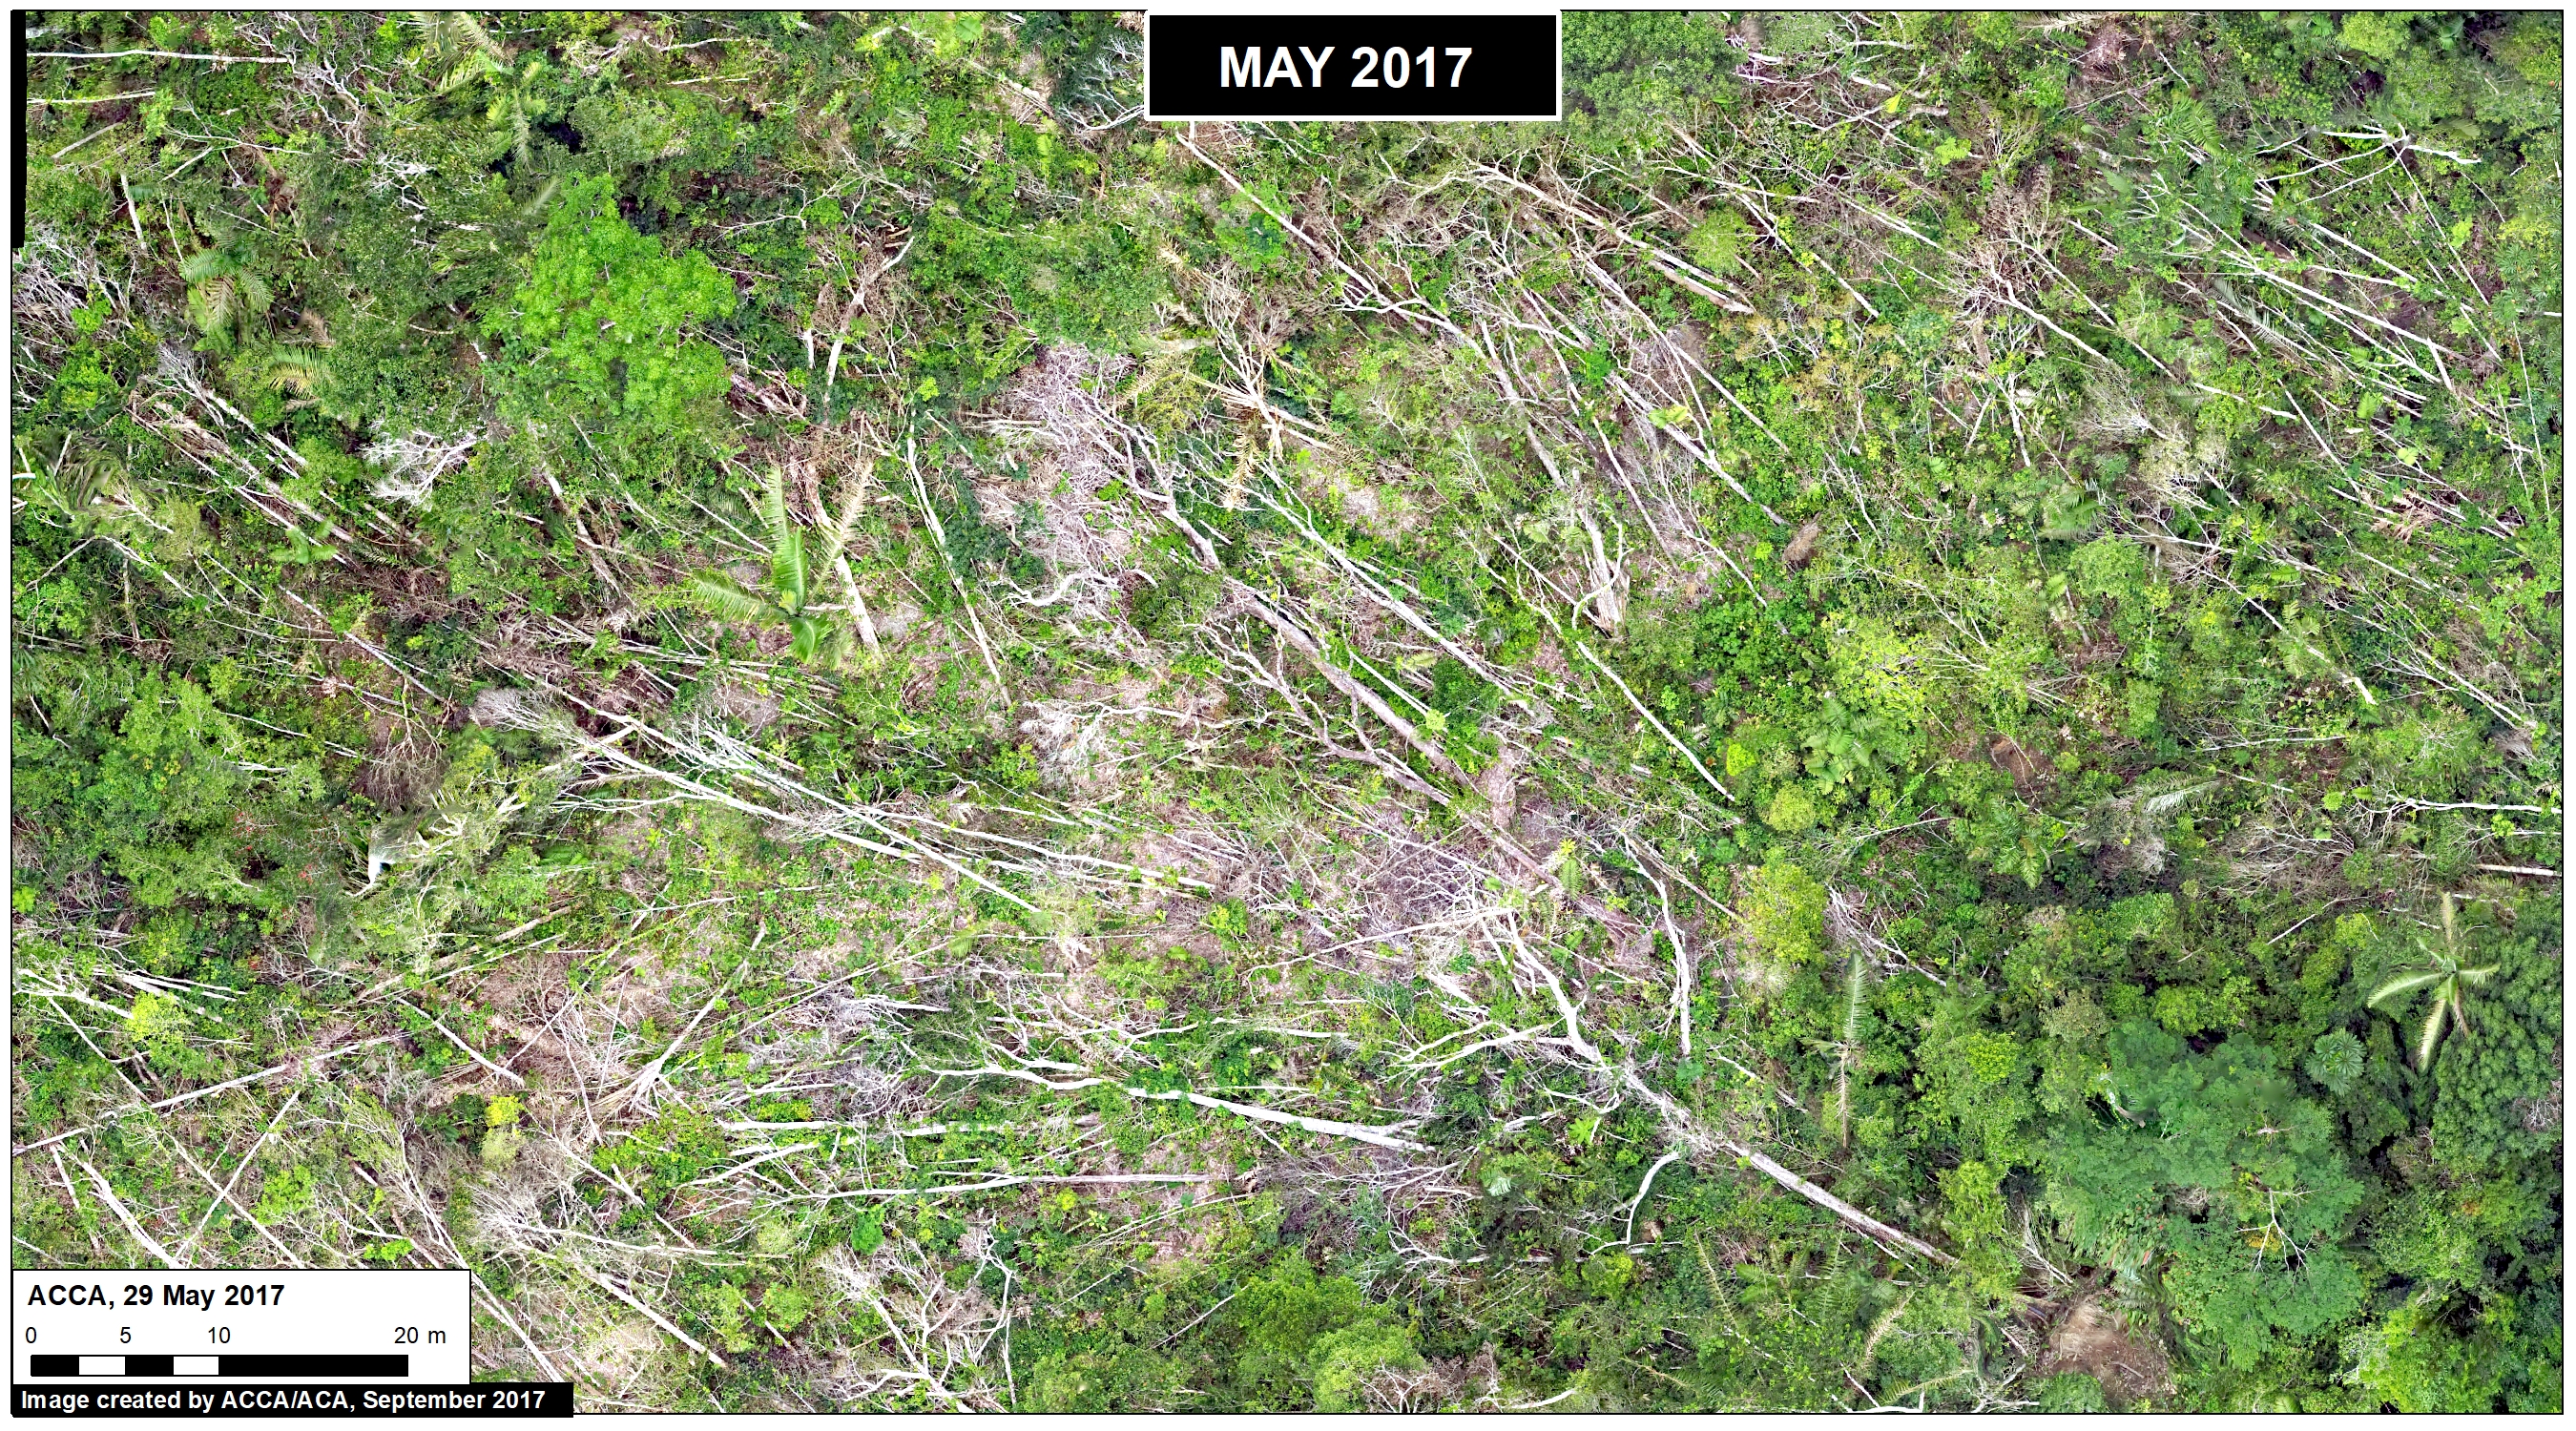
In an earlier report, MAAP #54, we described the natural phenomenon of “hurricane winds” in the Peruvian Amazon. These strong wind storms (not true hurricanes) cause a chain reaction of fallen trees and may blow down hundreds of acres of Amazonian forest (see Drone Image below).

This report presents an analysis of the frequency and intensity of hurricane winds in the Peruvian Amazon over the past 13 years (2005-17). The analysis is based on the annual forest loss data and early warning alerts data.

Drone Image. Source: ACCA

Temporal Patterns

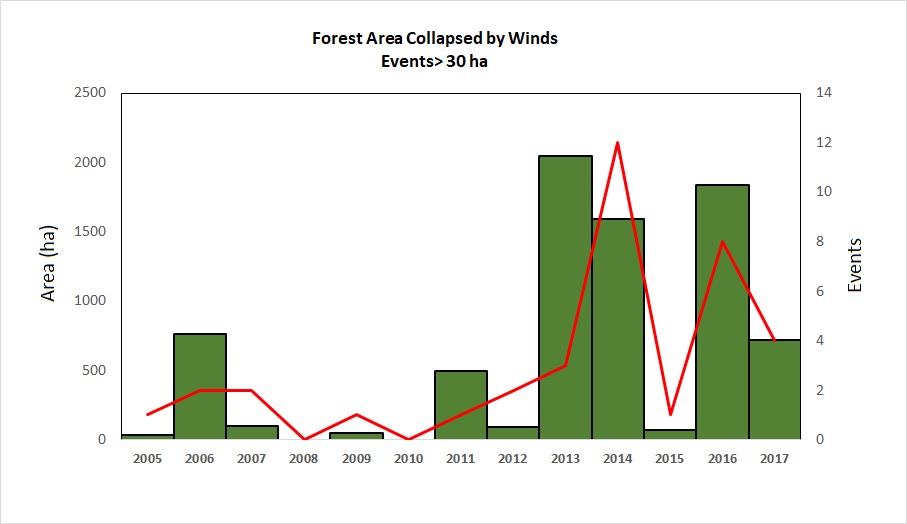
Graph 70 shows the temporal patterns for two important annual variables: Number of hurricane wind events (red line) and the total forest blowdown area (green bars). We found a total of 37 hurricane wind events resulting in the blowdown of 19,275 acres (7,800 hectares) between 2005 and 2017 in the Peruvian Amazon. Note the major increase in 2013, 2014, and 2016; these three years account for two-thirds of the total events and blowdown area.

Graph 70. Data: MAAP.

Spatial Patterns

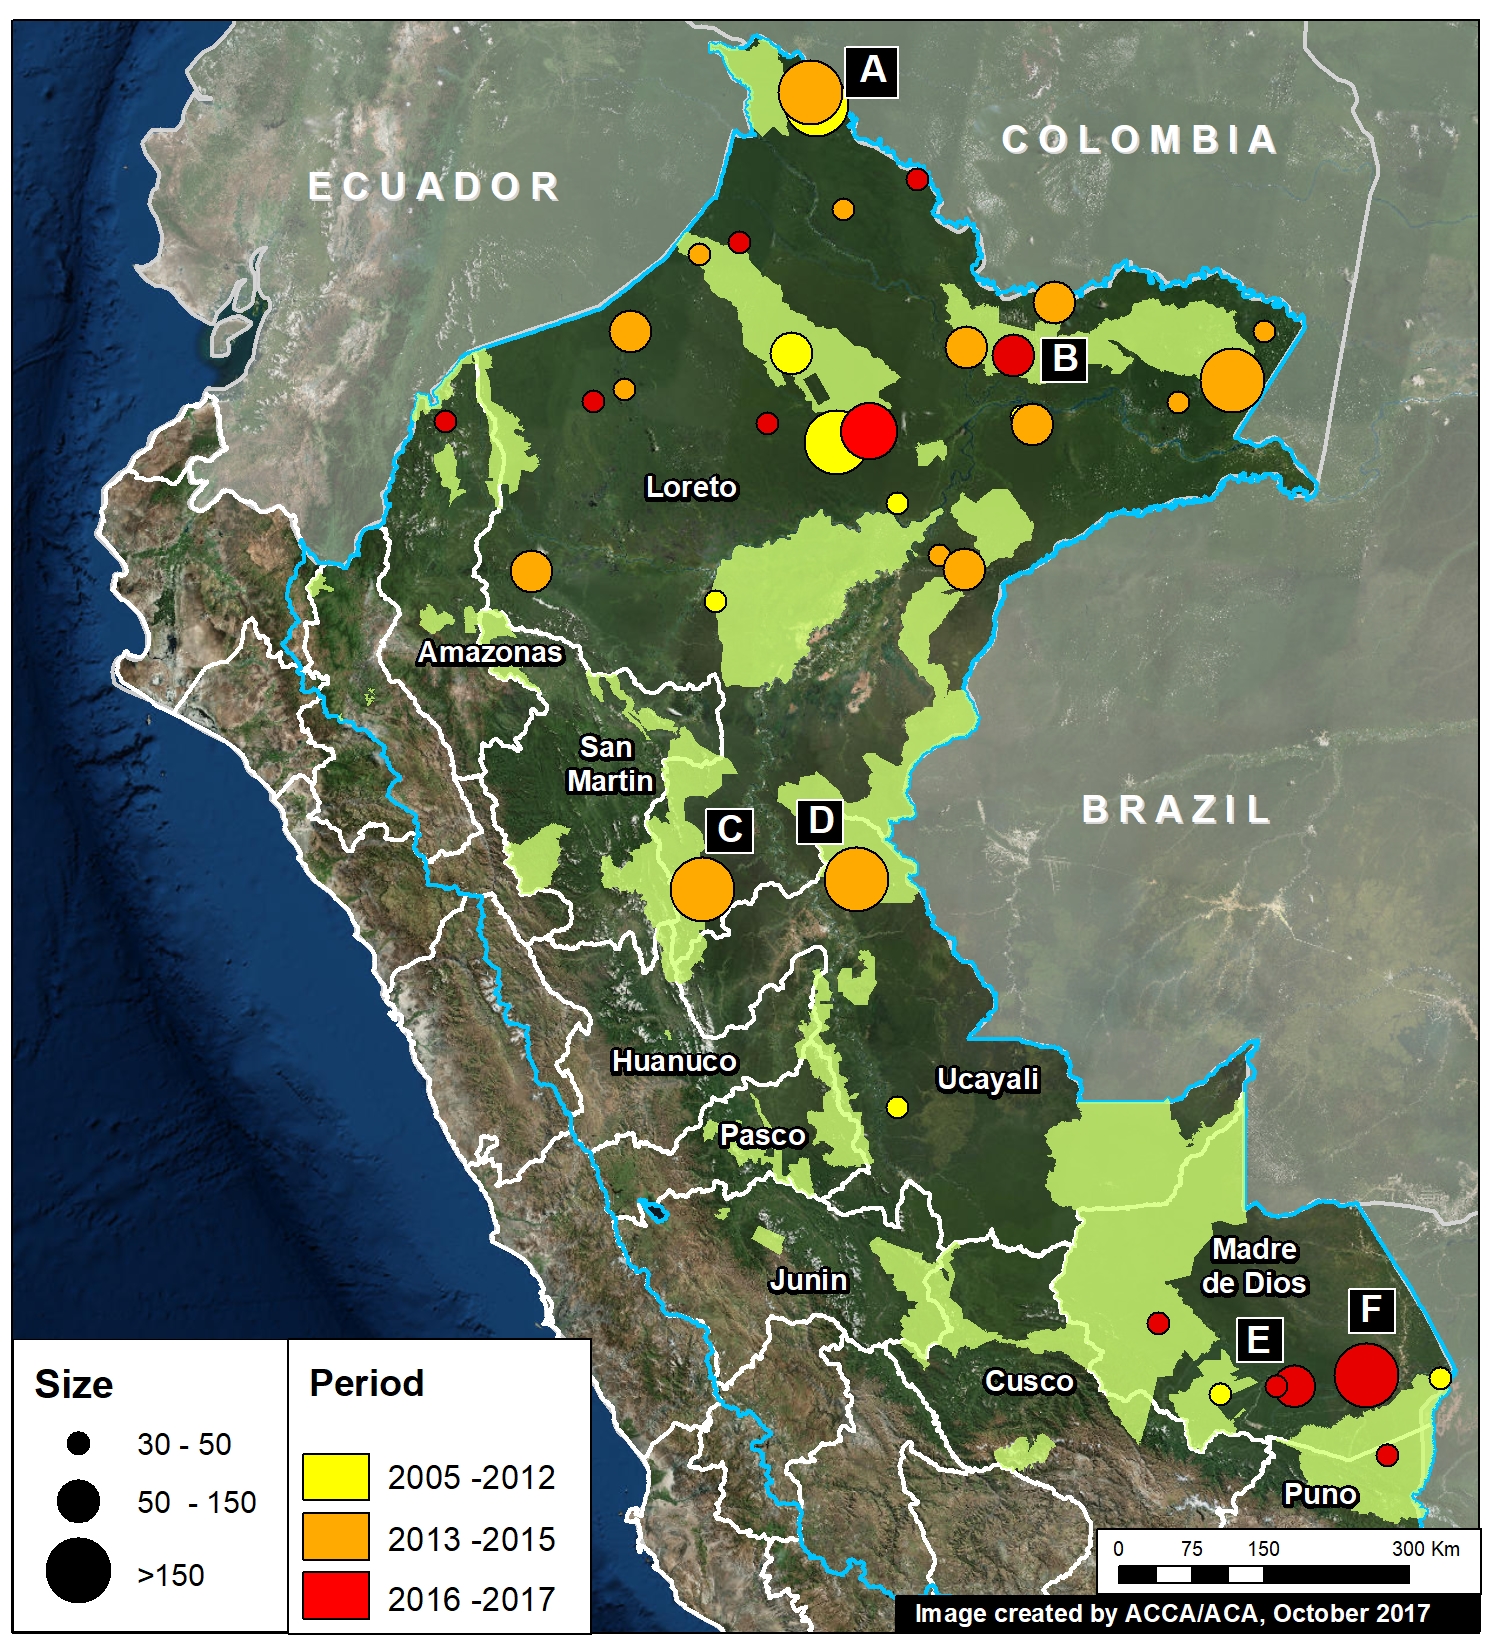
Image 70. Data: MAAP, SERNANP

Image 70 shows the spatial patterns of the hurricane winds. Note the following highlights:

– Most of the events occurred in the regions of Loreto and Madre de Dios.

– In Loreto, most of the events occurred since 2013; in Madre de Dios, most occurred since 2016.

– There were 7 major events over 150 hectares (370 acres) each. The largest of these events was 2,255 acres (912 hectares).


Satellite  Images

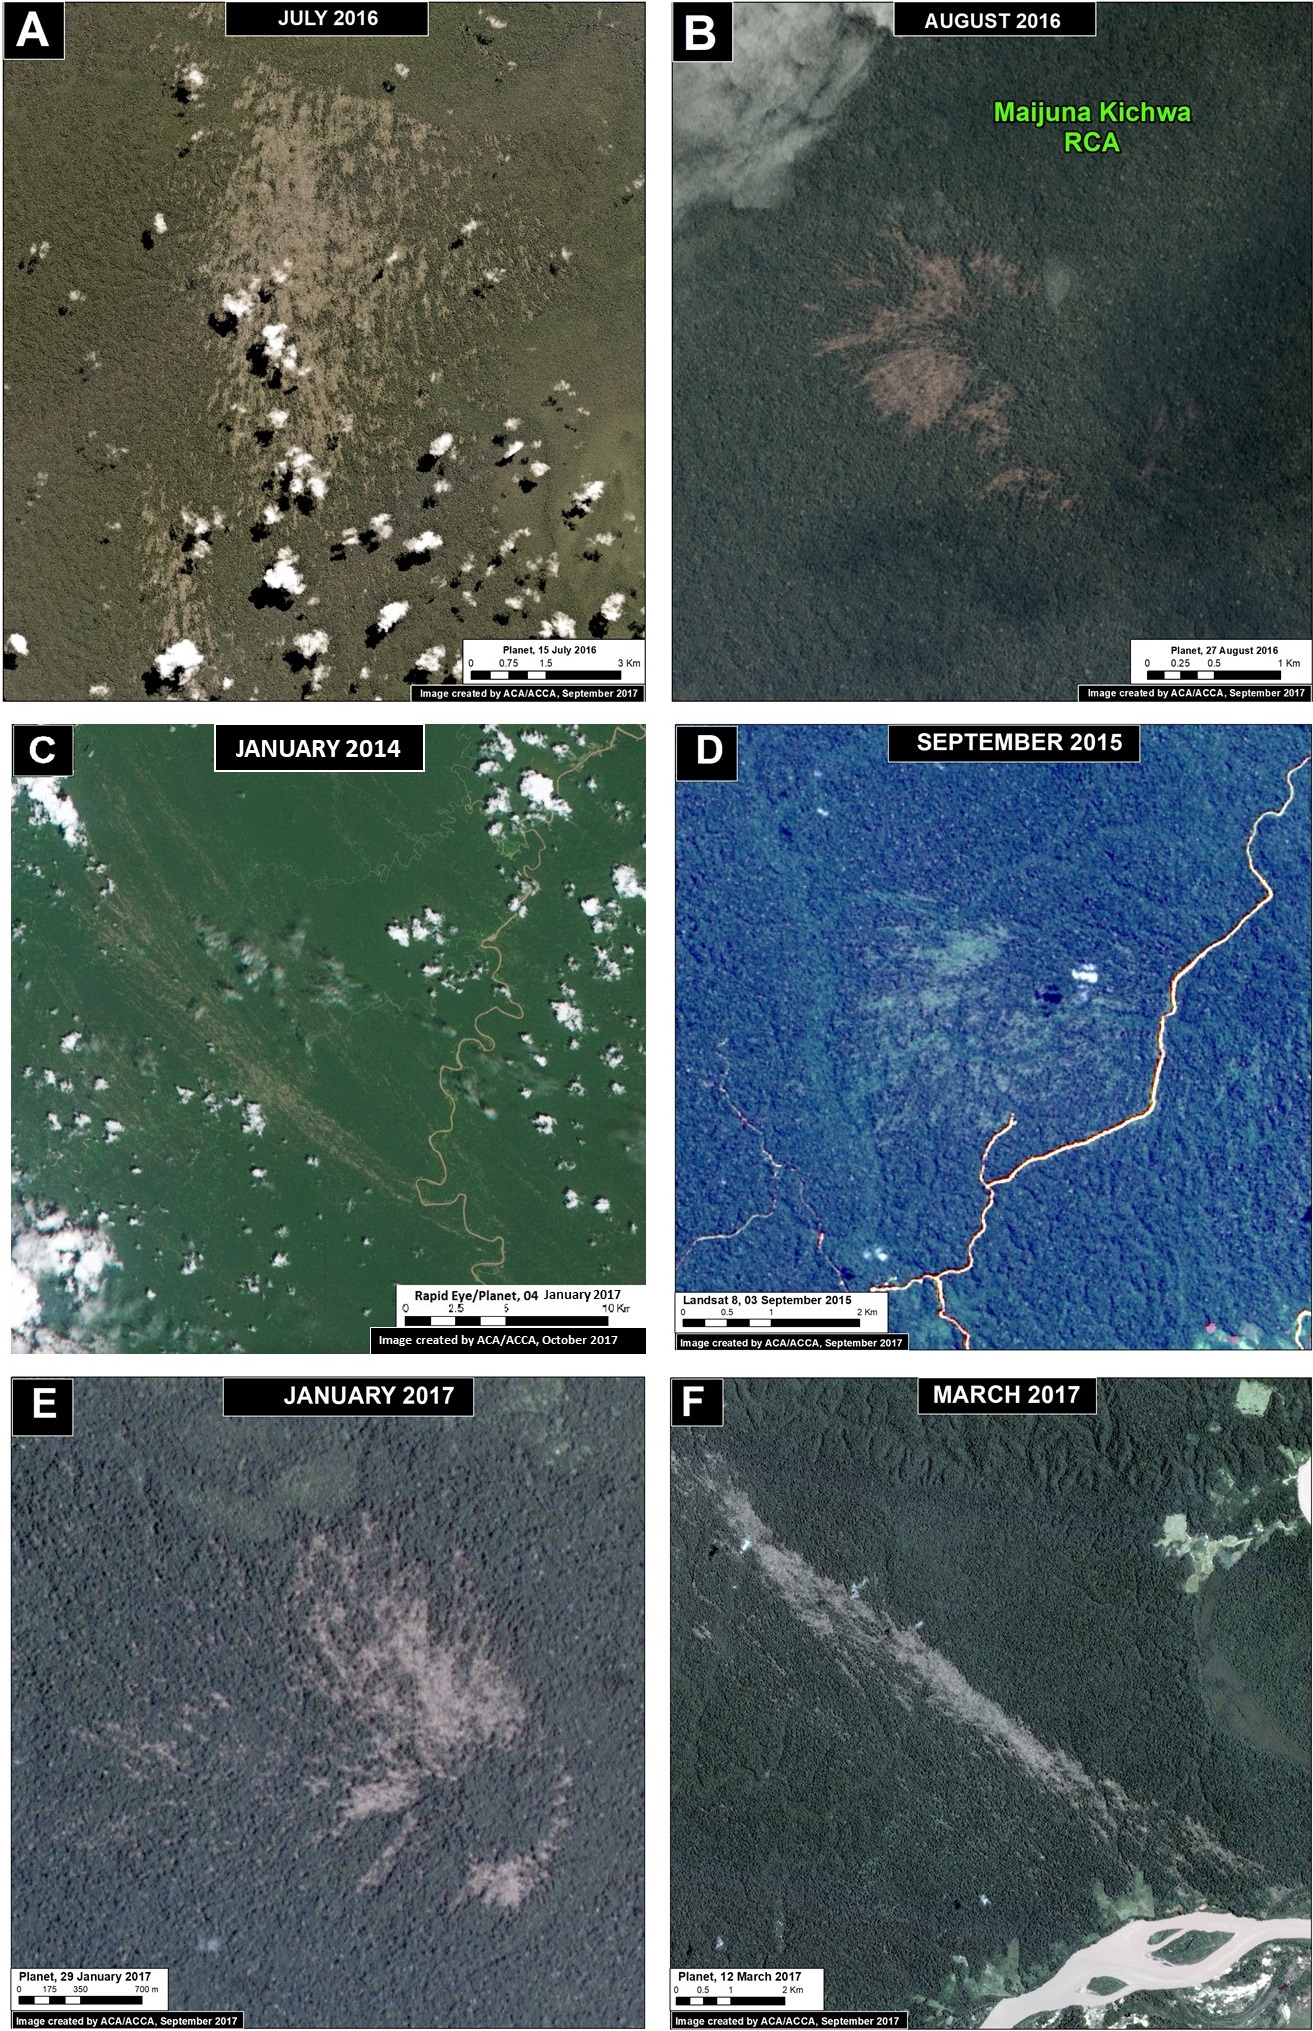
Below, we show satellite images of some of the major hurricane wind events. The letters (A-F) correspond the the locations in Image 70.

Data: Planet, NASA/USGS

Methodology

  1. To determine the natural forest loss areas, we utilized the forest loss data from the GEOBOSQUES’ portal of the PNCBCC – MINAM, as well as the forest loss data from the University of Maryland, through their Global Forest Change portal that provides data from 2001 – 2015. We decided to evaluate both database due to the different criteria for excluding areas in remote locations. For the analysis, it was only considered events resulting in forest loss of 30 hectares or higher.
  2. We determined the natural forest loss through the visual interpretation of the fan-shaped pattern of these natural phenomena. This pattern was then validated with the high and medium resolution images from the years where the loss were detected.
  3. Identifying the period in the year where these events happened, for the years 2015, 2016 and 2017 was determined initially under the Julian calendar that is compatible with the table of attributes of the forest loss database. Consequently, we utilized major series of continuous high resolution images to reduce the timeframe in which these event could have occurred.

References

Planet Team (2017). Planet Application Program Interface: In Space for Life on Earth. San Francisco, CA. https://api.planet.com.

Citation

Novoa S, Finer M (2017) Hurricane Winds in the Last 12 Years in Peru. MAAP: 70.

MAAP #69: Alarming Deforestation Patterns in the Central Peruvian Amazon

Image 69. Base Map.

Thanks to early warning forest loss alerts (known as GLAD), we recently detected several alarming new deforestation patterns within remote, primary forest of the central Peruvian Amazon.

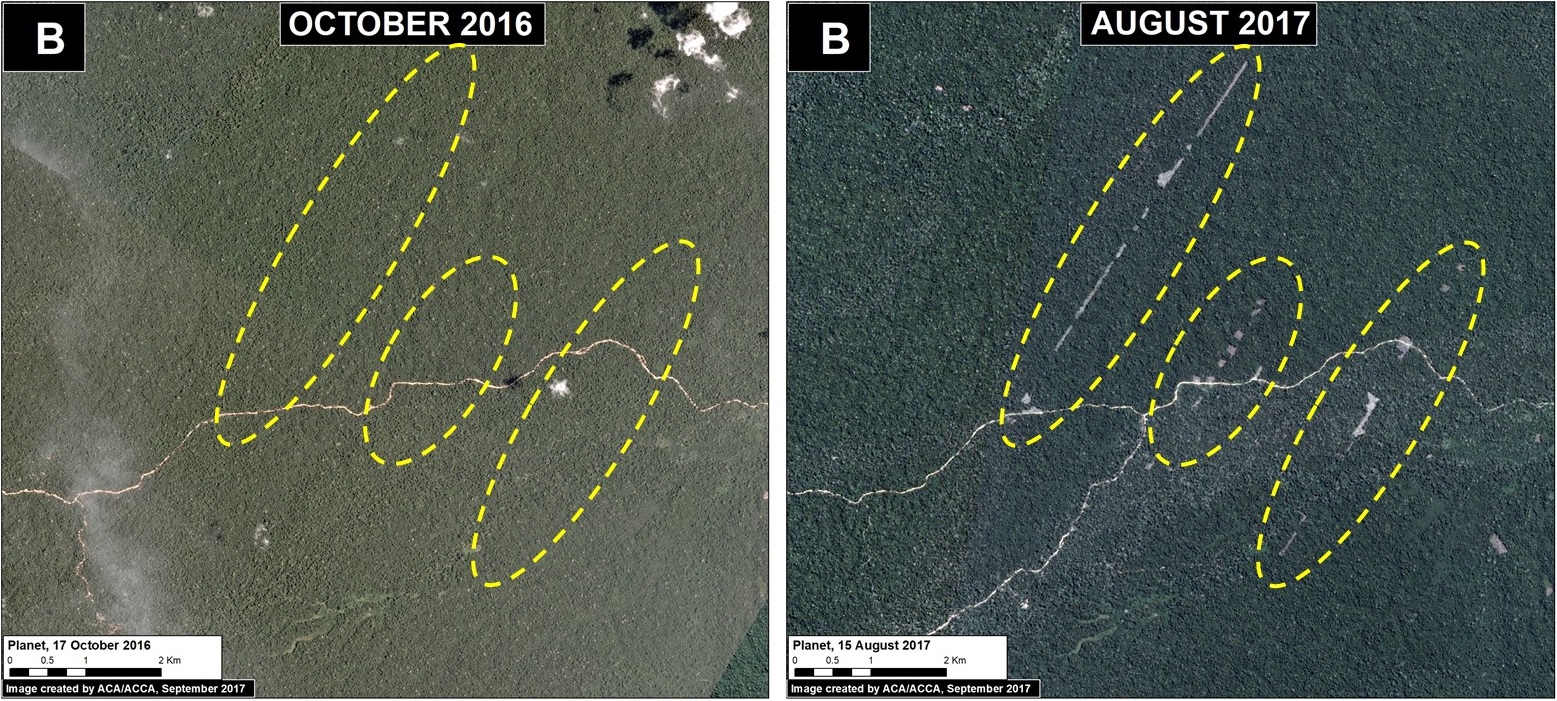
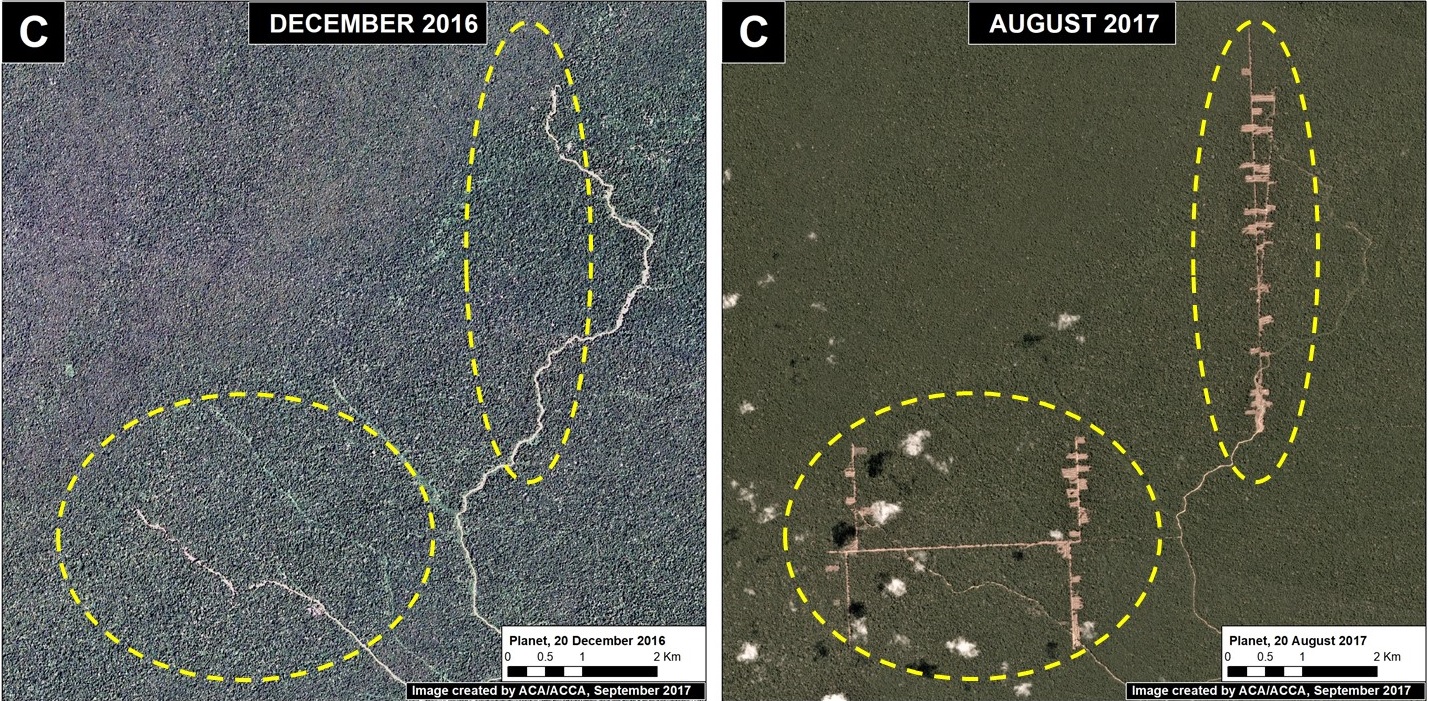
They appear to be related to medium or large-scale agricultural activities due to their distinct characteristics: straight access paths extending from secondary roads built deep into primary forest, and deforestation of rectangular/square plots.

These patterns are significant because they are very different than the usual patterns observed with small-scale agriculture in the Peruvian Amazon: scattered plots with no major linear features.

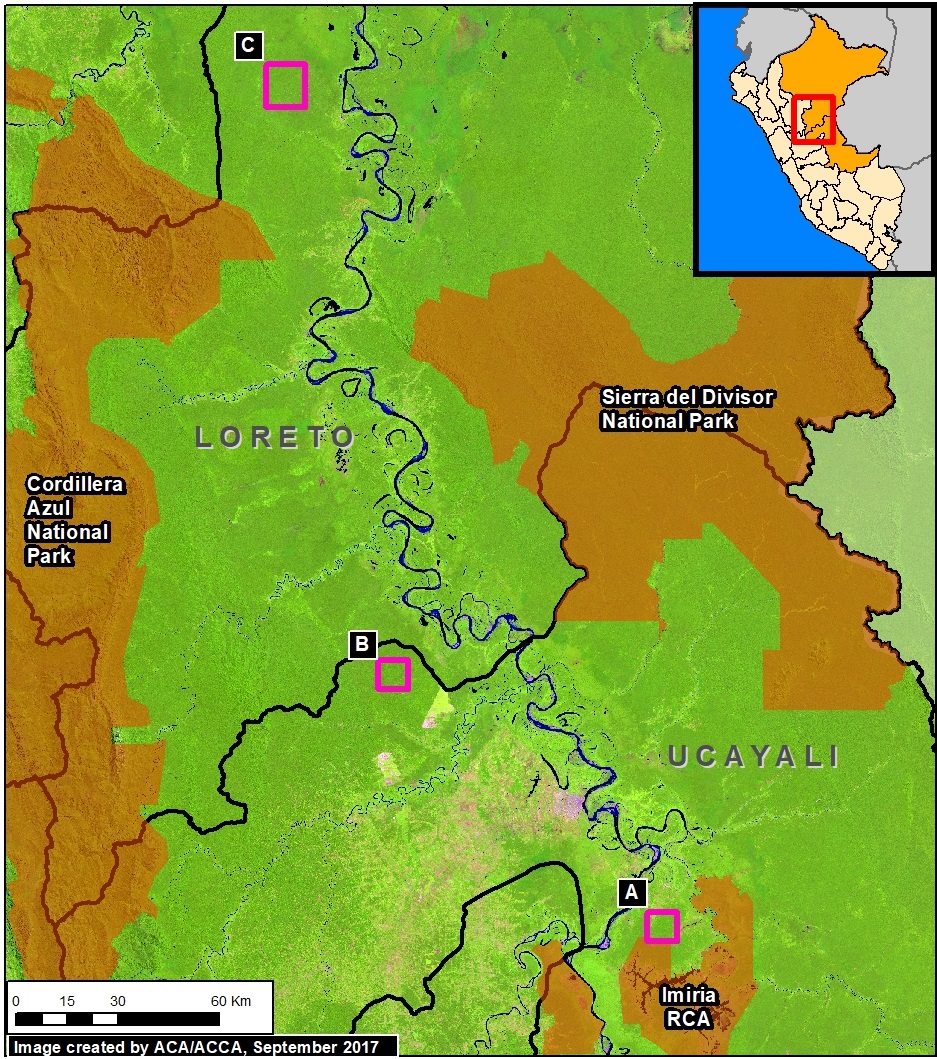
Here, we show satellite images of 3 areas in the central Peruvian Amazon (see Base Map) that have recently experienced these alarming patterns, and deserve urgent attention due to the threat of rapid deforestation of large swaths of primary forest.*


North of Imiria Regional Conservation Area (Ucayali)

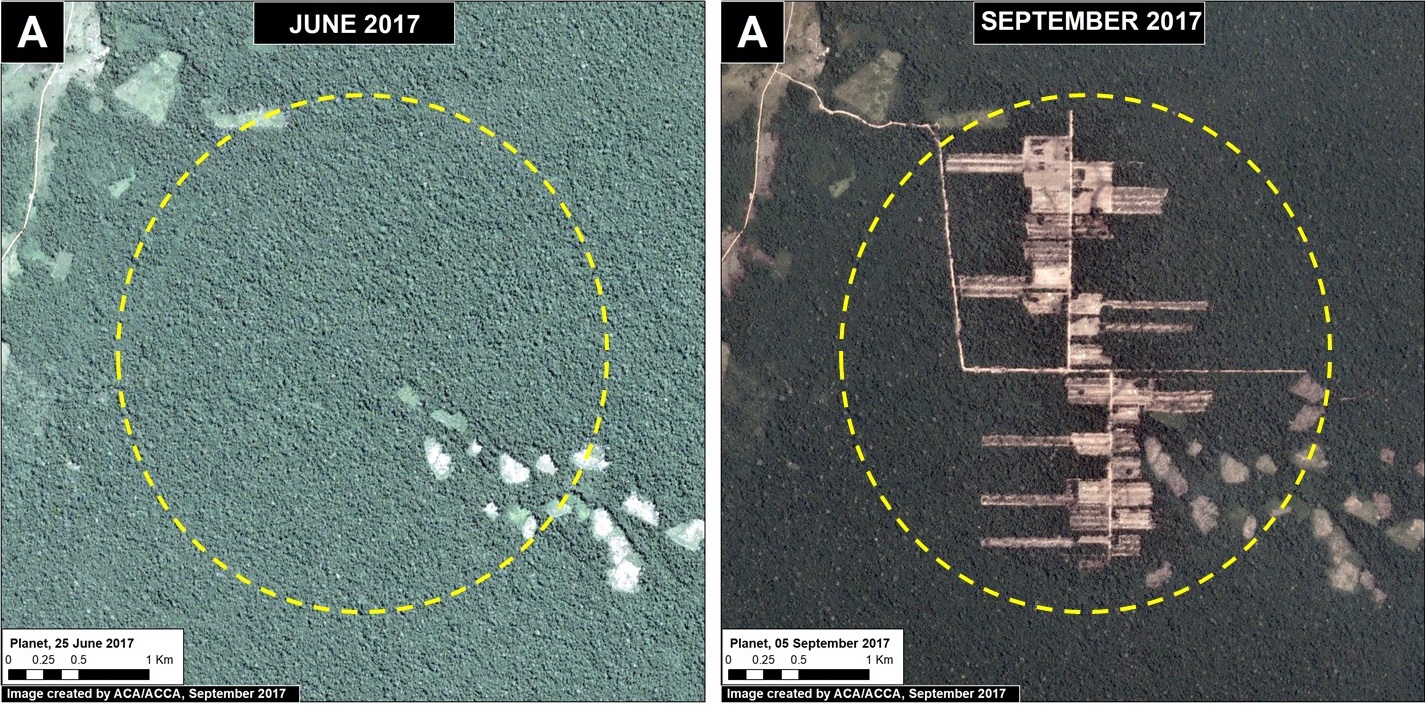
Image 69a. Data: Planet

Just north of Imiria Regional Conservation Area (Ucayali region), we documented the construction of a new access road and deforestation of 445 acres (180 hectares) of primary forest between June and September 2017 (Image 69a). In the September image (right panel), the linear features of the access path and agriculture plots are clearly seen. It also appears that there is much potential for continued deforestation into the surrounding primary forest. Sources indicate that this deforestation is linked to a farming association, however it is not yet known for what type of crop. The deforestation is only 2 km away from the Imiría Regional Conservation Area.

Nueva Requena (Ucayali)

Image 69b. Data: Planet

In the remaining primary forests of the Nueva Requena district (Ucayali region), we documented the clearing of three linear paths, totaling 9 km, and the subsequent deforestation of 188 acres (76 hectares) (Image 69b). These paths are located within national forestry lands (known as Permanent Production Forest), indicating that the new deforestation is part of an illegal invasion. It is important to note that this area was recently in the news regarding the killing of six farmers over land rights dispute and is close to controversial large-scale oil palm projects (MAAP #41).

Orellana (Loreto)

Image 69c. Data: Planet

Further north, near the town of Orellana (Loreto region), we documented the rapid clearing of a series of linear paths, totaling 19 km, followed by the deforestation of 255 acres (104 hectares) of primary forest (Image 69c). Note the deforestation in the form of numerous rectangular plots. As in the above examples, there is much potential for continued deforestation into the surrounding primary forest.

Notes

*According to the Supreme Decree (No. 018-2015-MINAGRI) approving the Regulations for Forest Management under the framework of the new 2011 Forestry Act (No. 29763), the official definition of primary forest in Peru is: “Forest with original vegetation characterized by an abundance of mature trees with species of superior or dominant canopy, which has evolved naturally.” Using methods of remote sensing, our interpretation of that definition are areas that from the earliest available image are characterized by dense closed-canopy coverage and experienced no major clearing events.

Reference

Planet Team (2017). Planet Application Program Interface: In Space for Life on Earth. San Francisco, CA. https://api.planet.com

Special Thanks

We would like to express our gratitude to Michael Valqui for his contributions during the preparation of this article.

Citation

Finer M, Novoa S (2017) New Alarming Deforestation Patterns in the Central Peruvian Amazon. MAAP: 69.

MAAP #68: 2017 DEFORESTATION HOTSPOTS IN THE PERUVIAN AMAZON (Part 2)

Image 68. Base map. Data: PNCB/MINAM, UMD/GLAD, SERNANP.

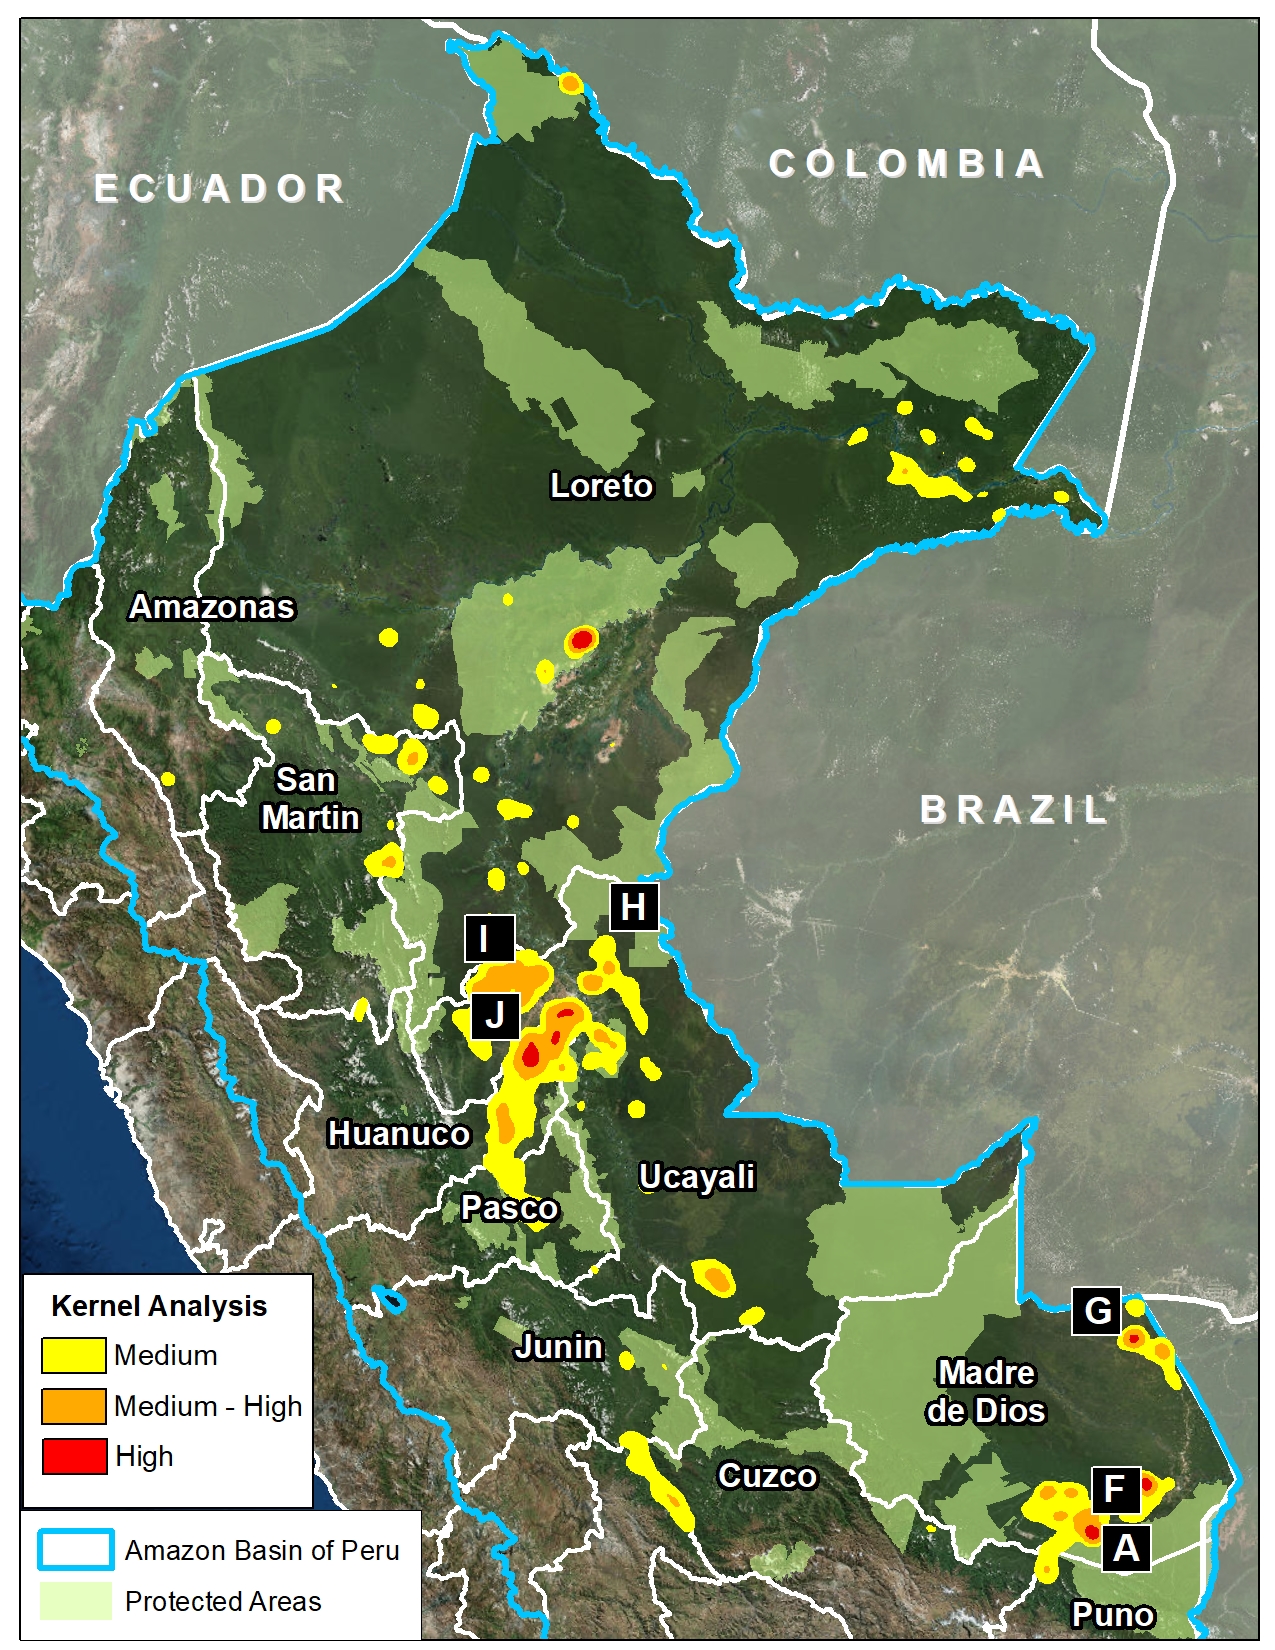
In a previous report, MAAP #65, we presented information about deforestation hotspots in 2017 in the Peruvian Amazon, based on early warning alert data from January until mid-July.

Between July and August, the amount of alerts greatly increased, likely due to arrival of the dry season. Thus, this report includes new updated data until mid-August.*

We find new deforestation hotspots in the regions of Madre de Dios and Ucayali (see base map).** At the national level, we now estimate the forest loss of 111,200 acres (45,000 hectares) thus far in 2017 (thru August 17).***

Below, we present satellite imagery of the following hotspots:

– La Pampa, Madre de Dios (Inset A)
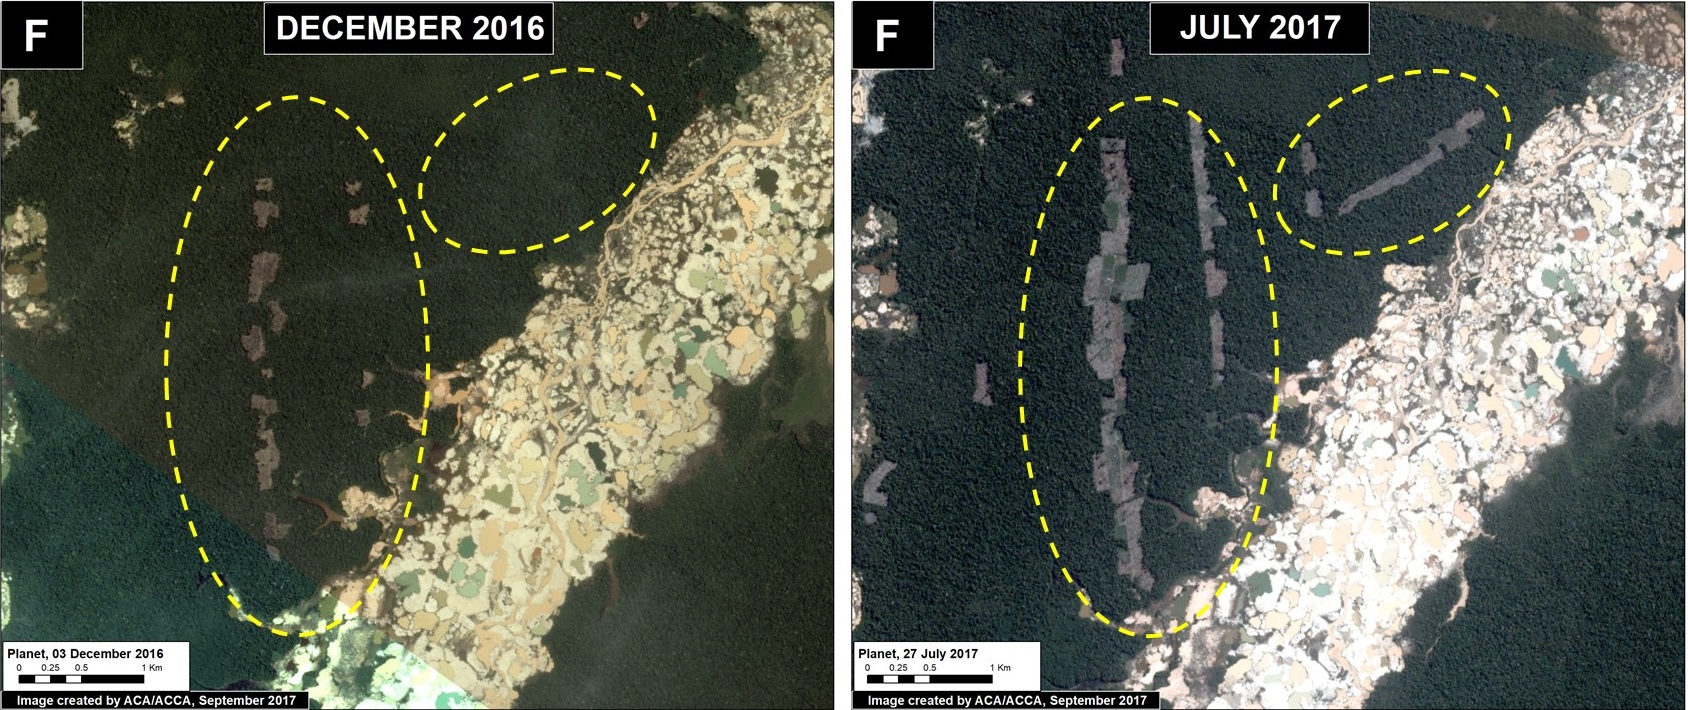
– Guacamayo, Madre de Dios (Inset F)
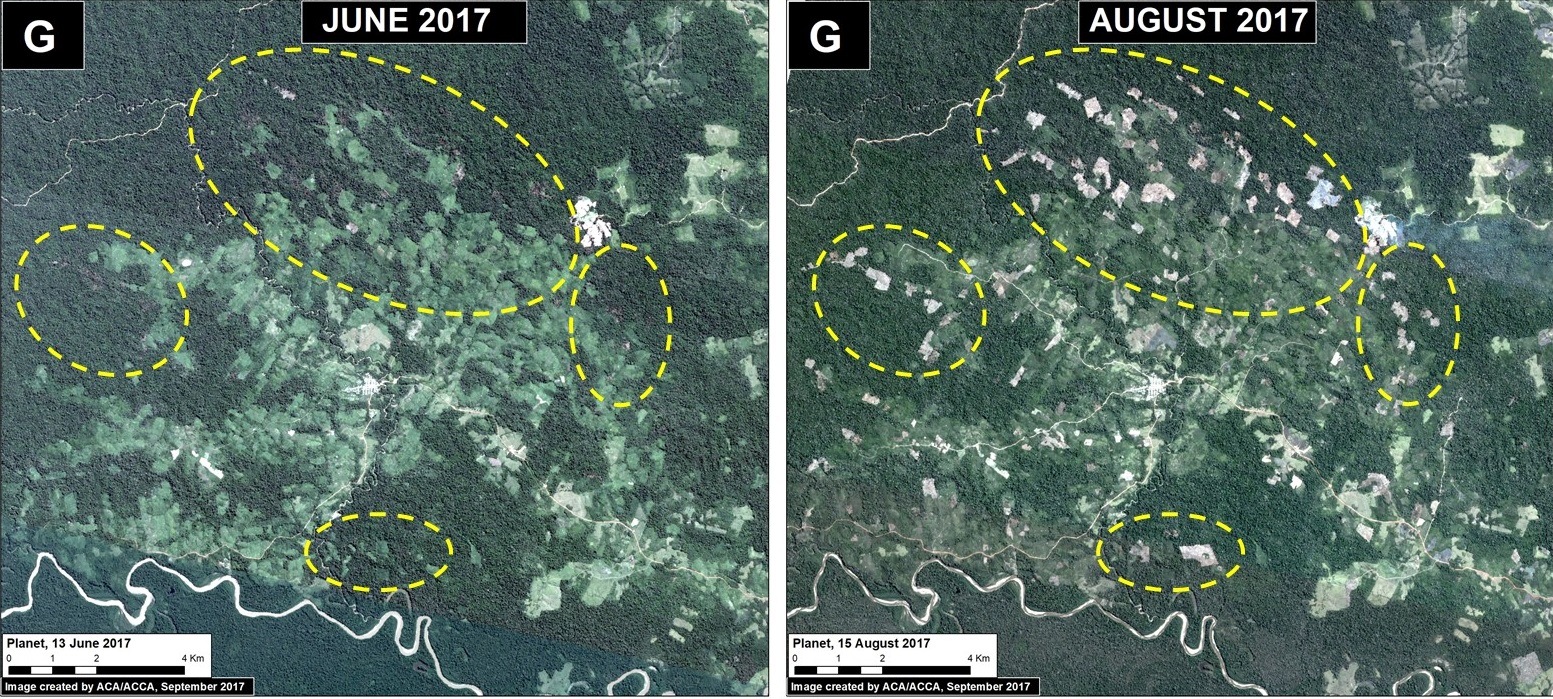
– Iberia, Madre de Dios (Inset G)
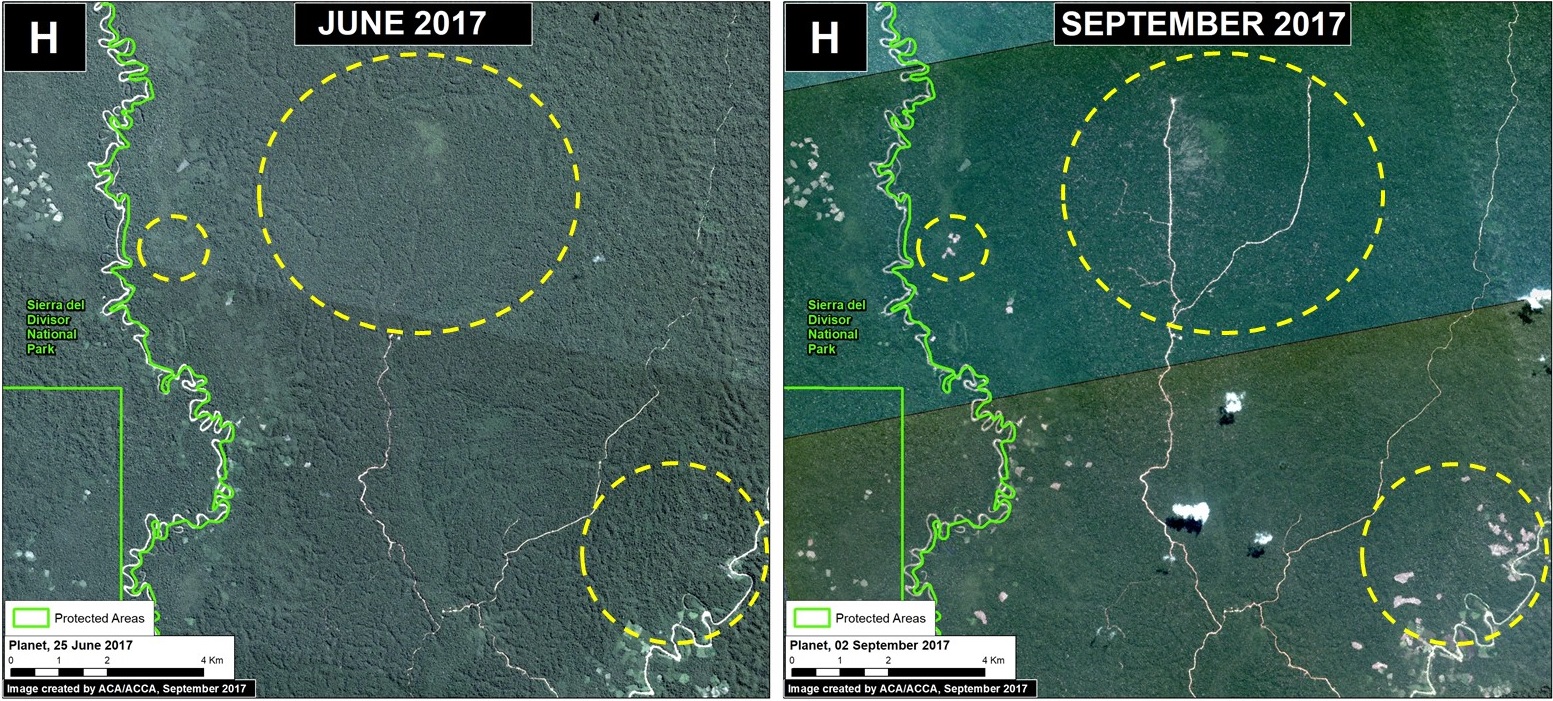
– South of Sierra del Divisor, Ucayali (Inset H)
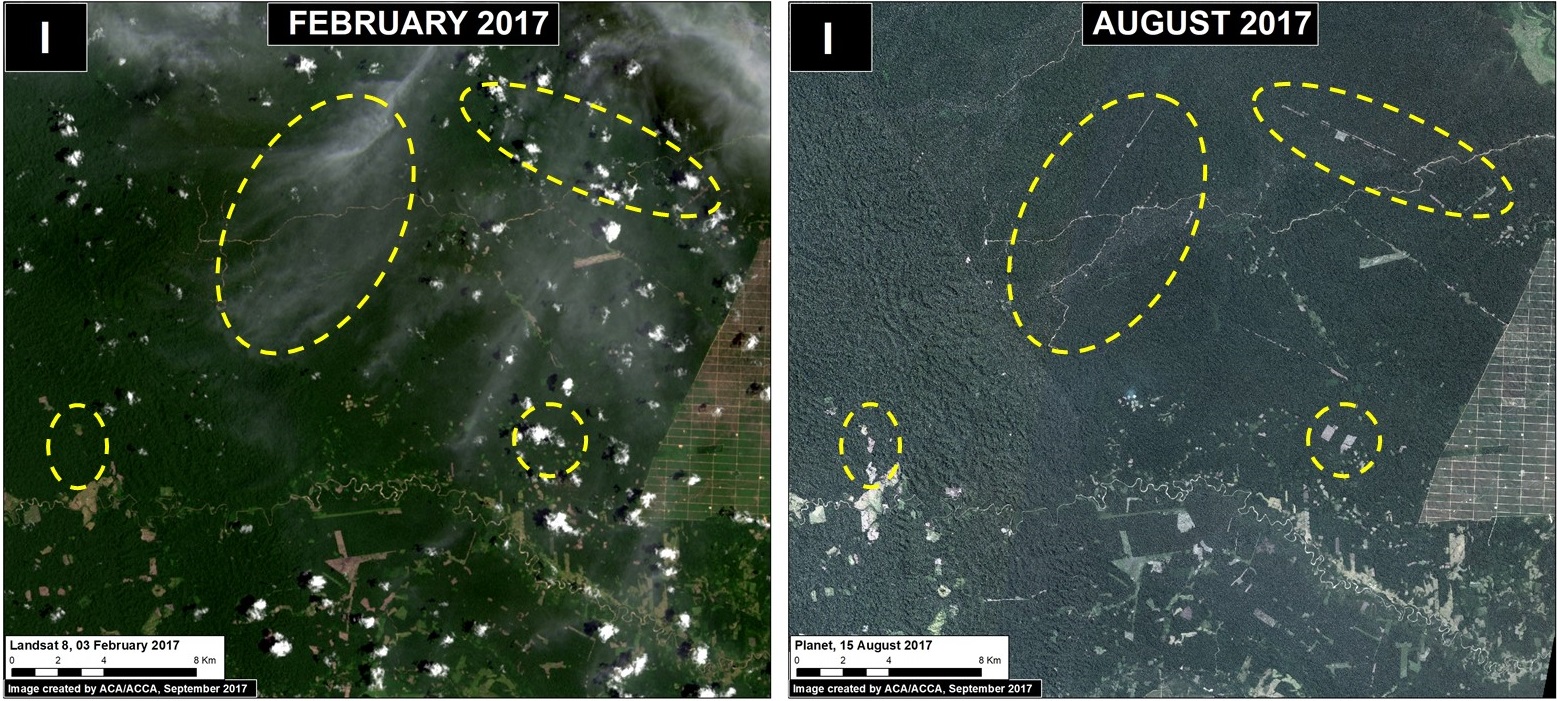
– Nueva Requena, Ucayali (Inset I)

**The data were generated by the National Program of Forest Conservation for Climate Change Mitigation, Peruvian Ministry of Environment (PNCB/MINAM).

**See Hotspots A-E in MAAP #65

***We emphasize that our calculations are just estimates. Official forest loss data are produced annually by the Peruvian Ministry of Environment.


La Pampa, Madre de Dios (Inset A)

Illegal gold mining deforestation continues to expand in the buffer zone of Tambopata National Reserve in the southern Peruvian Amazon. The Peruvian Government has conducted several interventions this year, most notably in July. However, between July and August we documented the additional loss of 67 acres (27 hectares), increasing the 2017 total deforestation in this zone to 1,280 acres (517 hectares). Image 68a is a GIF illustrating the gold mining deforestation from January to September 2017.

Image 68a. Data: Planet

Guacamayo, Madre de Dios (Inset F)

North of La Pampa, in another gold mining zone, known as Guacamayo, we have documented the rapid deforestation of 182 acres (74 hectares). This newly deforested area is located next to the mining zone (within a forestry concession), and appears to be caused by agricultural activity.

Image 68f. Data: Planet

Iberia, Madre de Dios (Inset G)

Around the  town of Iberia, located along the Interoceanica highway near the border with Brazil, has recently become a major deforestation hotspot (see MAAP #28 and MAAP #47). Between June and August 2017, we detected the deforestation of 1,075 acres (435 hectares). Much of this deforestation is within forestry concessions, indicating that the concessions have been invaded. The deforestation appears  to be caused by agriculture (according to local sources, the clearing is for corn plantations).

Image 68g. Data: Planet.

South of Sierra del Divisor, Ucayali (Inset H)

In the central Peruvian Amazon, just south of Sierra del Divisor National Park, we detected the new construction of 25 km of logging roads in the forestry concessions surrounding the park. We also detected the deforestation of 138 acres (56 hectares), close to the National Park’s limit for what appears to be agricultural activity.

Image 68h. Data: Planet, SERNANP

Nueva Requena, Ucayali (Inset I)

Also in the central Peruvian Amazon, in the Nueva Requena district near two controversial oil palm plantations (MAAP #41), we detected the deforestation of 1,130 acres (457 hectares) in state forestry lands (known as Permanent Production Forest). This includes 26 km of new logging and agricultural roads. It is important to note that this area was recently in the news regarding the killing of six farmers over land rights dispute.

Image 68i. Data: Planet

References

Planet Team (2017). Planet Application Program Interface: In Space for Life on Earth. San Francisco, CA. https://api.planet.com.

Citation

Finer M, Novoa S, Olexy T (2017) 2017 Deforestation Hotspots in the Peruvian Amazon (Part 2). MAAP: 68.

MAAP #65: Deforestation Hotspots of 2017 in the Peruvian Amazon

Image 65. Data: MINAM/PNCB, UMD/GLAD, SERNANP, MAAP

In an earlier report, MAAP #40, we highlighted the power of combining early warning GLAD* alerts with analysis of high-resolution satellite images (for example, from the company Planet), as part of a comprehensive near real-time deforestation monitoring system.

In the current report, we analyze the GLAD alerts for the first half of 2017 (through July 17) to identify current deforestation hotspots in the Peruvian Amazon.** These alerts indicate an estimated total forest loss of 37,000 acres (15,000 hectares) thus far during the year.

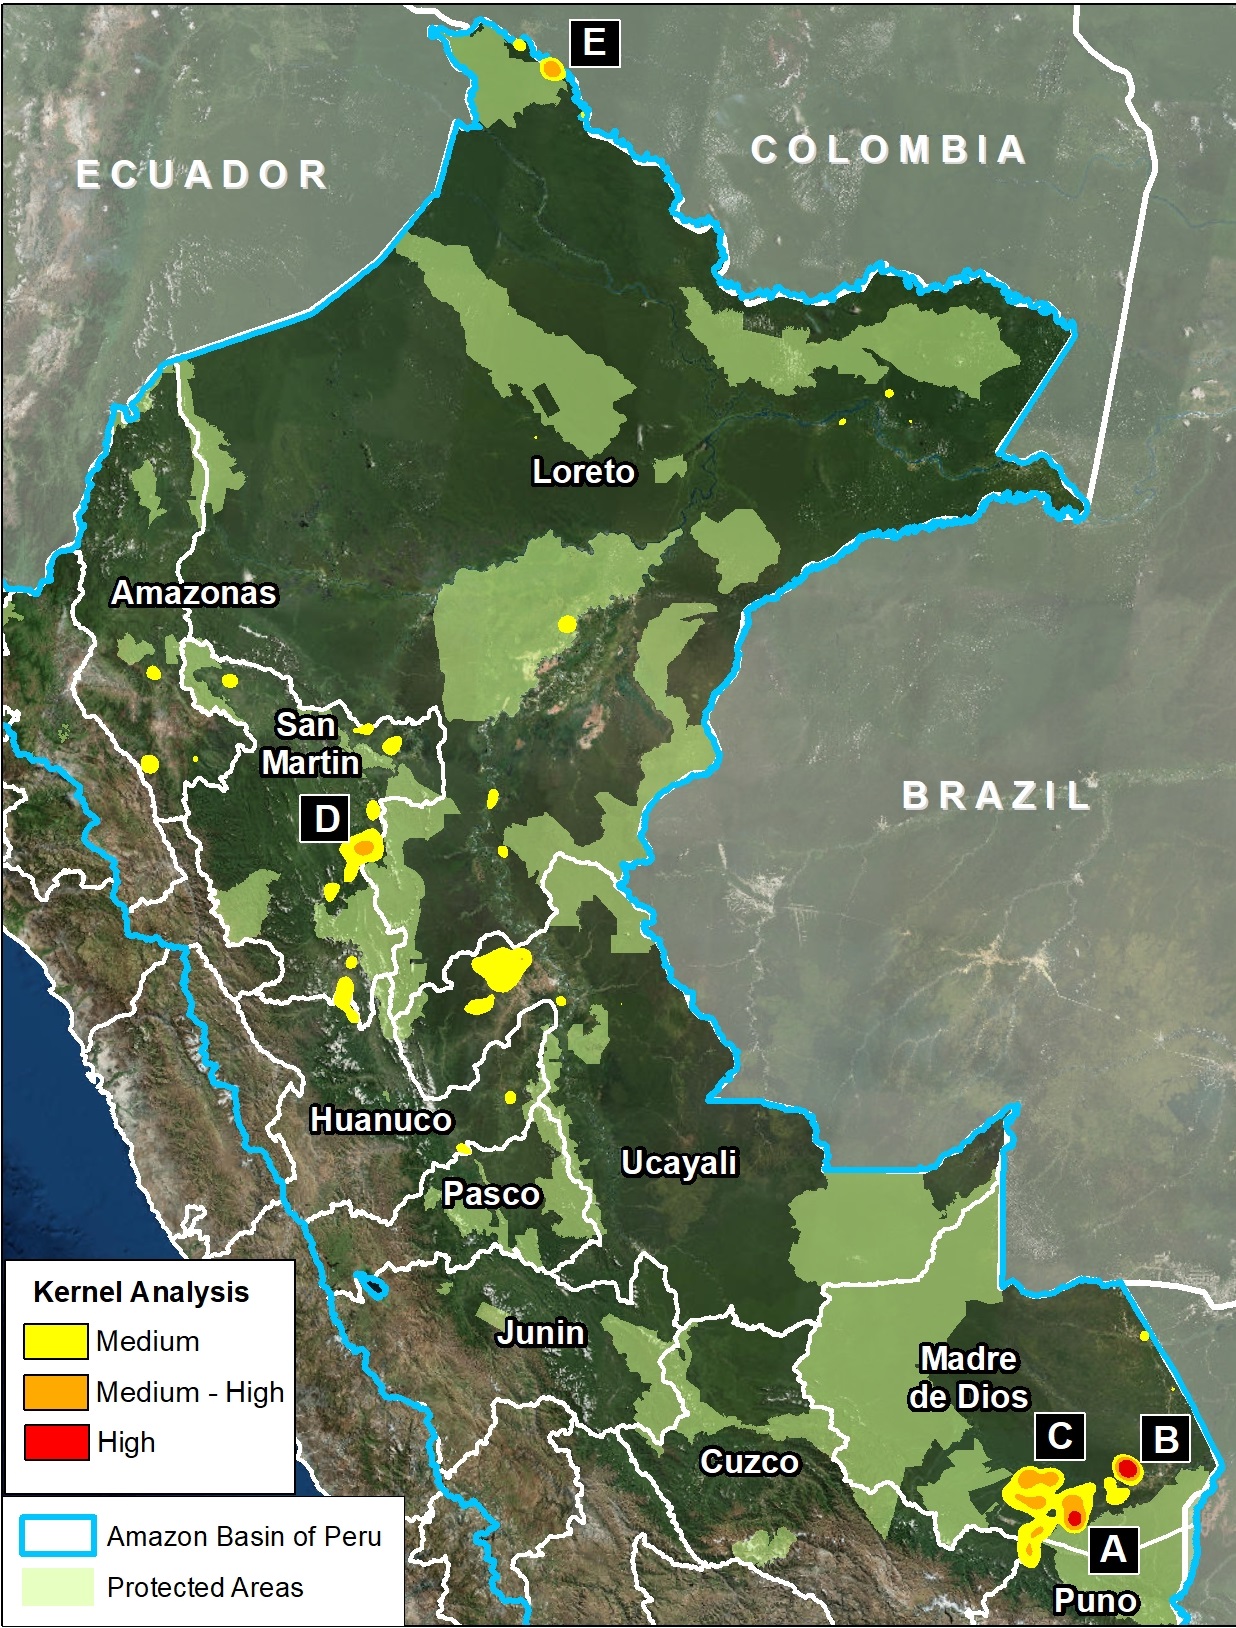
Image 65 (see right) highlights the 2017 deforestation hotspots, defined here as areas with medium to high density of forest loss.

Below, we describe and show images of the most intense hotspots, indicated in red and orange.

These areas include:

  • Buffer zones of Tambopata National Reserve and Cordillera Azul National Park
  • Natural loss due to blowdowns from “hurricane winds,” in the Madre de Dios region
  • Northwest border with Colombia


Buffer Zone of Tambopata National Reserve 

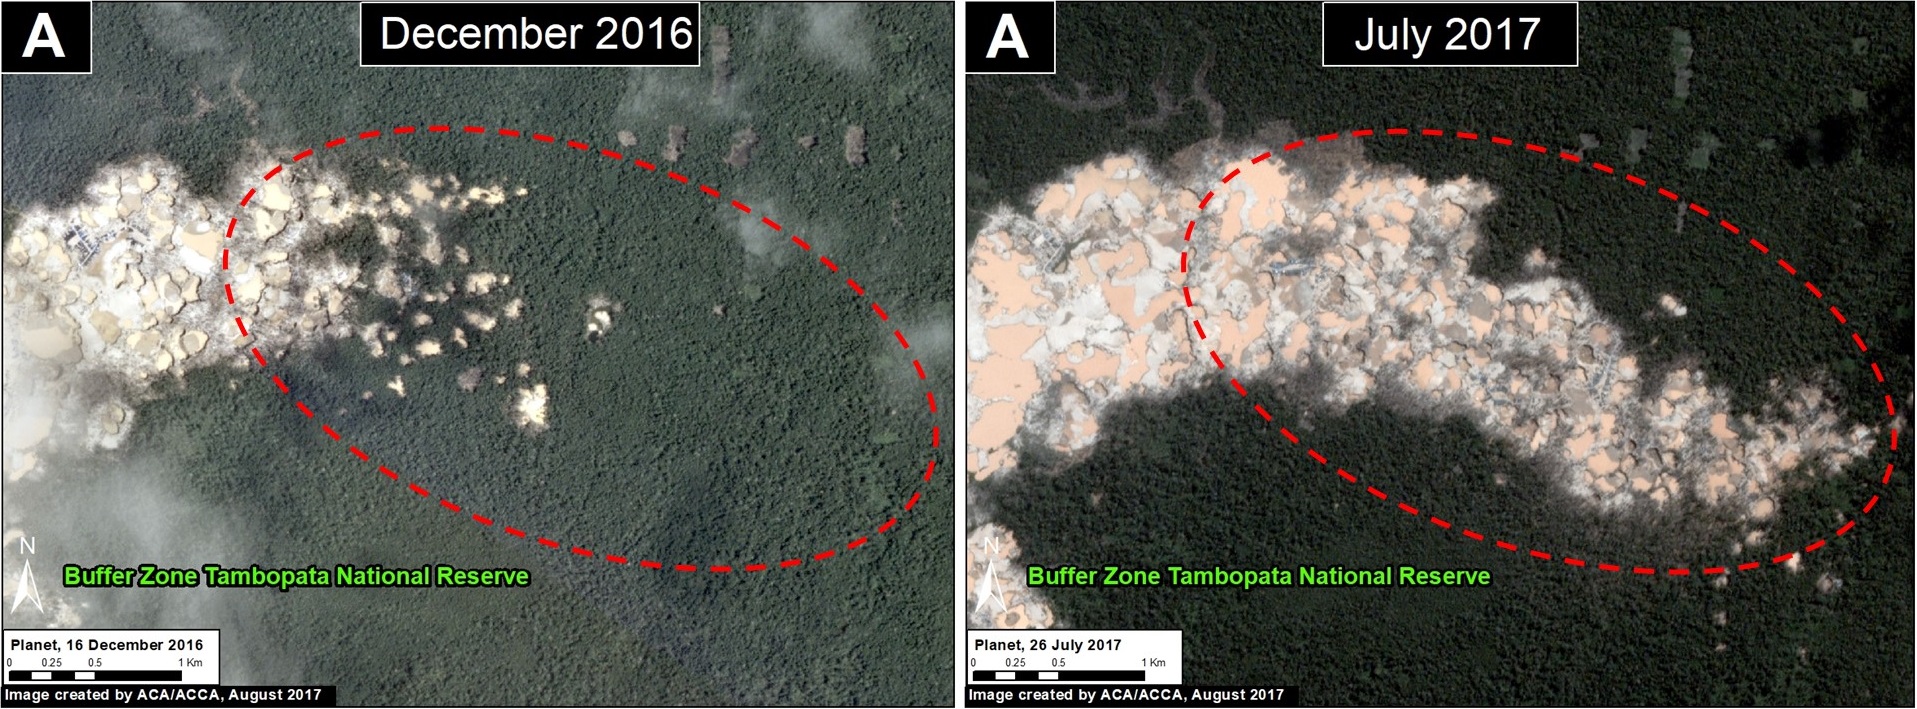
Inset A indicates an area of high intensity deforestation due to gold mining activity in the buffer zone of Tambopata National Reserve in the southern Peruvian Amazon (Madre de Dios region). Image 65a shows the deforestation of 1,210 acres (490 hectares) in this area in 2017. The Peruvian government recently (early July) led a major raid in this area. However, the most recent satellite images (late July – early August) indicate that mining camps are still present in the area.

Image 65a. Data: Planet

Hurricane Winds

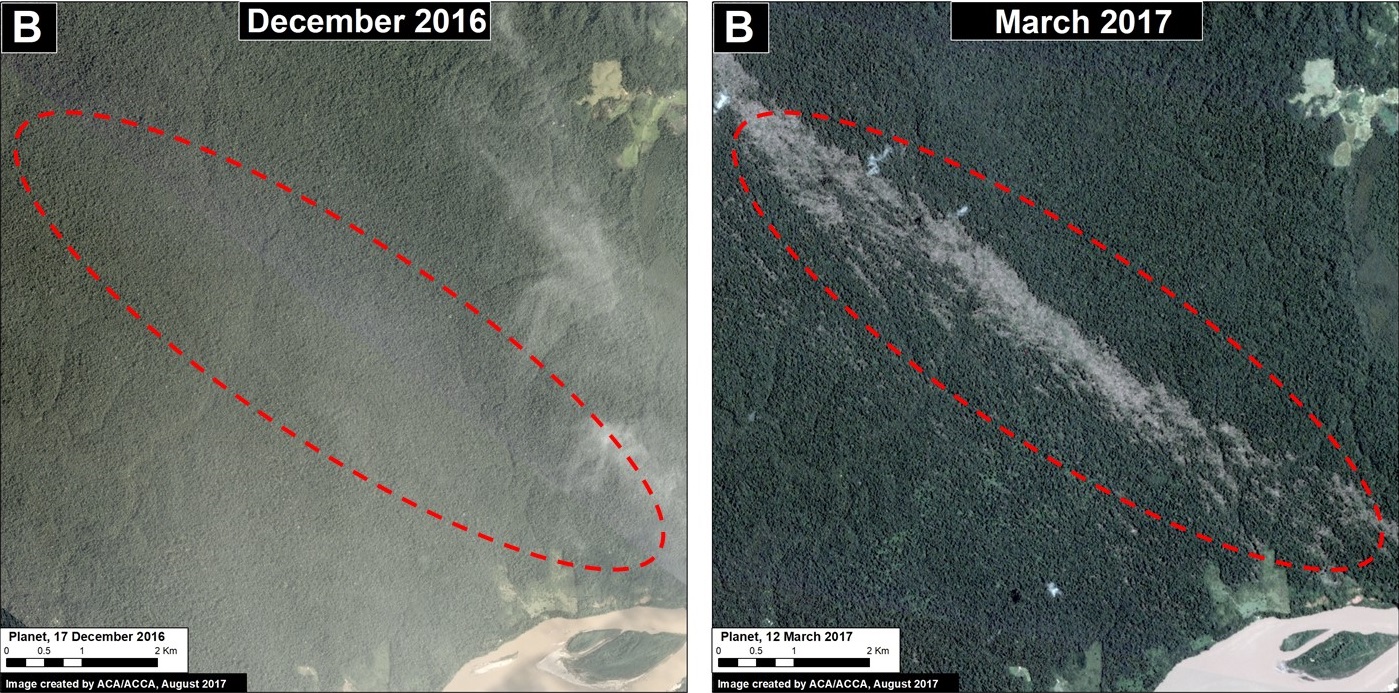
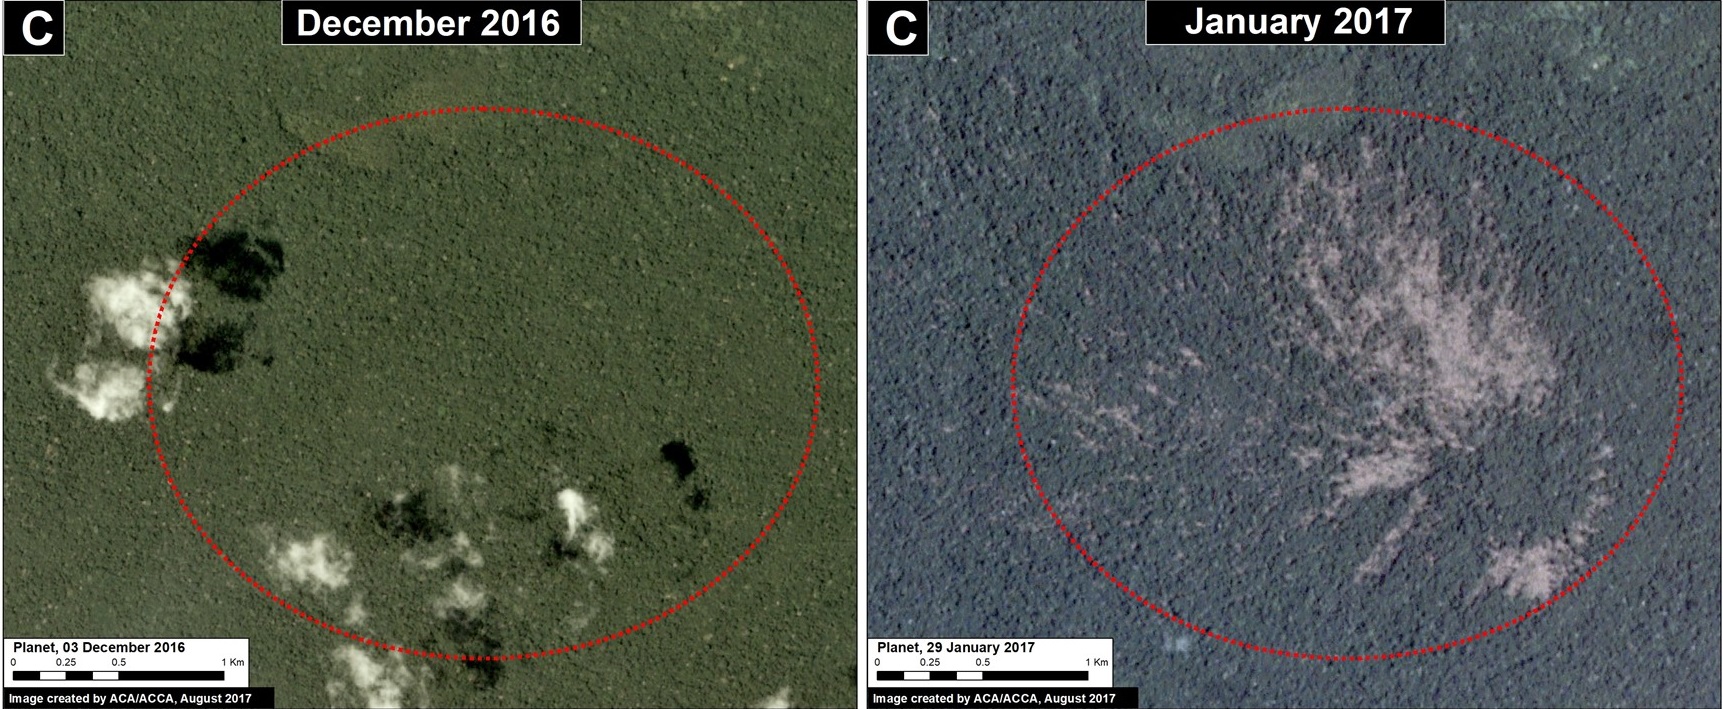
Insets B and C indicate two areas in the southern Peruvian Amazon (Madre de Dios region) that experienced the natural forest loss of 980 acres (400 hectares) caused by hurricane winds, localized thunderstorms with strong winds. Images 65b and 65c show the recent 2017 forest loss. See MAAP #54 and MAAP #55 for more details about hurricane winds.

Image 65b. Data: Planet
Image 65c. Data: Planet

Buffer Zone of Cordillera Azul National Park

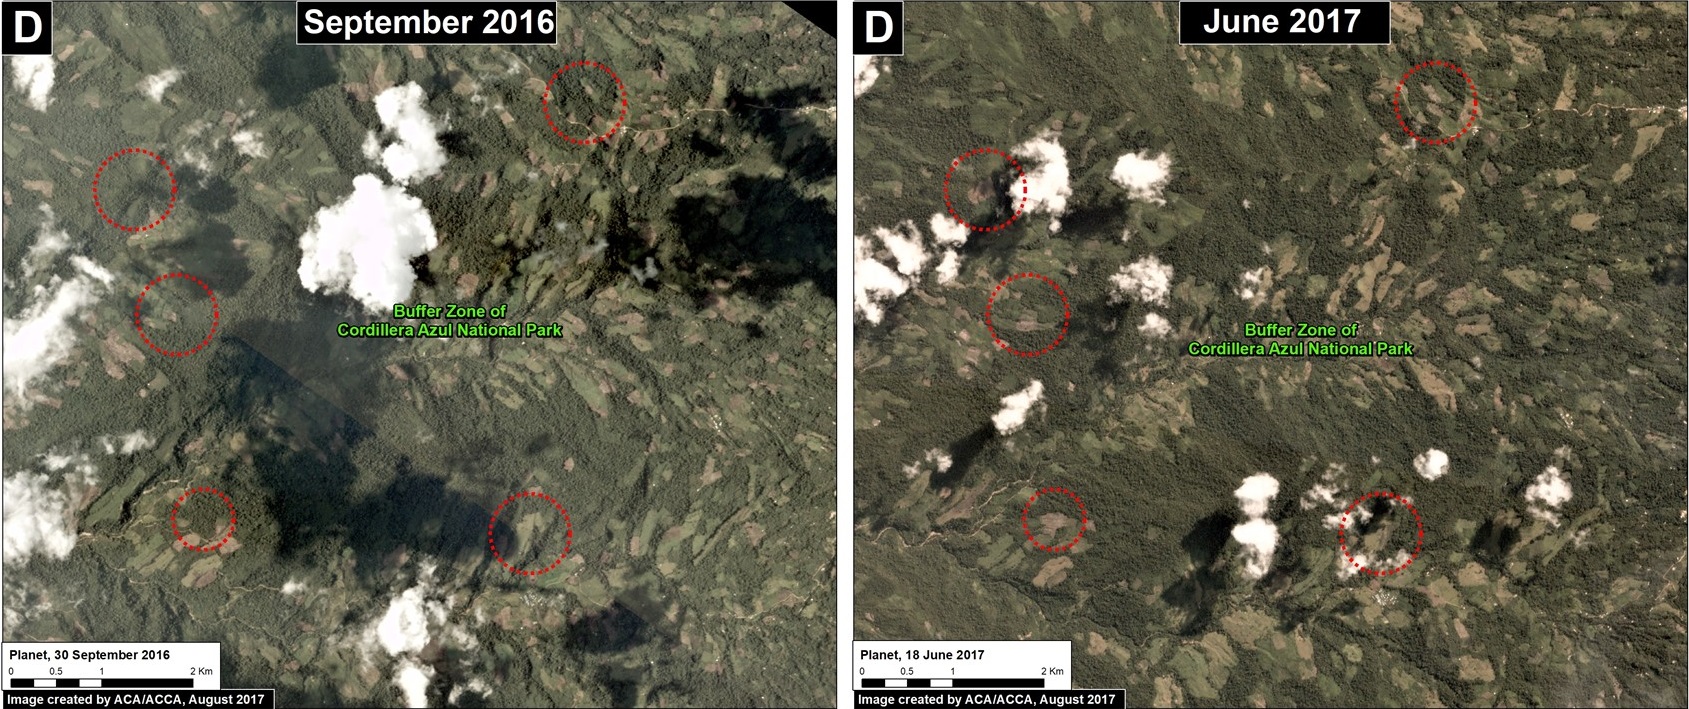
Inset D shows an area of medium intensity deforestation in the buffer zone of Cordillera Azul National Park, in the central Peruvian Amazon (San Martin region). Image 65d shows an example of the deforestation (138 acres) in this area in 2017. The main cause of the deforestation appears to be agricultural activity.

Image 65d. Data: Planet

Northwest Border with Colombia

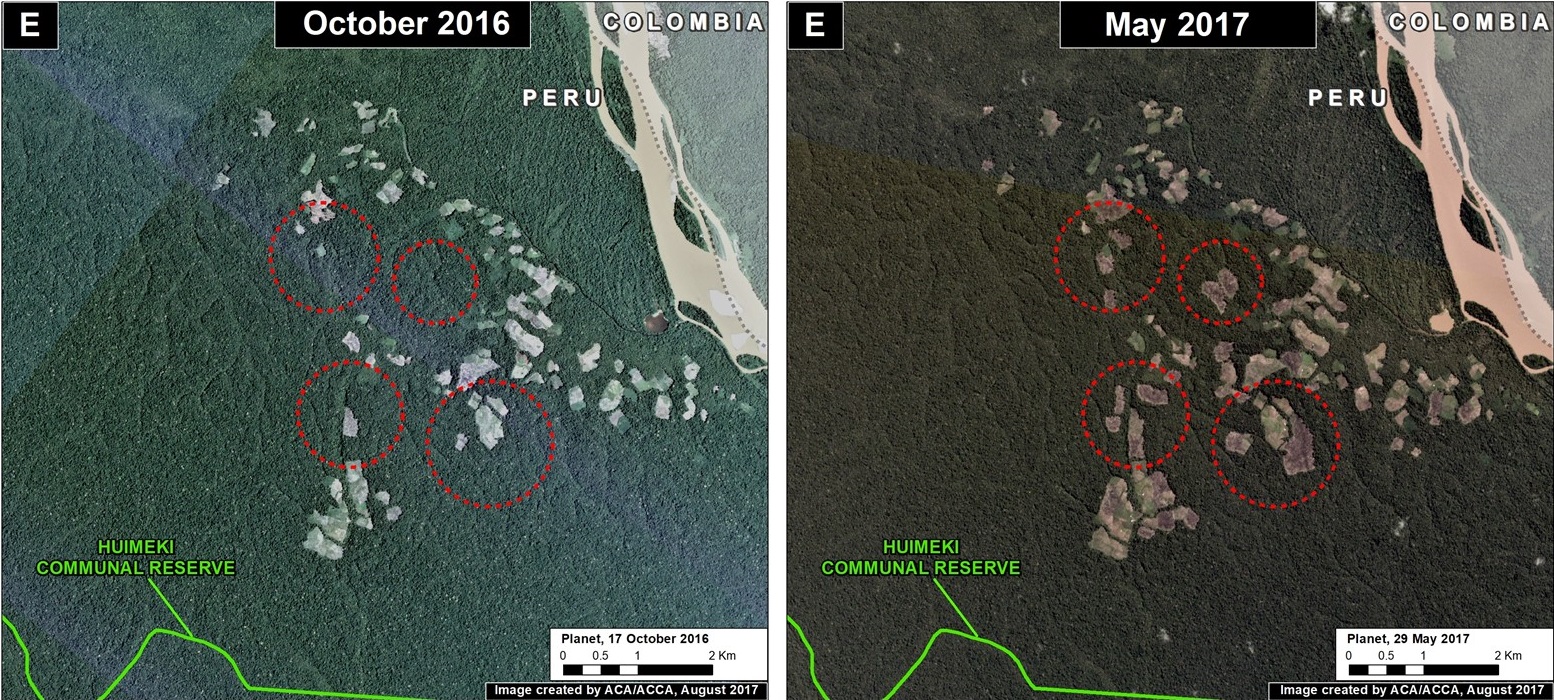
Inset E indicates a medium intensity hotspot in the extreme northern Peruvian Amazon (Loreto region), along the border with Colombia. The deforestation is approaching the limit of the Huimeki Communal Reserve. Image 65e shows the deforestation of 390 acres (158 hectares) in this area in 2017. The driver appears to be linked to agricultural activities and illicit crops (The United Nations has confirmed coca in this area).

Image 65e. Data: Planet

Notes

*GLAD alerts are a powerful new tool to monitor tropical forest loss in near real-time. This early warning system, created by the GLAD (Global Land Analysis and Discovery) laboratory at the University of Maryland and supported by Global Forest Watch, was launched in March 2016 as the first Landsat-based (30-meter resolution) forest loss alert system (previous systems were based on lower-resolution imagery). The alerts are updated weekly and can be accessed through Global Forest Watch.

**We performed a kernel density estimation, an analysis that calculates the magnitude per unit area of a particular phenomenon, in this case, forest loss.

Reference

Planet Team (2017). Planet Application Program Interface: In Space for Life on Earth. San Francisco, CA. https://api.planet.com.

Citation

Novoa S, Finer M (2017) Deforestation Hotspots in the Peruvian Amazon in 2017. MAAP: 65.


MAAP #64: Good News Deforestation Stories (Peruvian Amazon)

We admit that most MAAP stories are about the bad news of Amazon deforestation. But fortunately there is good news as well.

Here we highlight 5 good news stories from the Peruvian Amazon that show how near real-time monitoring may lead to halting deforestation from emerging threats, such as gold mining and large-scale agriculture (oil palm and cacao plantations).

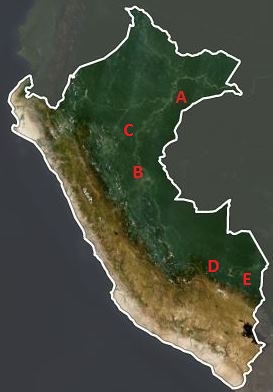
The detailed cases are:
A) United Cacao (cacao),
B) Plantations of Pucallpa (oil palm),
C) Grupo Romero (oil palm),
D) Amarakaeri Comunal Reserve (gold mining), and
E) Tambopata National Reserve (gold mining).


United Cacao
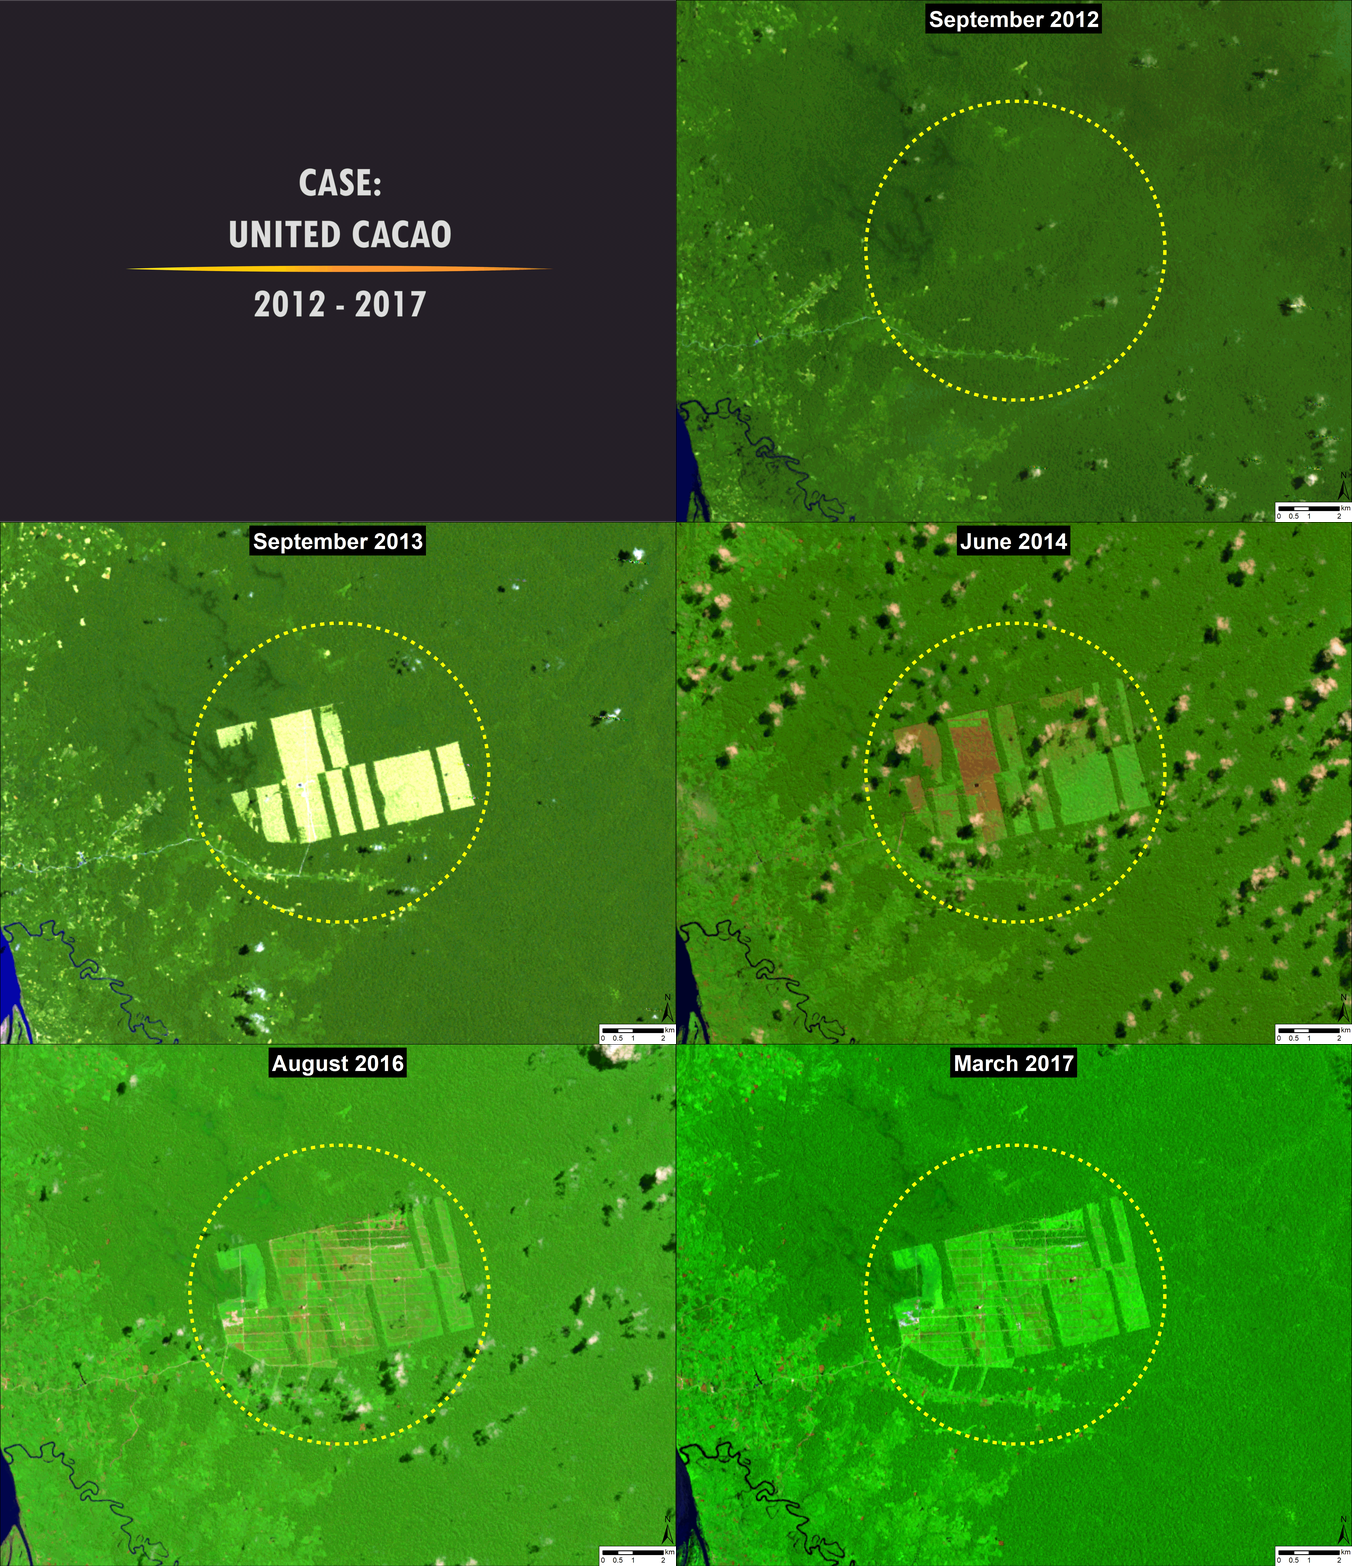
Image 64a. Data: NASA/USGS

The rapid deforestation of primary forest for a large-scale cacao plantation in the northern Peruvian Amazon took everyone by surprise in 2013. Civil society led the way in exposing and tracking the deforestation with satellite imagery and the government eventually confirmed the forest loss data. For its part, MAAP published 6 articles (for example MAAP #35 and MAAP #2).

Although total deforestation eventually reached 5,880 acres (2,380 hectares), the company, due to a complicated combination of factors, was suspended from the London Stock Exchange and no new deforestation has been detected in over a year.

Image 64a shows that the cacao project area was covered by intact forest in late 2012, followed by large-scale deforestation of primary forest in 2013. The deforestation slowed, and then stopped, between 2014 and 2017. The yellow circle indicates the cacao plantation area over time.

Plantations of Pucallpa (oil palm)

In a remarkable case, satellite imagery was used to demonstrate that an oil palm company (Plantations of Pucallpa) had breached the Code and Conduct of the RSPO (Roundtable on Sustainable Palm Oil), a non-profit entity founded to develop and implement global standards for sustainable palm oil.

In 2015, the Native Community of Santa Clara de Uchunya (with the support of the NGO Forest Peoples Programme) presented an official complaint to the RSPO against Plantations of Pucallpa, a member of the roundtable. An important component of the complaint alleged massive deforestation, but the company adamantly denied it. MAAP articles showing the deforestation of 15,970 acres (6,460 hectares) were used as evidence (MAAP #4, MAAP #41), as was independent government analysis.

In April 2017, the RSPO concluded that Plantations of Pucallpa cleared 14,145 acres (5,725 hectares) despite declaring no land-clearing, thus breaching the Code and Conduct. Several months prior this decision, the company divested its oil palm estates and withdrew from the RSPO. We have not detected any new deforestation in the project area in over a year.

Image 64b shows the massive deforestation for two large-scale oil palm plantations in the central Peruvian Amazon (Plantations of Pucallpa is the plantation to the north). The yellow circles indicate the oil palm plantation project areas over time. Note that the project area was a mix of primary and secondary forest in 2011, immediately prior to the deforestation, which began in 2012. The deforestation intensified in 2013 before nearly reaching its maximum extent in 2015. We have not detected any new deforestation since 2016.
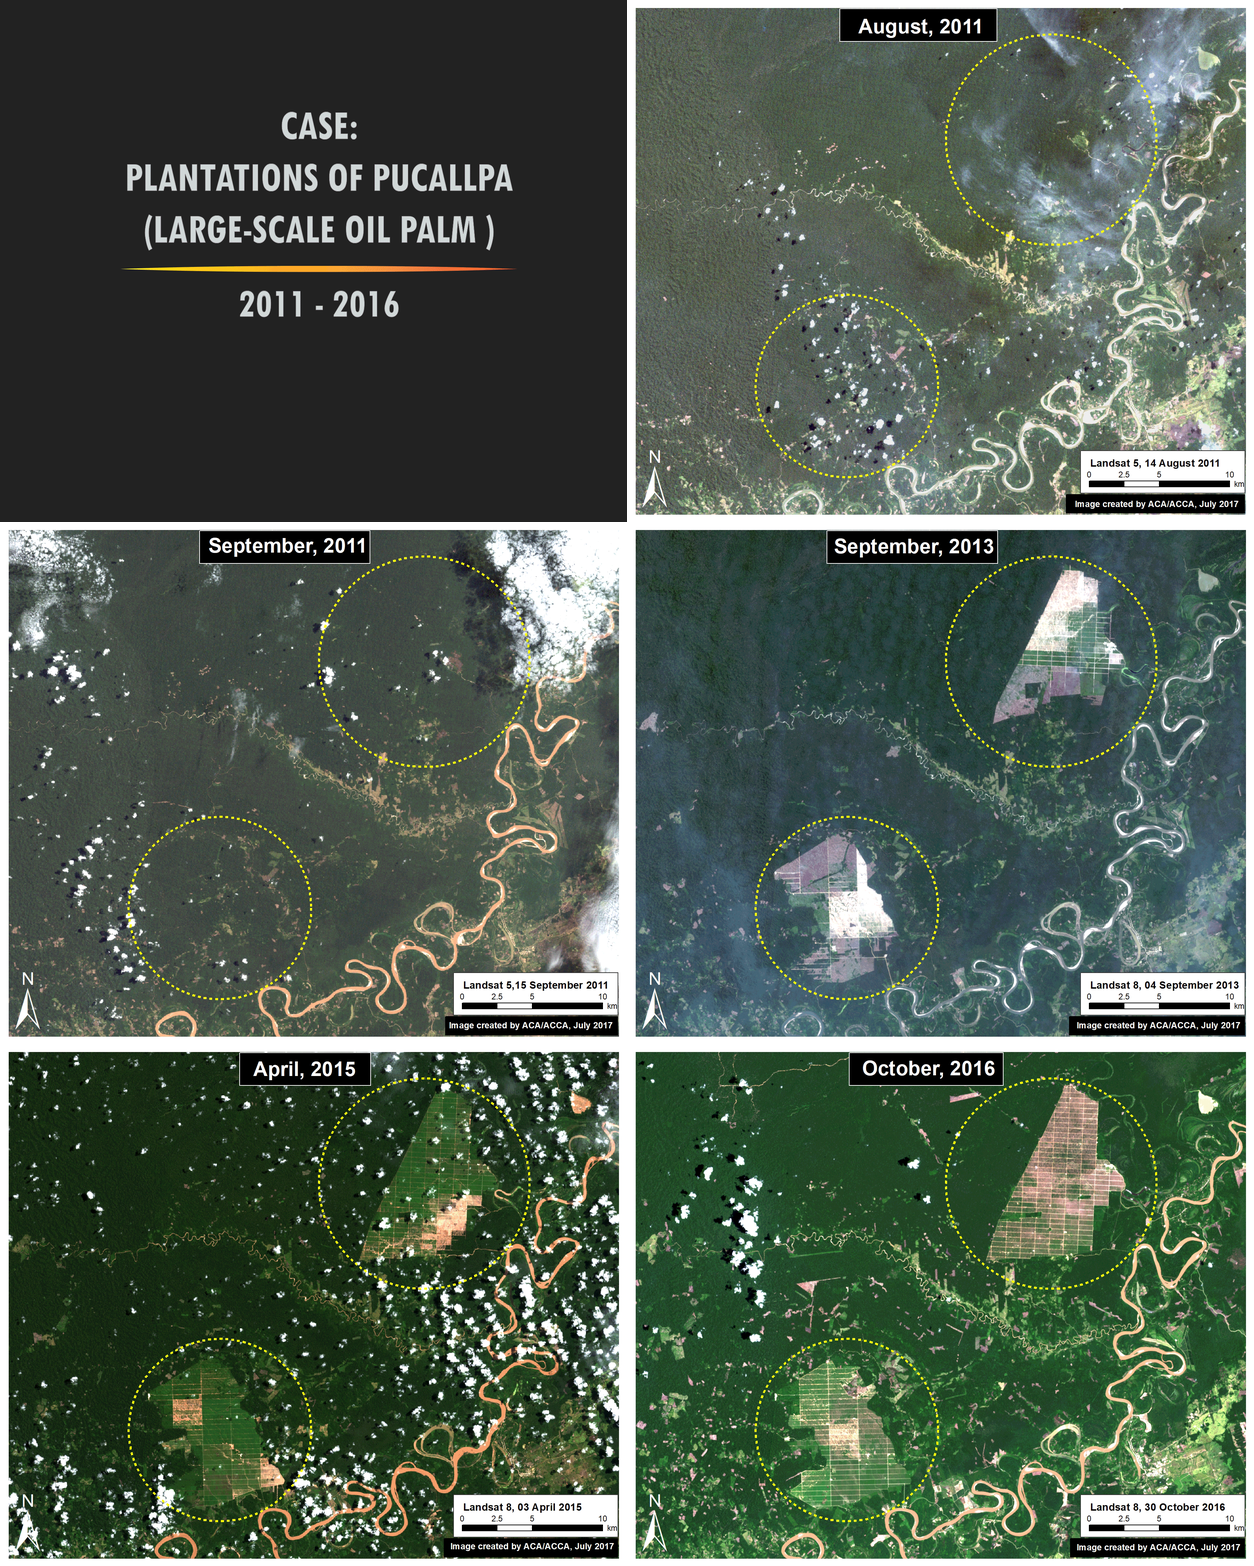
Image 64b. Data: NASA/USGS, MAAP

Grupo Romero (oil palm)

Perhaps the best news of the bunch is about four large-scale oil palm plantations that were stopped before any deforestation occurred. As detailed in a recent report by Environmental Investigation Agency, the Peruvian business conglomerate Grupo Romero conducted environmental impact studies for four new oil palm plantations in the northern Peruvian Amazon. Analysis of these studies revealed that these plantations would cause the massive deforestation of 56,830 acres (23,000 hectares) of primary forest. After strong pushback from civil society, including legal action, a recent report from Chain Reaction Research revealed that Grupo Romero is now working towards a zero-deforestation supply chain and thus found that the four planned plantations are no longer feasible and abandoned the projects.

Image 64c shows how the project area for two of the proposed oil palm plantations (in yellow), Santa Catalina and Tierra Blanca, is largely covered by intact, primary forest.
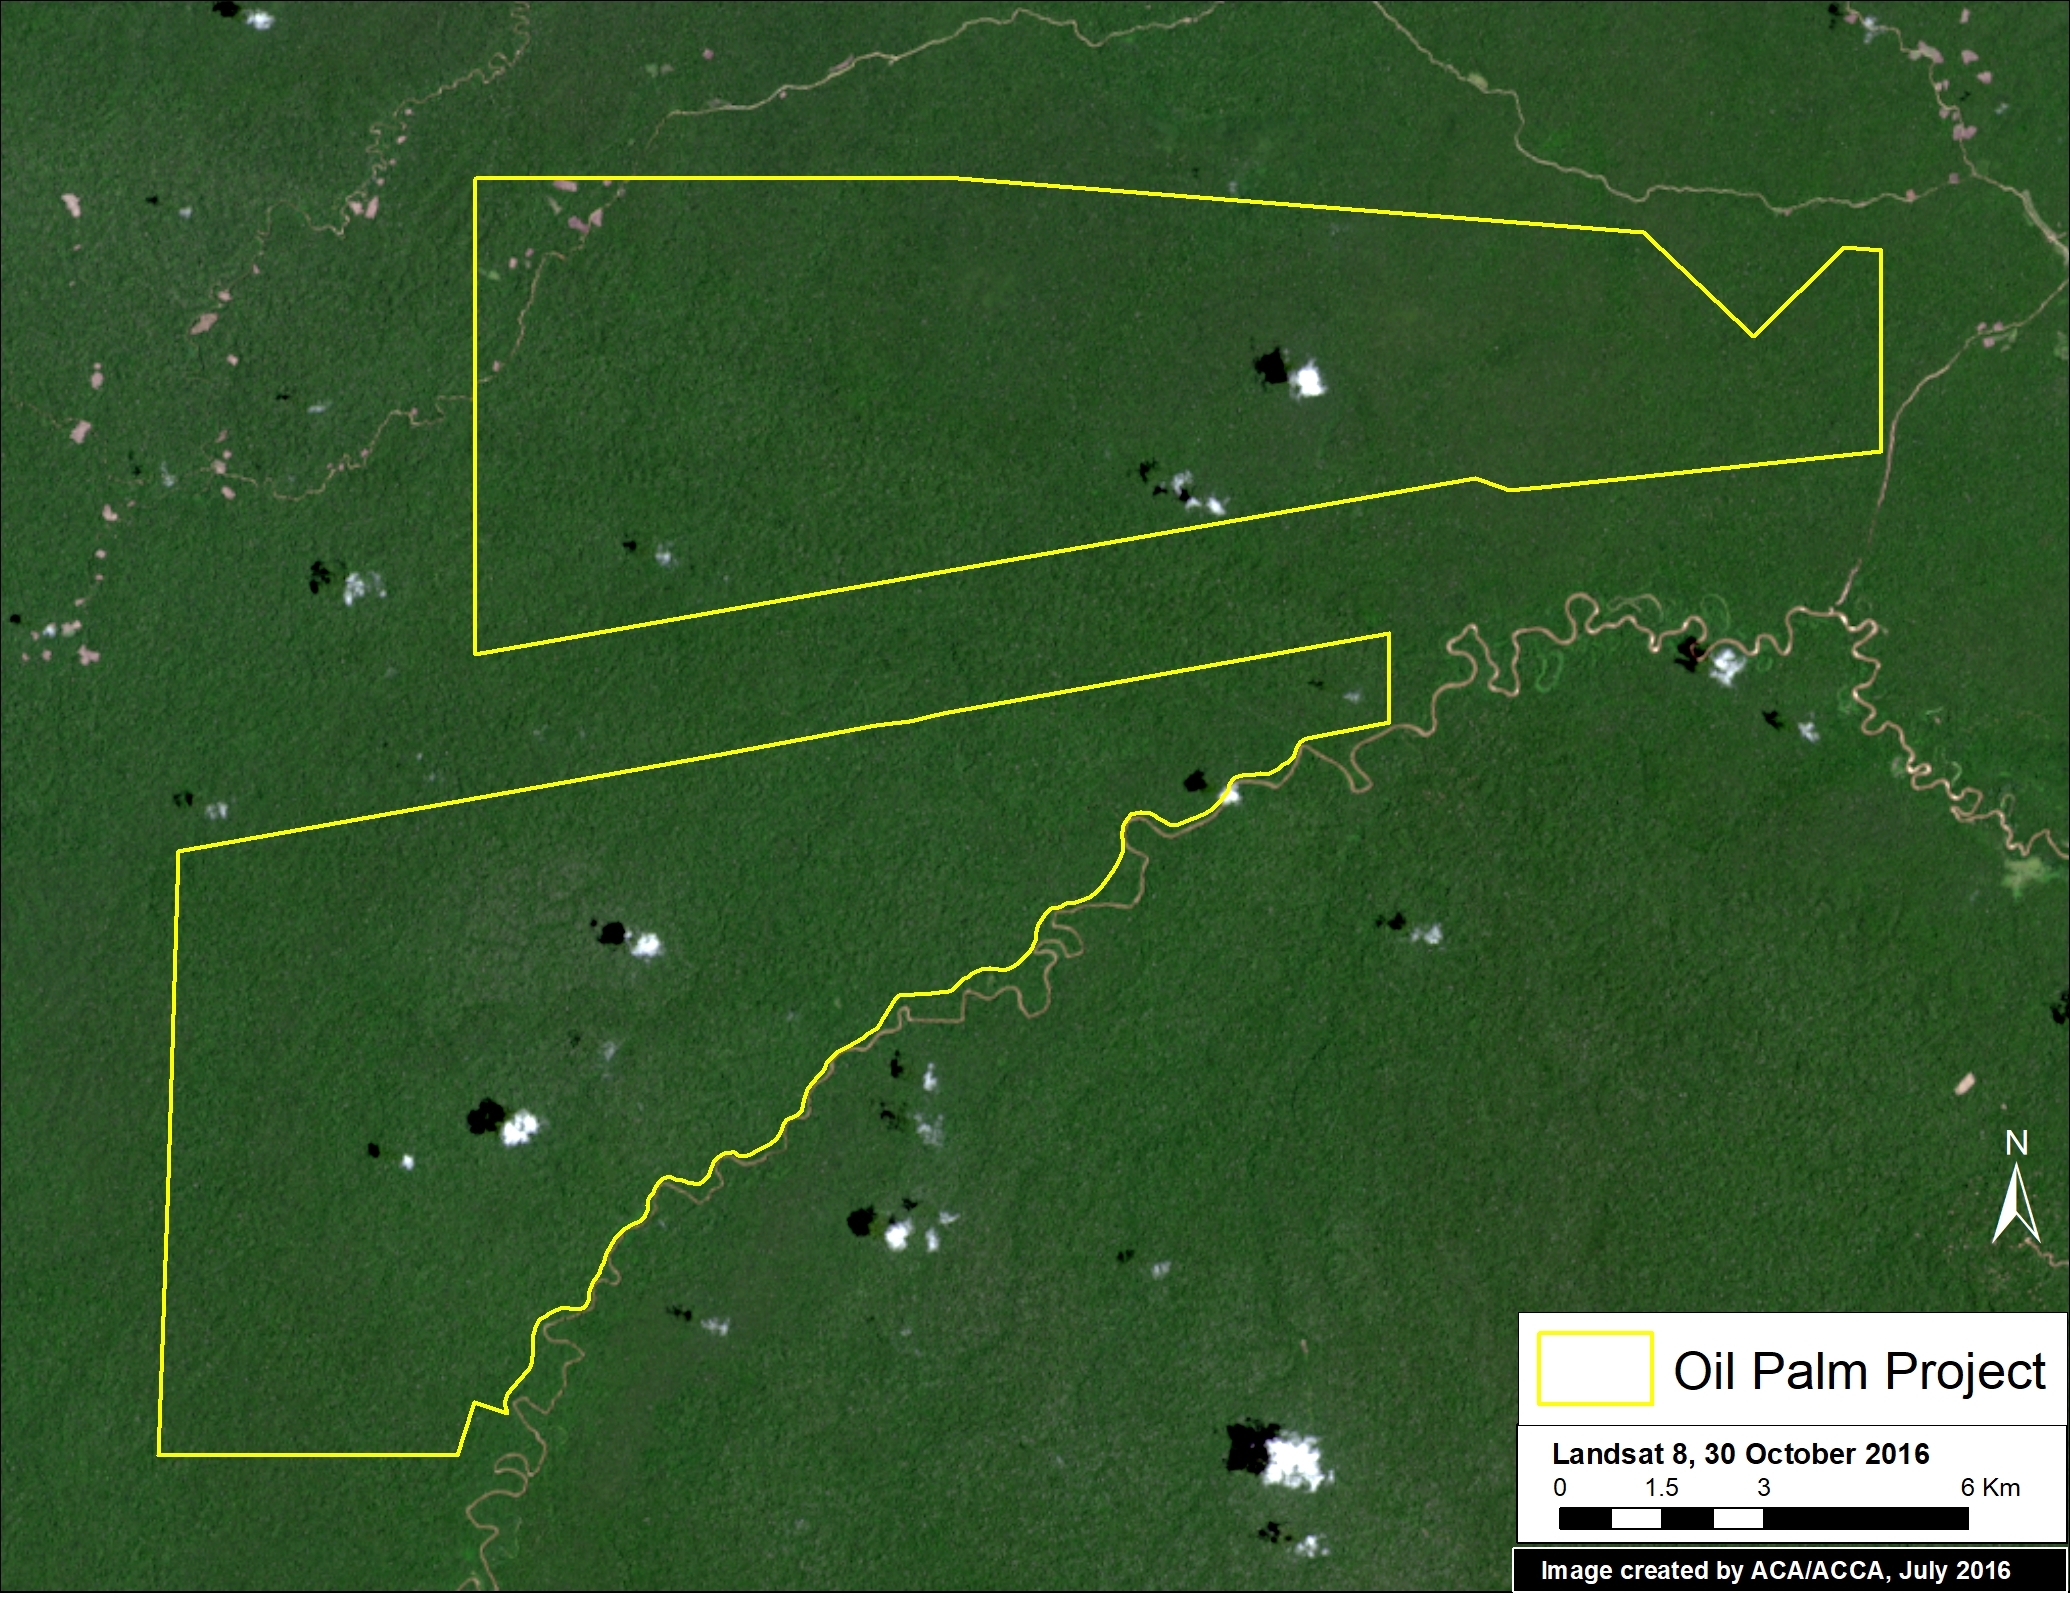
Image 64c. Data: NASA/USGS, Grupo Palmas (Grupo Romero)

Amarakaeri Communal Reserve (gold mining)

In June 2015, we revealed the deforestation of 11 hectares in Amarakaeri Communal Reserve due to an illegal gold mining invasion. The Reserve, located in the southern Peruvian Amazon, is an important protected area that is co-managed by indigenous communities (ECA Amarakaeri) and SERNANP, Peru’s protected areas agency (see MAAP #6). In the following weeks, the Peruvian government, led by SERNANP, cracked down on the illegal mining activities. A year later, we showed that the deforestation had been stopped, with no further expansion into the Reserve (MAAP #44). In fact, we showed that there were signs of recovering vegetation on the recently mined areas.

Image 64d shows the gold mining deforestation approaching (2011-12) and entering (2013-15) Amarakaeri Communal Reserve (yellow circles indicate areas of invasion). However, it also shows how, following action by the government and ECA Amarakaeri, the deforestation was halted and did not expand in 2016-17.
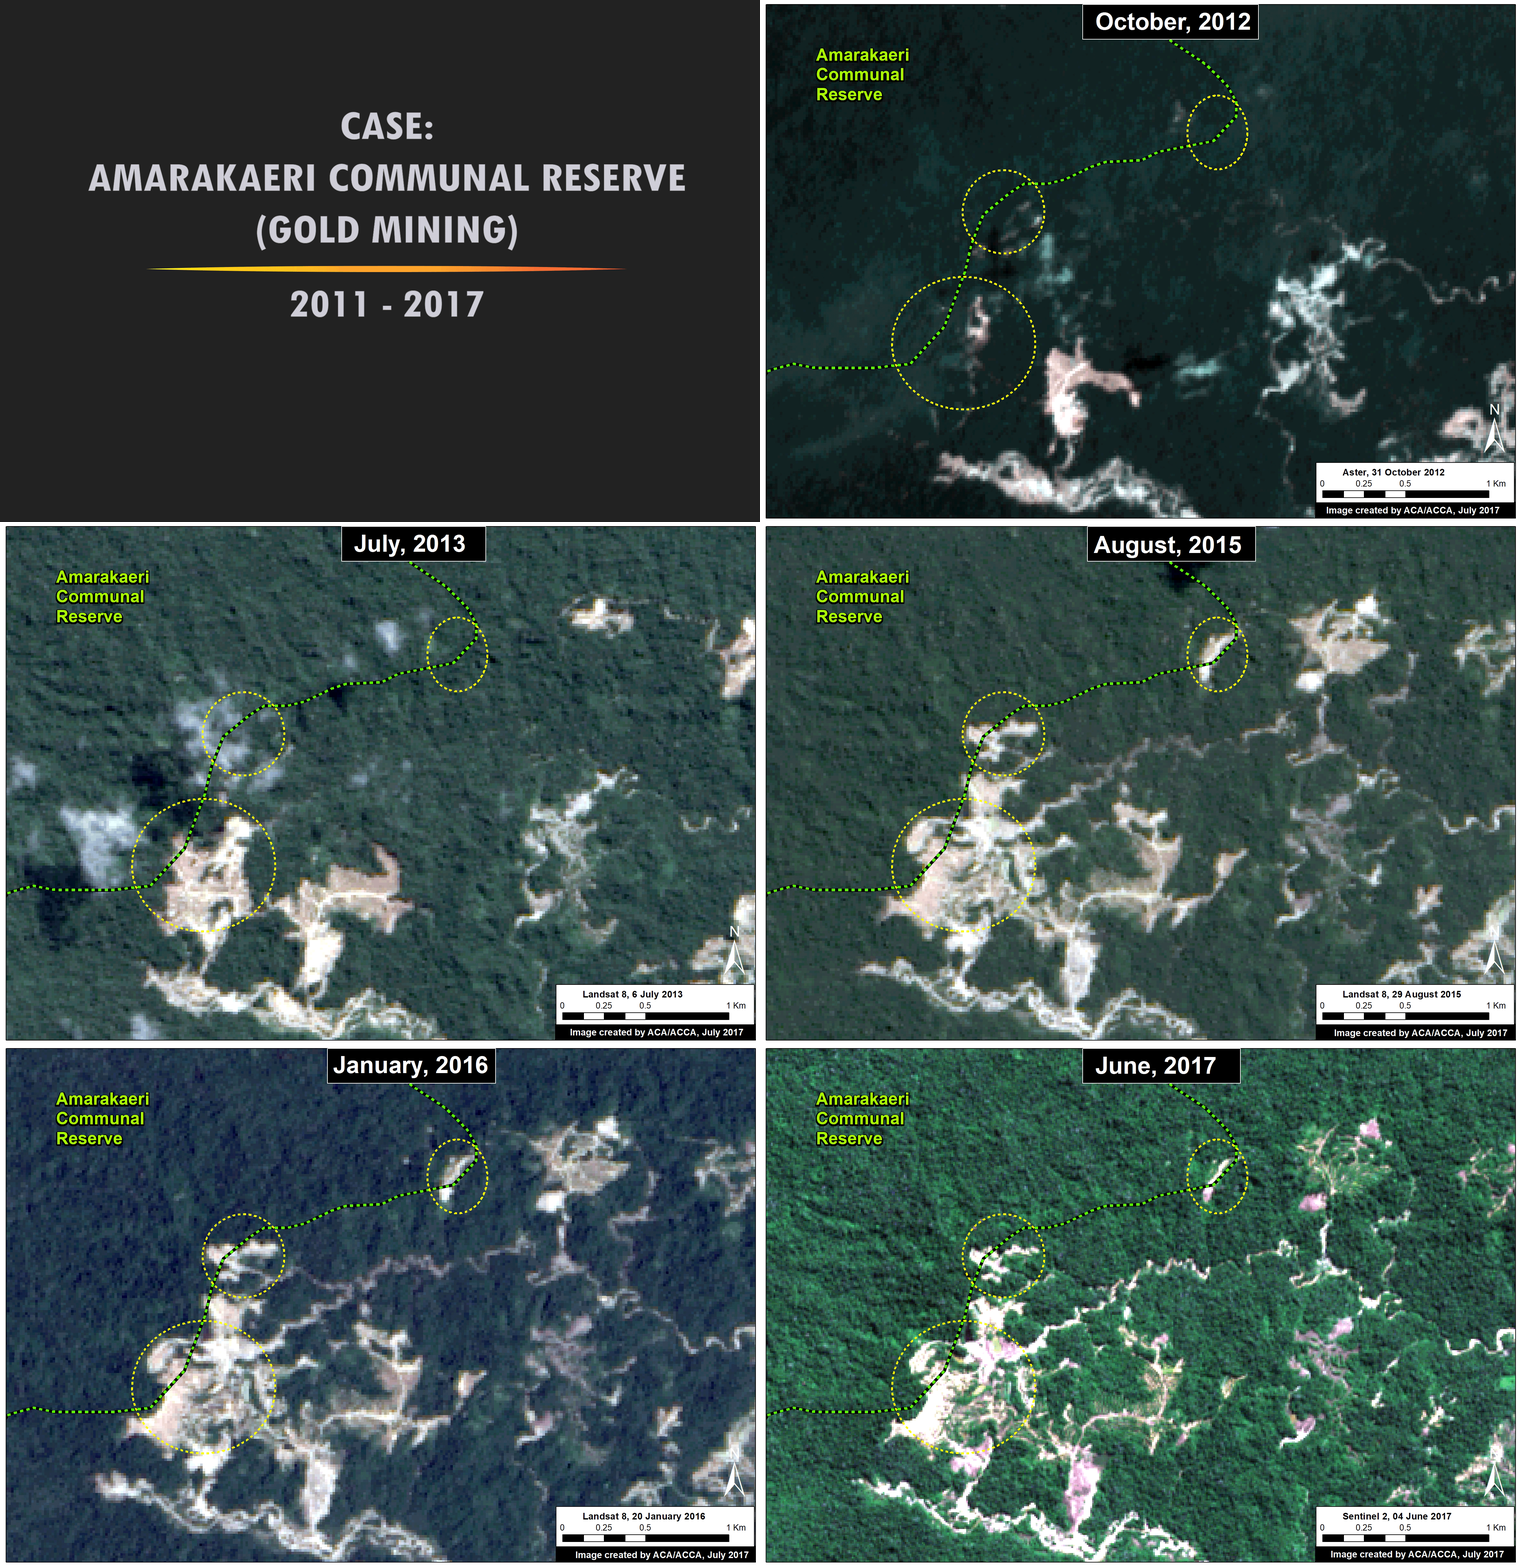
Image 64d. Data: NASA/USGS, Sentinel/ESA, RapidEye/Planet

Tambopata National Reserve (gold mining)

In September 2015, illegal gold miners started to invade Tambopata National Reserve, an important protected area in the southern Peruvian Amazon with world renowned biodiversity. In a series of MAAP articles, we tracked the invasion as it intensified in 2016, and eventually reached 1,360 acres (550 hectares) by early 2017. However, by late 2016, the Peruvian Government intensified its interventions against the illegal mining activity, and the rate of deforestation quickly and sharply decreased. In the most recent satellite imagery, we have not detected any major new expansion of illegal gold mining within the Reserve.

Image 64e shows the initial invasion of Tambopata National Reserve between September 2015 and January 2016. The deforestation within the Reserve intensifies during 2016, but slows significantly in 2017. The yellow circles indicate areas of invasion.
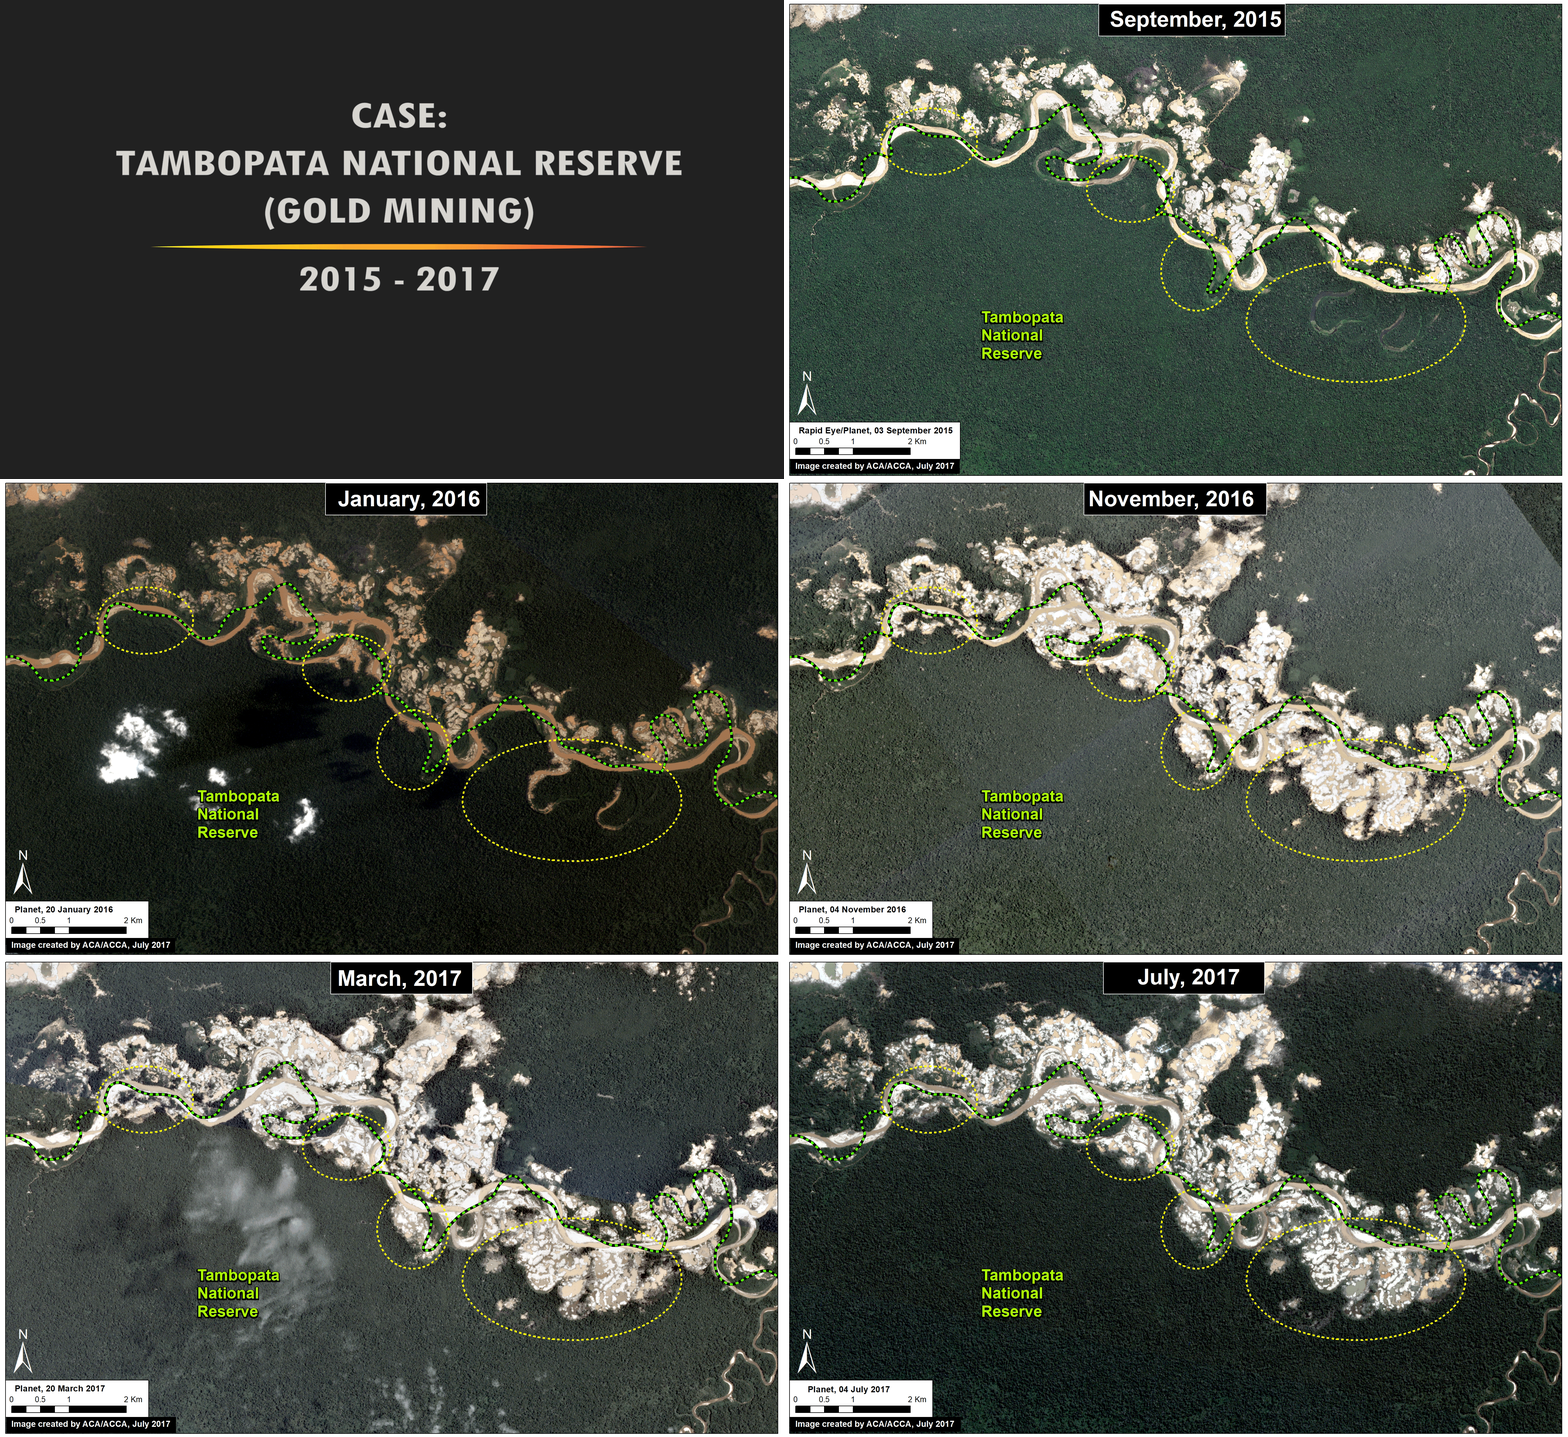
Image 64e. Data: Planet, SERNANP

References

Planet Team (2017). Planet Application Program Interface: In Space for Life on Earth. San Francisco, CA. https://api.planet.com.

Citation

Finer M, Novoa S, Olexy T, Scott A (2017) Good News Deforestation Stories (Peruvian Amazon). MAAP: 64.
MAAP #61: Illegal Gold Mining Decreases in Tambopata National Reserve

In the previous MAAP #60, we showed the rapidly increasing illegal gold mining deforestation in the buffer zone of Tambopata National Reserve. In contrast, here we show that the rate of illegal gold mining deforestation is decreasing within Tambopata National Reserve, due to the active interventions by the Peruvian Government. Tambopata is an important protected area in the southern Peruvian Amazon due to its high biodiversity.

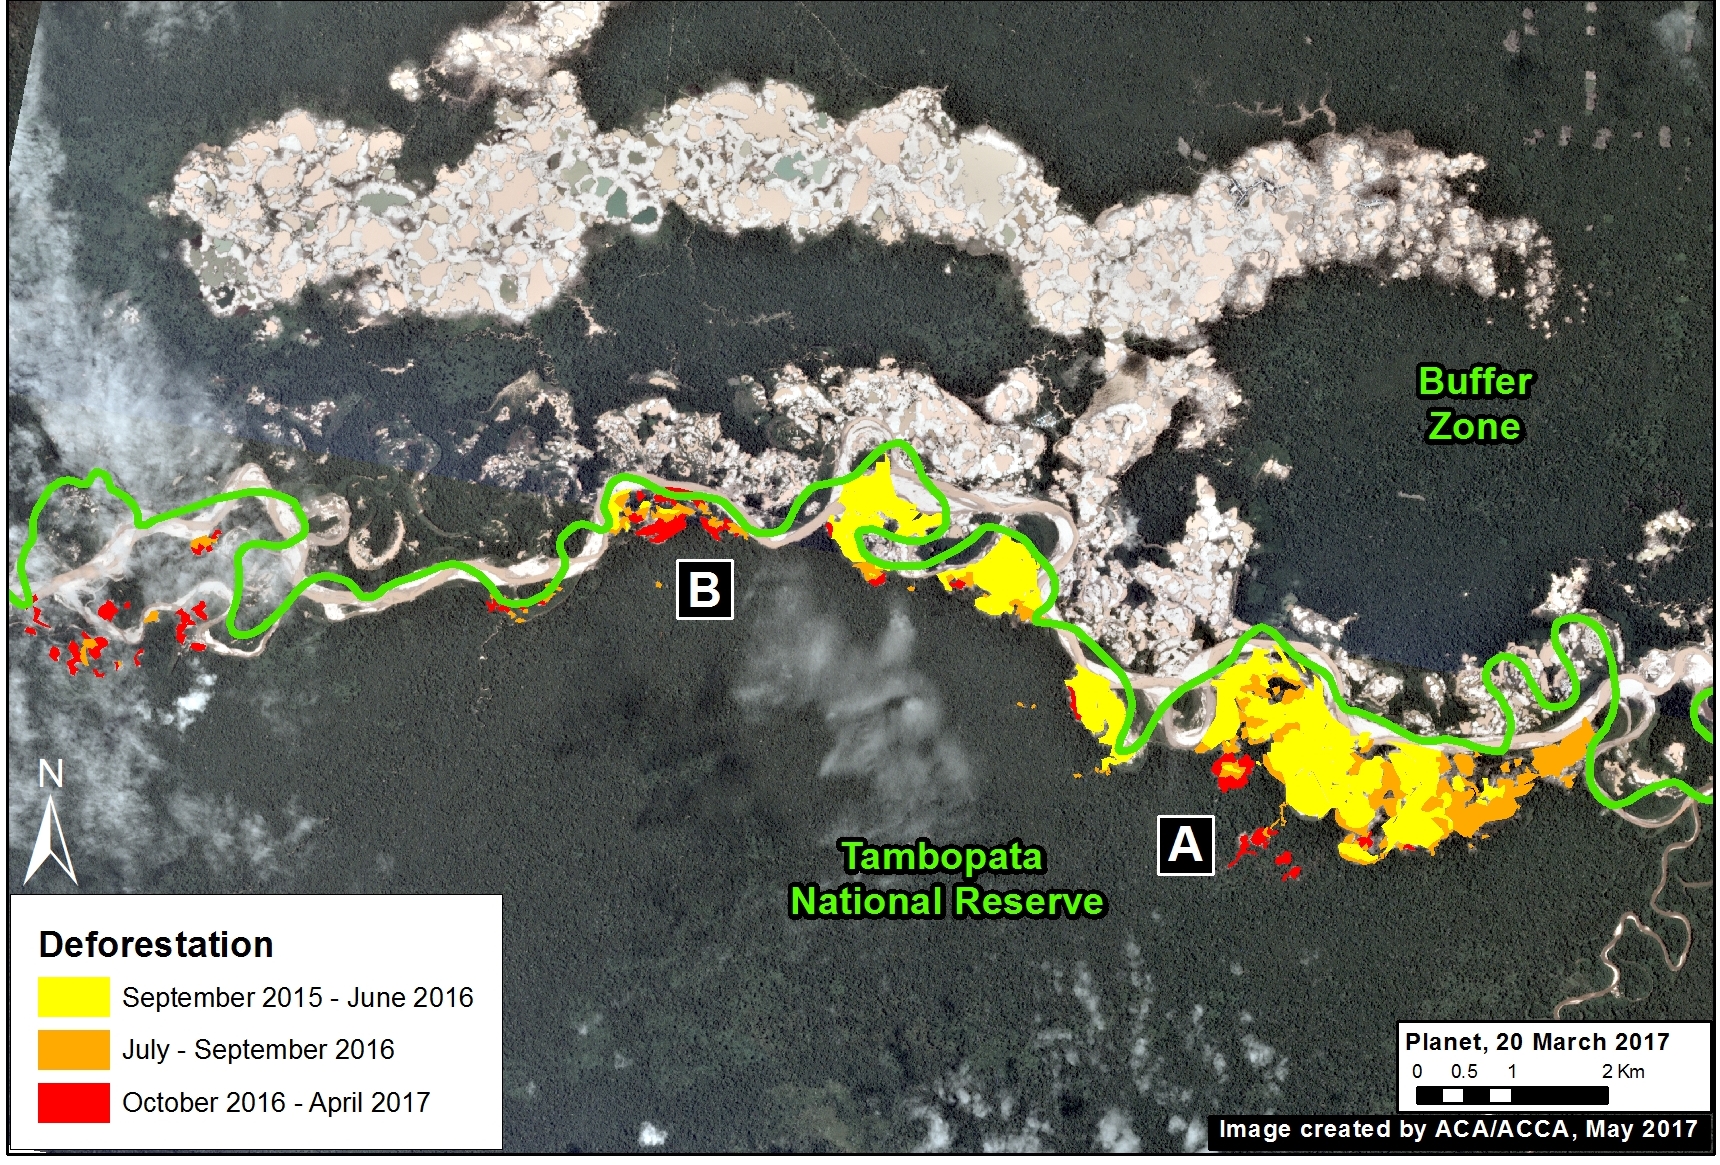
Image 61. Data: Planet, MAAP, SERNANP

Gold Mining Deforestation within Reserve

Image 61 shows the trajectory of illegal gold mining deforestation within Tambopata National Reserve, from the initial invasion in September 2015 to May 2017. Although the rate has decreased, total deforestation within the Reserve has increased to 1,360 acres (550 hectares*) since September 2015. The Peruvian national protected areas agency, SERNANP, is stating that 90% of the invaded area has been cleared of illegal miners.

* Our estimate of 550 hectares refers specifically to gold mining deforestation within Tambopata National Reserve since September 2015. SERNANP’s estimate of 750 hectares includes all mining activities (not just deforestation) since the creation of the Reserve.

Decreasing Deforestation Rate

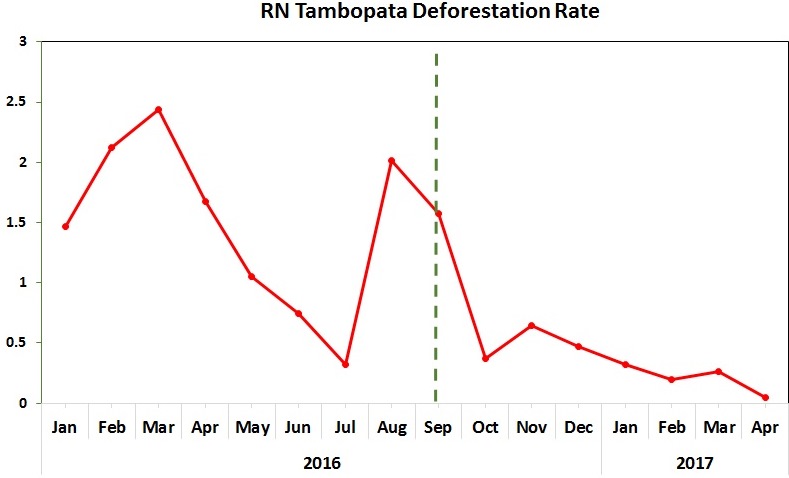
Table 61 shows how the rate of gold mining deforestation within Tambopata National Reserve between January 2016 and April 2017. Peaks in deforestation occurred in March and August 2016, followed by a sharp decrease in September, when the Peruvian government carried out a series of raids within the Reserve.

Table 61. Data: MAAP

Two Areas to Watch

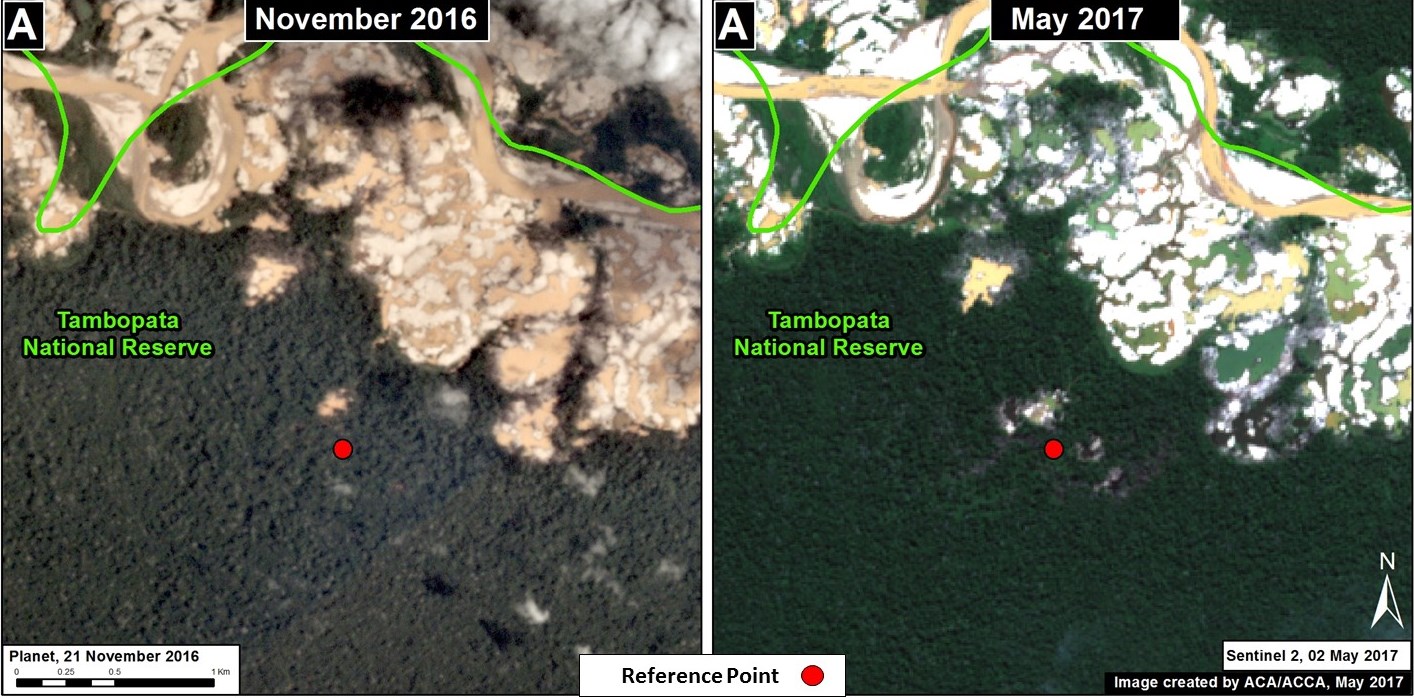
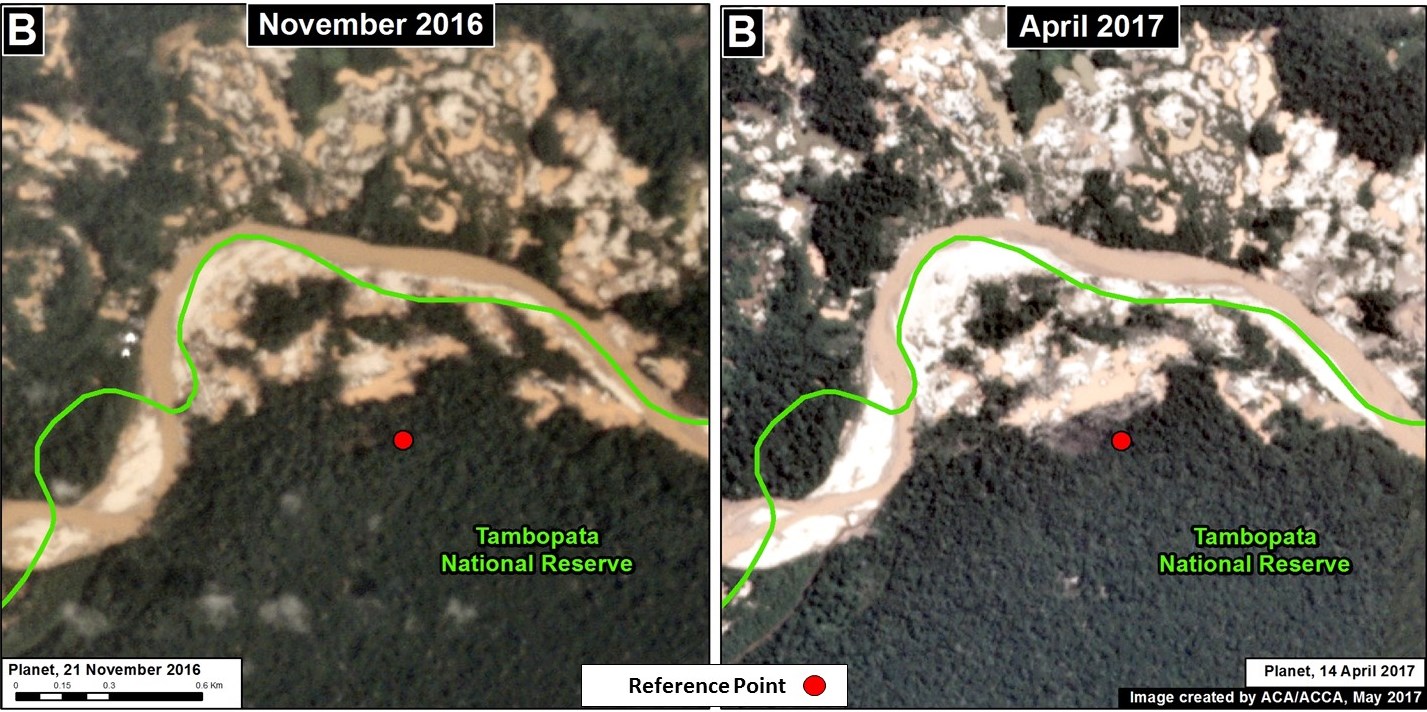
We detected, however, some recent mining activity in two areas within Tambopata National Reserve (Insets A and B in Image 61). Images 61A and 61B show these areas between November 2016 (left panel) and May 2017 (right panel). The red dots () indicate the same location across time between the panels.

Image 61a. Data: SERNANP, RapidEye/Planet, Sentinel/ESA
Image 61b Data: SERNANP, RapidEye/Planet, Sentinel/ESA

In response to these continued, isolated incursions by illegal miners in Tambopata National Reserve, SERNANP has been continuously carrying out patrols and raids, with the goal of completely eliminating illegal gold mining from the Reserve. In fact, prior to this publication, SERNANP, together with other authorities, carried out a raid in the area shown in Image 61b.

Citation

Finer M, Novoa S, Olexy T (2017) Illegal Gold Mining Decreases in Tambopata National Reserve. MAAP: 61.

MAAP #60: Gold Mining Increases in Buffer Zone of Tambopata National Reserve

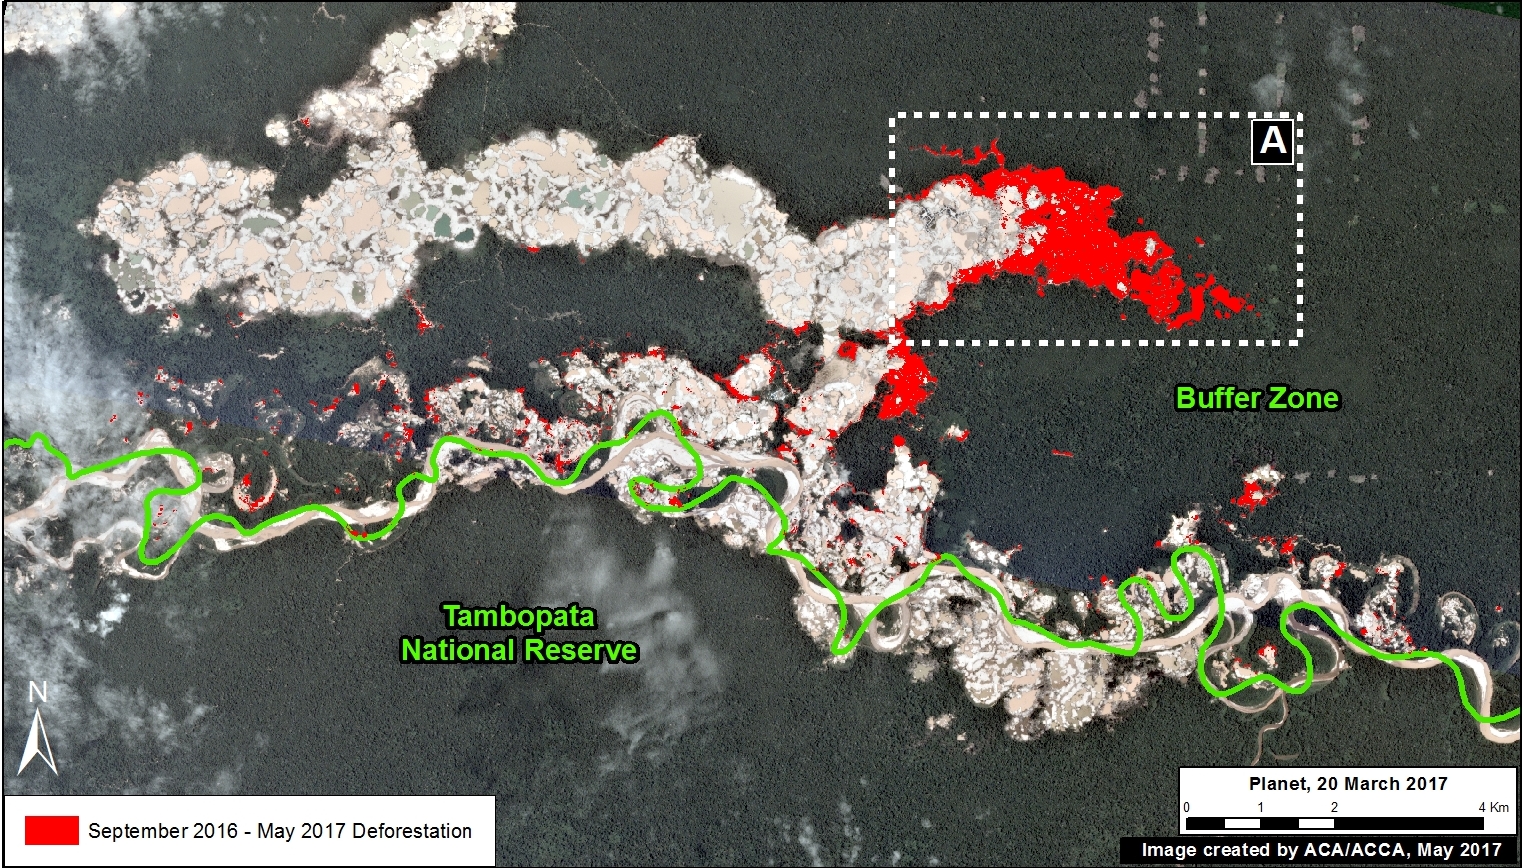
In the previous MAAP #50, we presented an analysis of the extent of gold mining deforestation in the southern Peruvian Amazon as of September 2016. Here, we partially update the data for the area within the buffer zone of Tambopata National Reserve.* We document the increase of 1,135 acres (460 hectares) of illegal mining deforestation during the last 8 months, from September 2016 to May 2017 (see red in Image 60). That brings the total deforested area in the buffer zone to 10,970 acres (4,440 hectares) since 2012.

Image 60. Data: Planet, MAAP, SERNANP

*The buffer zone does not form part of the respective protected area, thus it is not under the jurisdiction of the Peruvian national protected areas agency, SERNANP. However, the illegal activities that are being carried out in the buffer zone are putting the conservation values of the protected area at risk, and are under the jurisdiction of other entities in the Peruvian government.

High-Resolution Zooms

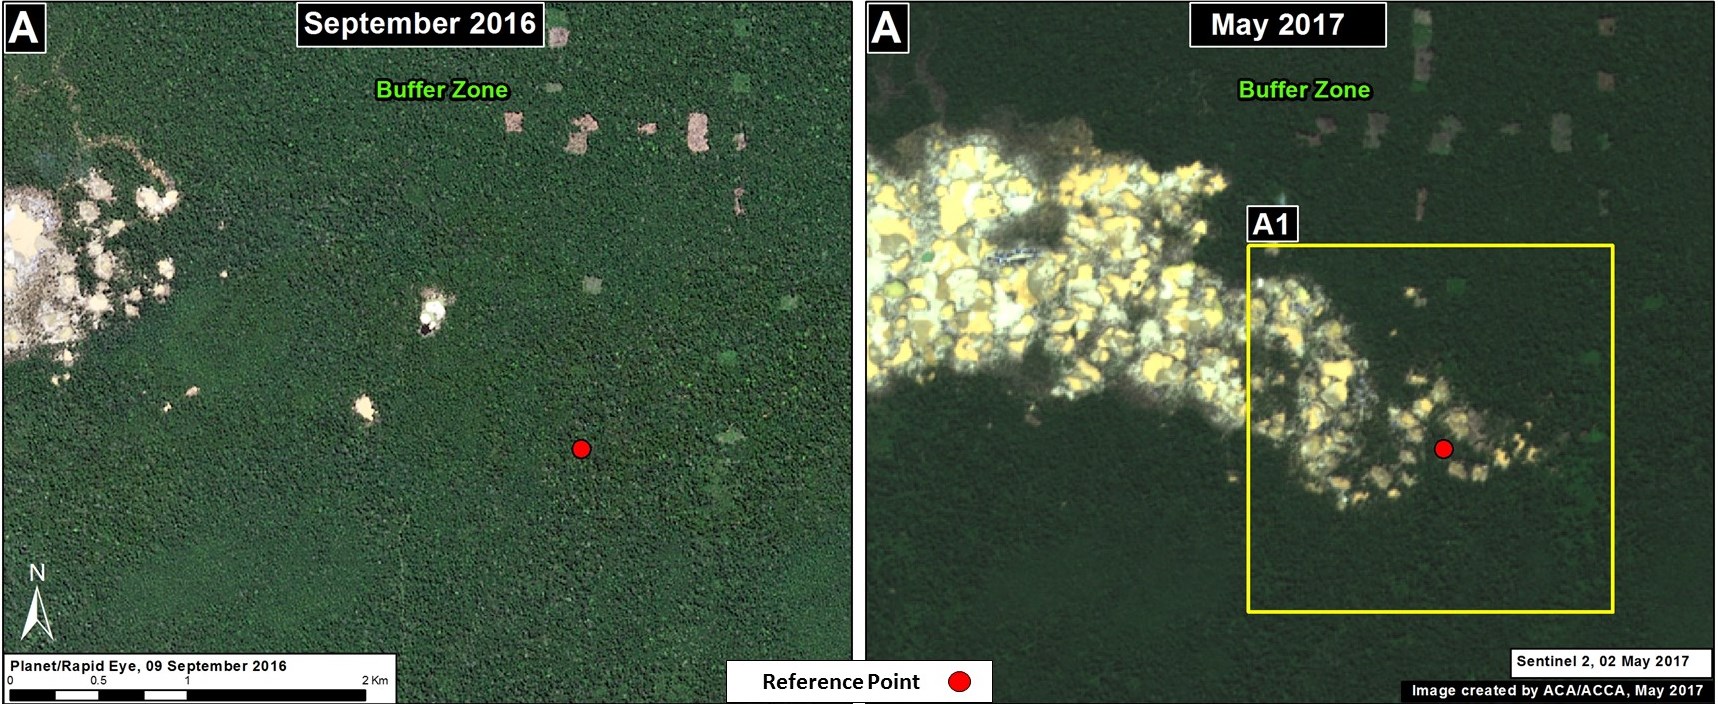
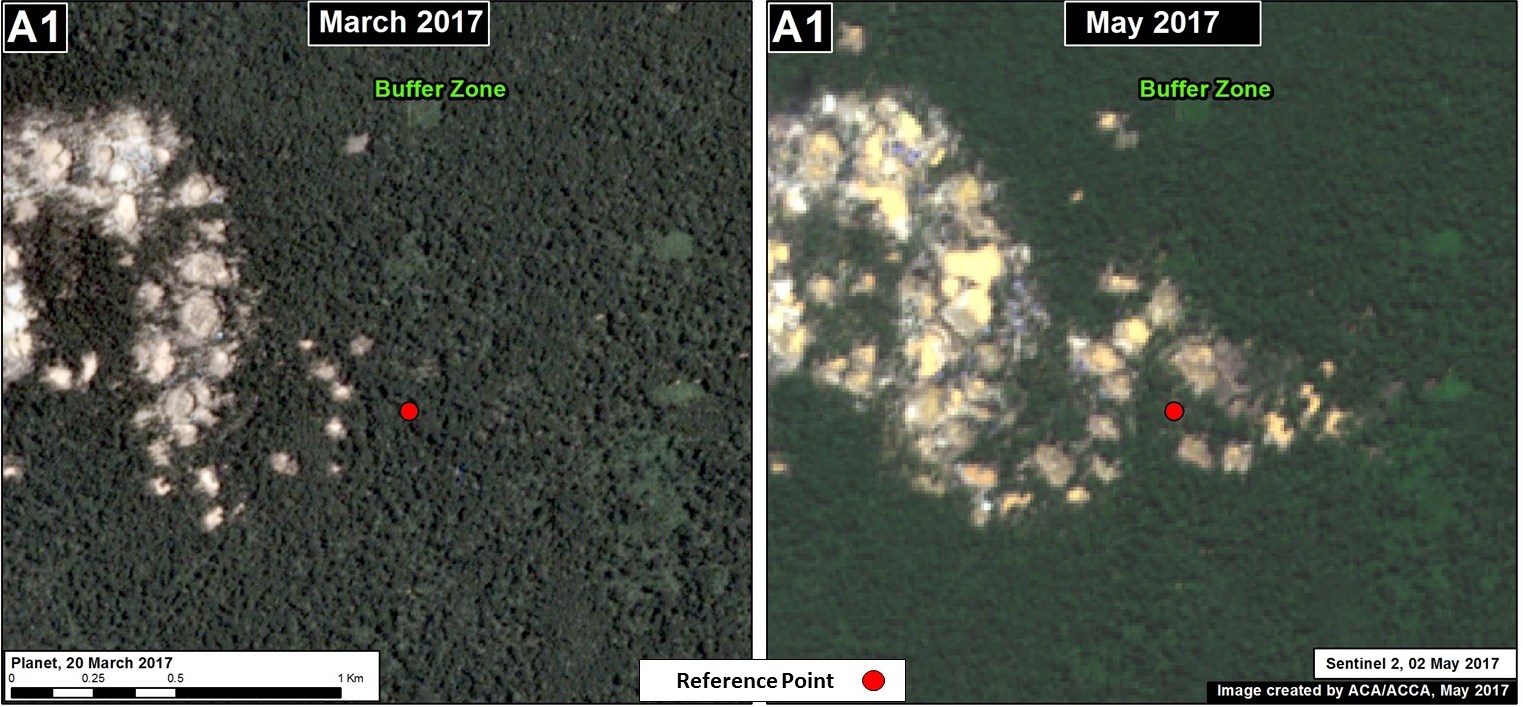
Image 60a shows the buffer zone’s most active deforestation front between September 2016 (left panel) and May 2017 (right panel). Inset A1 highlights the most recent deforestation, showing the advance just between March (left panel) and May (right panel) 2017. The red points () indicate the same place on both panels.

Image 60a. Data: RapidEye/Planet, Sentinel/ESA
Inset A1. Data: RapidEye/Planet, Sentinel/ESA

Movement of Illegal Mining Camps

Image 60b is a GIF that shows the continual movement of illegal mining camps towards the active deforestation front, between November 2015 and March 2017. Note that previous camps are abandoned after the relocation.

Image 60b. Data: DigitalGlobe (Nextview), Planet

Legal Implications

Recently, a bill has been presented in the Peruvian Congress that proposes that illegal mining should not be classified as an organized crime. However, as evidenced in this report, the illegal gold mining camps operate in a highly organized manner.

Citation

Finer M, Olexy T, Novoa S (2017) Gold Mining Increases in the Buffer Zone of Tambopata National Reserve. MAAP: 60.

MAAP #58: Link between Peru’s Flooding and Warm Coastal Waters

In previous articles MAAP #56 and MAAP #57, we presented a series of striking satellite images of the recent deadly floods in northern Peru. Satellites provide additional types of data critical to better understanding events such as extreme flooding. Here, we present two more types of satellite data related to the flooding: ocean water temperature and precipitation.


Warming Coastal Waters

Image 58a. Data: NOAA

Satellite data from NOAA (the U.S. National Oceanic and Atmospheric Administration) clearly shows the warming of the northern Peruvian coastal waters immediately before and during the heavy rains and flooding (1, 2). Specifically, Image 58a shows the sudden warming in January, followed by intensifying warming in February and March (white inset box indicates primary flooding zone). Peruvian experts have referred to this phenomenon as “coastal El Niño”.

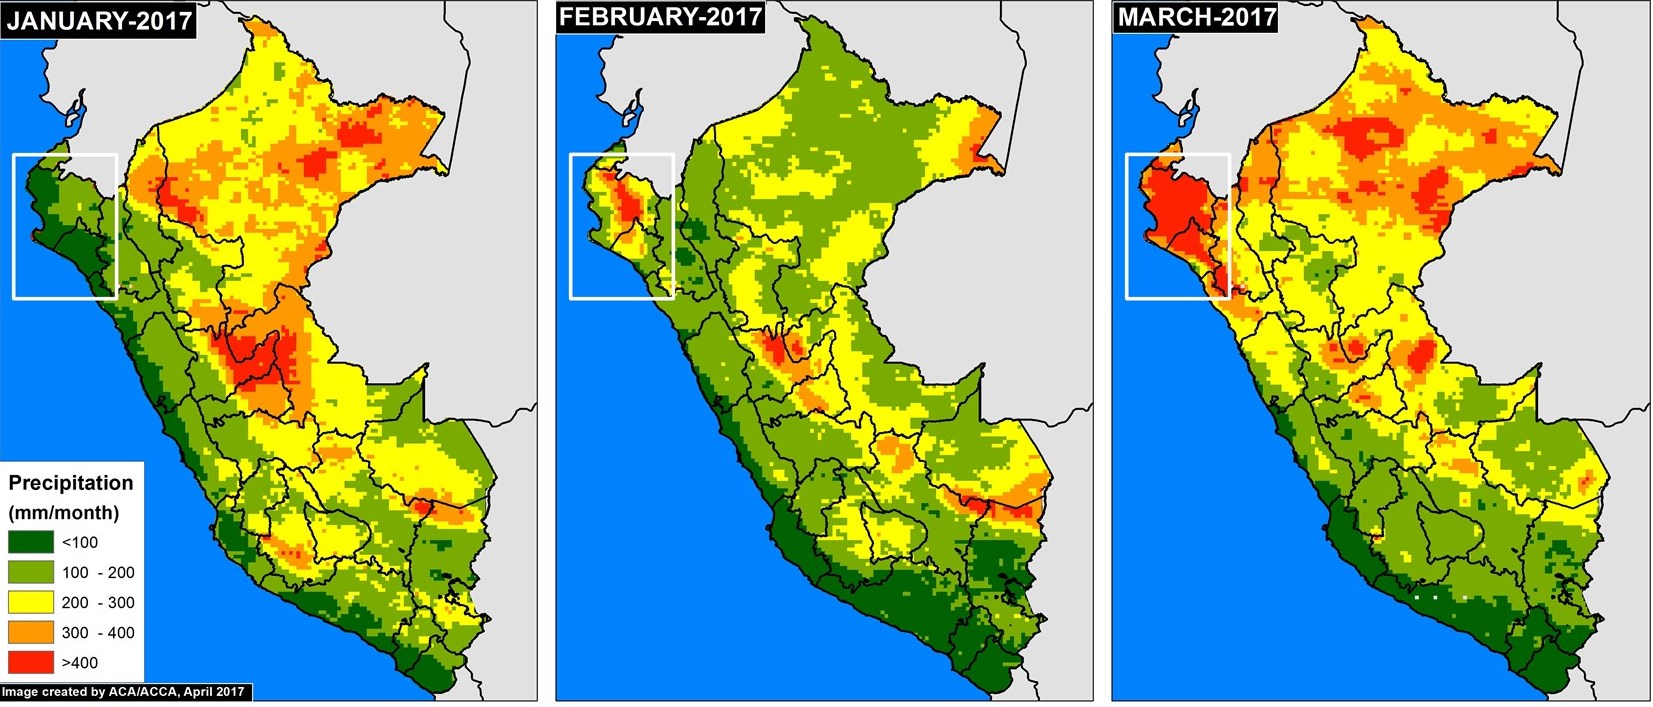
Heavy Rains

Image 58b. Data: Senamhi, GPM/NASA

Image 58b shows the resulting accumulated monthly precipitation totals (white inset box indicates primary flooding zone). In January, as expected, the dry northern coast had much lower precipitation than the Amazon region to the east. In February and March, however, the northern coast experienced abnormally intense rainfall, even more than many parts of the Amazon.

Floods linked to Climate Change?

Questions have emerged regarding the link between the deadly Peruvian floods and climate change (3). As seen in the images above, the sudden appearance of warm coastal waters coincides with intense rains in the primary flooding zone. Additional analysis is needed to better understand the link between the Peruvian floods and climate change, but such events are consistent with predictions related to heavy rains fueled by ocean warming due to climate change (3). Climate change could also increase the frequency or intensity of El Niño events (4).

References

  1. Villa, L. (27 de marzo 2017). Radar Sentinel-1: Evaluación Preliminar del Impacto del Niño Costero en Perú (Parte II). [Mensaje en un blog]. Recuperado de: http://luciovilla.blogspot.com/2017/03/radar-sentinel-1-evaluacion-preliminar_27.html
  2. Villa, L. (17 de marzo 2017). Radar Sentinel-1: Evaluación Preliminar del Impacto del Niño Costero en Perú (Parte I). [Mensaje en un blog]. Recuperado de: http://luciovilla.blogspot.com/2017/03/radar-sentinel-1-evaluacion-preliminar.html
  3. Berwyn B (2017) Peru’s Floods Follow Climate Change’s Deadly Extreme Weather Trend. Inside Climate News. Link: https://insideclimatenews.org/news/24032017/peru-floods-extreme-weather-climate-global-warming-el-nino
  4. Fraser B (2017) Coastal El Niño catches Peru by surprise. EcoAmericas March 2017.

Citation

Finer M, Novoa S, Gacke S (2017) Link between Peru’s Flooding and Warm Coastal Waters. MAAP: 58.