Tropical forests, especially the Amazon, sequester huge amounts of carbon, one of the main greenhouse gases driving climate change.
Here, we show the importance of protected areas and indigenous lands to safeguard these carbon stocks.
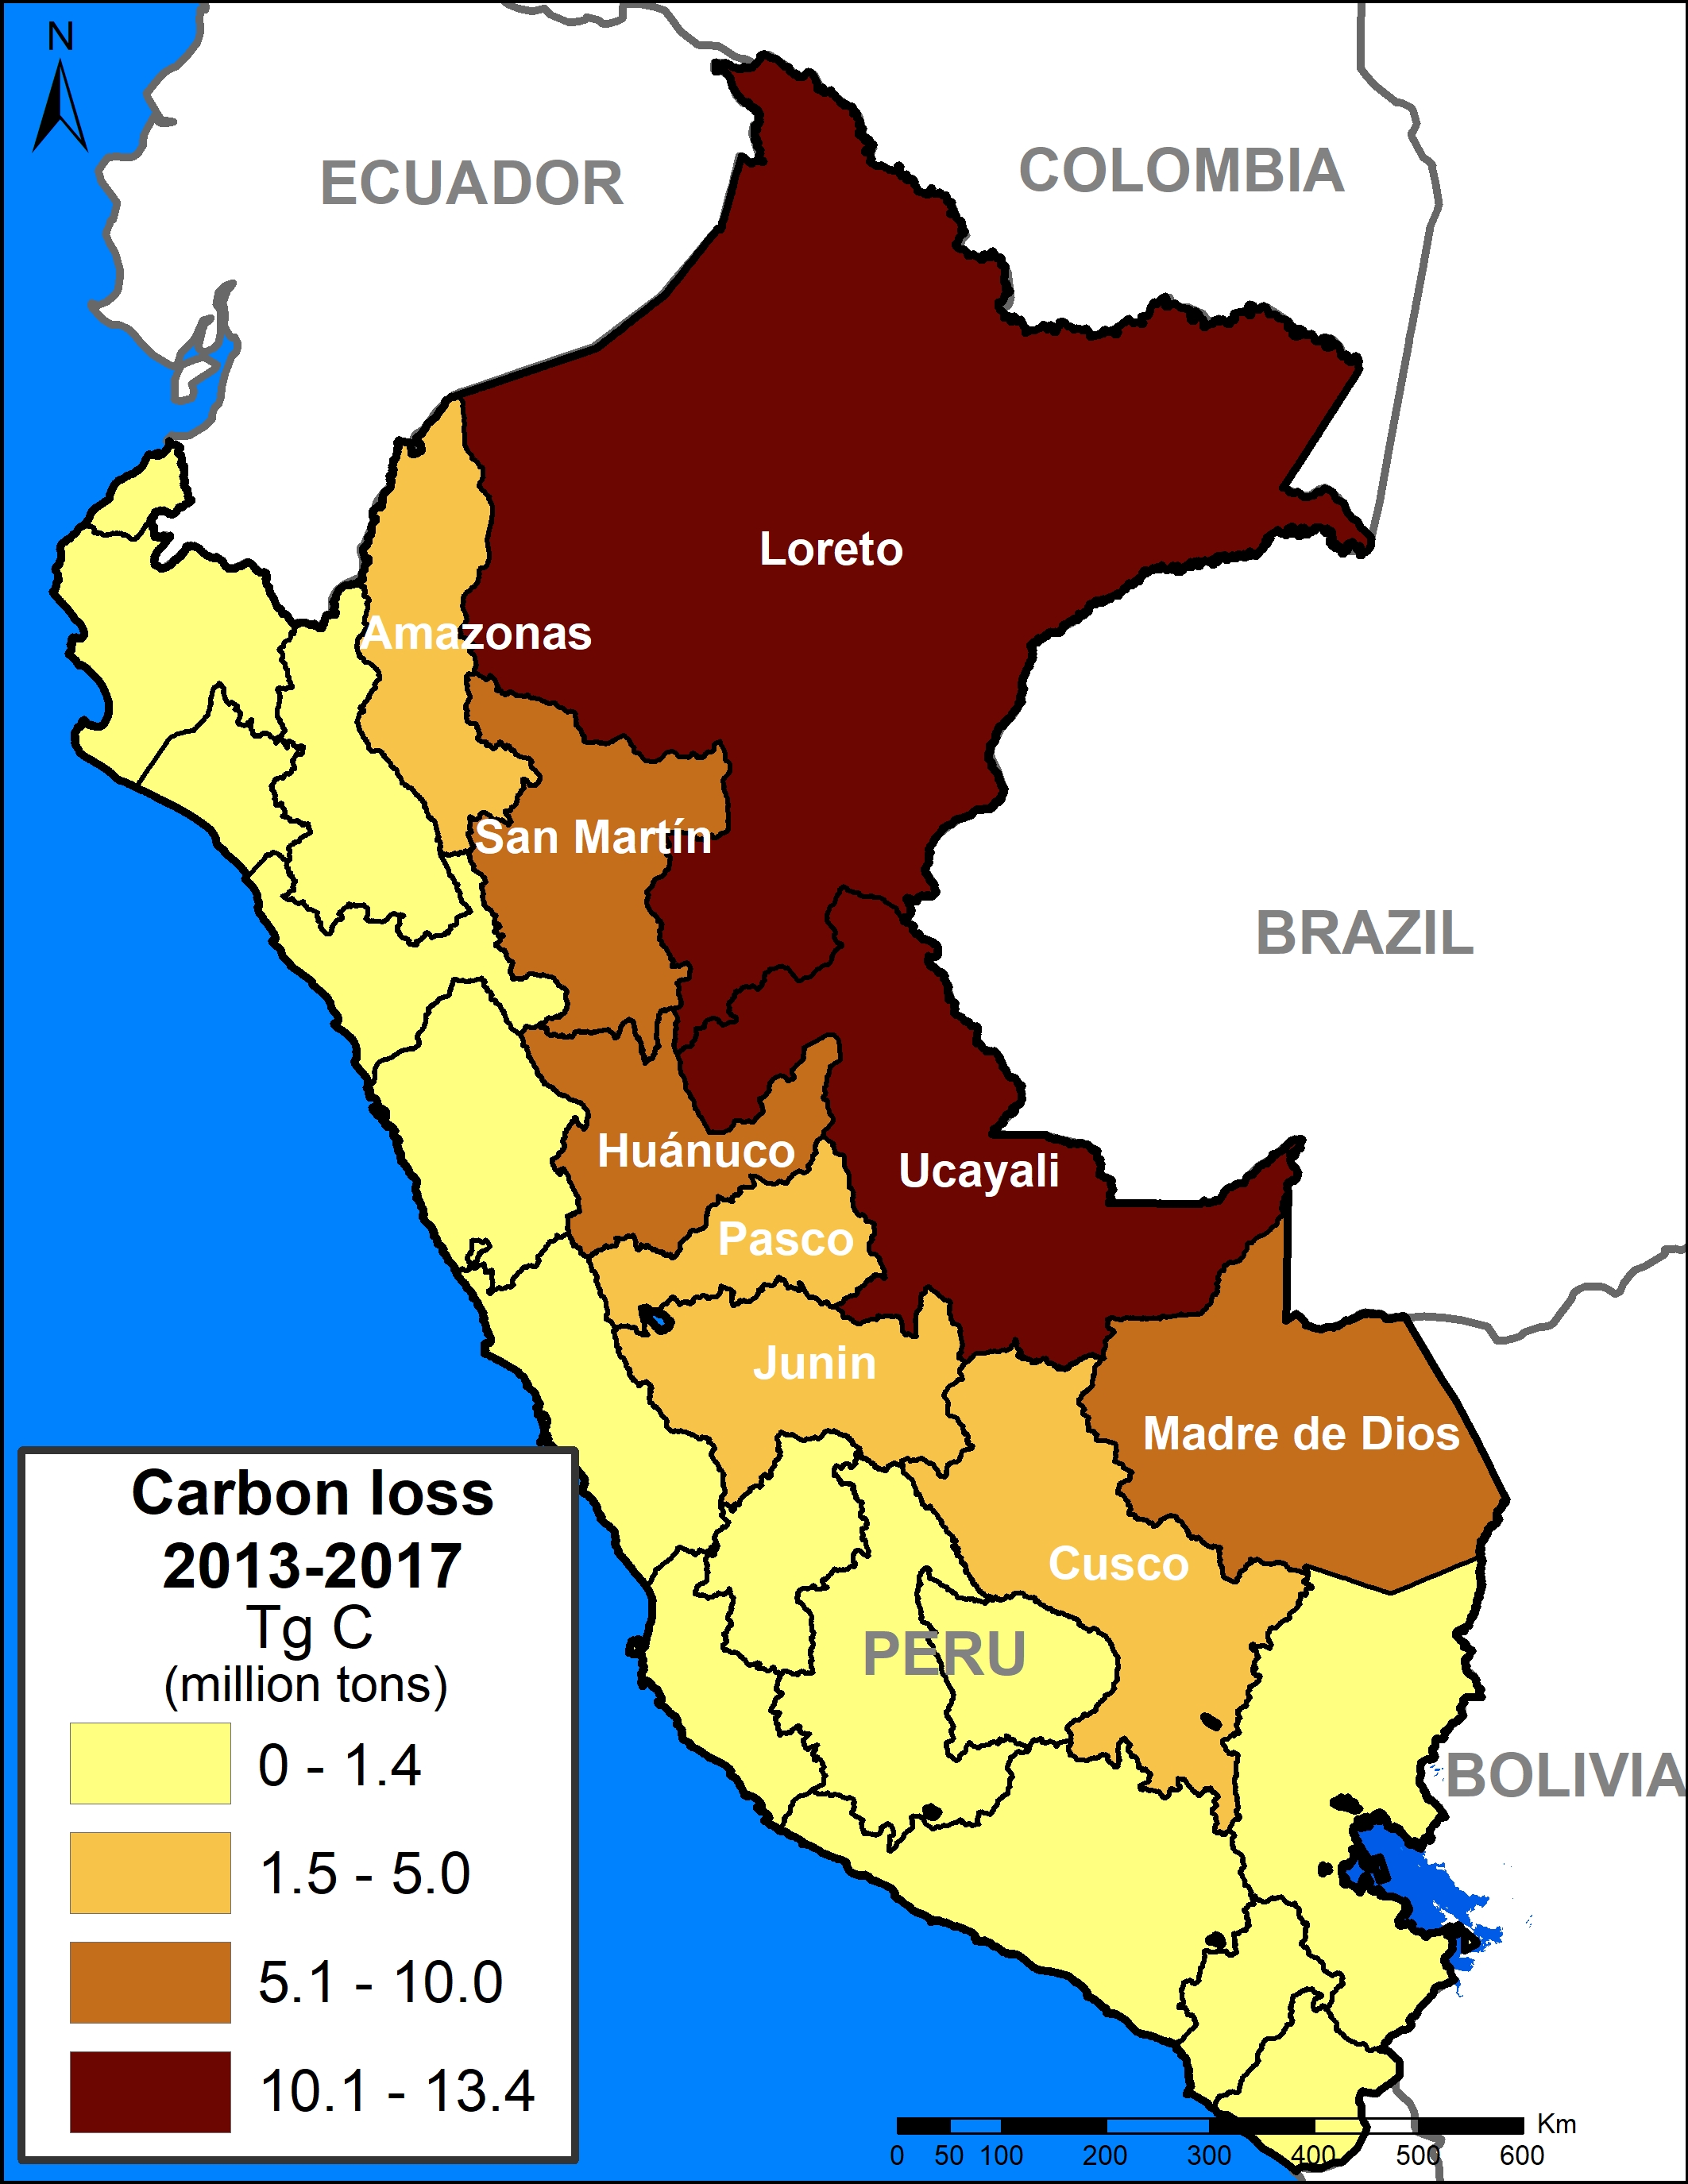
In MAAP #81, we estimated the loss of 59 million metric tons of carbon in the Peruvian Amazon during the last five years (2013-17) due to forest loss, especially deforestation from mining and agricultural activities.
This finding reveals that forest loss represents nearly half (47%) of Peru’s annual carbon emissions, including from burning fossil fuels.1,2
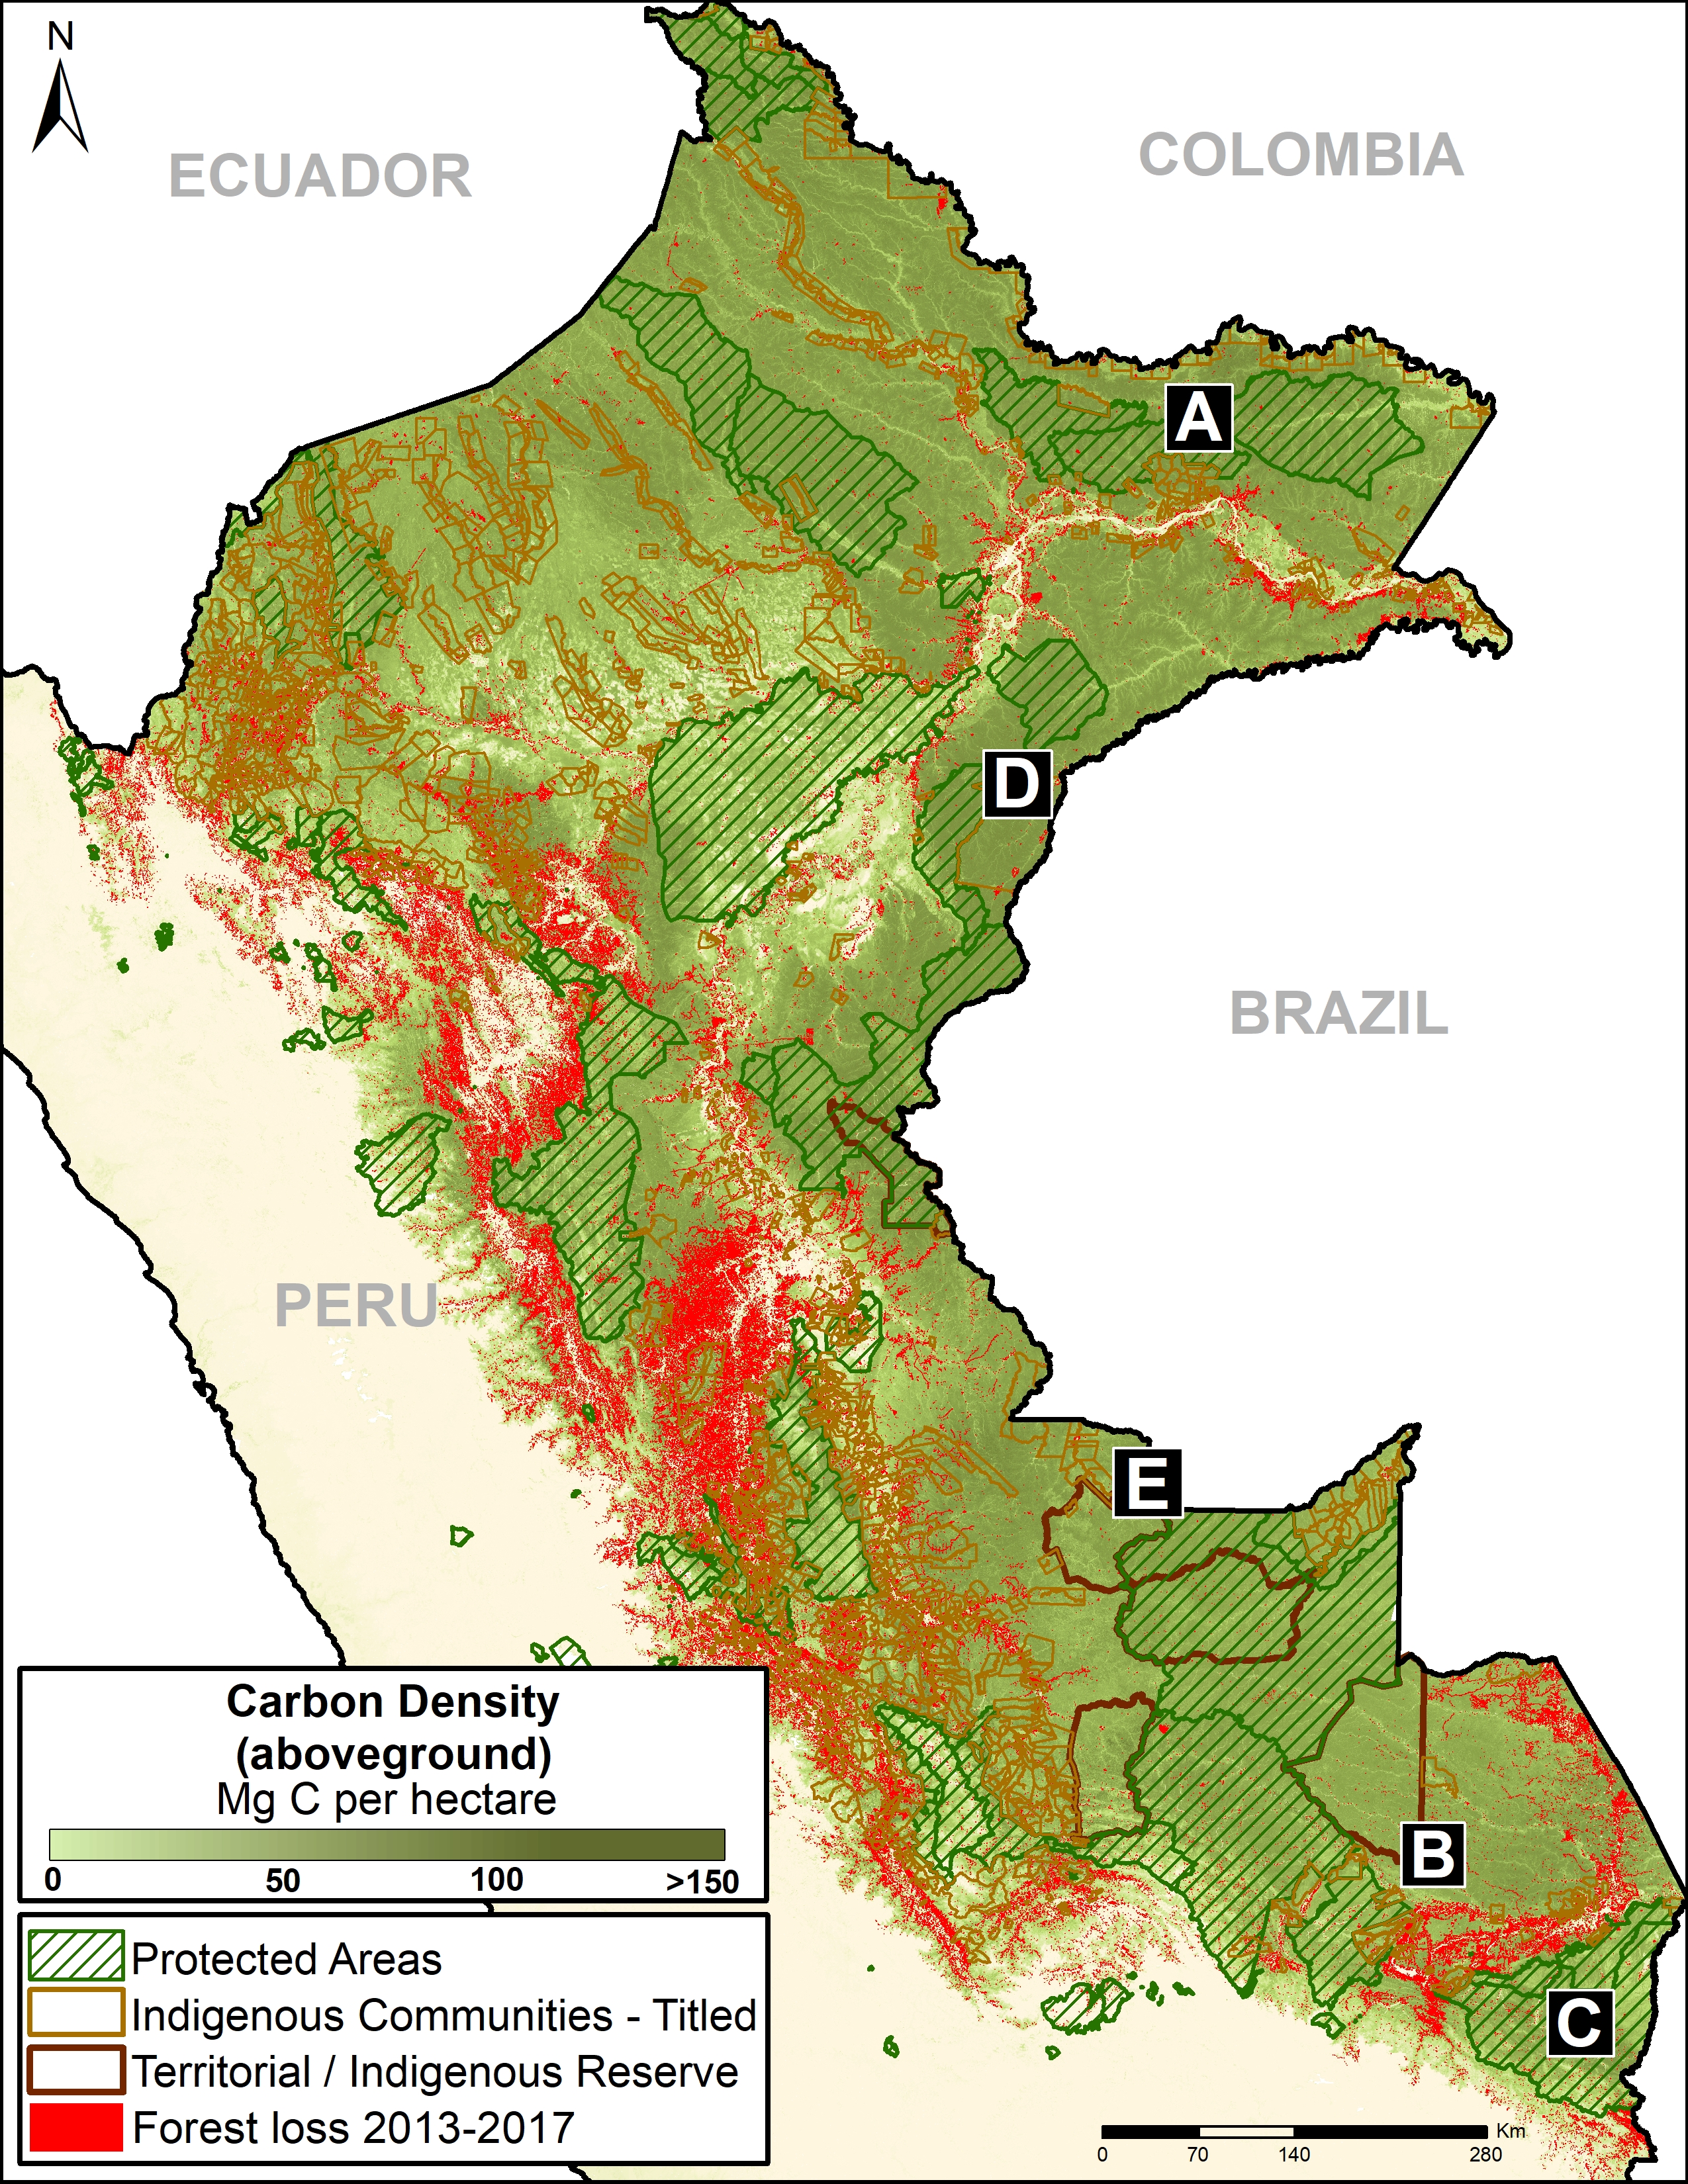
In contrast, here we show that protected areas and indigenous lands have safeguarded 3.17 billion metric tons of carbon, as of 2017.3,4
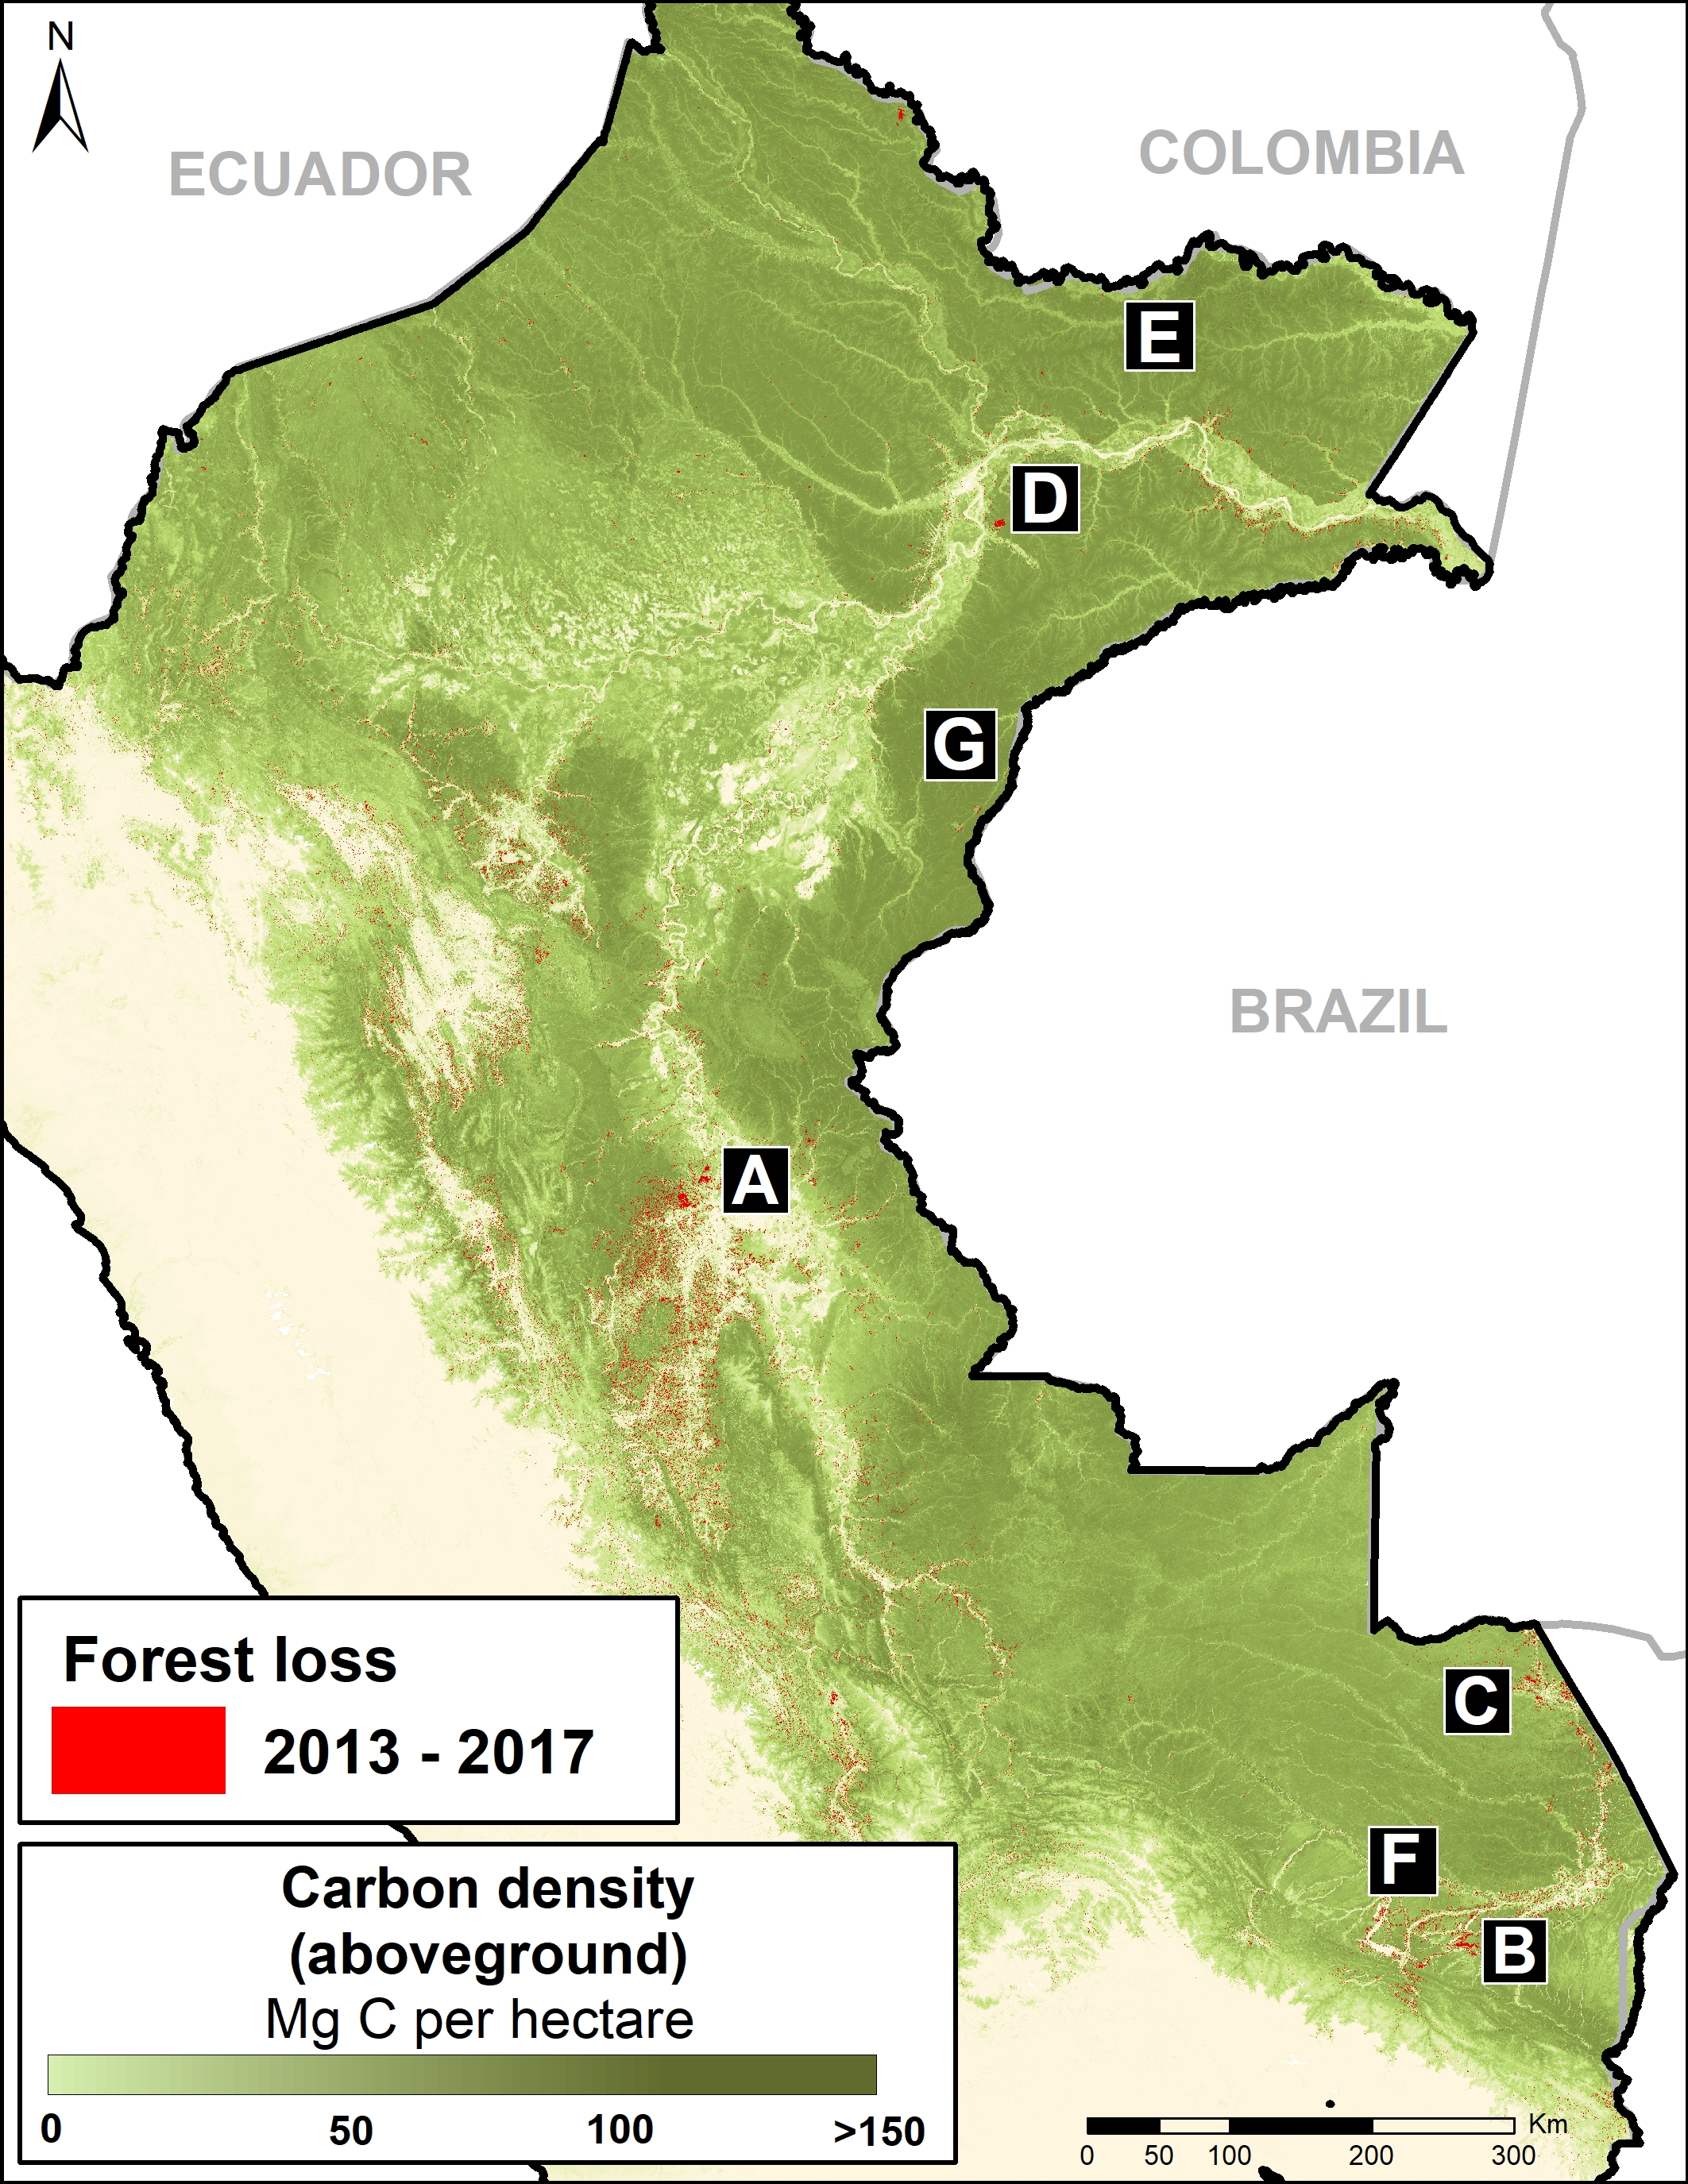
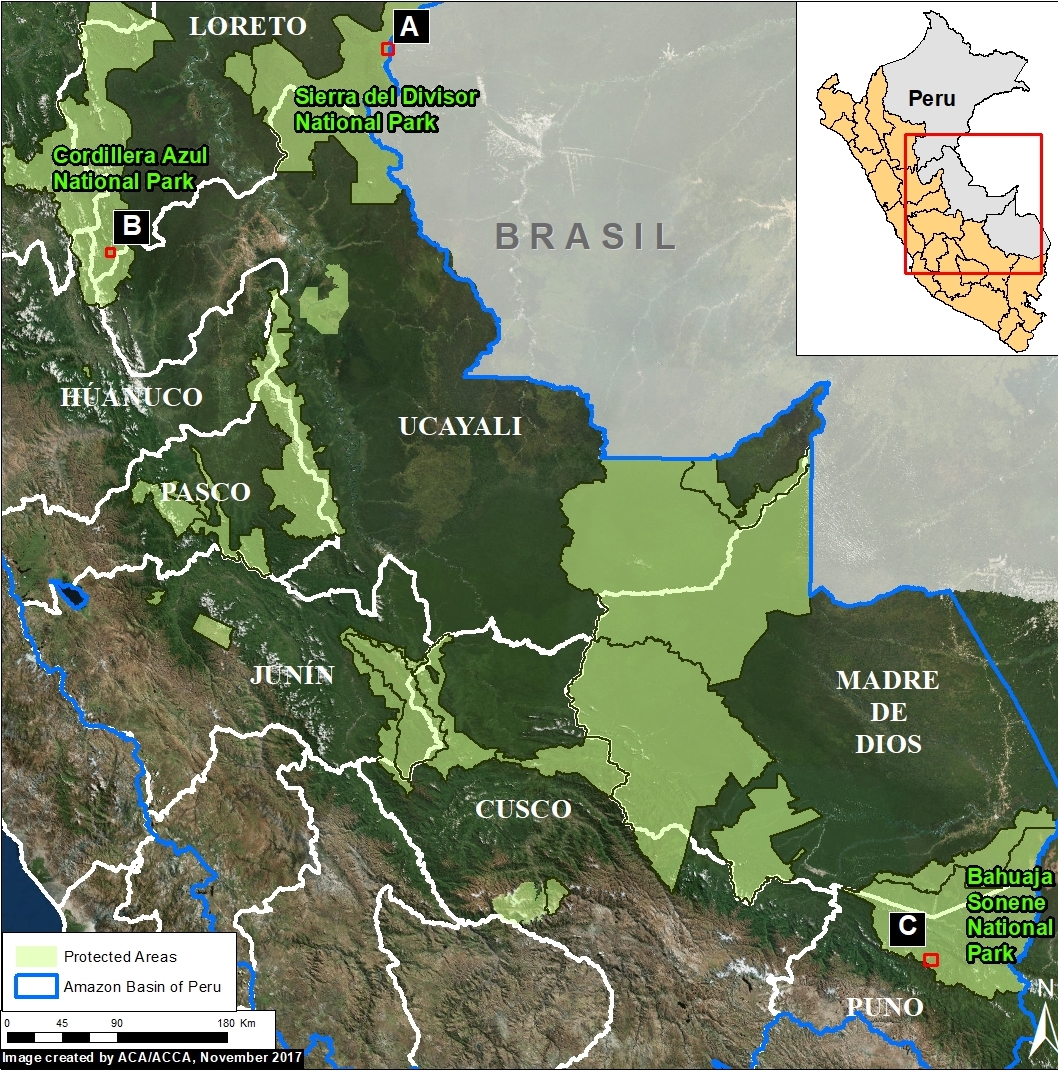
The Base Map (on the right) shows, in shades of green, the current carbon densities in relation to these areas.
The breakdown of results are:
1.85 billion tons safeguarded in the Peruvian national protected areas system;
1.15 billion tons safeguarded in titled native community lands; and
309.7 million tons safeguarded in Territorial Reserves for indigenous peoples in voluntary isolation.
The total safeguarded carbon (3.17 billion metric tons) is the equivalent to 2.5 years of carbon emissions from the United States.5
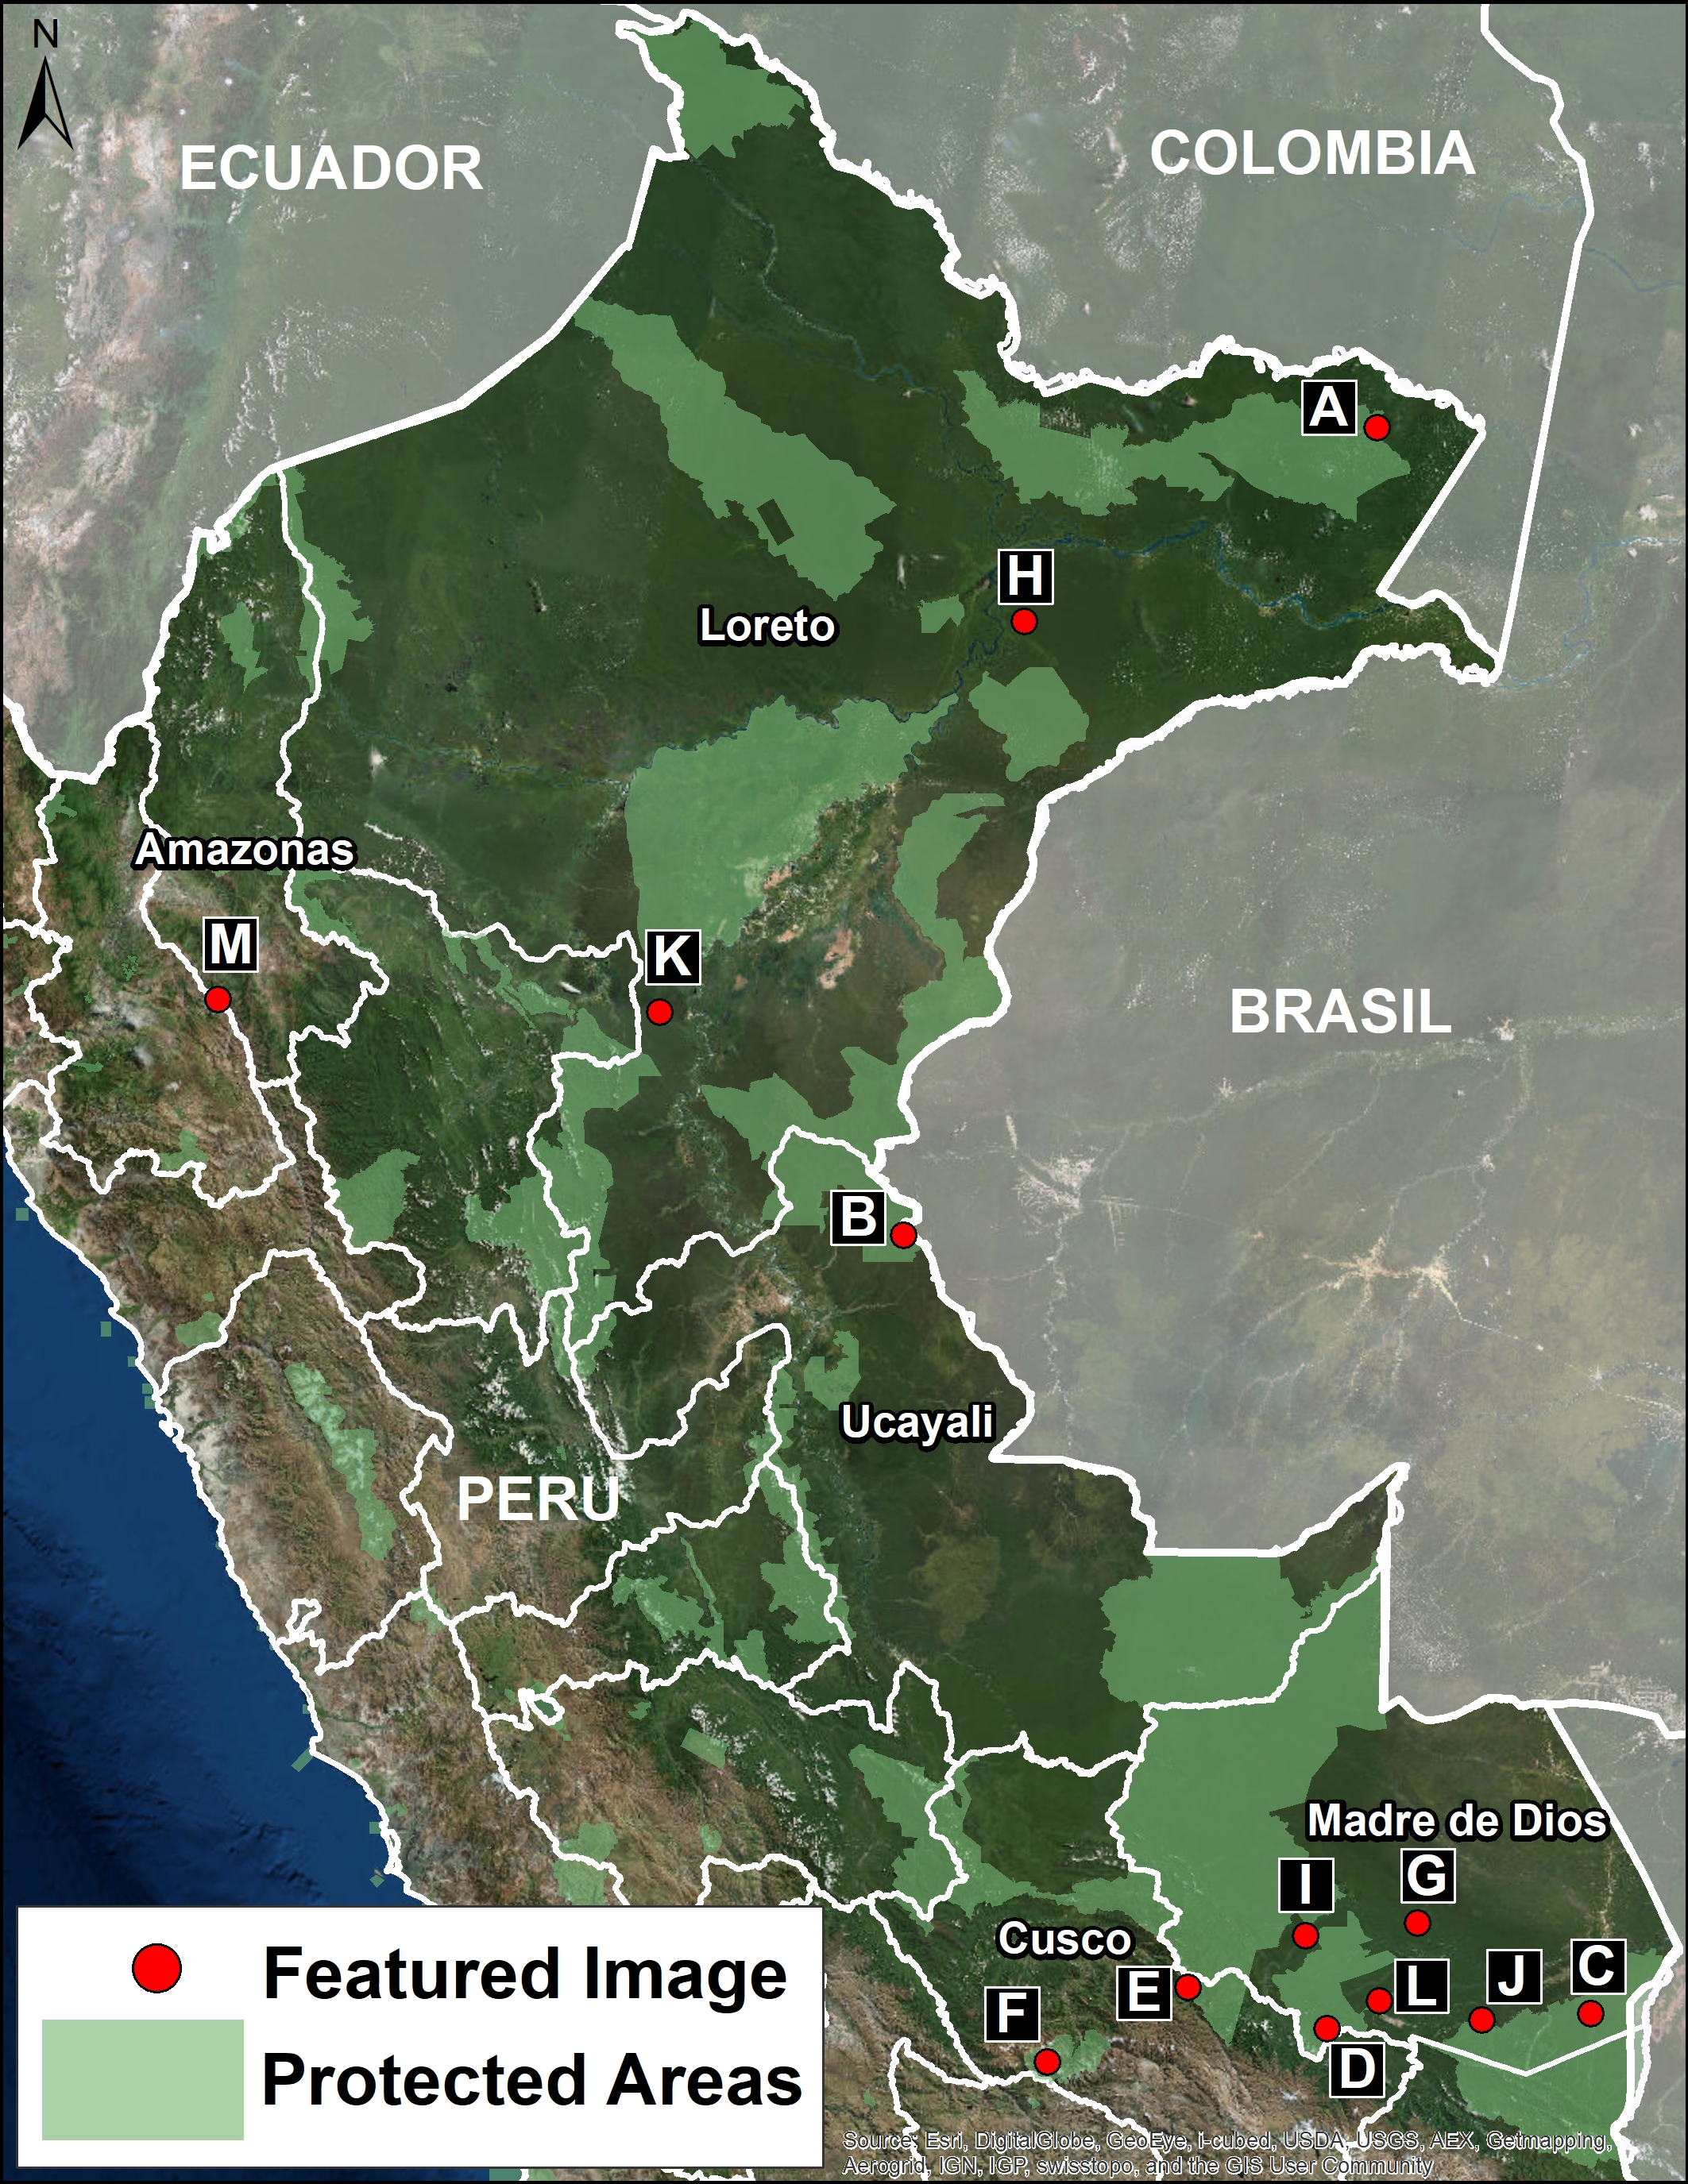
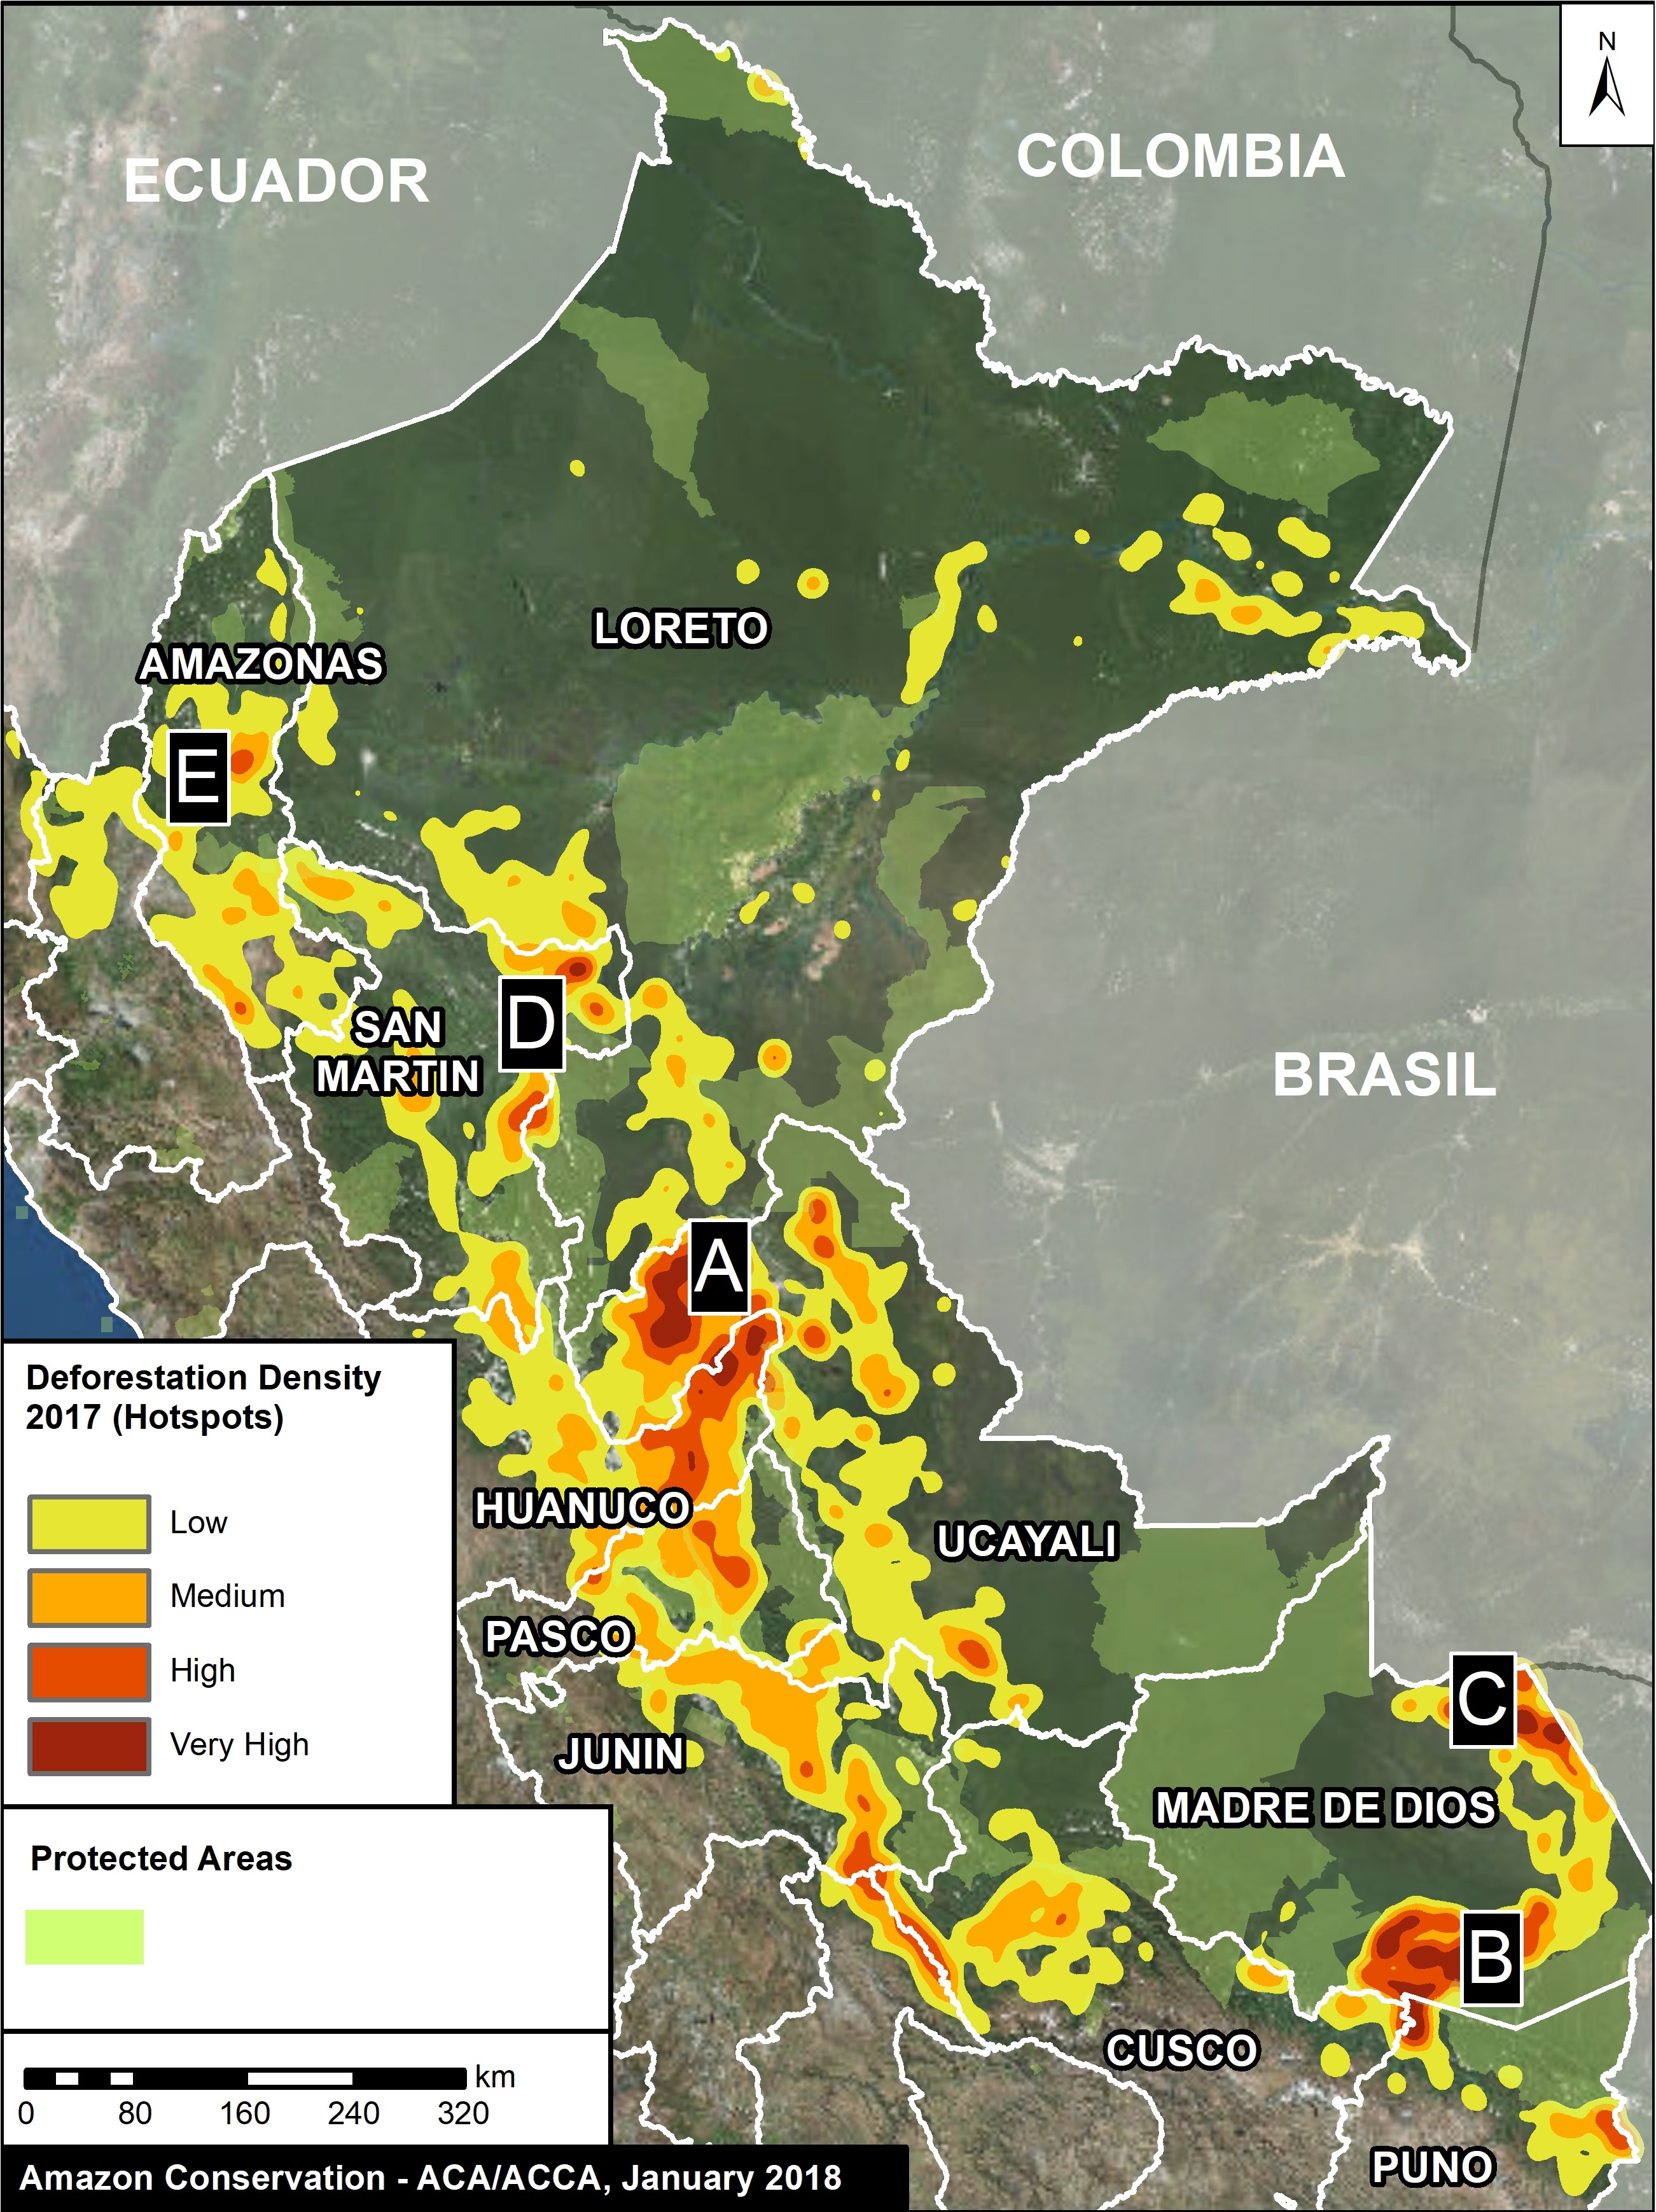
Below, we show several examples of how protected areas and indigenous lands are safeguarding carbon reservoirs in important areas, indicated by insets A-E.
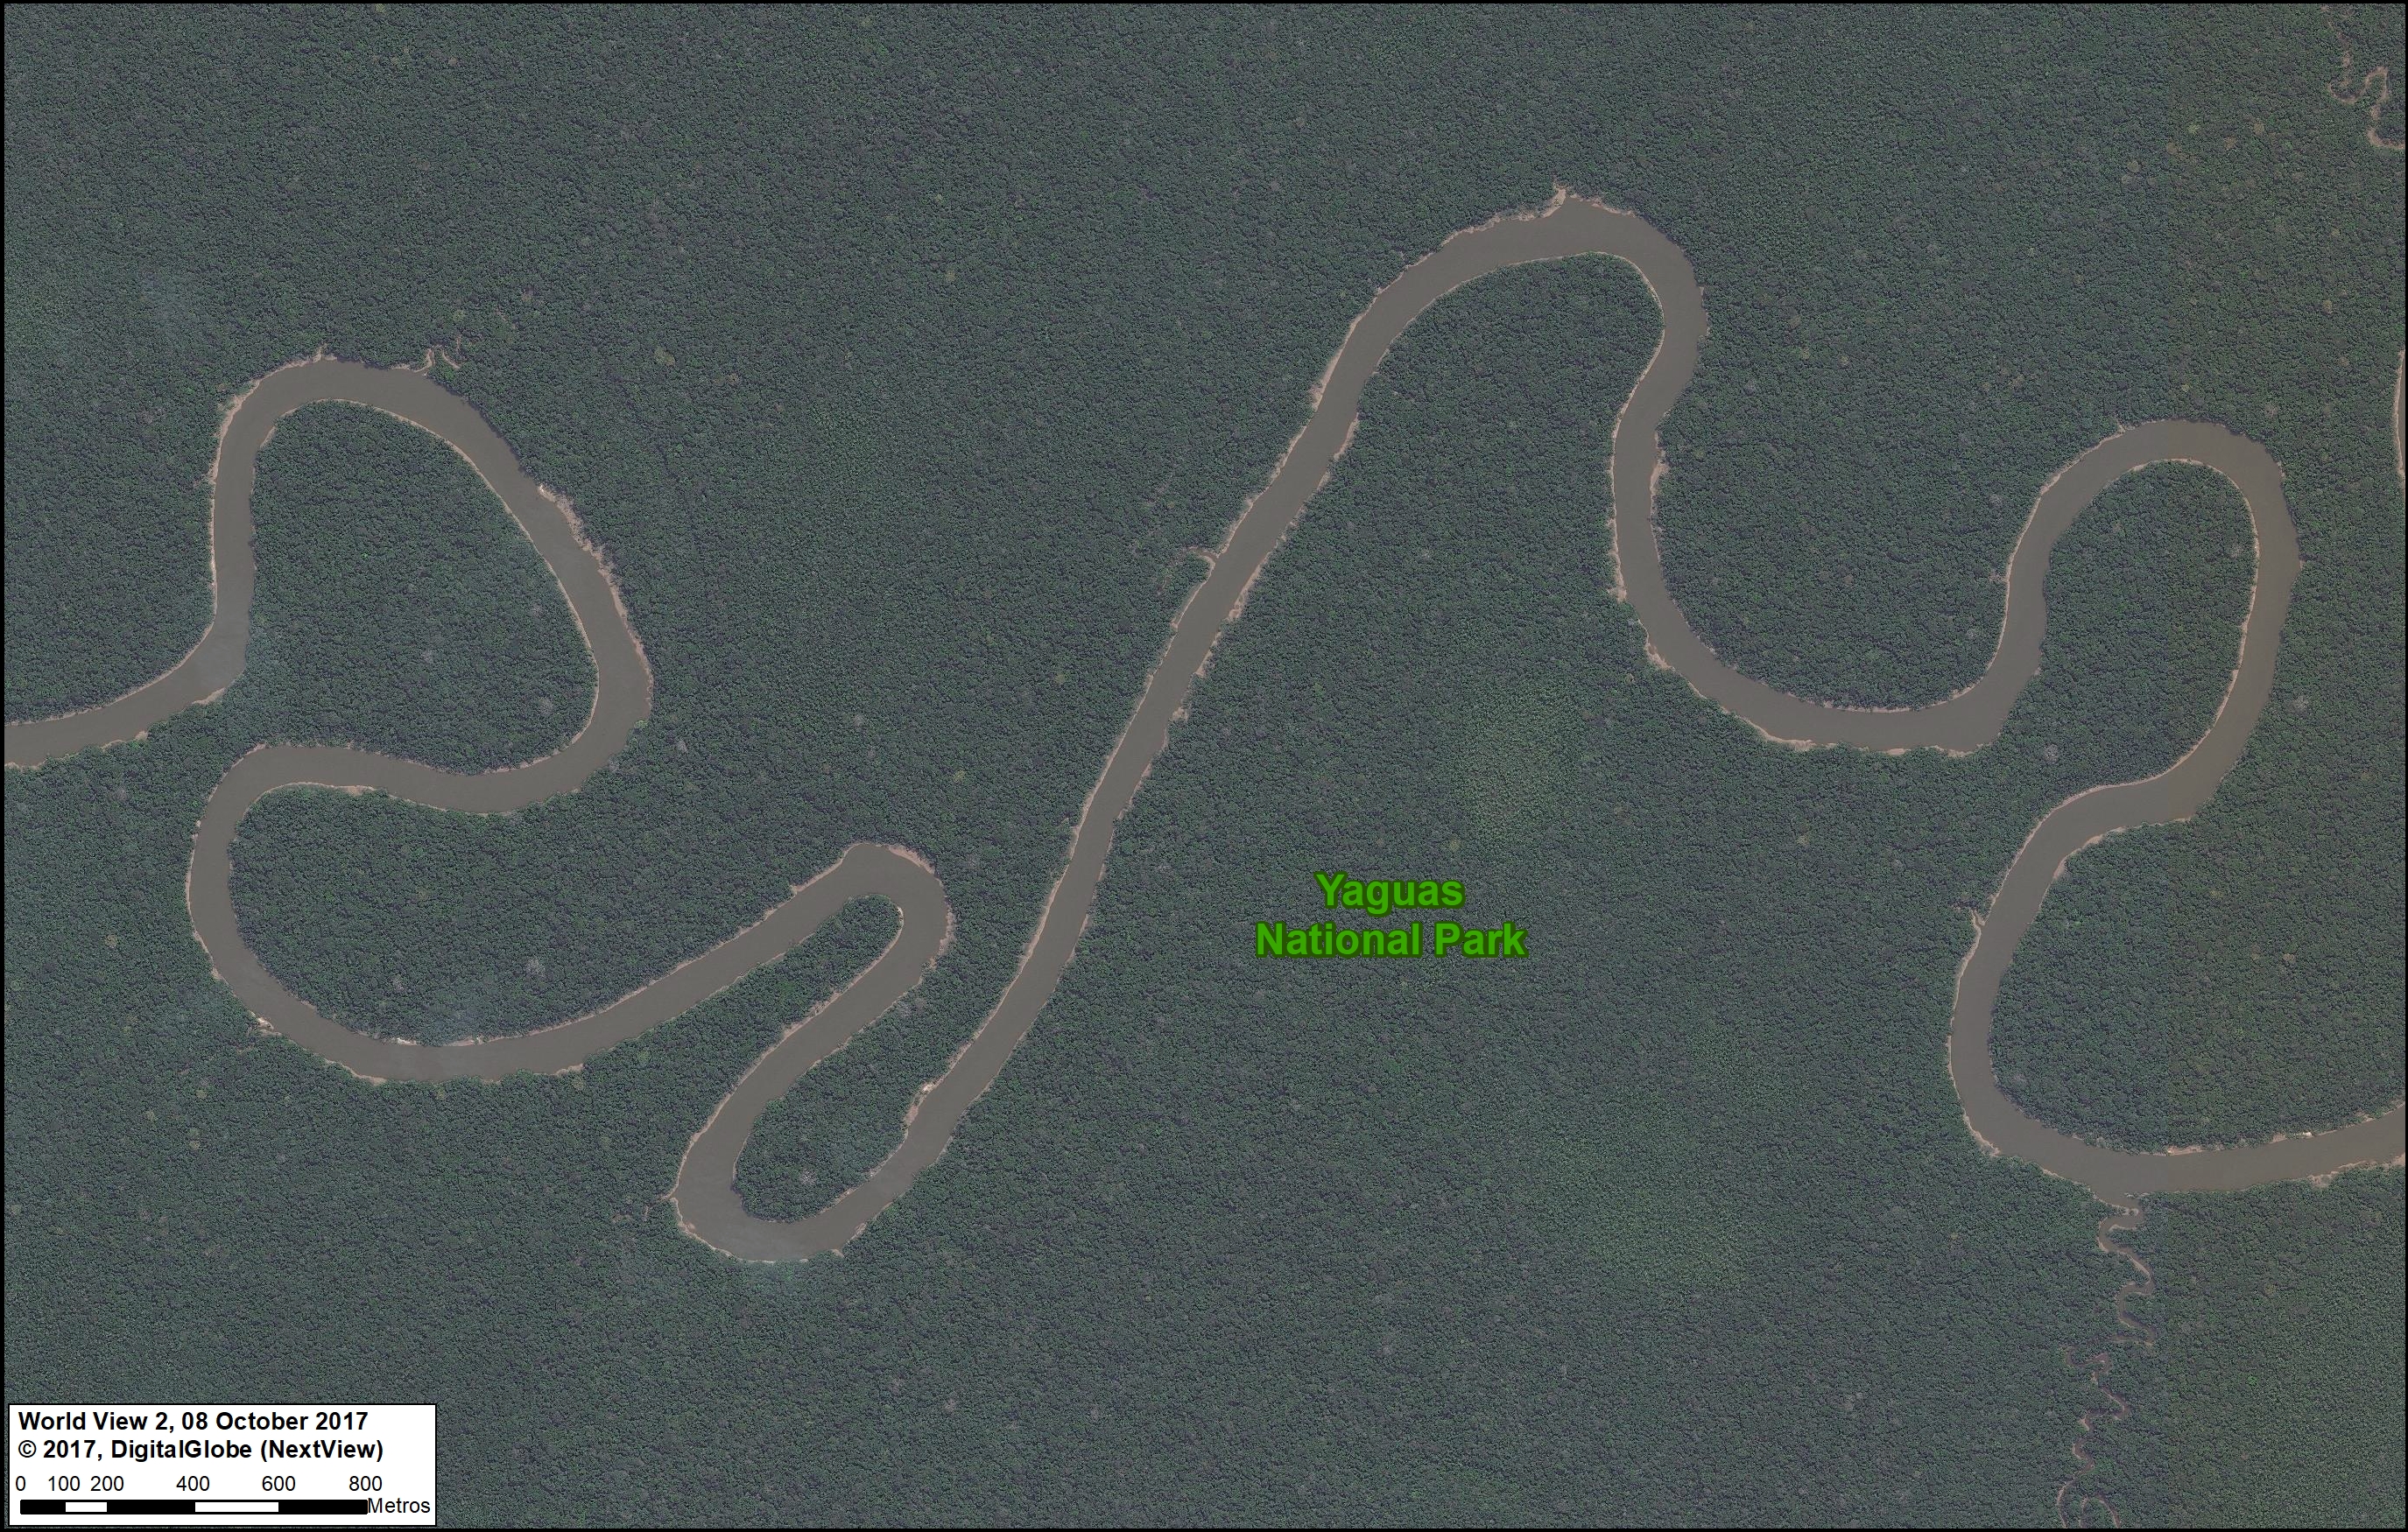
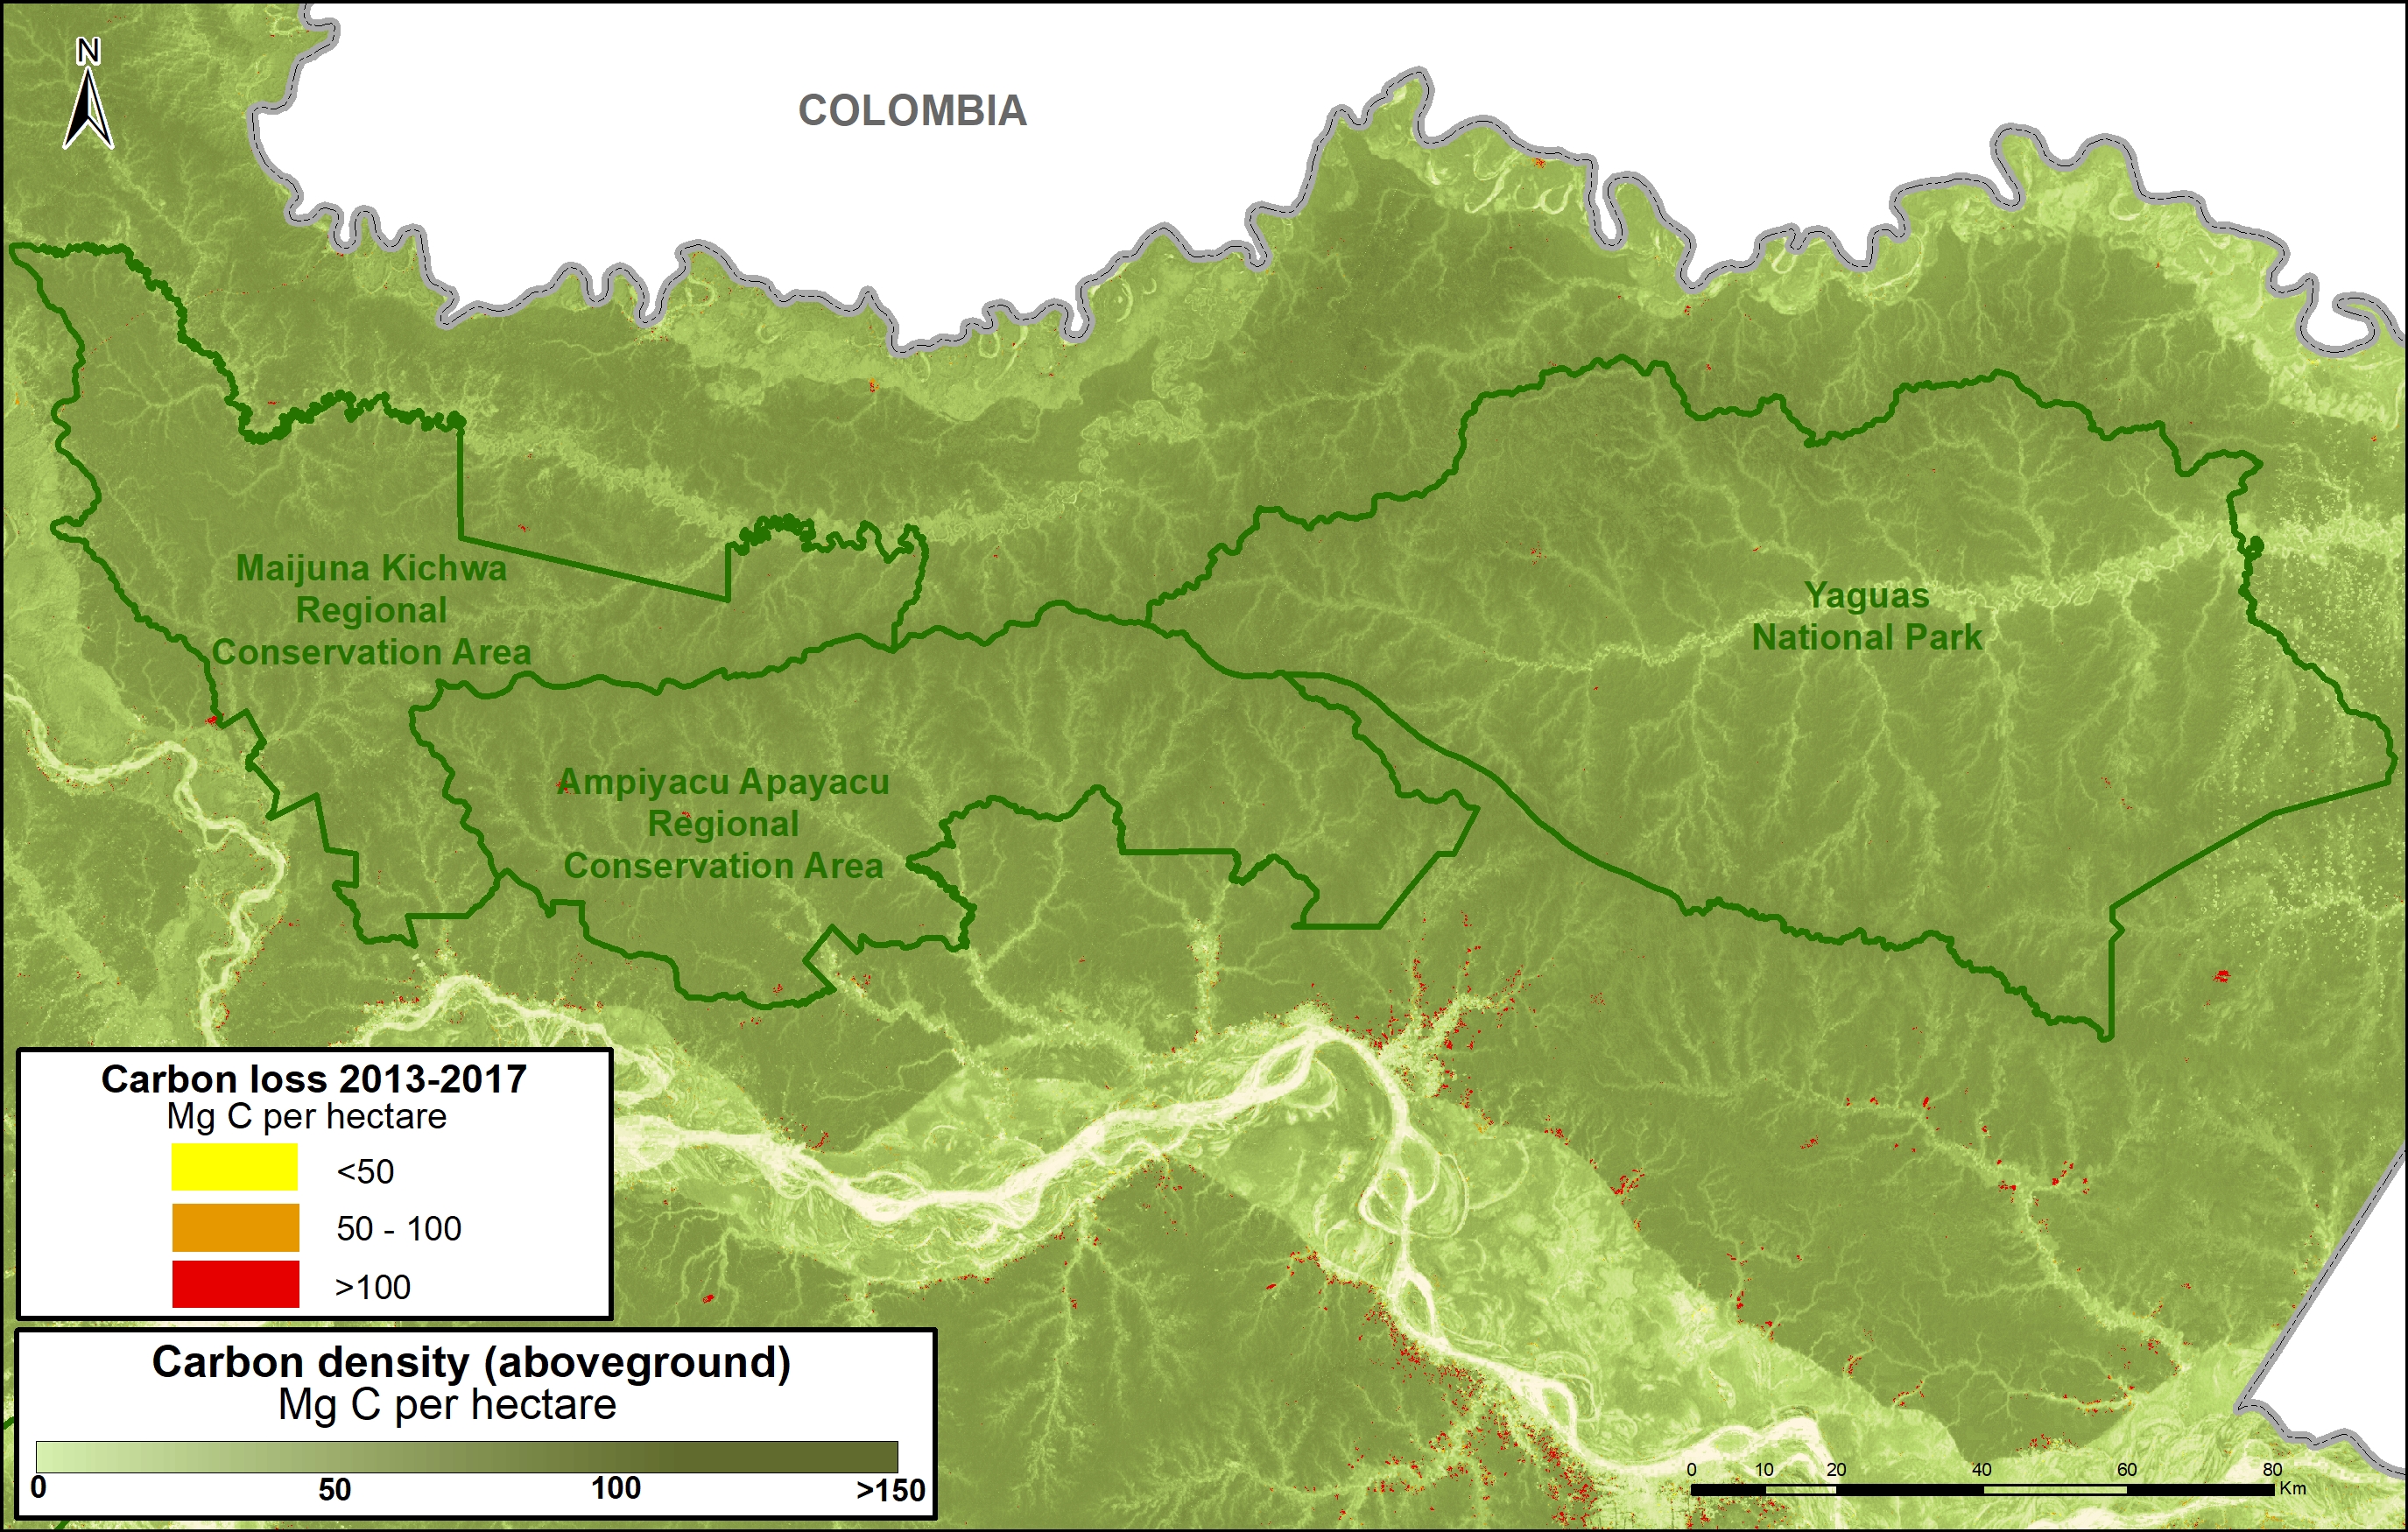
A. Yaguas National Park
The following Image A shows how three protected areas, including the new Yaguas National Park, are effectively safeguarding 202 million metric tons of carbon in the northeastern Peruvian Amazon. This area is home to some of the highest carbon densities in the country.
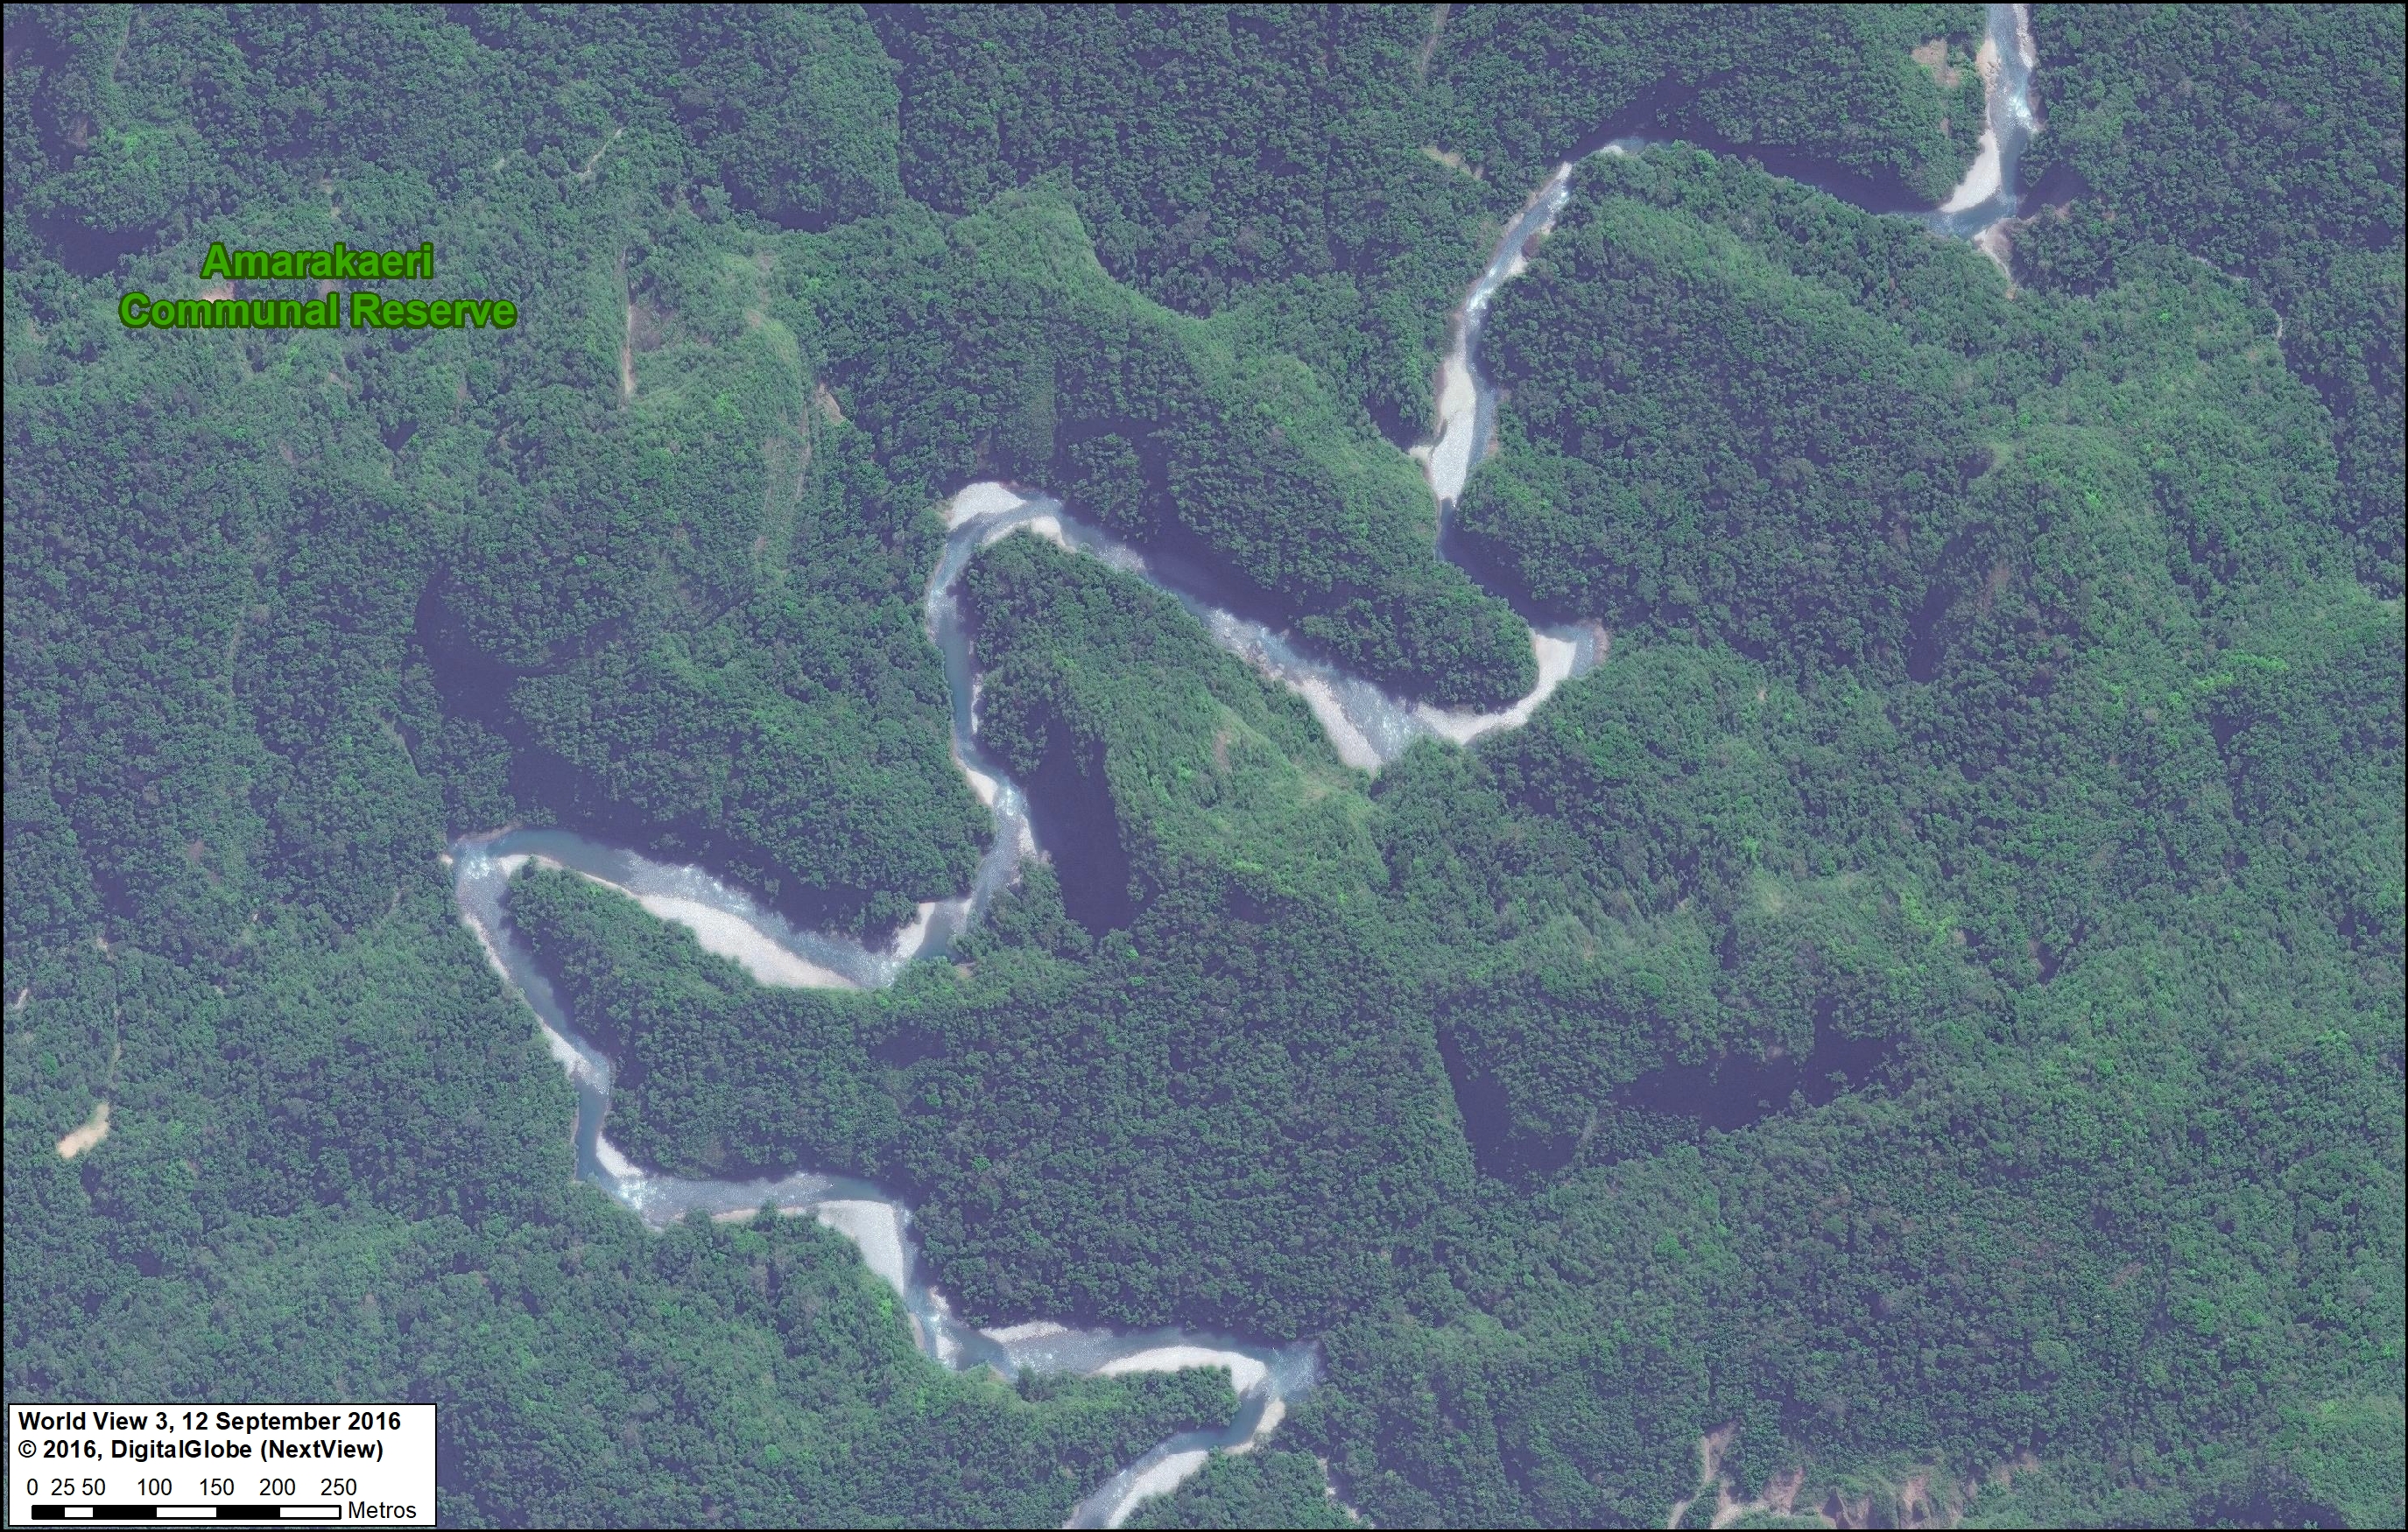
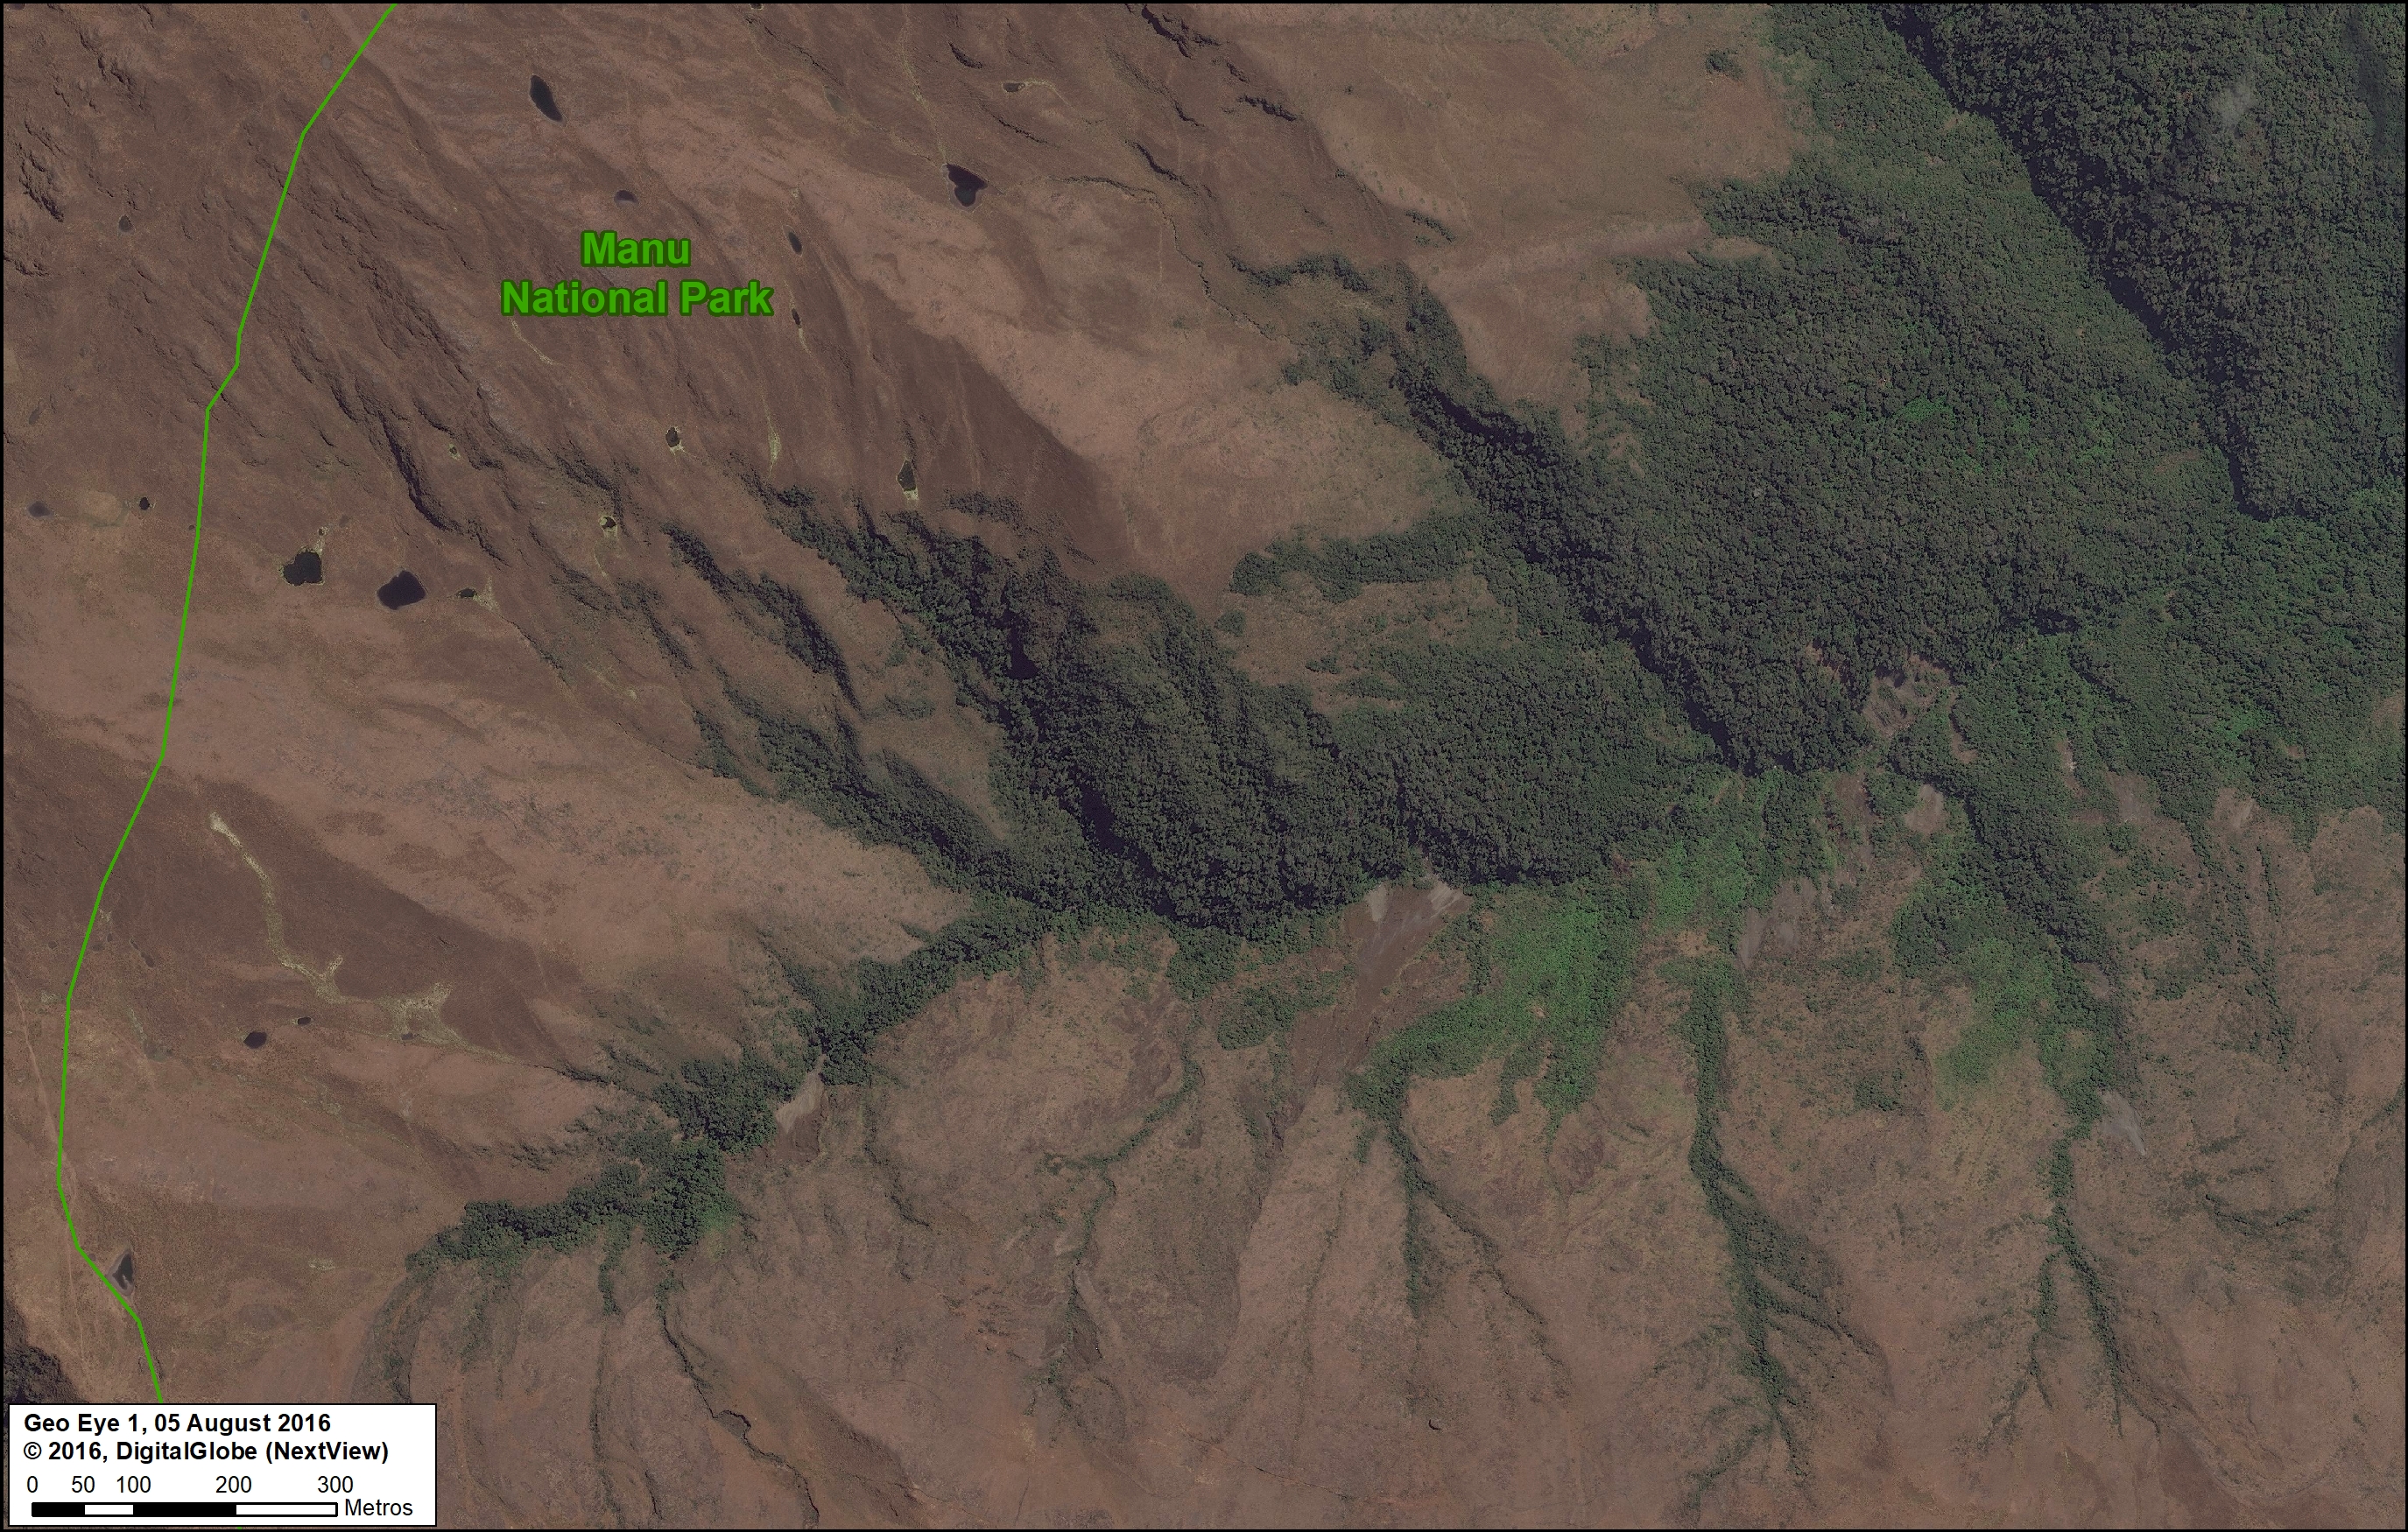
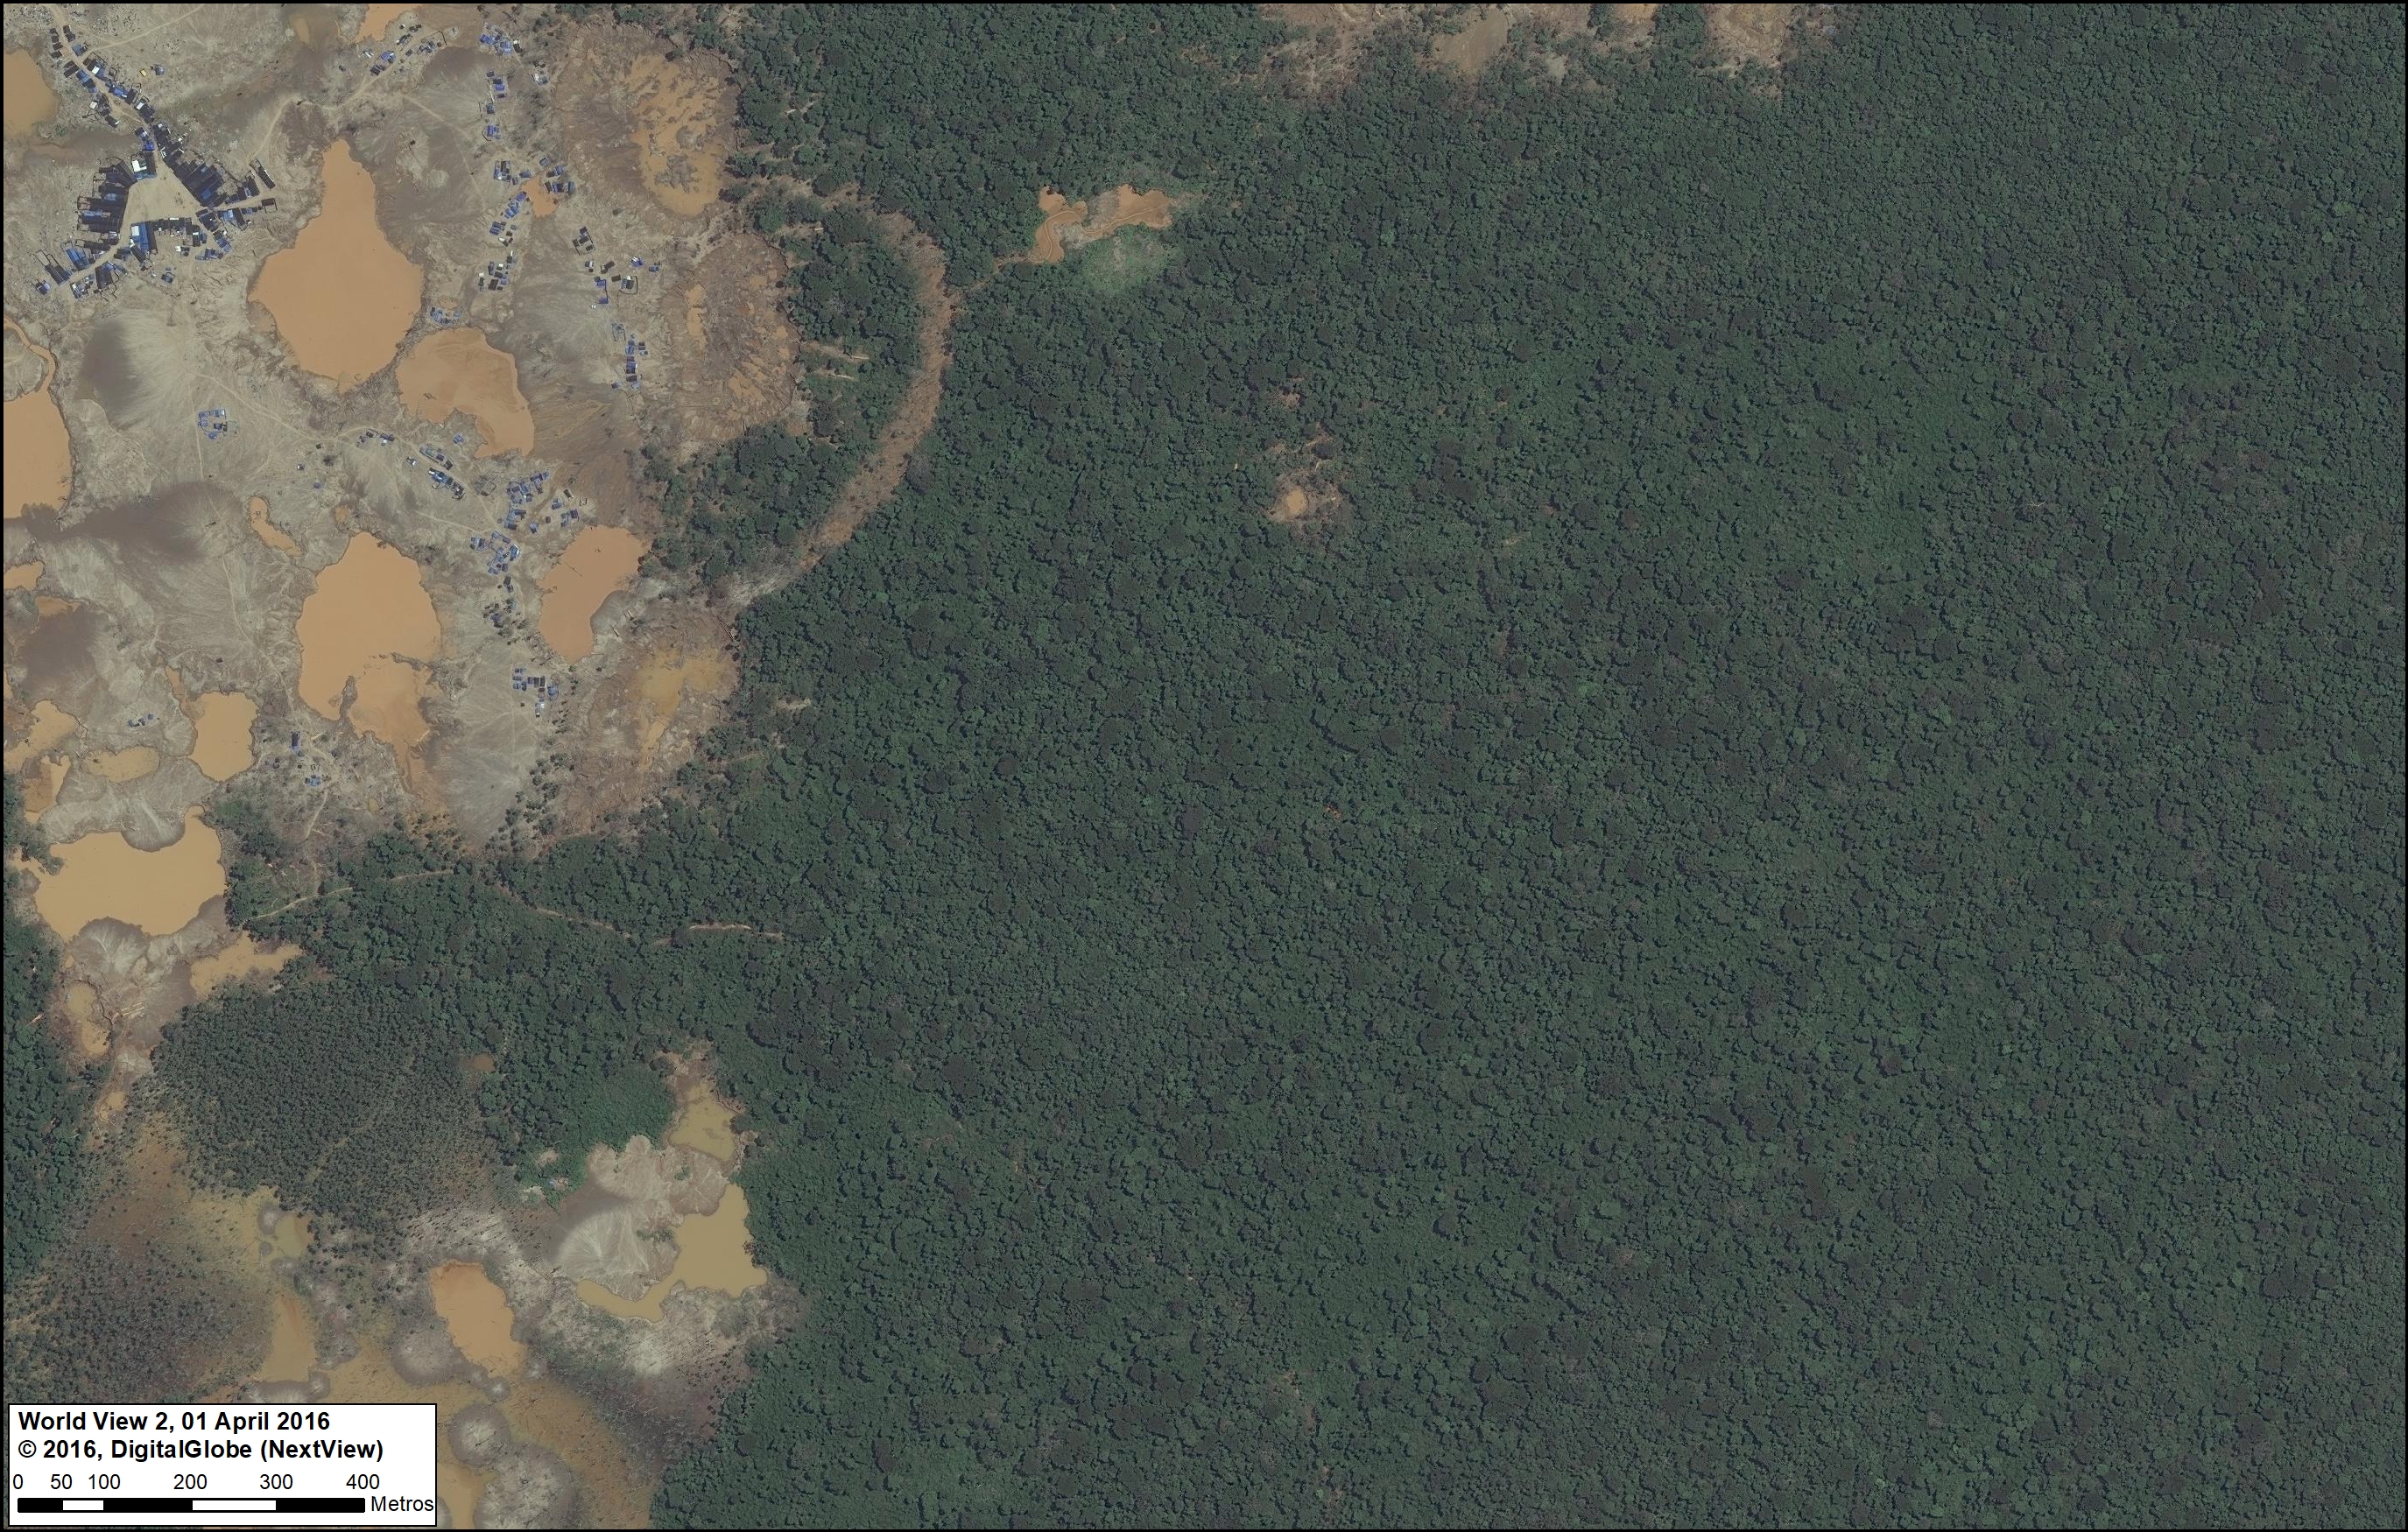
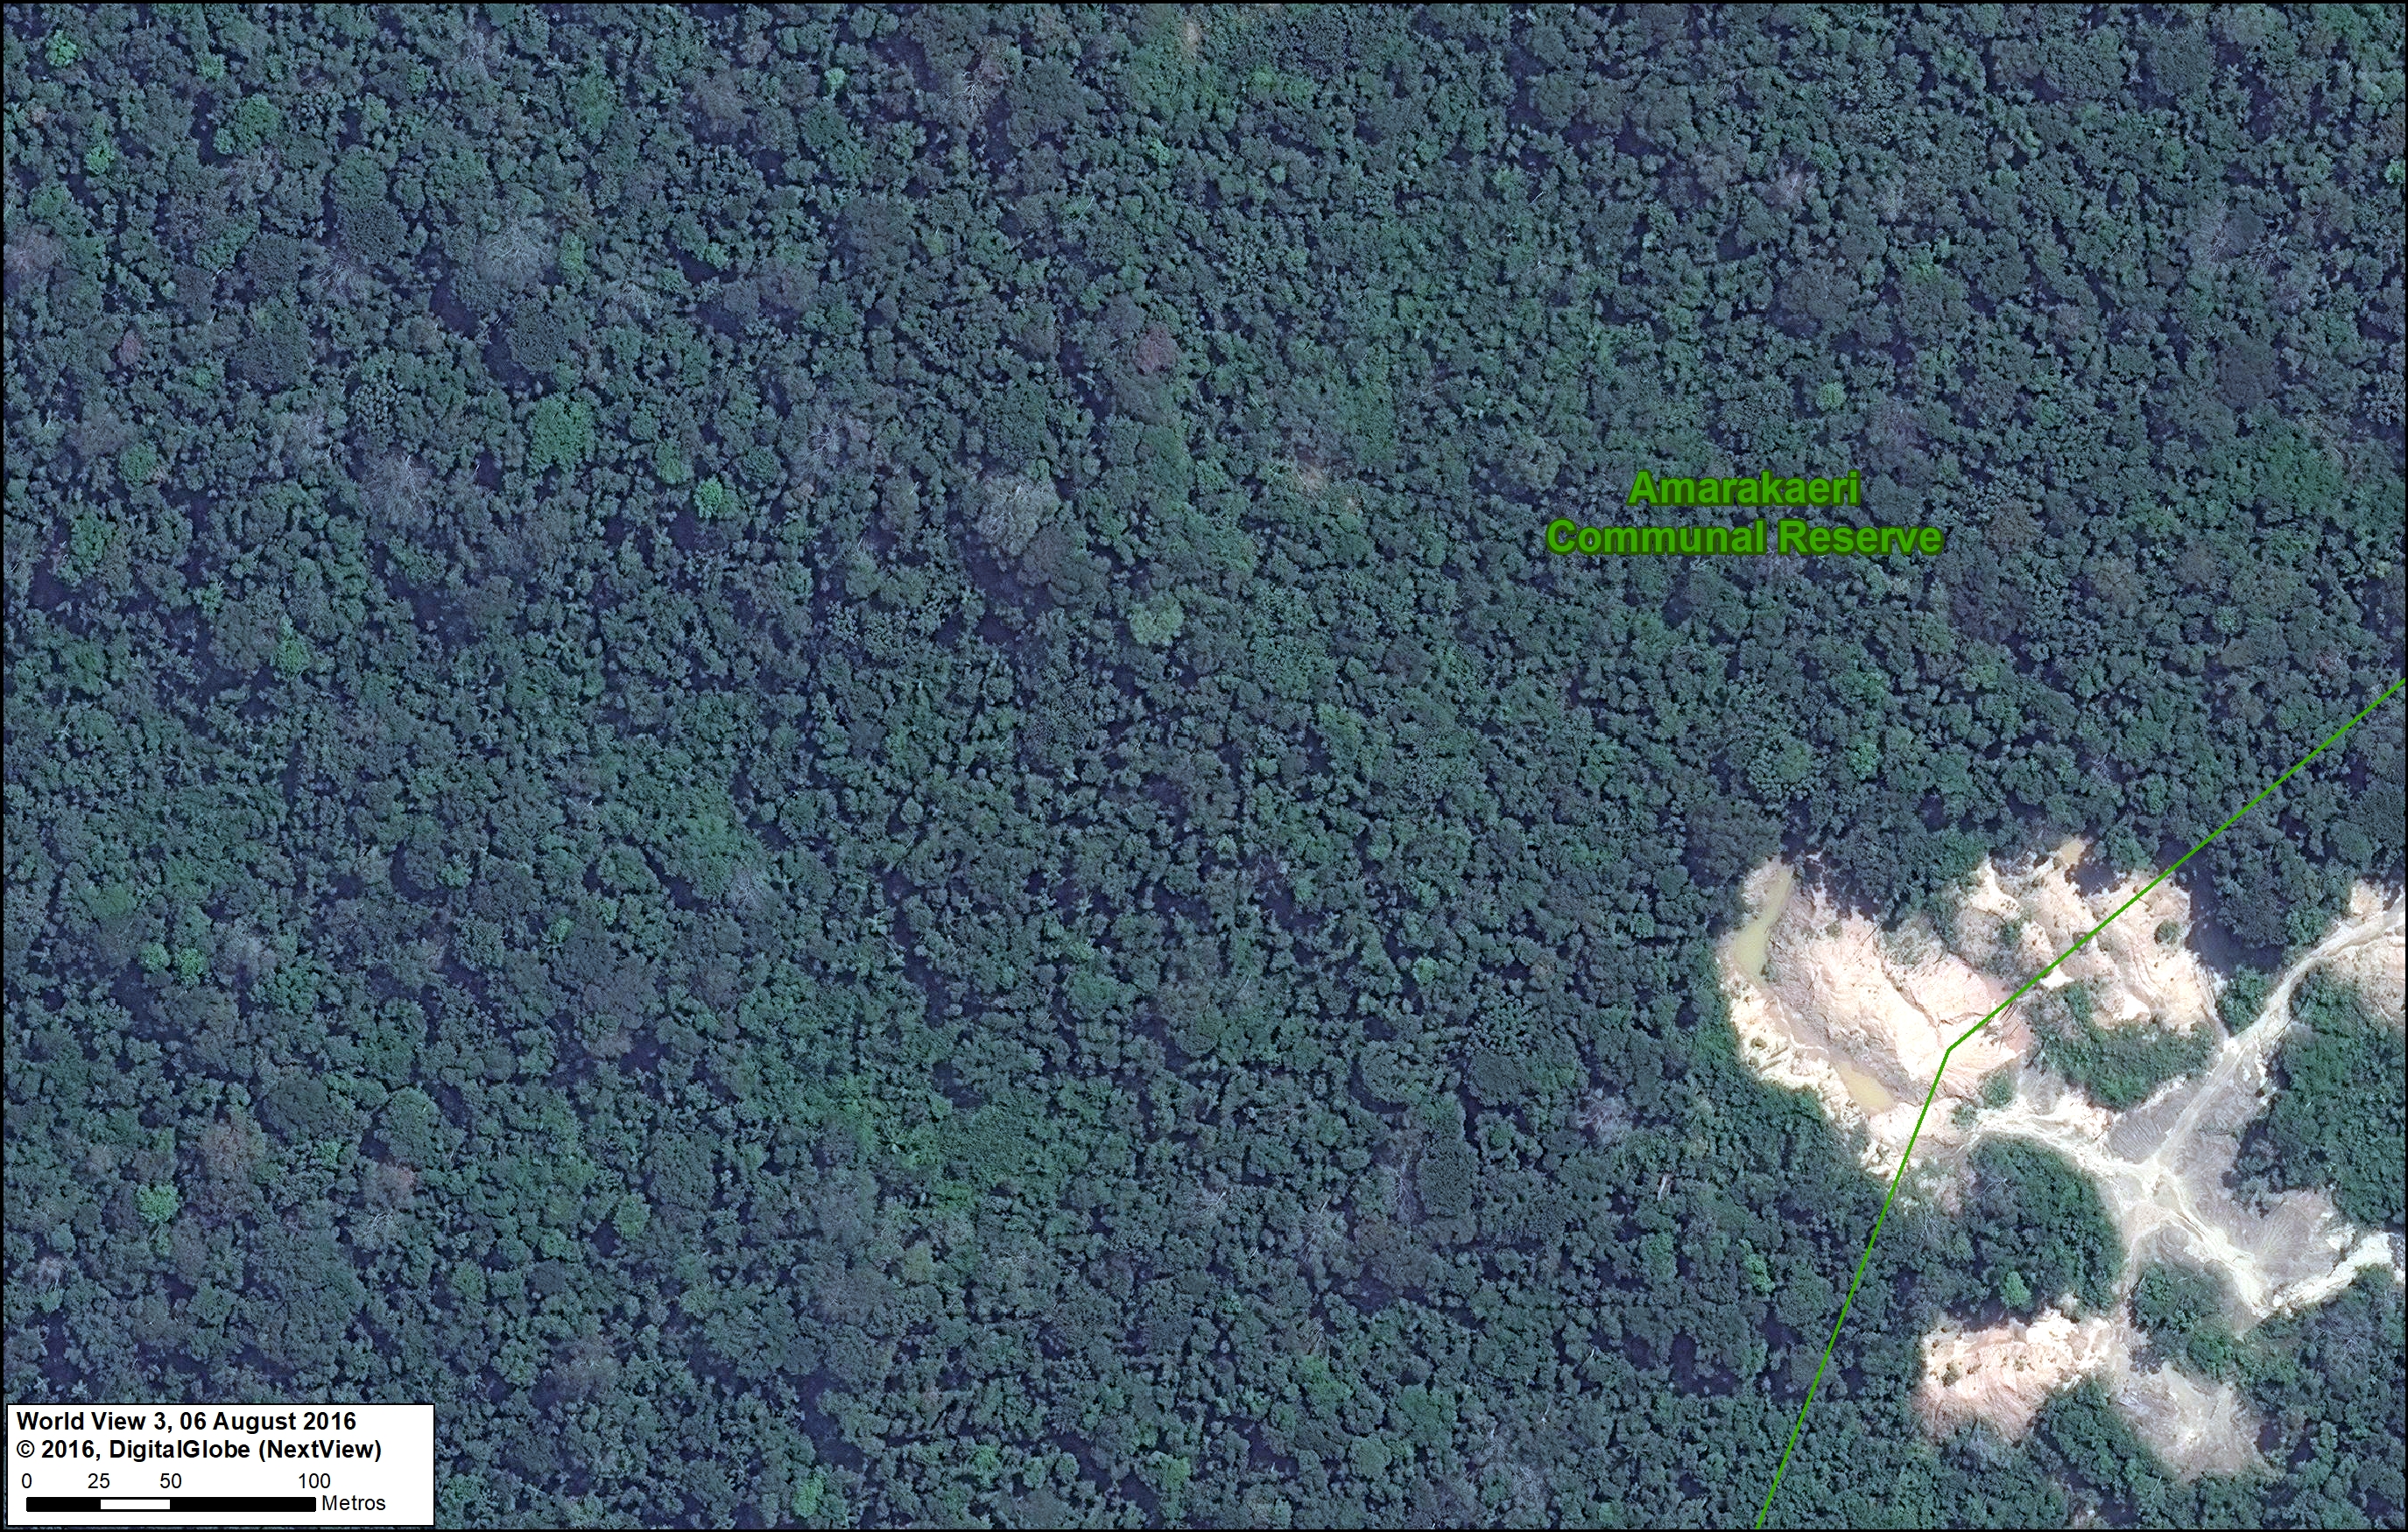
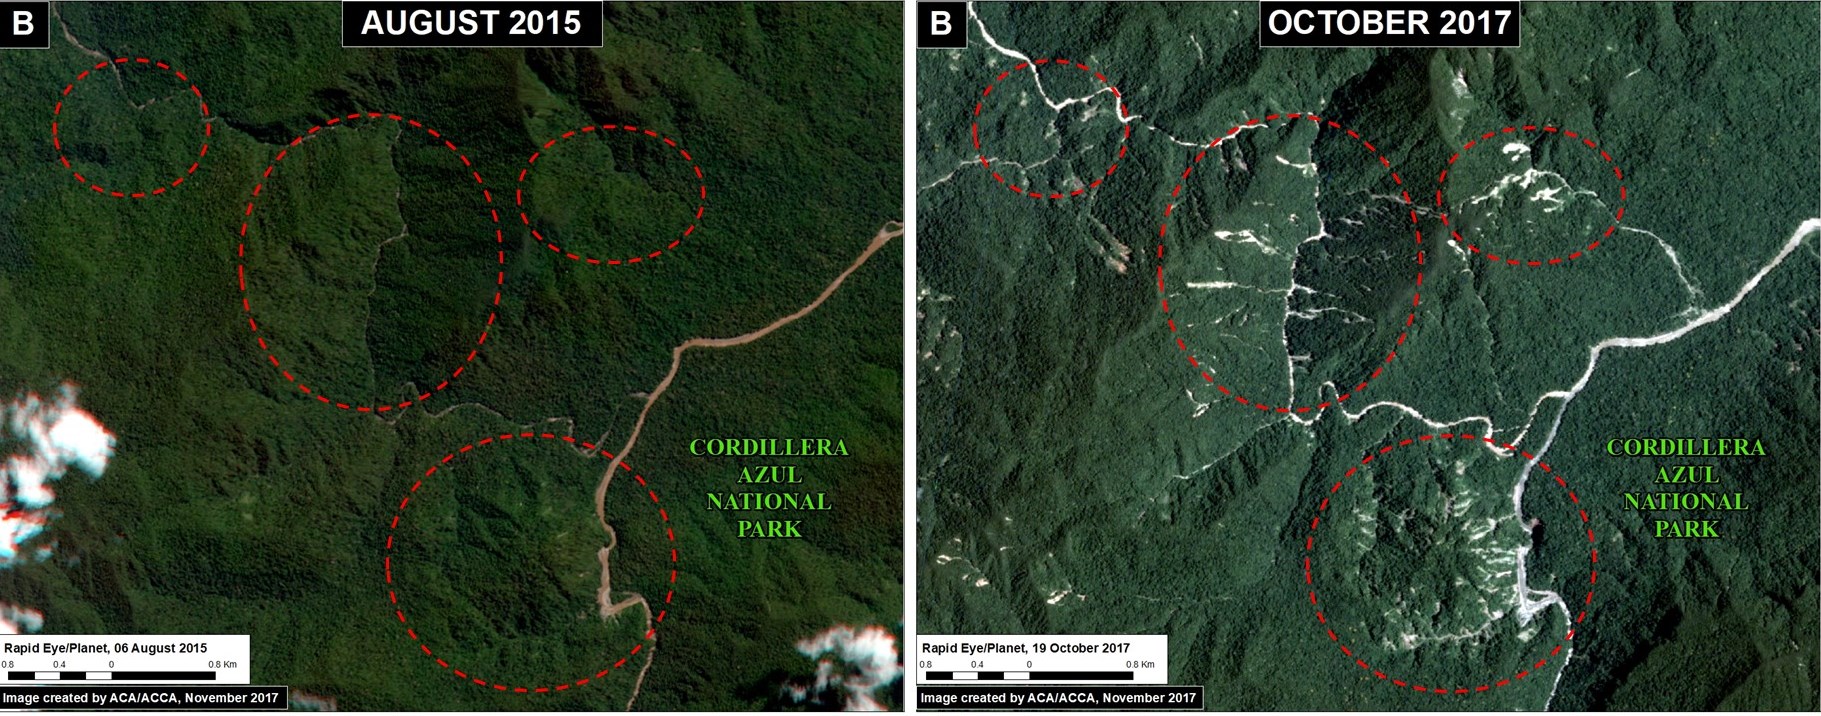
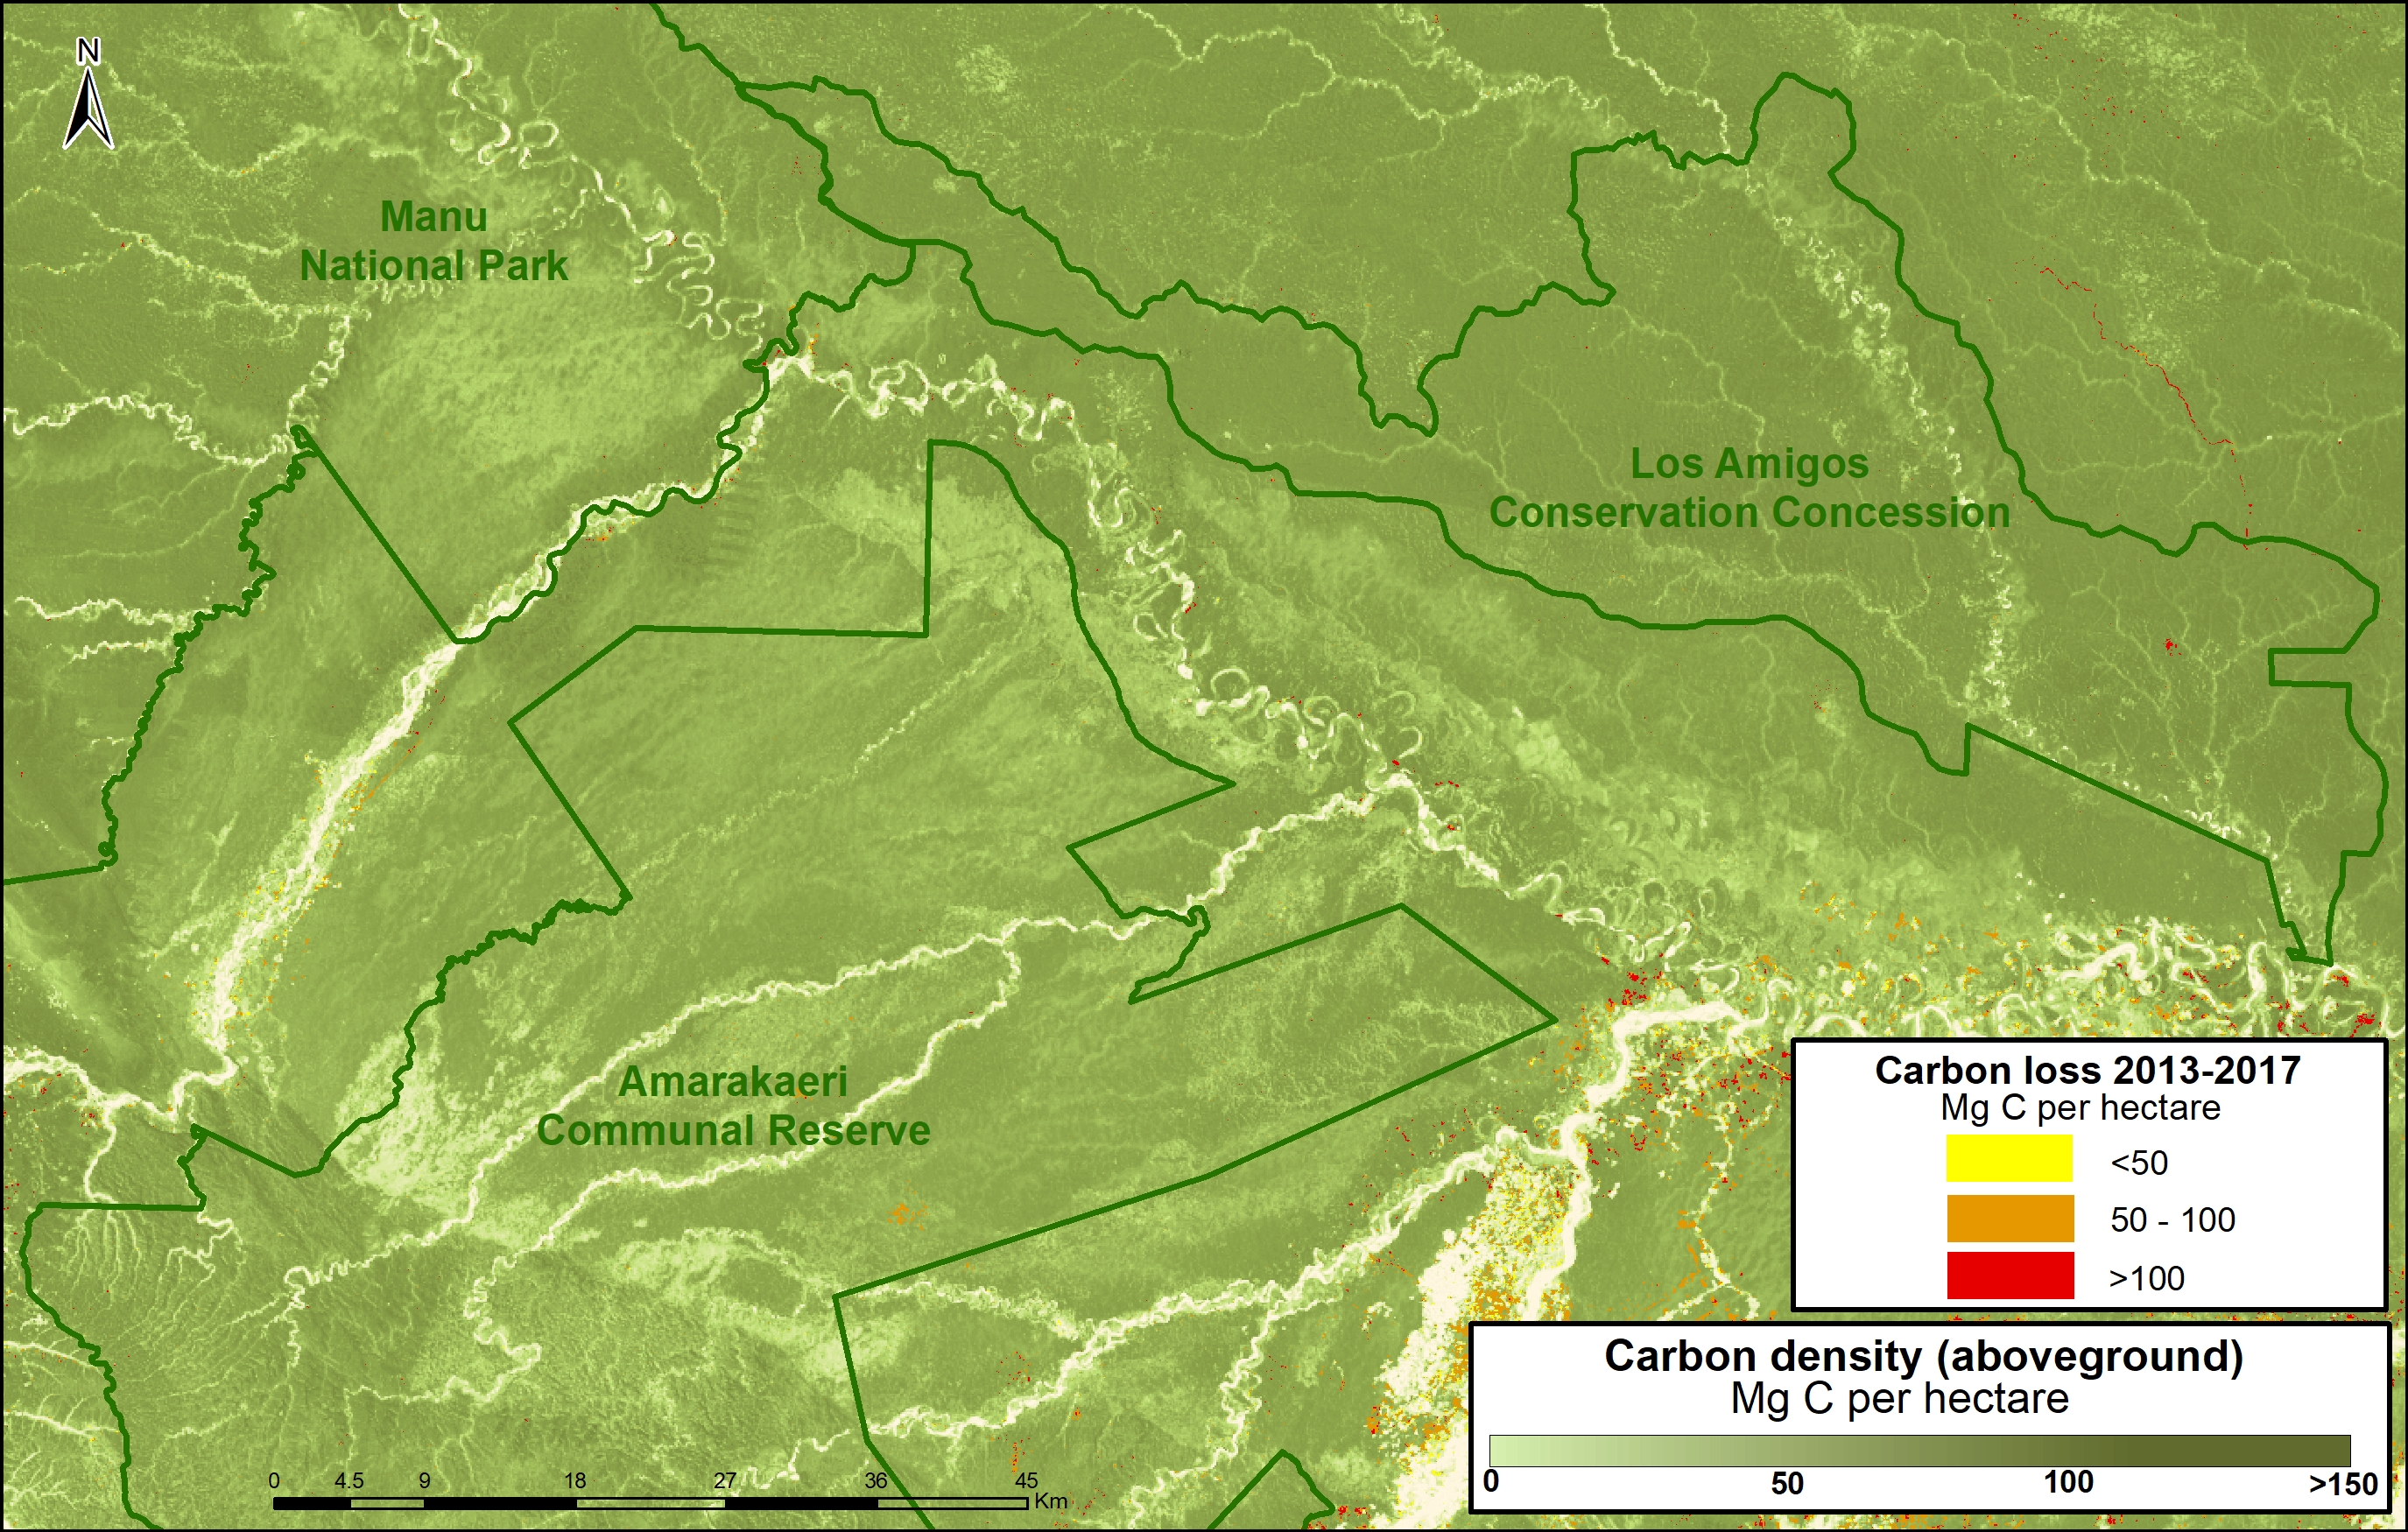
B. Manu National Park, Amarakaeri Communal Reserve, CC Los Amigos
The following Image B shows how Los Amigos, the world’s first conservation concession, is effectively safeguarding 15 million metric tons of carbon in the southern Peruvian Amazon. Two surrounding protected areas, Manu National Park and Amarakaeri Communal Reserve, safeguard an additional 194 million metric tons. This area is home to some of the highest carbon densities in the country.
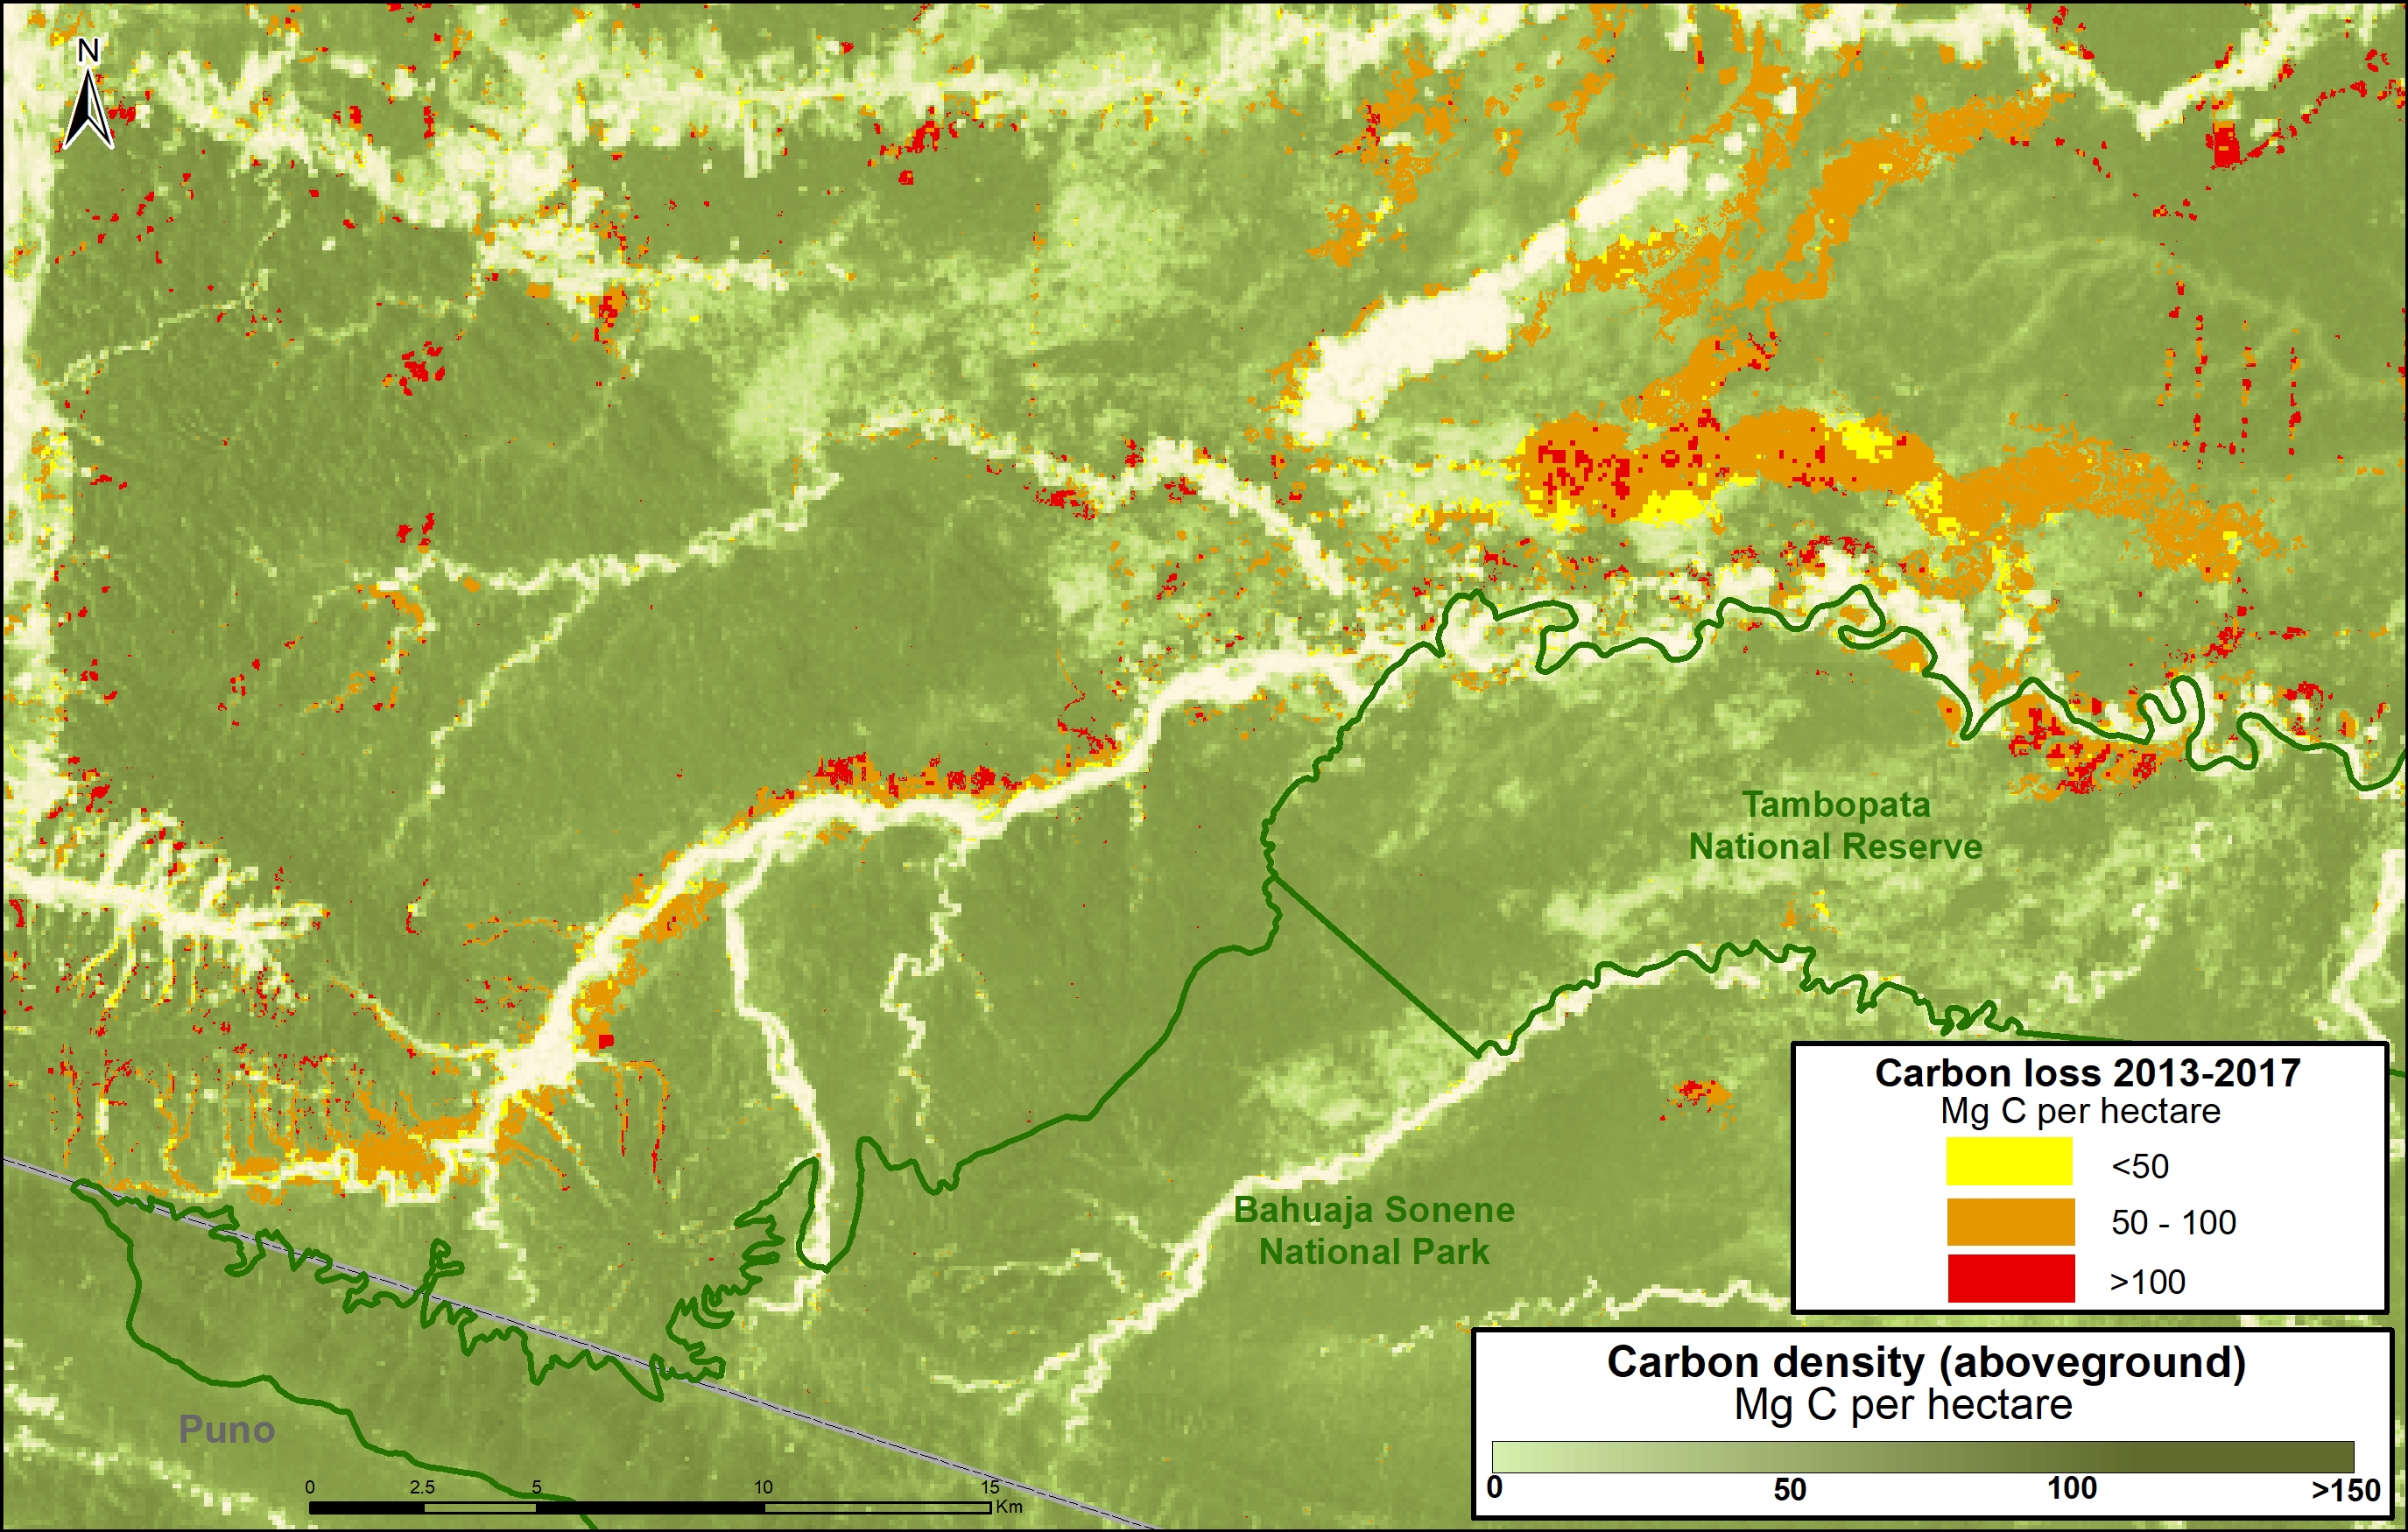
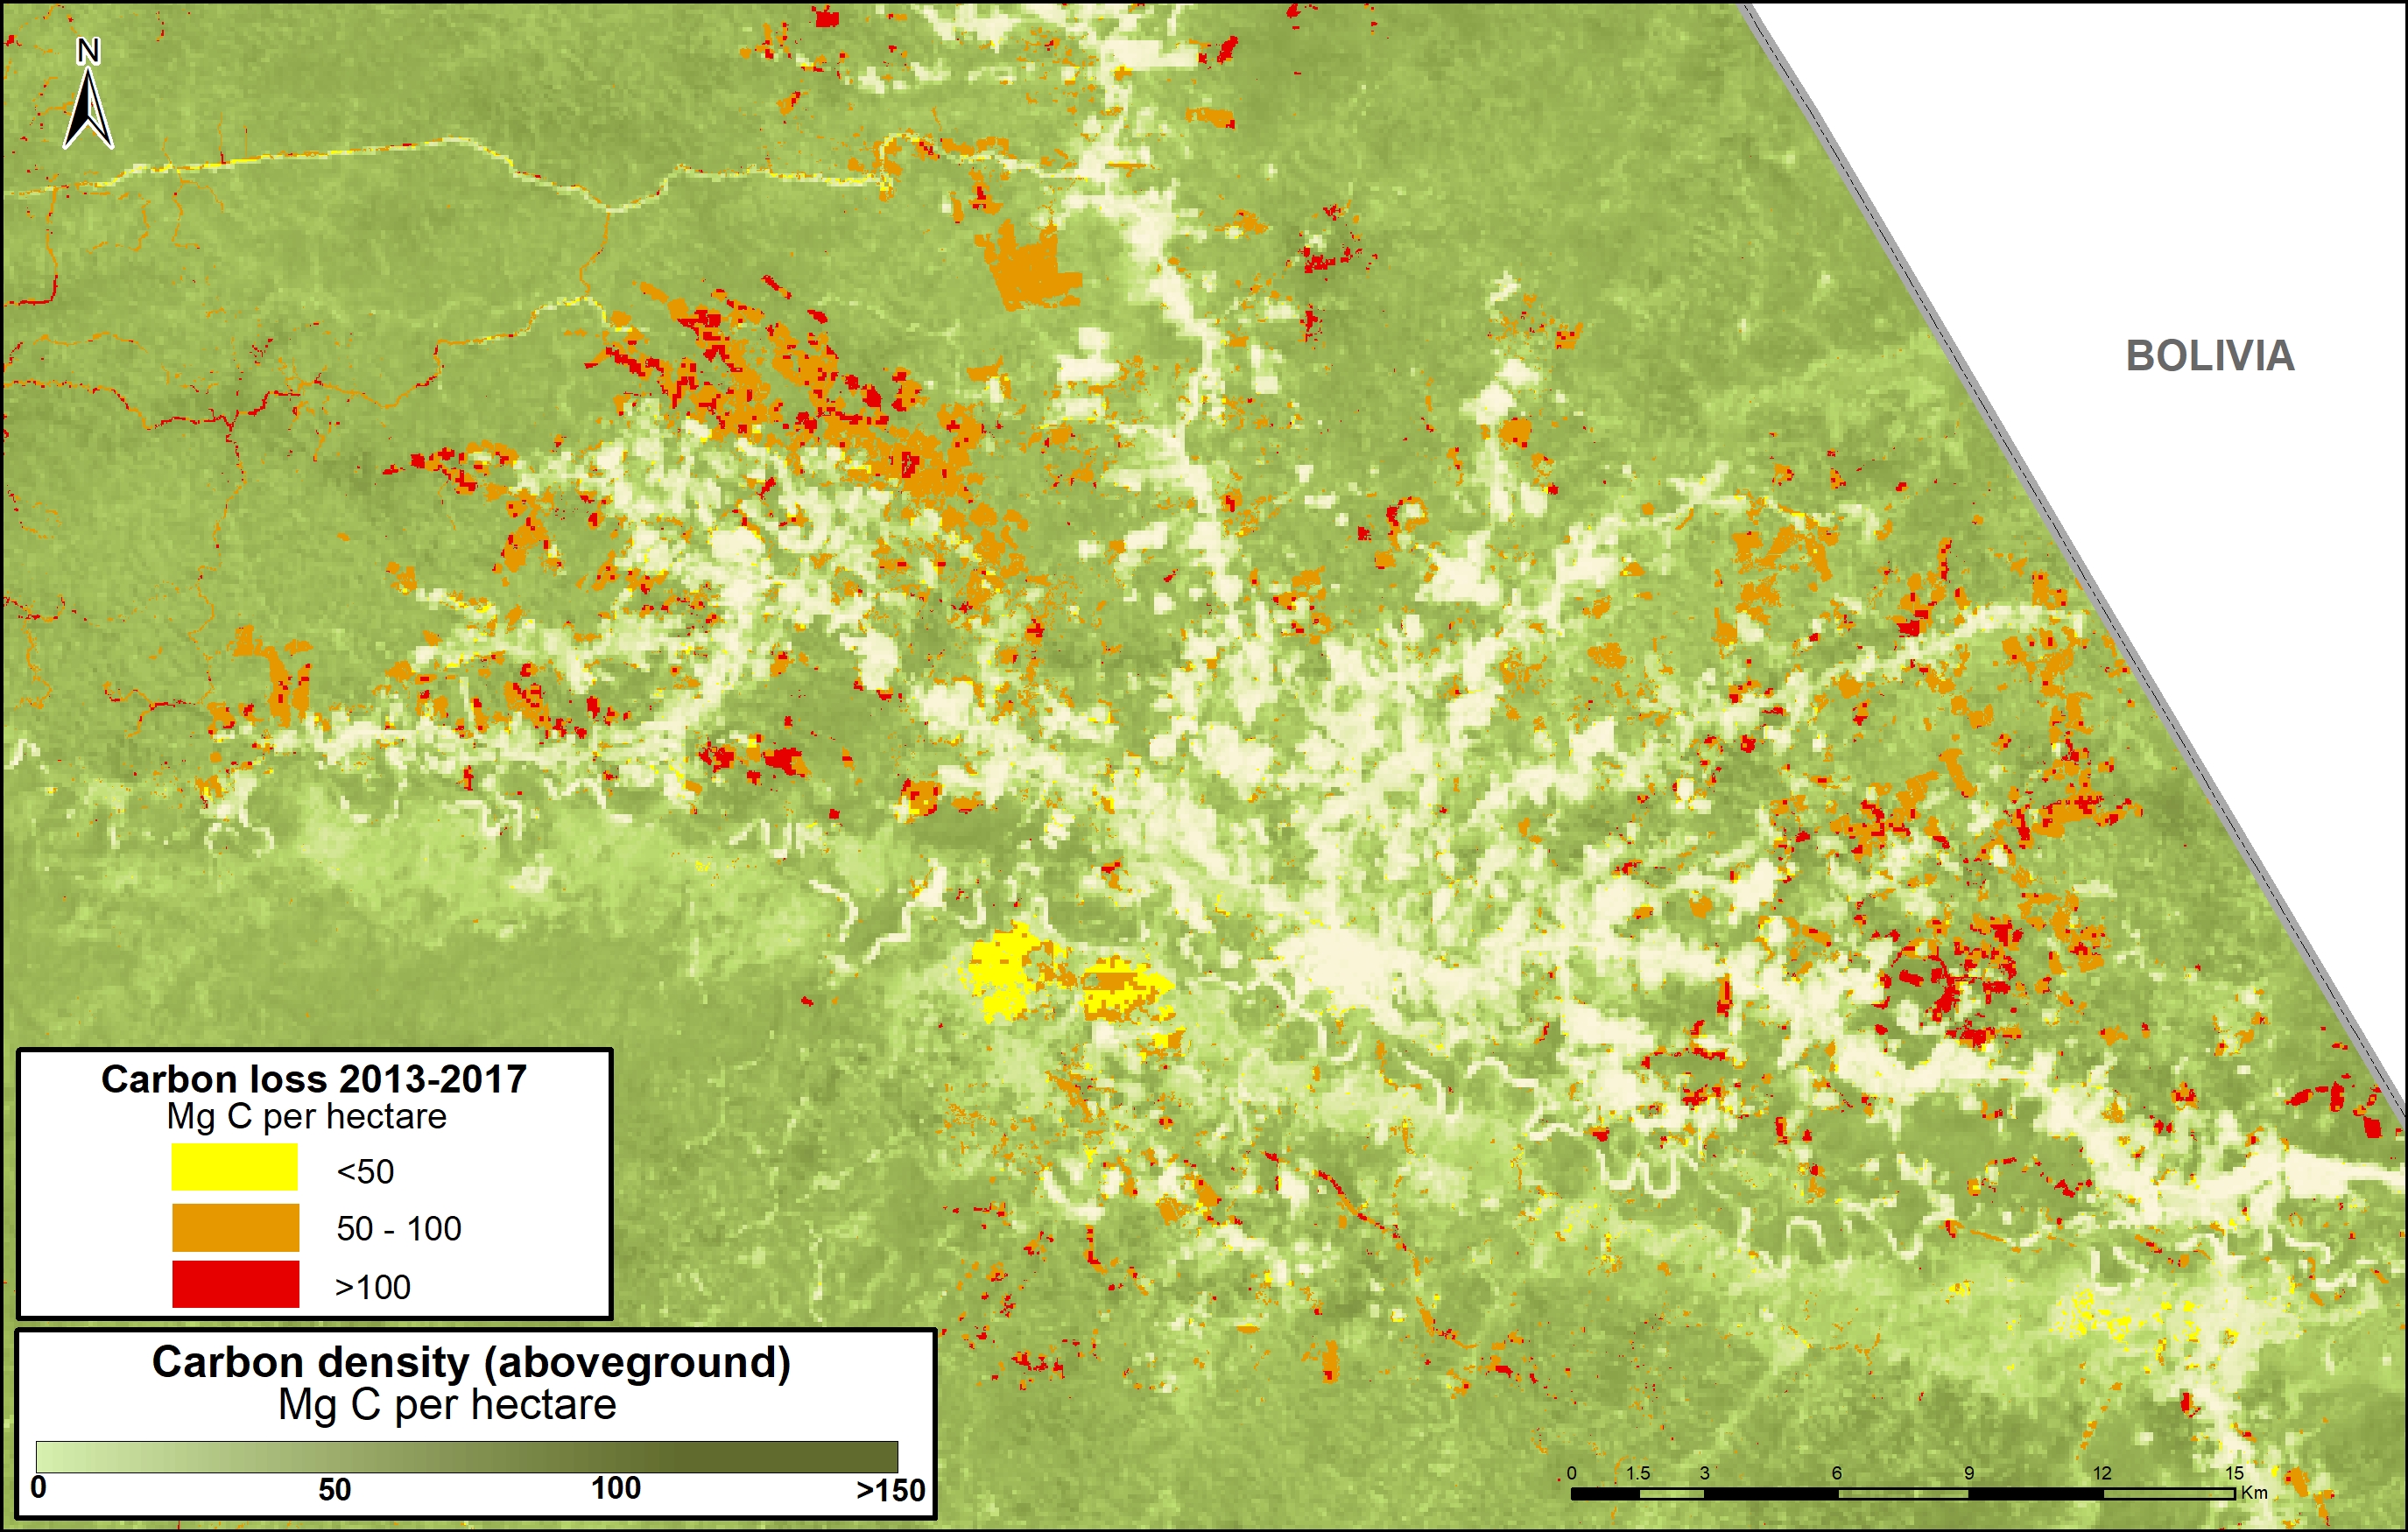
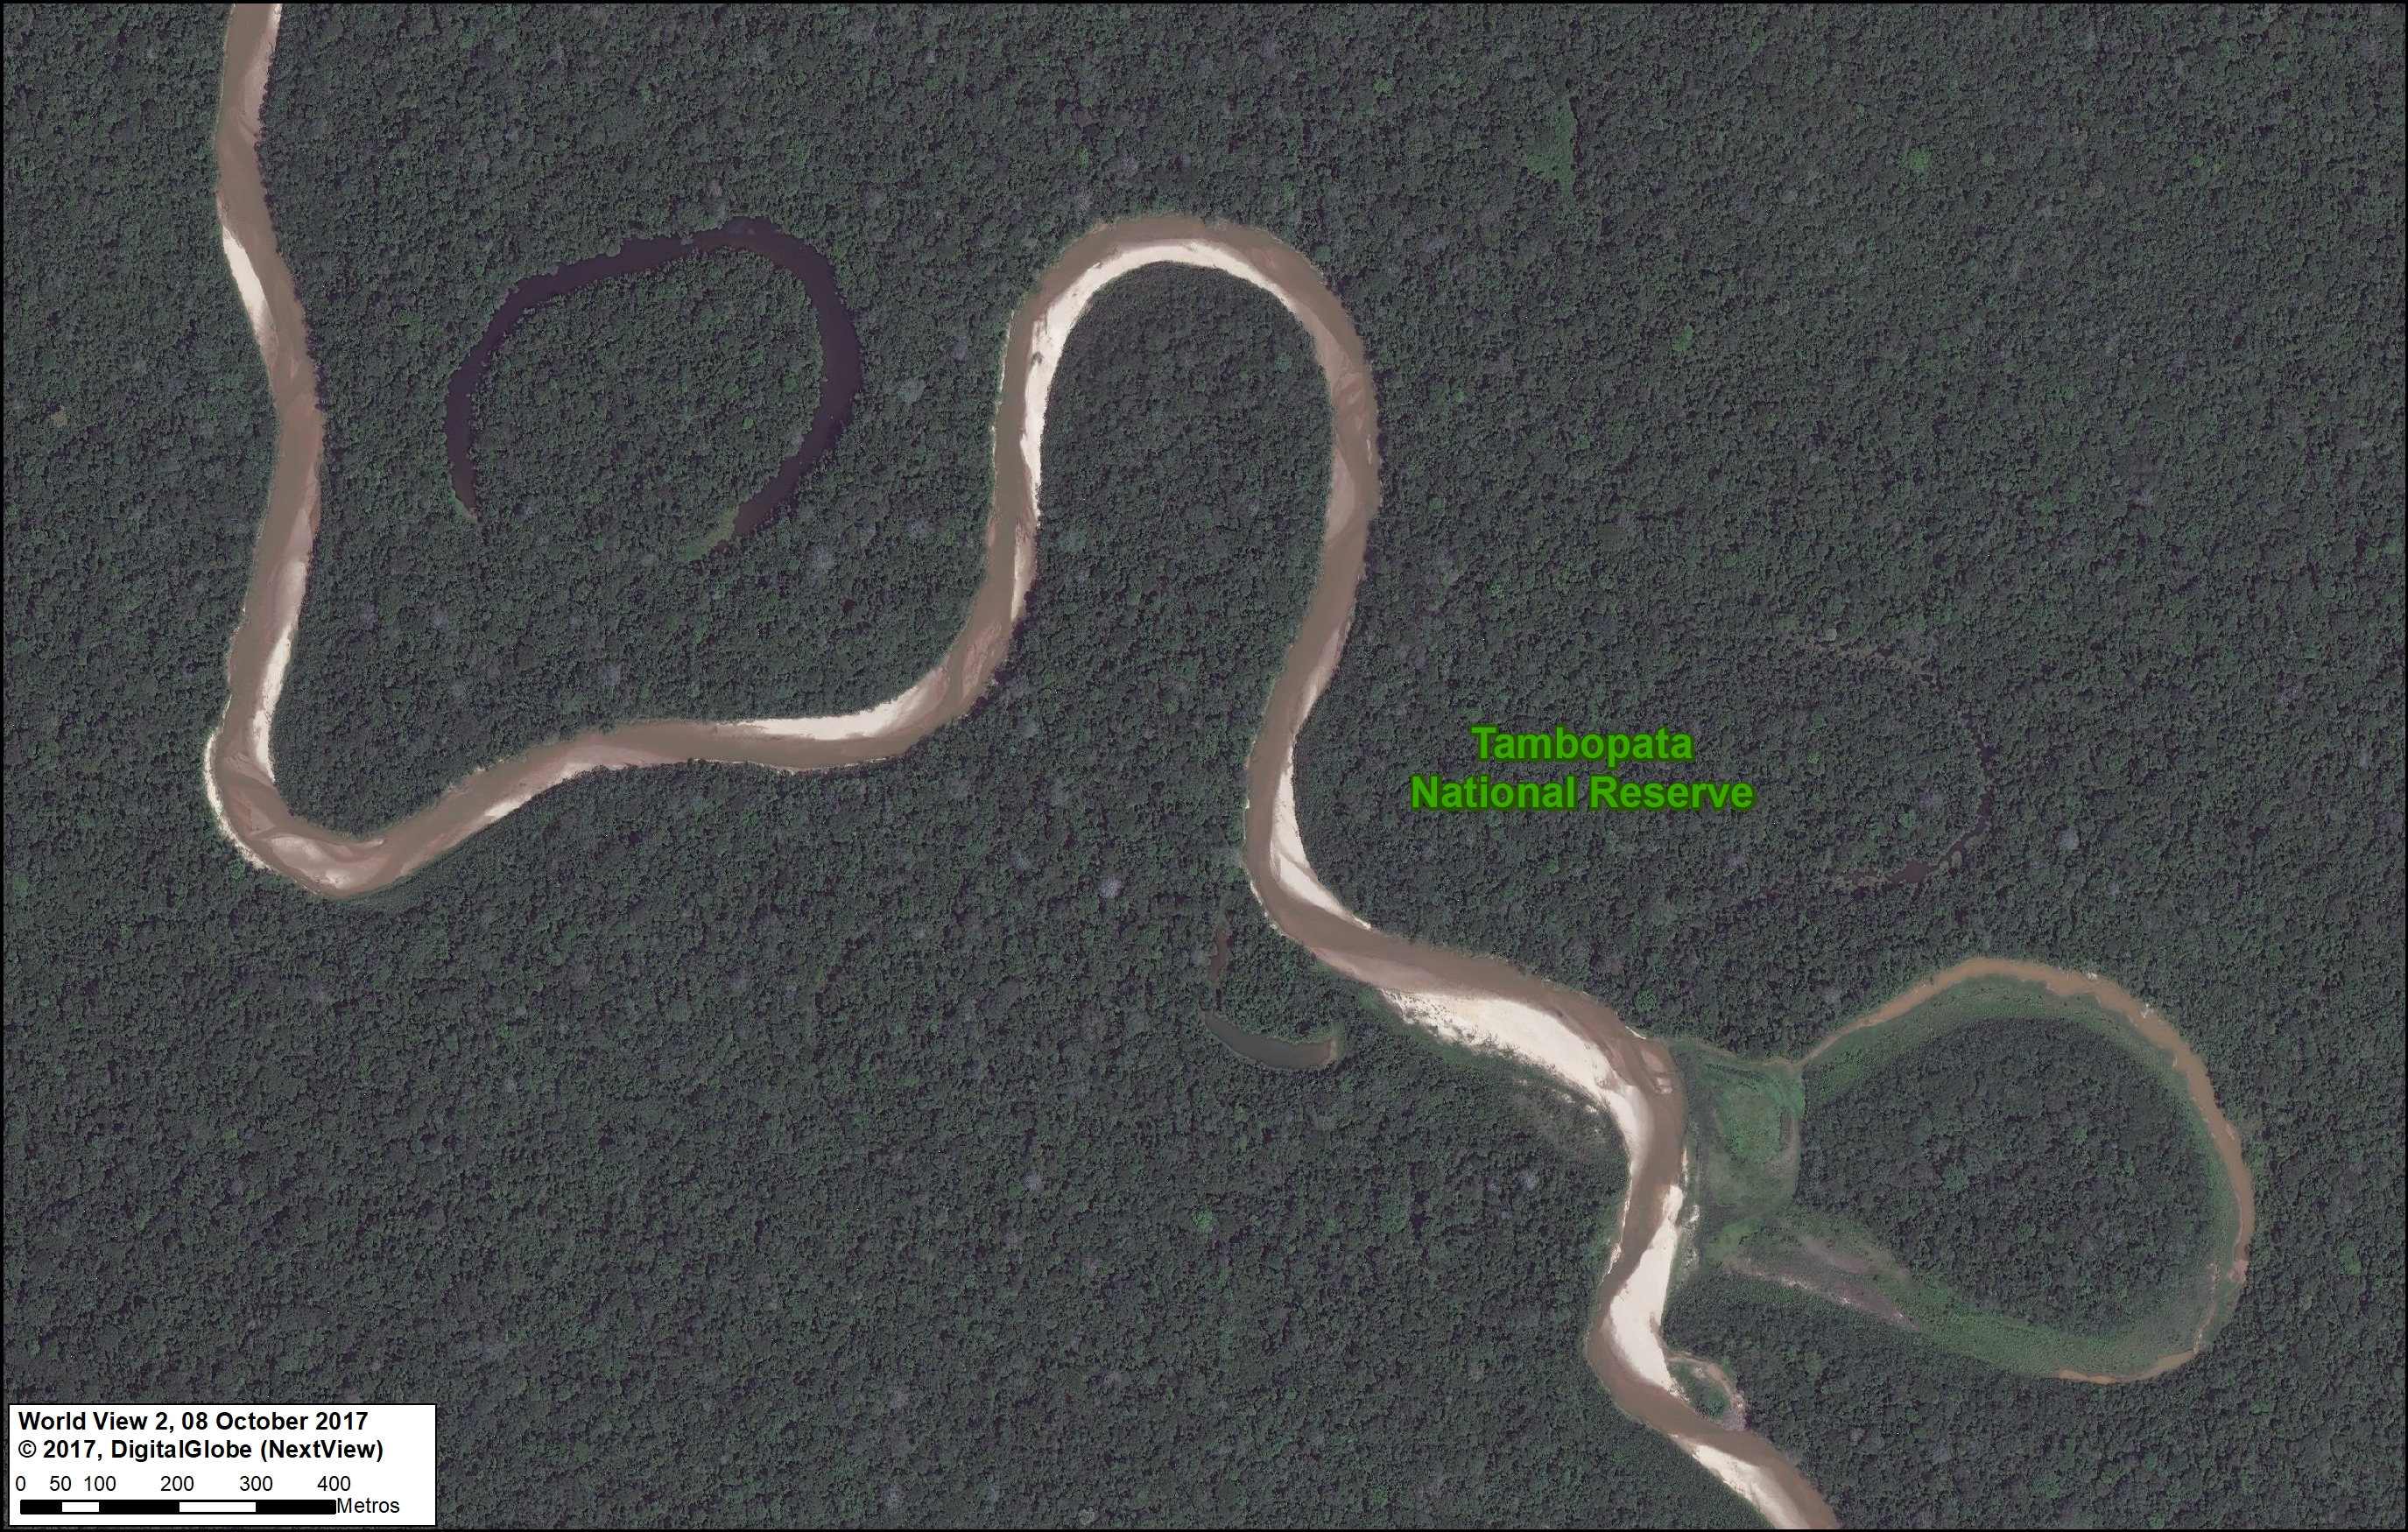
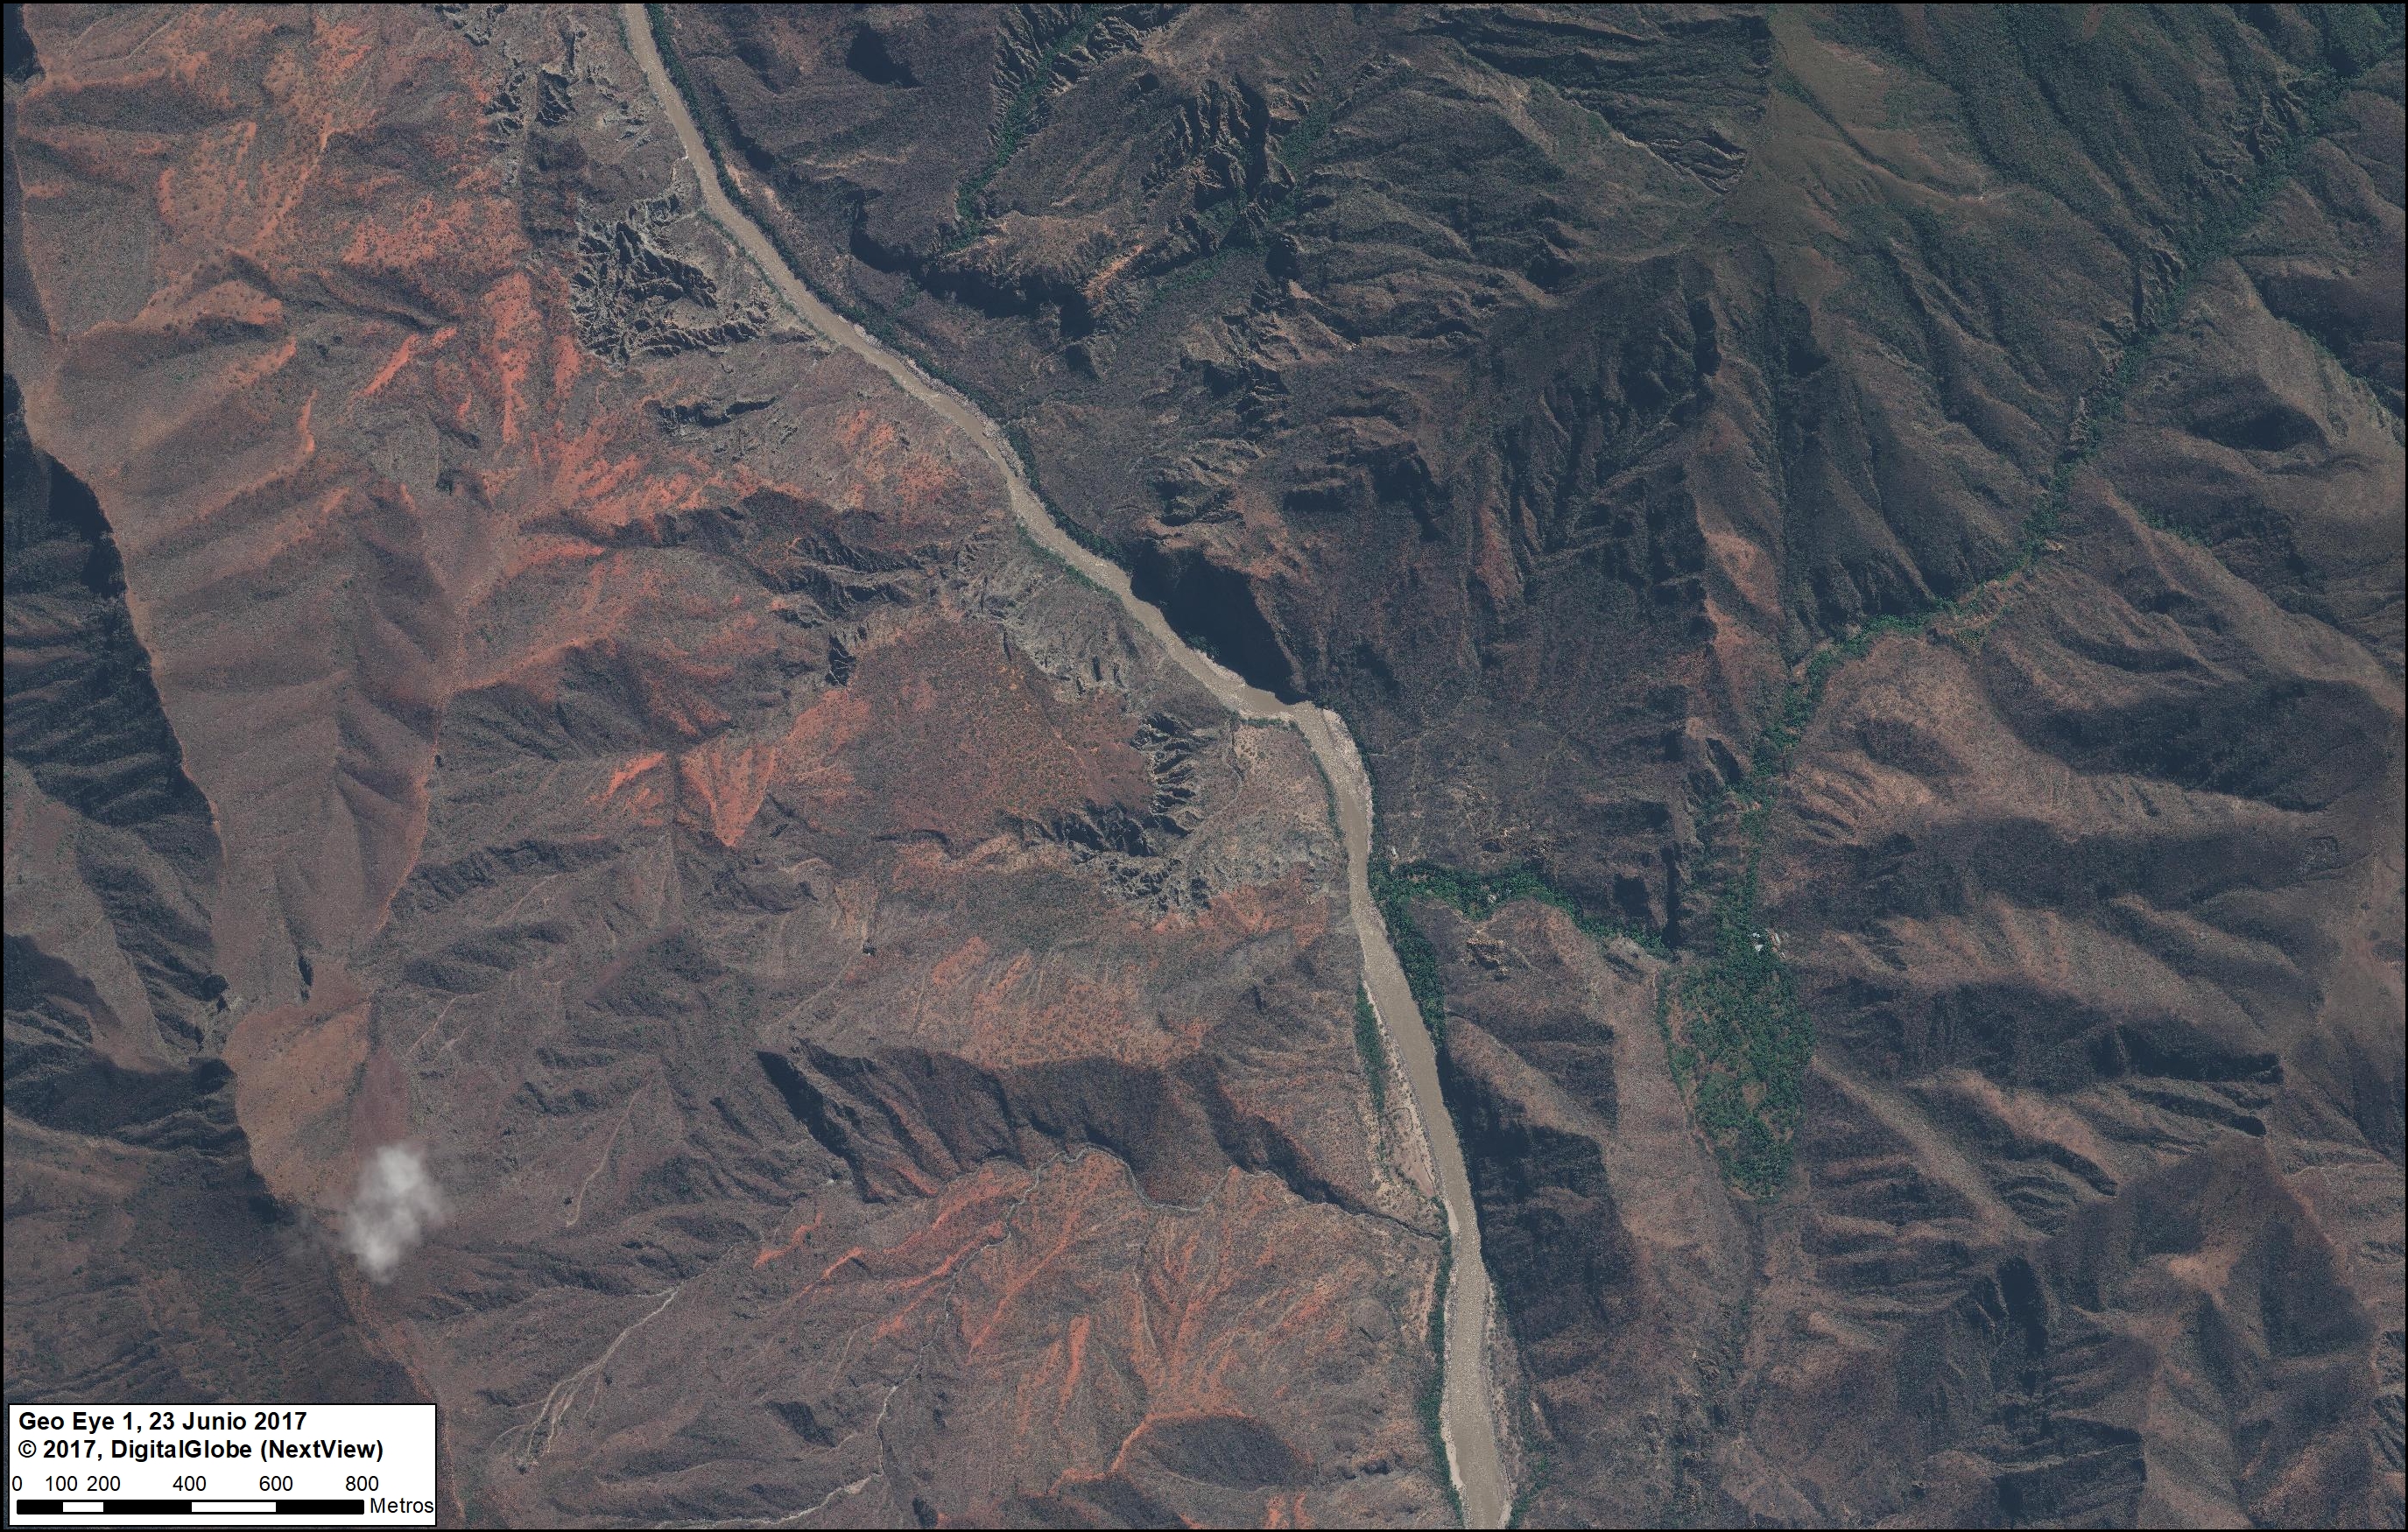
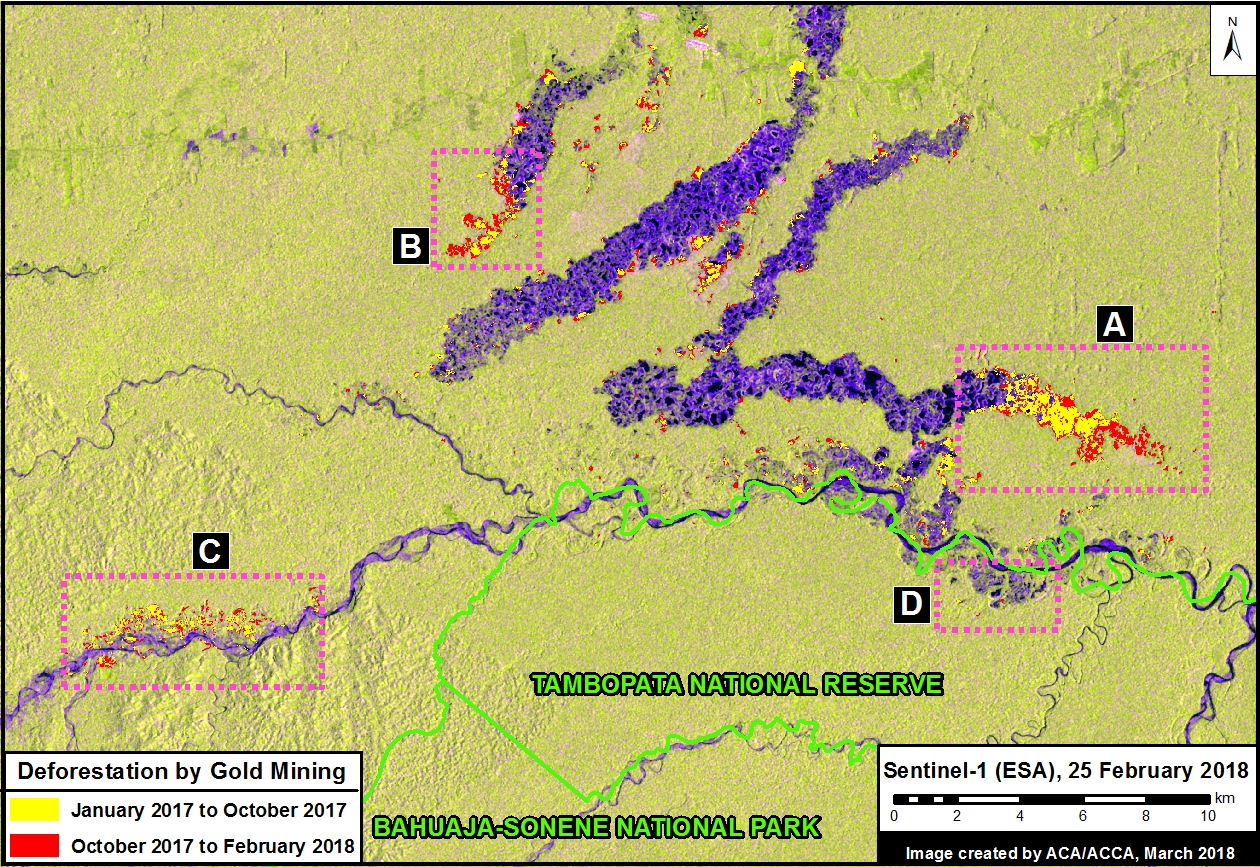
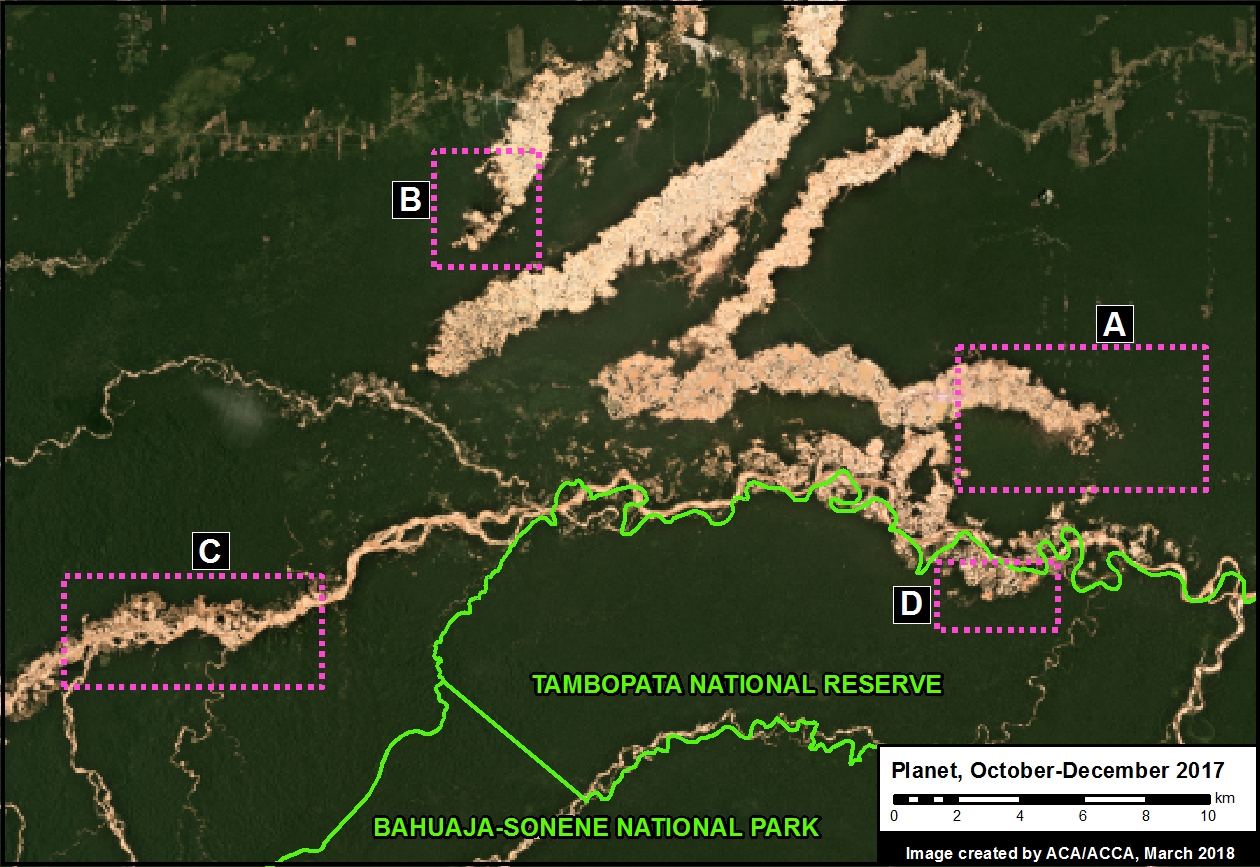
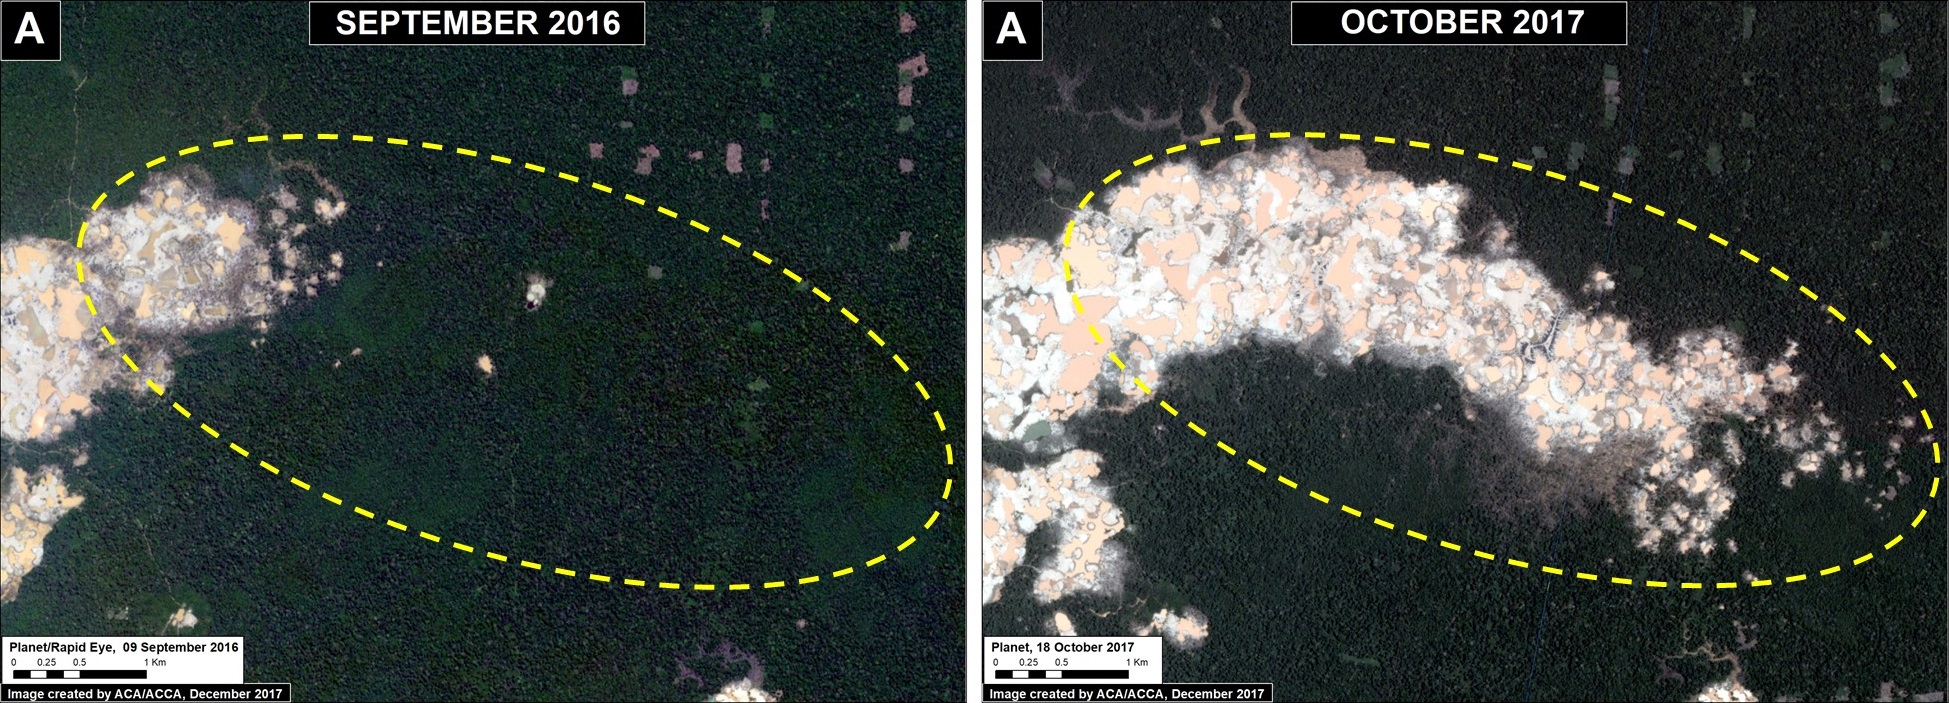
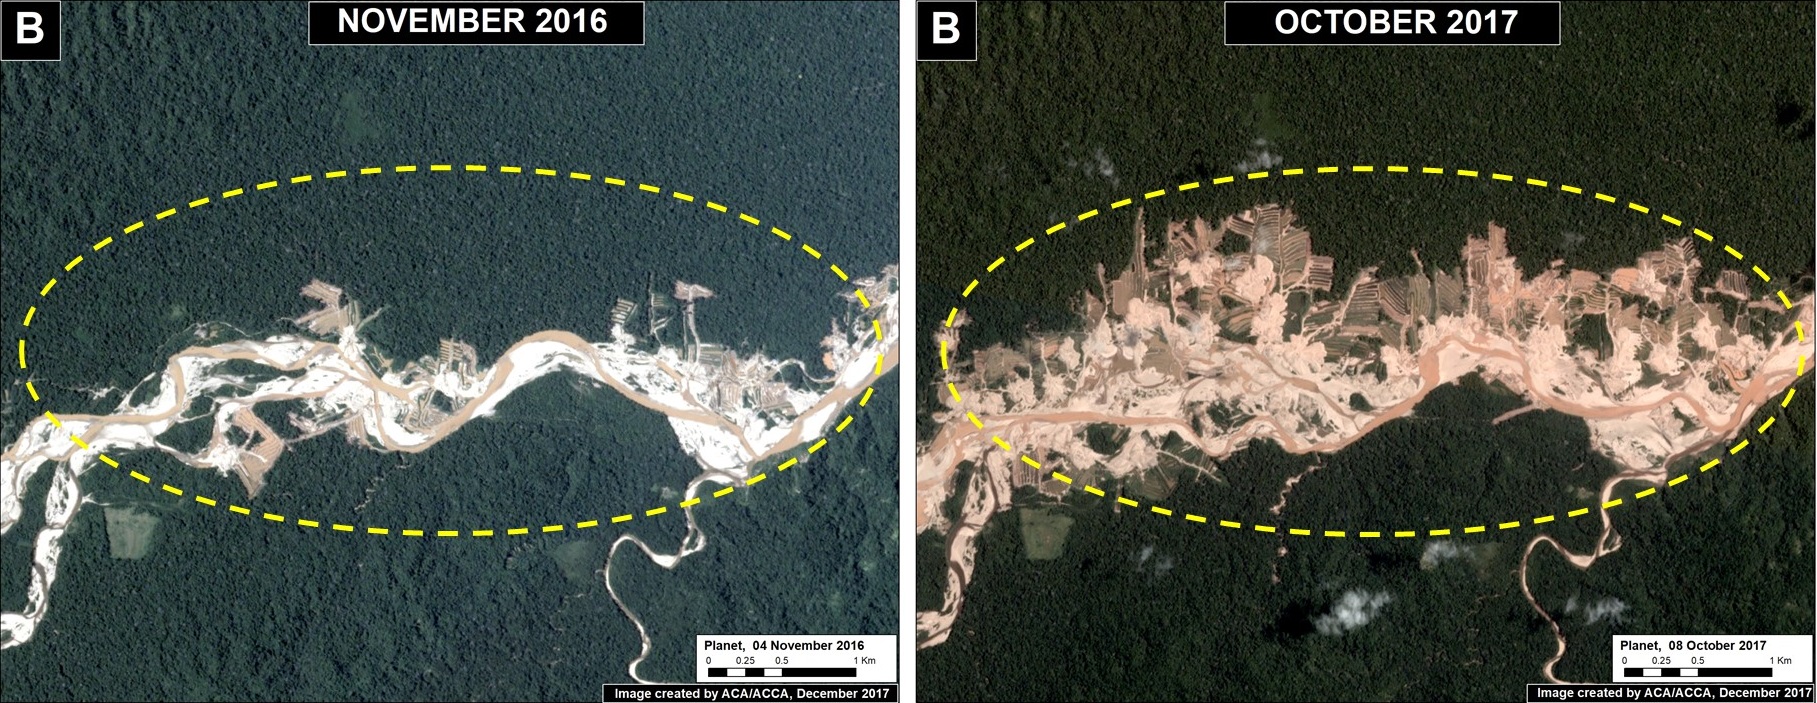
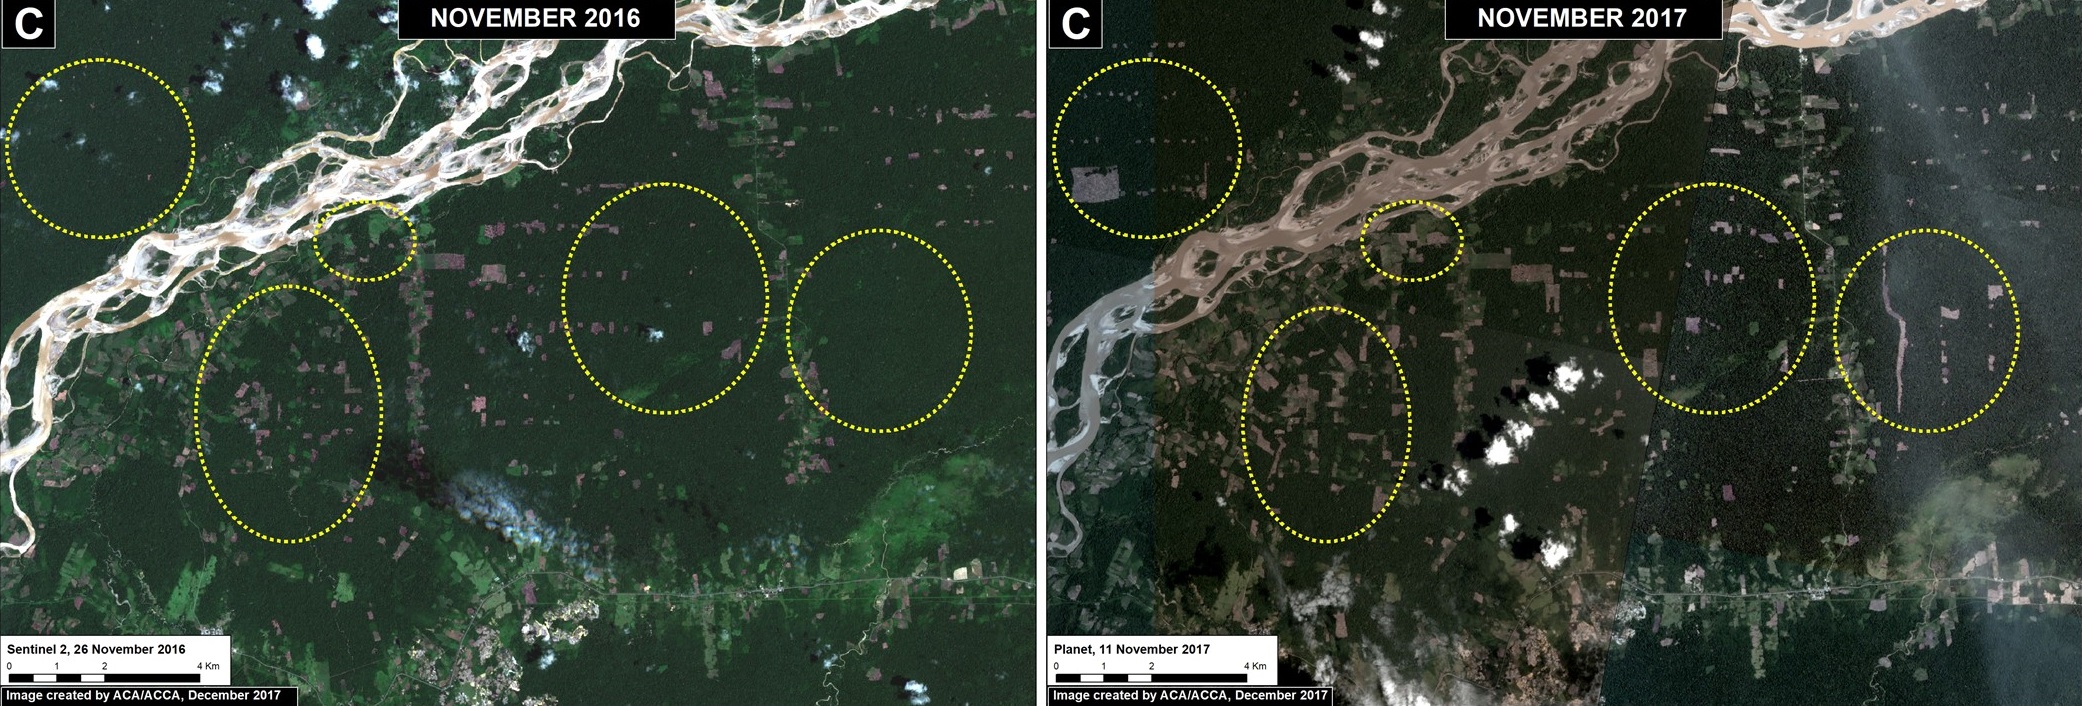
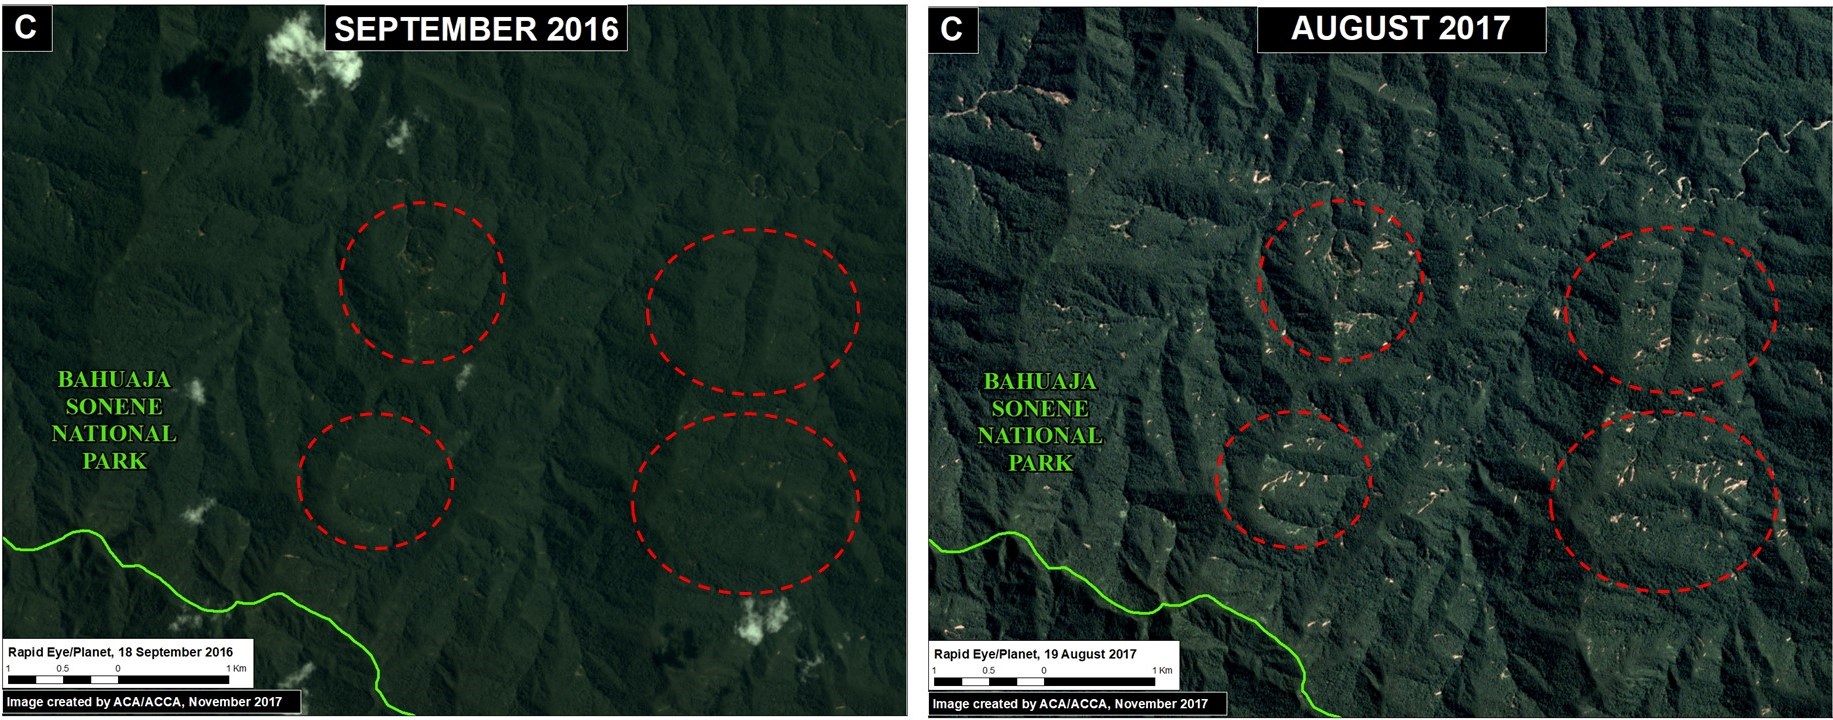
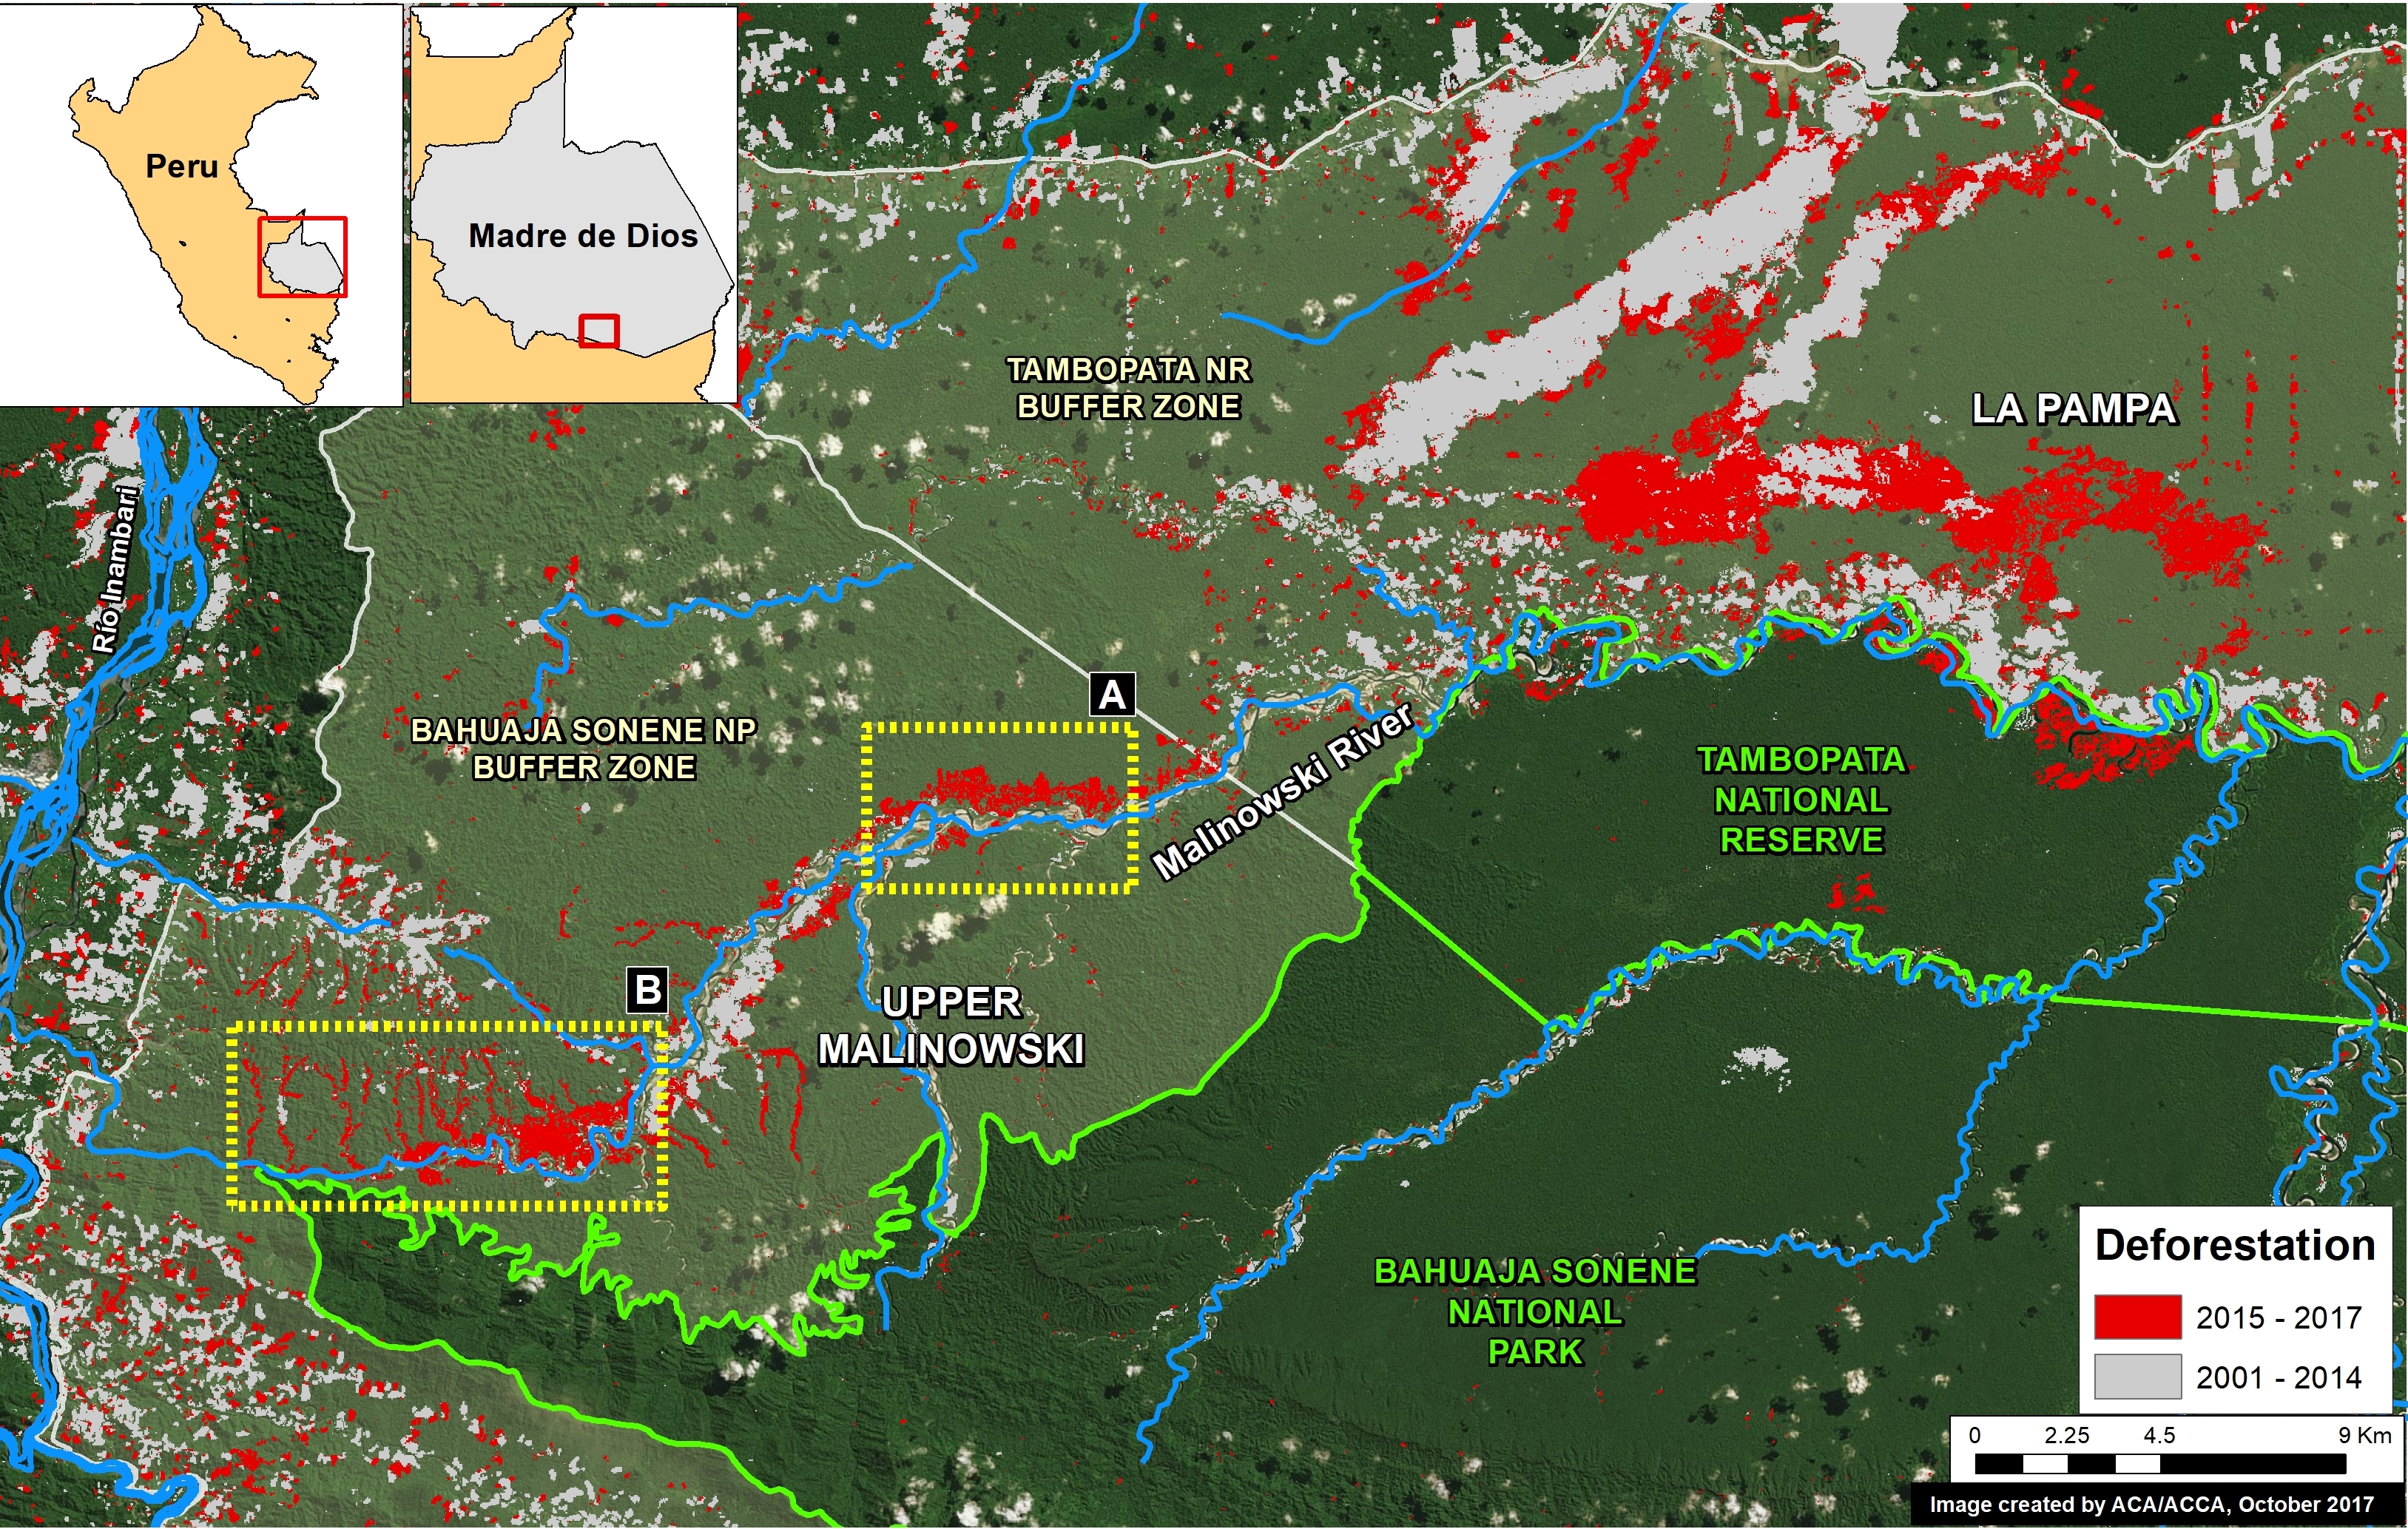
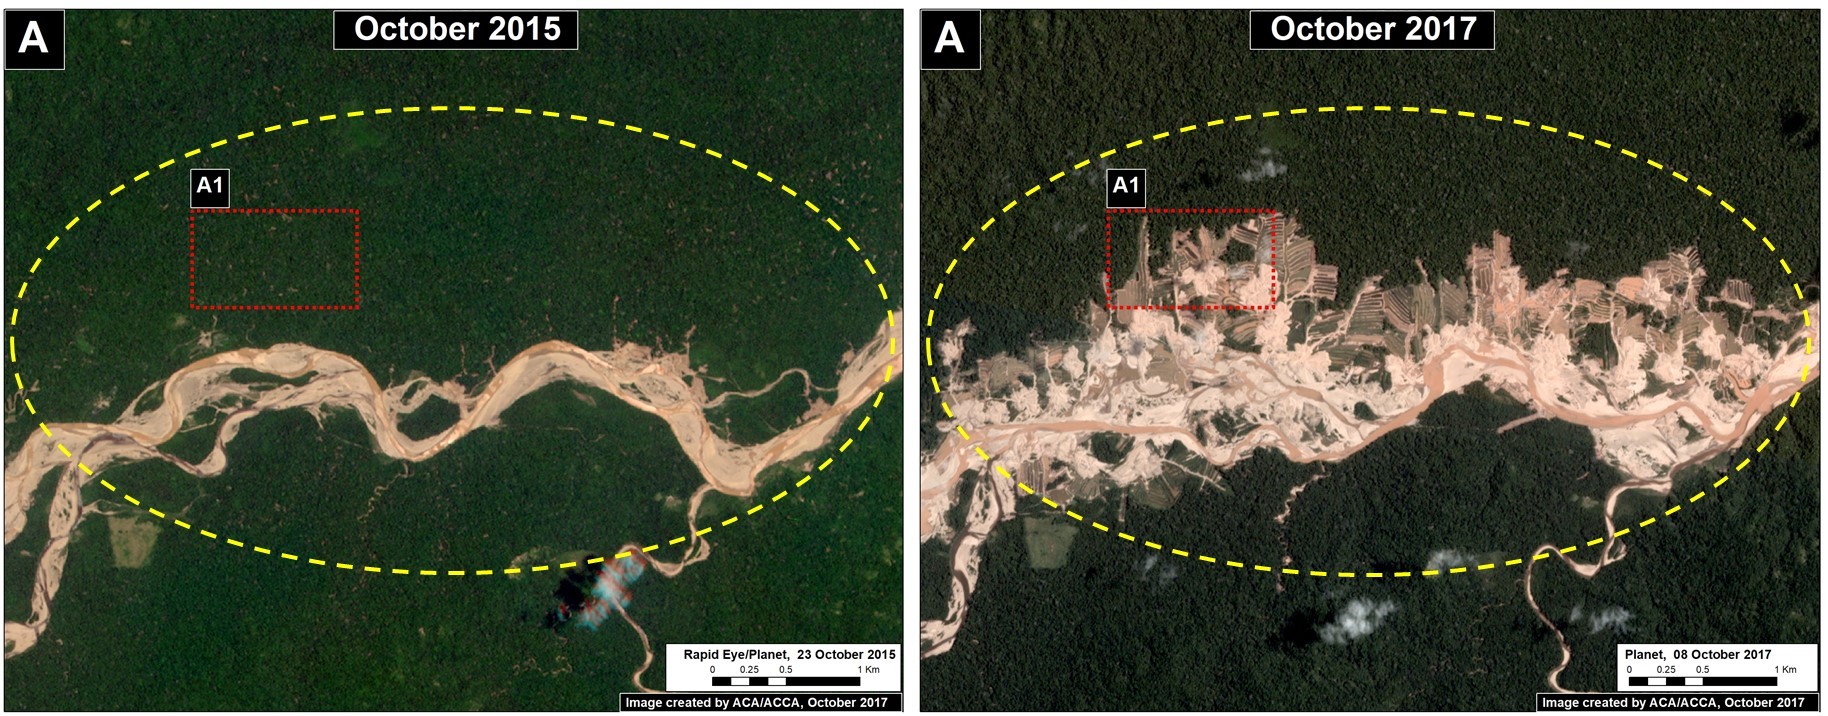
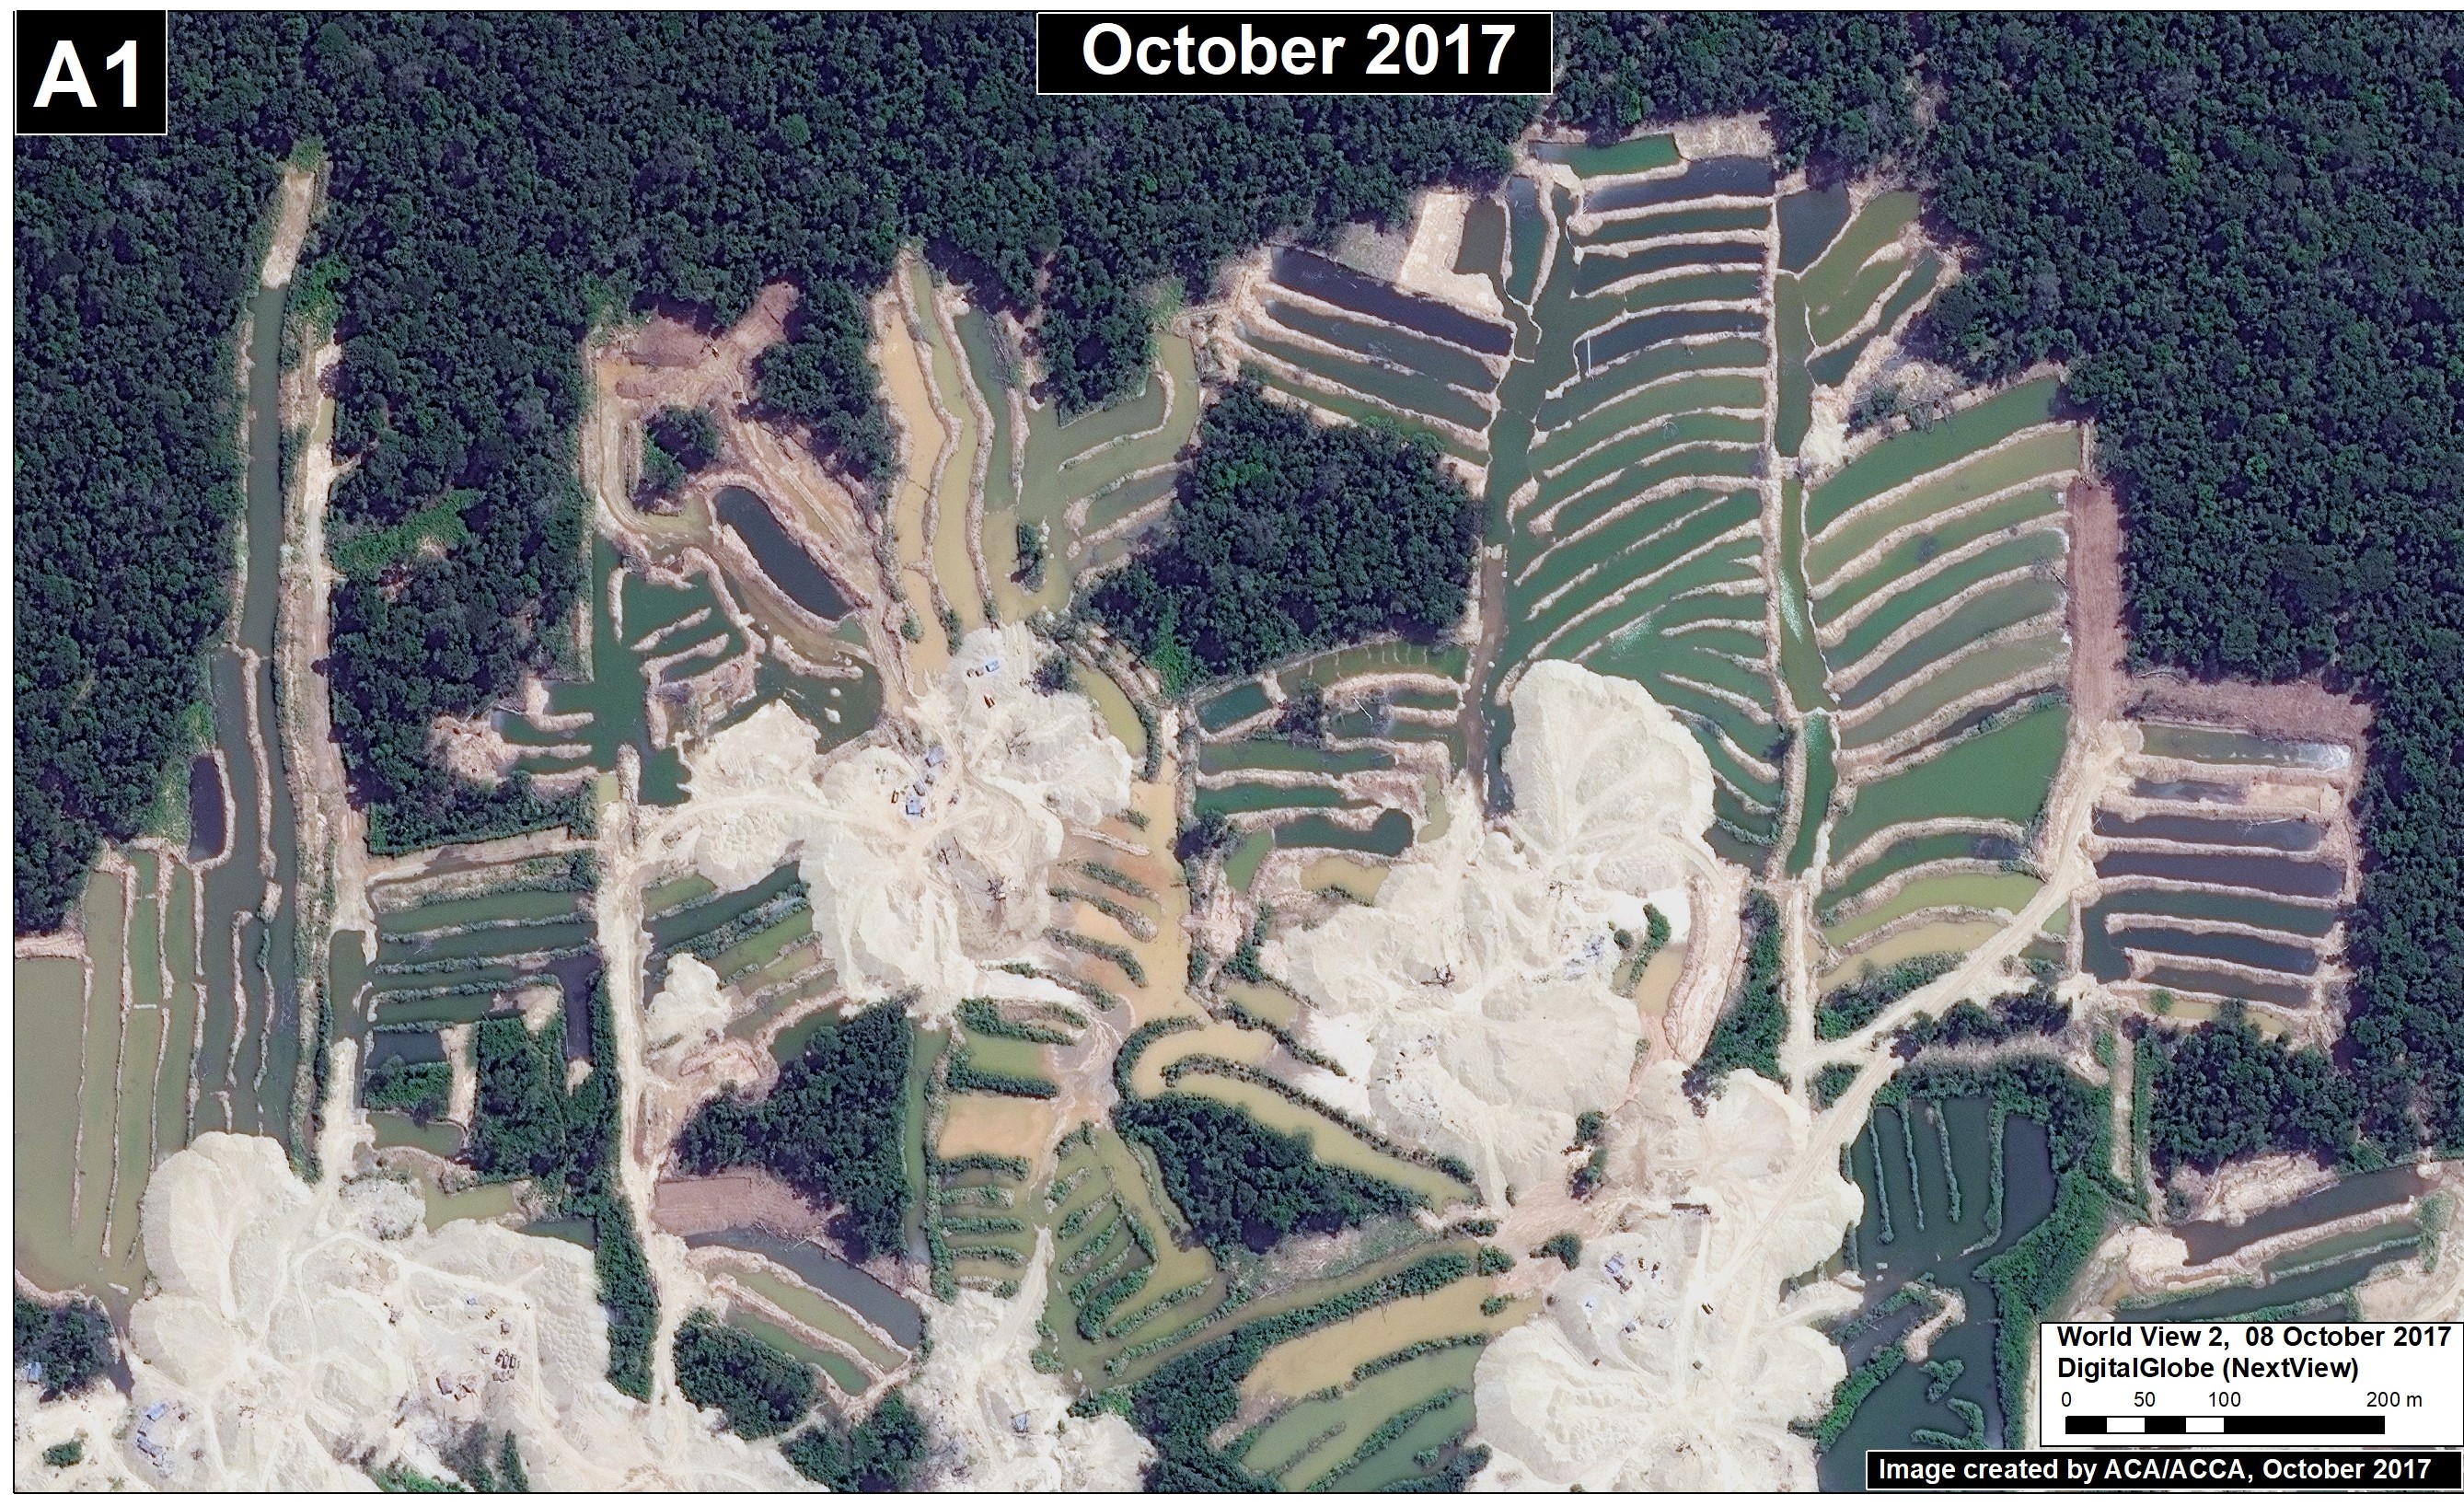
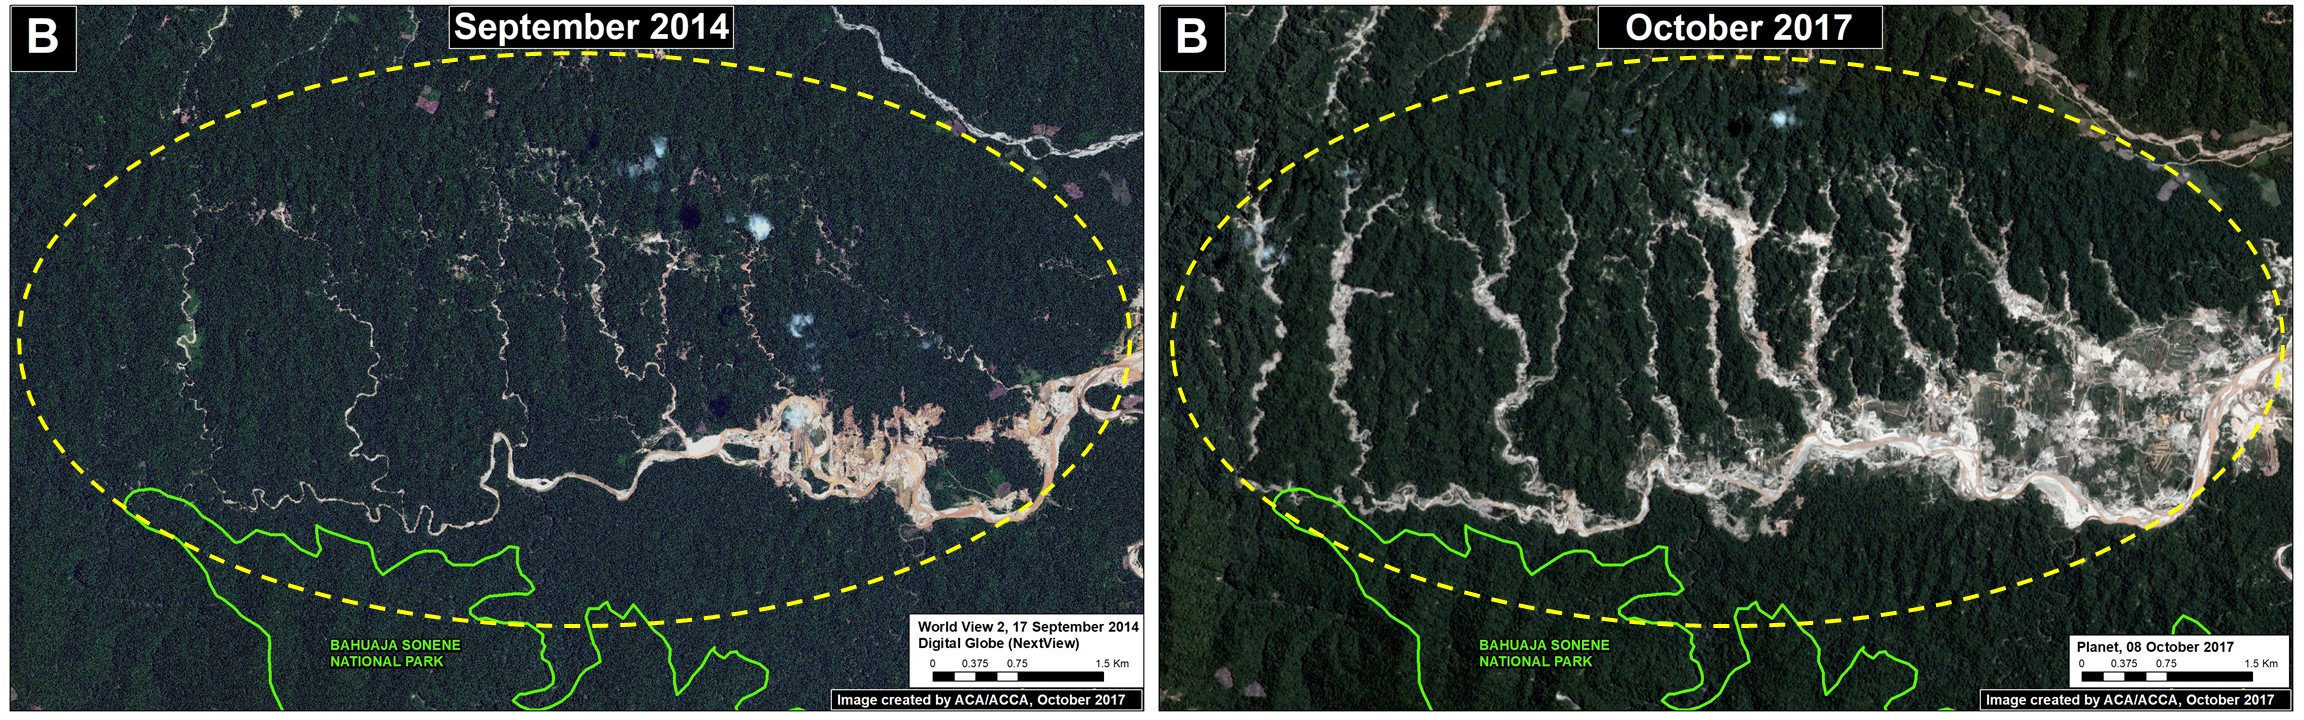
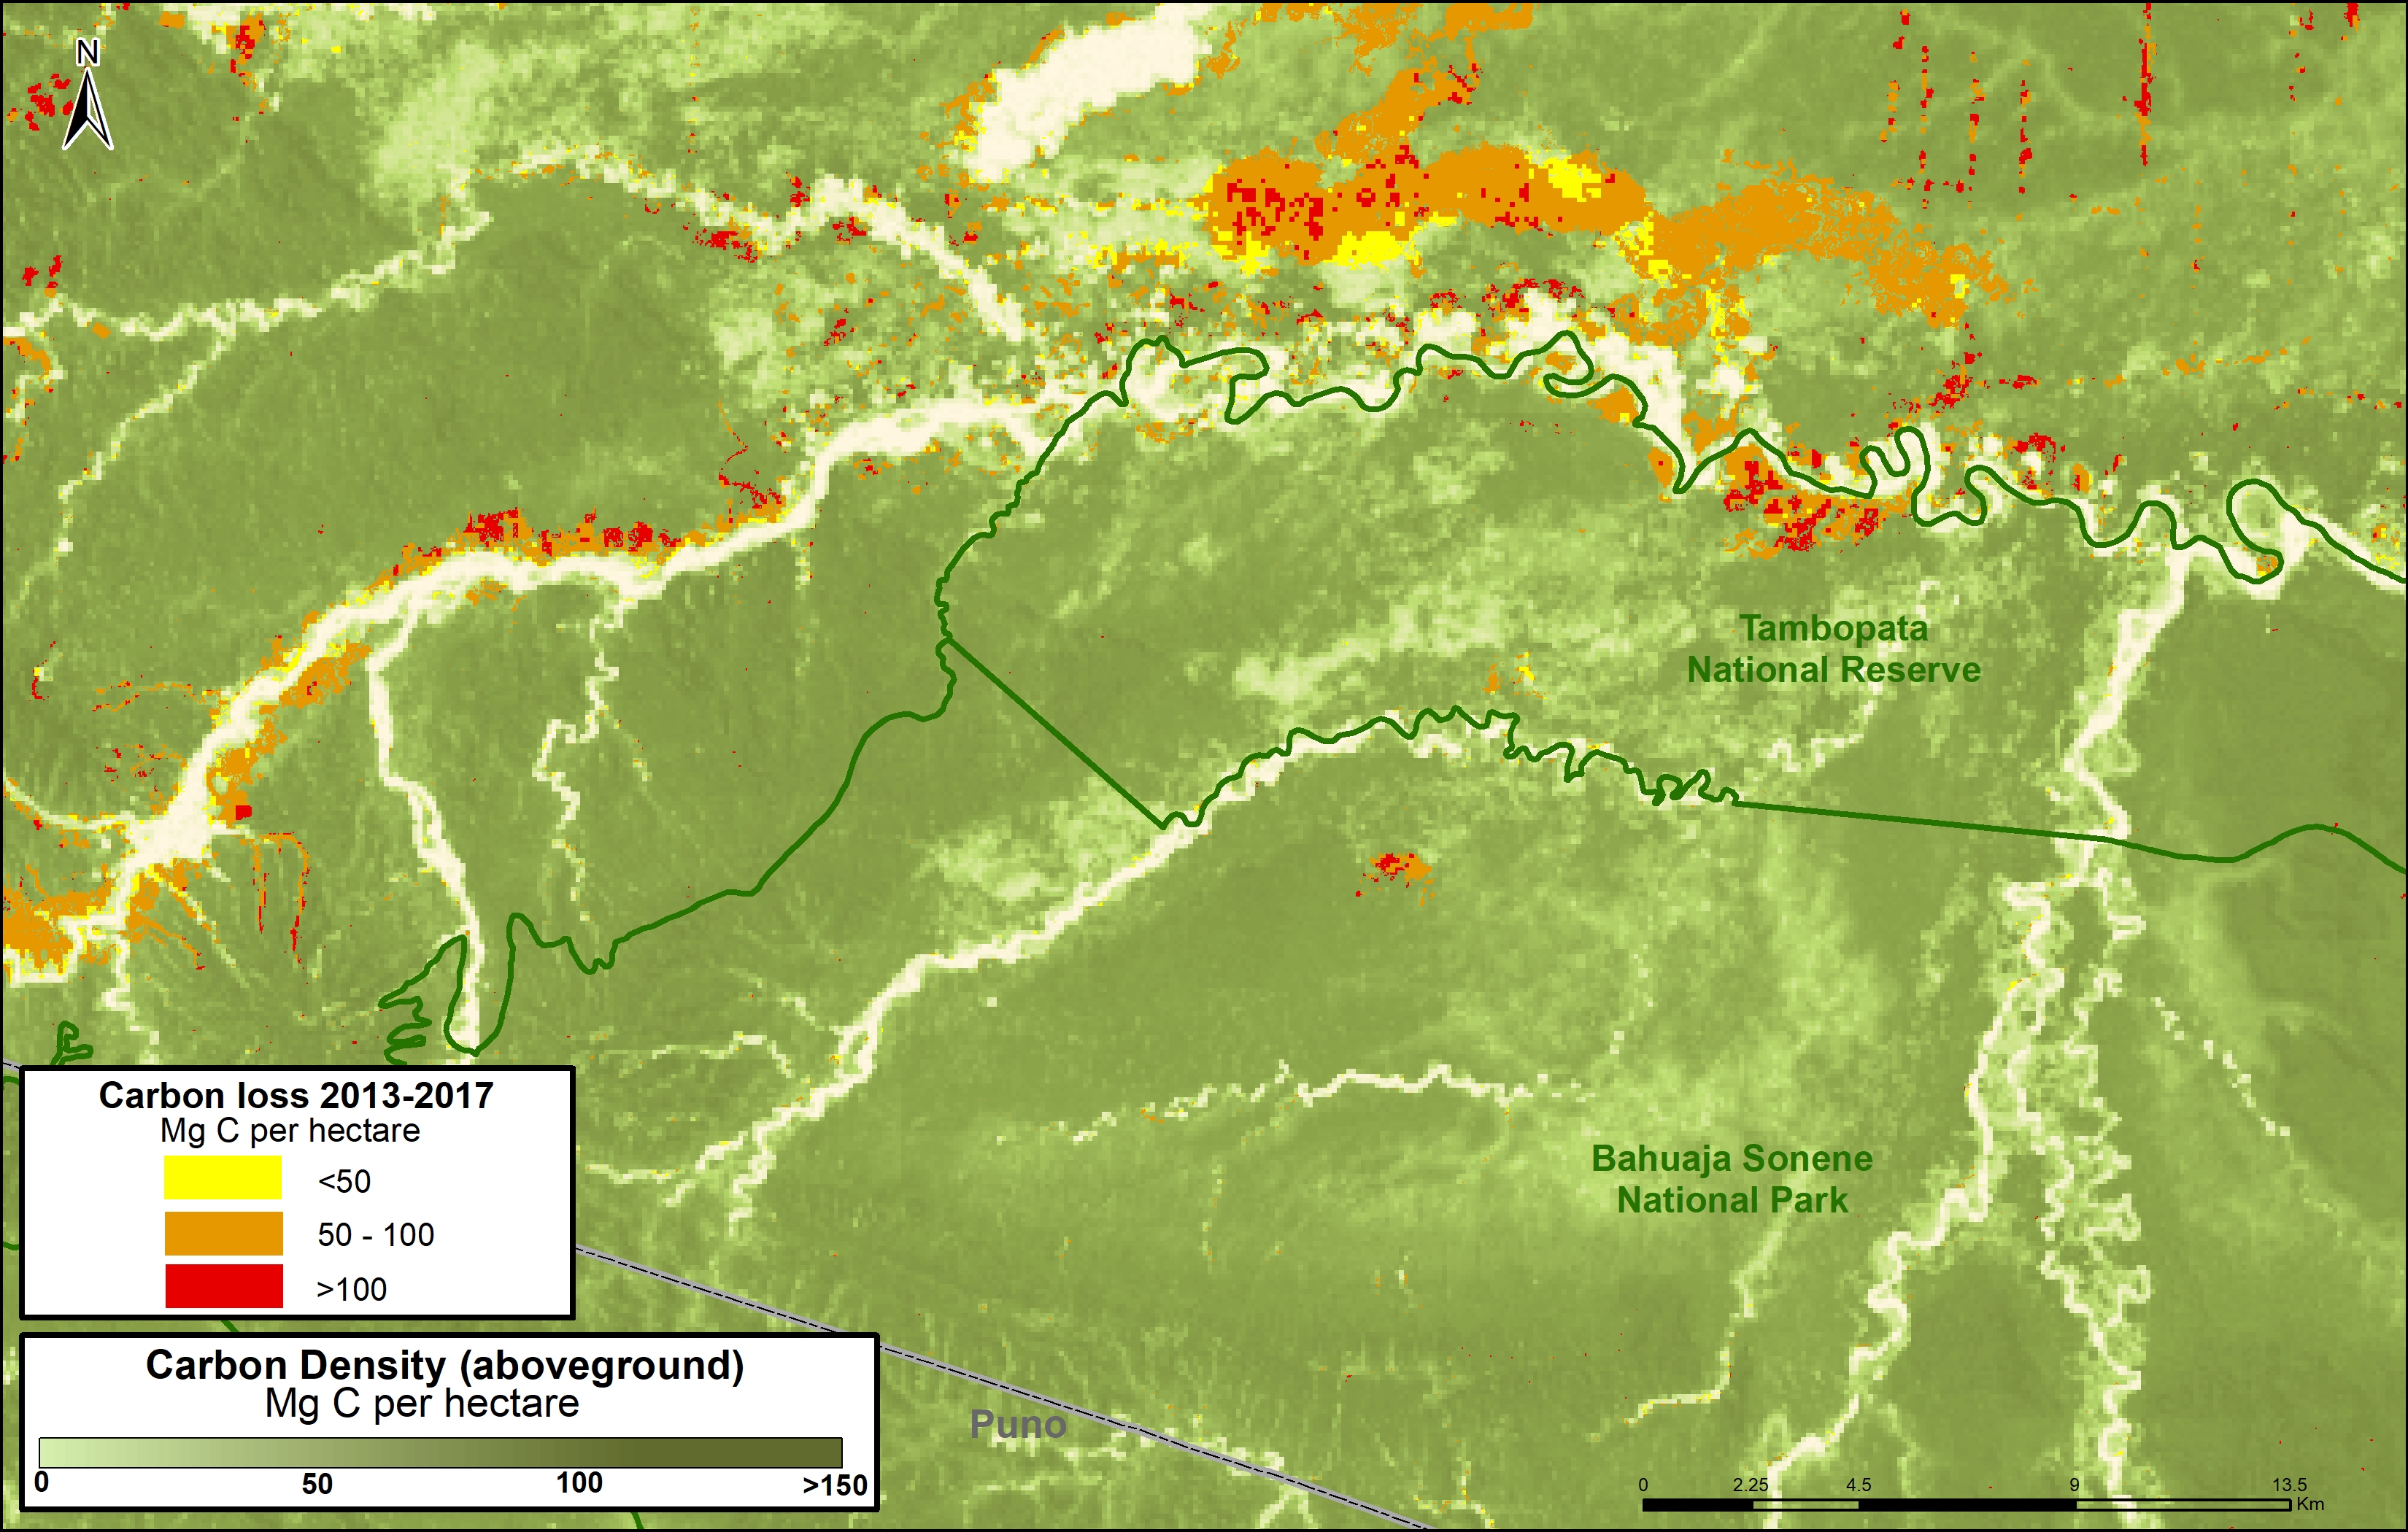
C. Tambopata National Reserve, Bahuaja Sonene National Park
The following Image C shows how two important natural protected areas, Tambopata National Reserve and Bahuaja Sonene National Park, are helping conserve carbon stocks in an area with intense illegal gold mining activity.
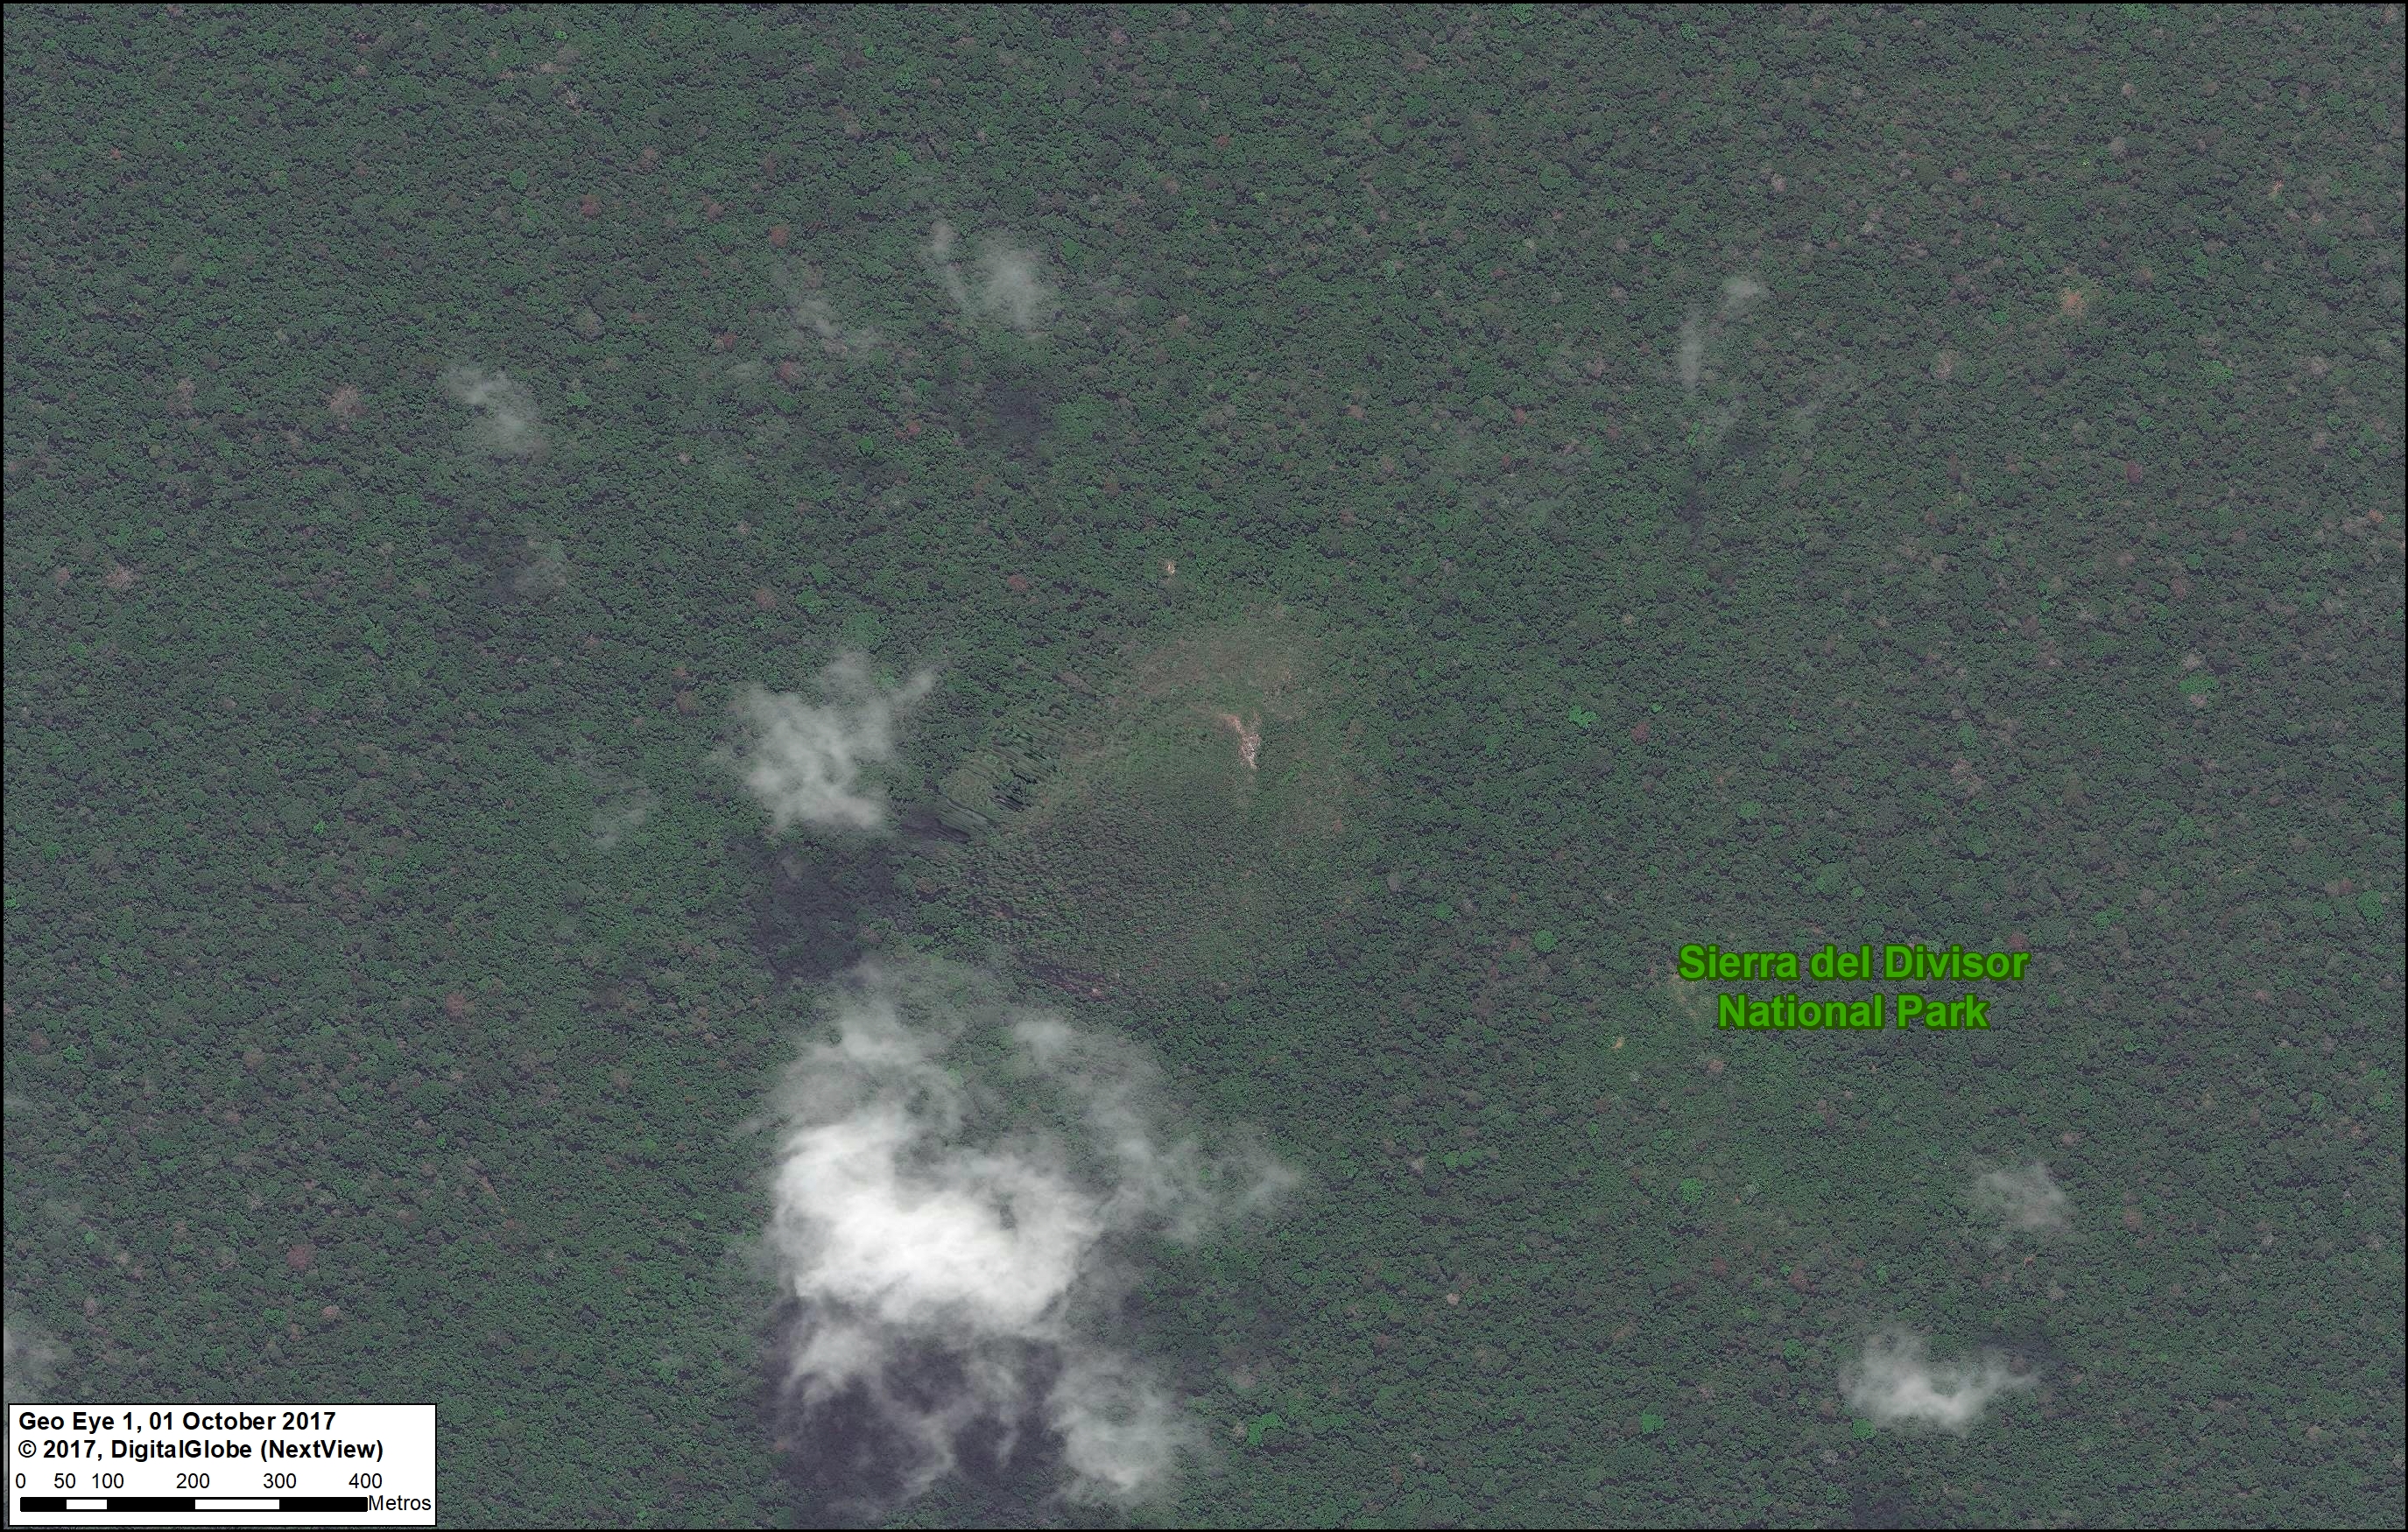
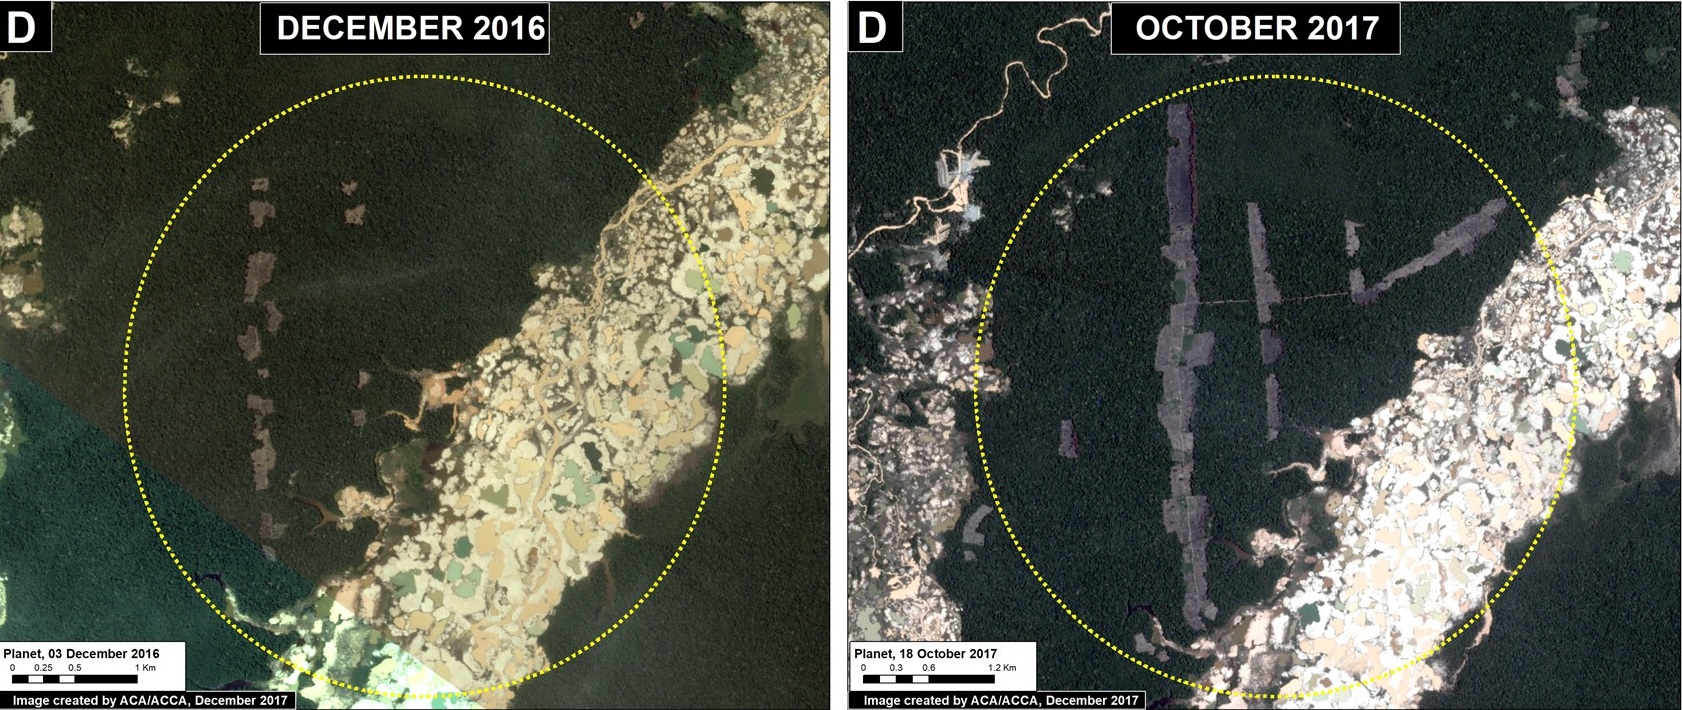
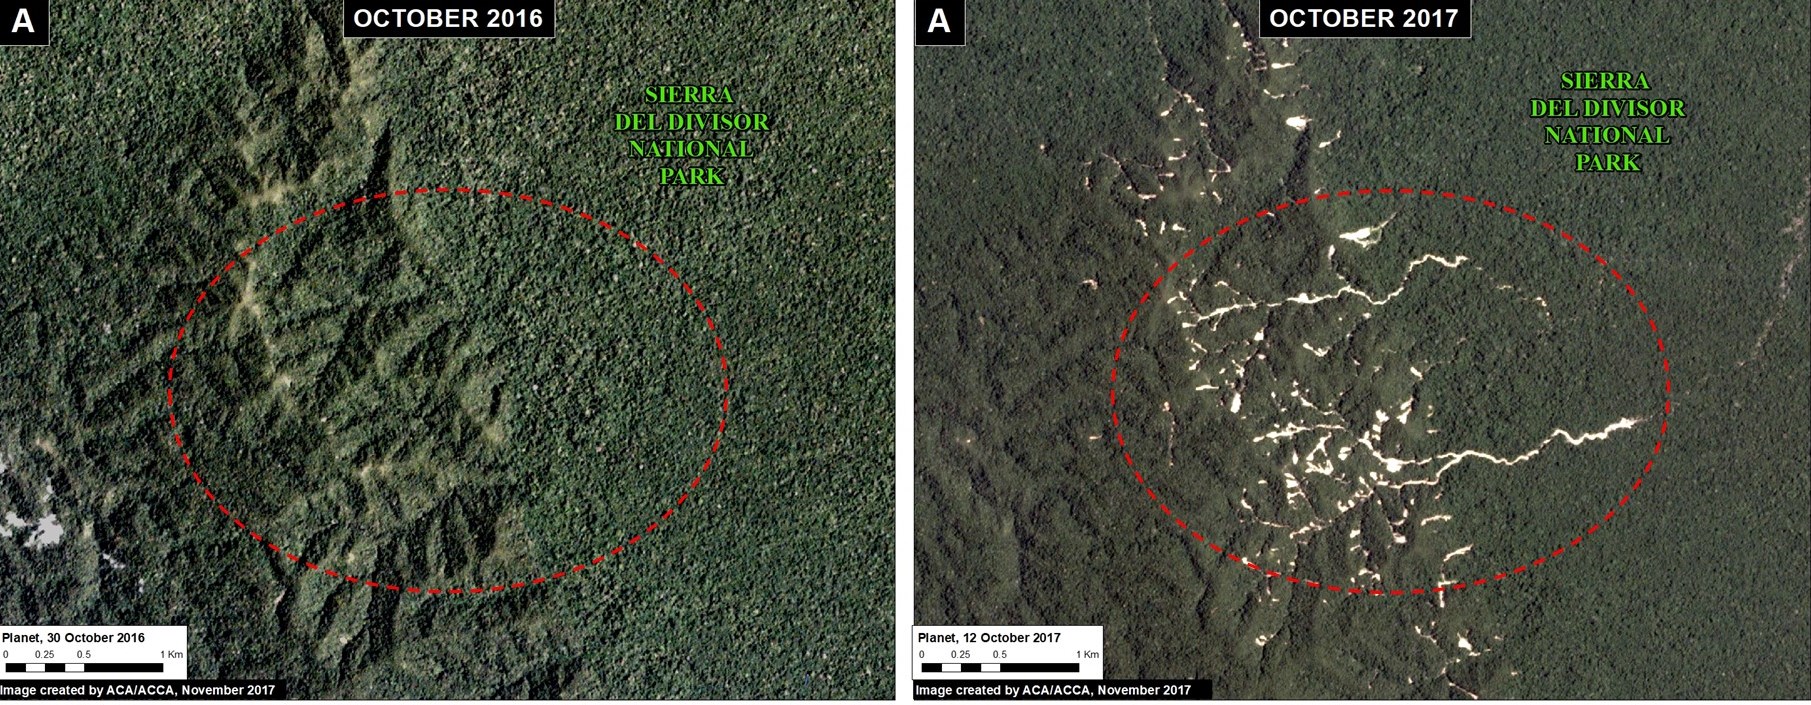
D. Sierra del Divisor National Park, National Reserve Matsés
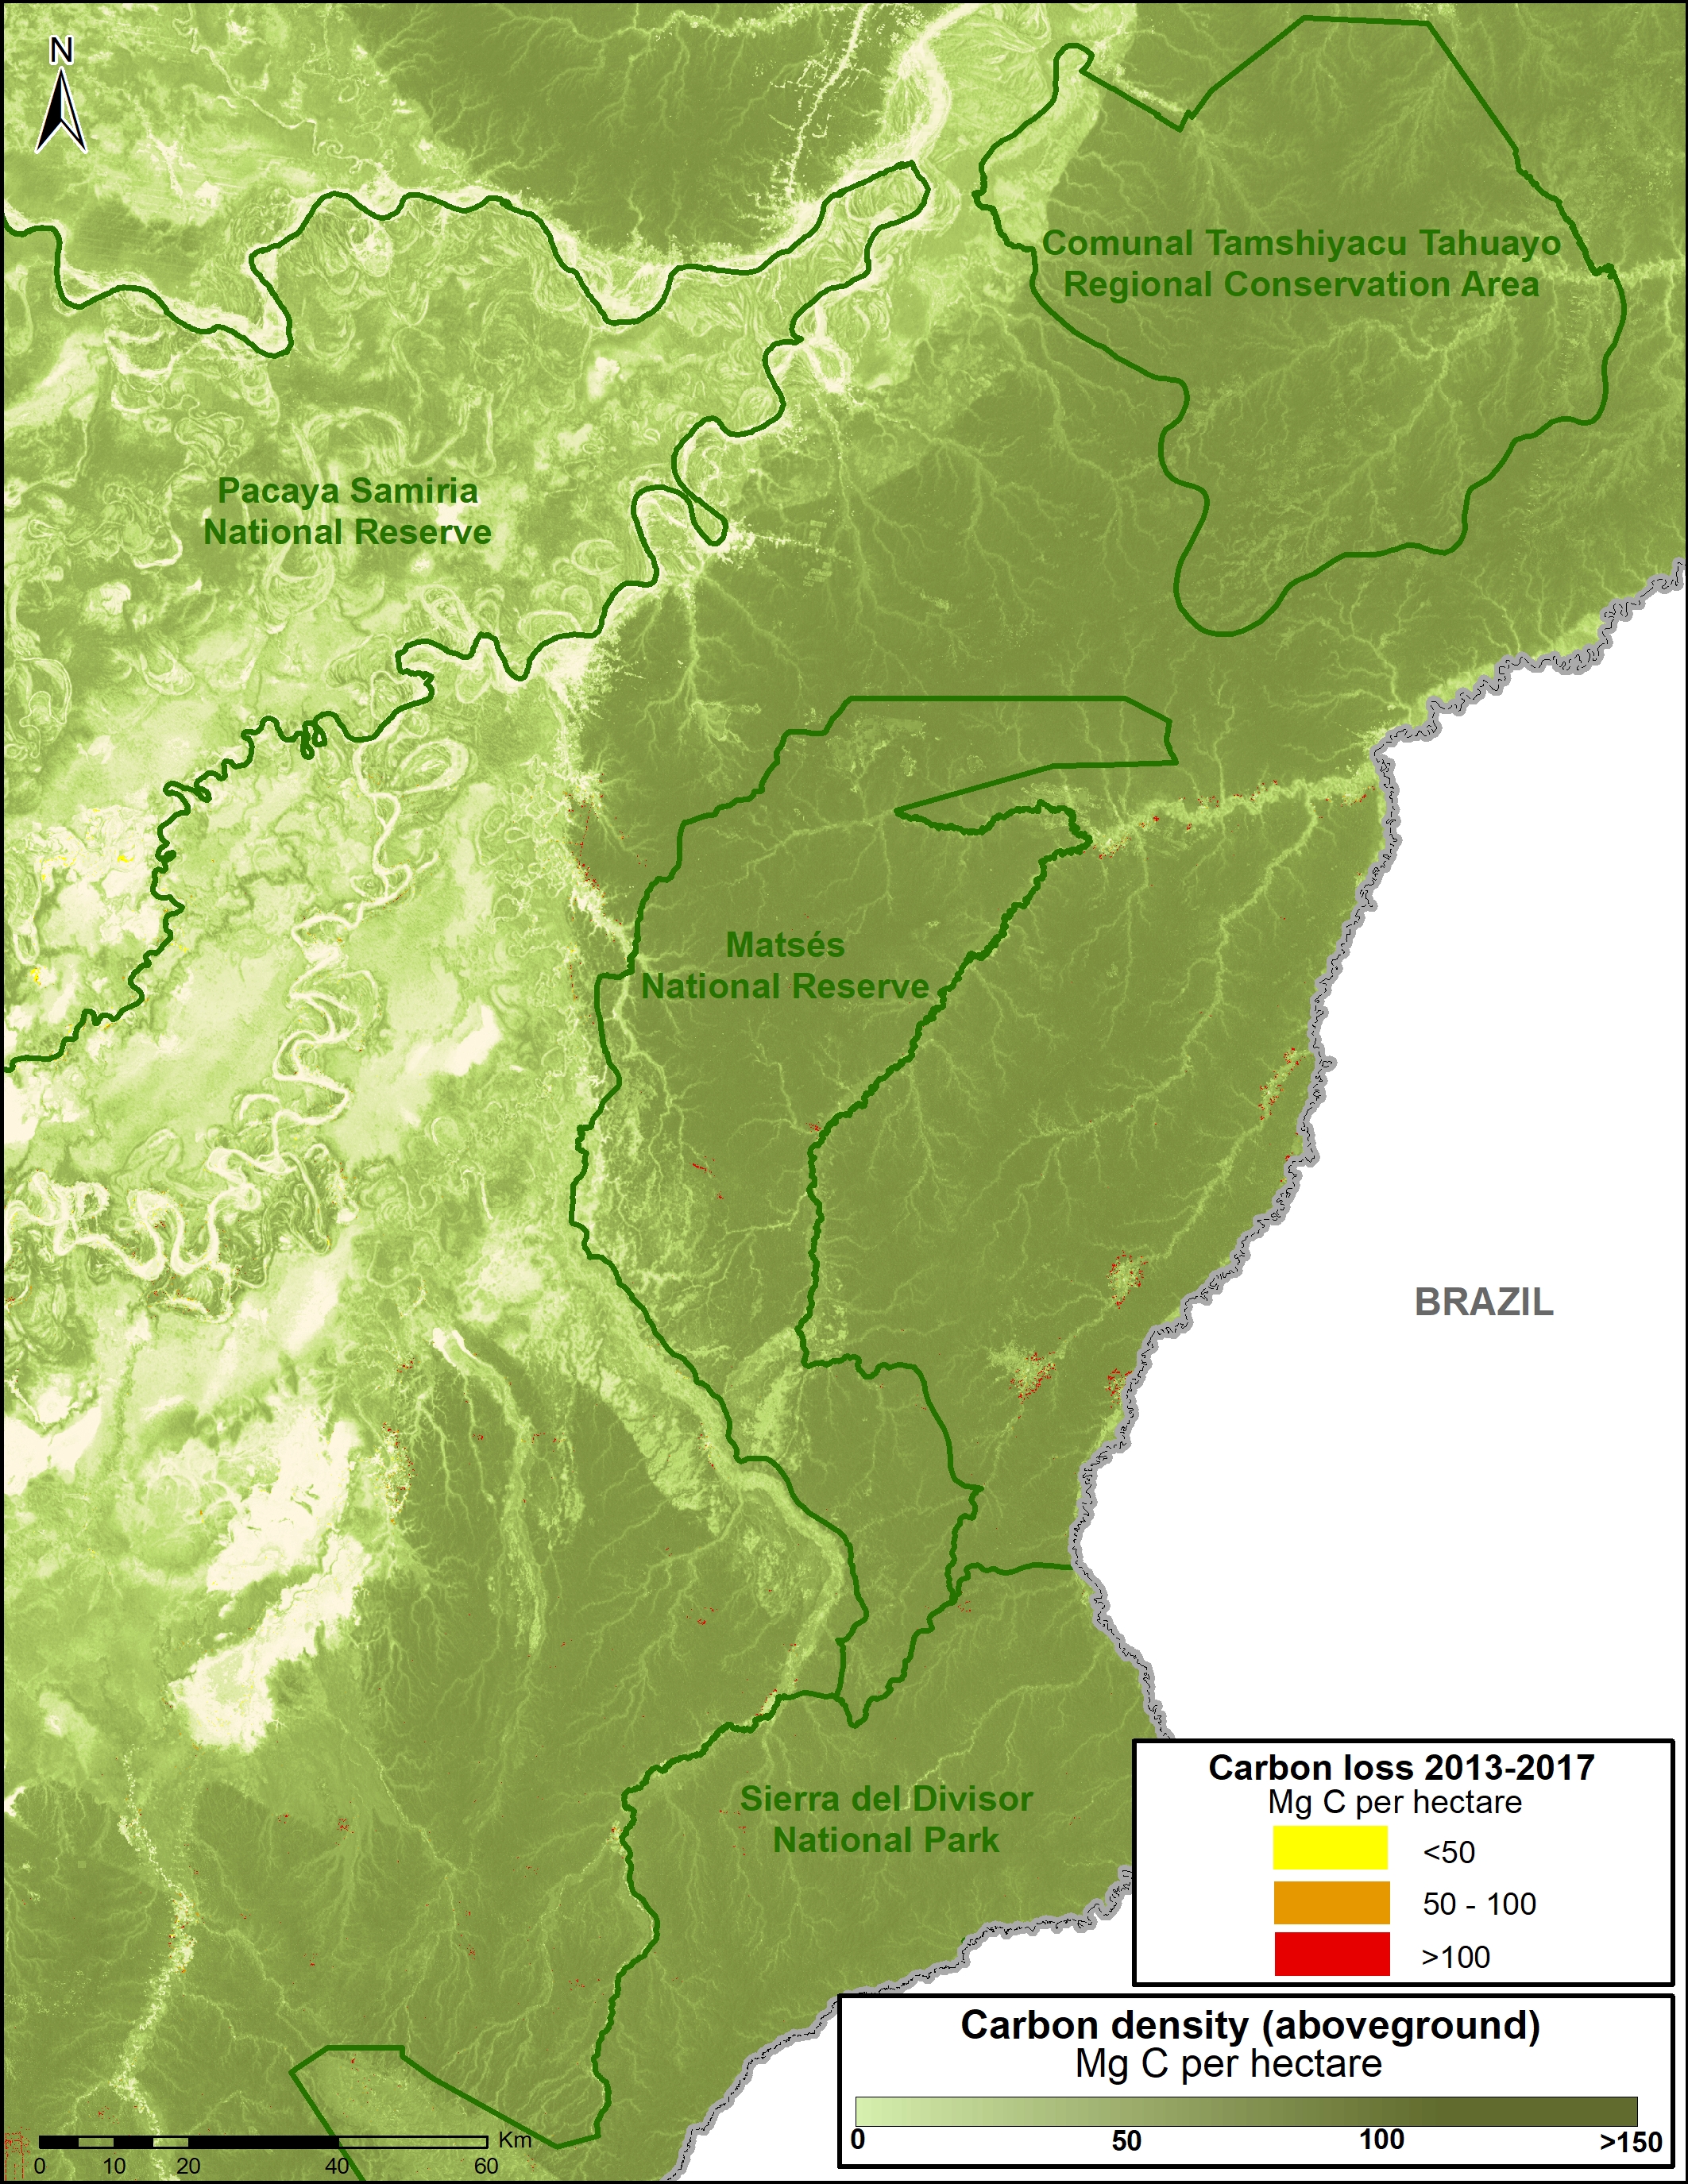
The following Image D shows how four protected areas, including the new Sierra del Divisor National Park, and adjacent National Reserve Matsés are effectively safeguarding 270 million metric tons of carbon in the eastern Peruvian Amazon.
This area is home to some of the highest carbon densities in the country.
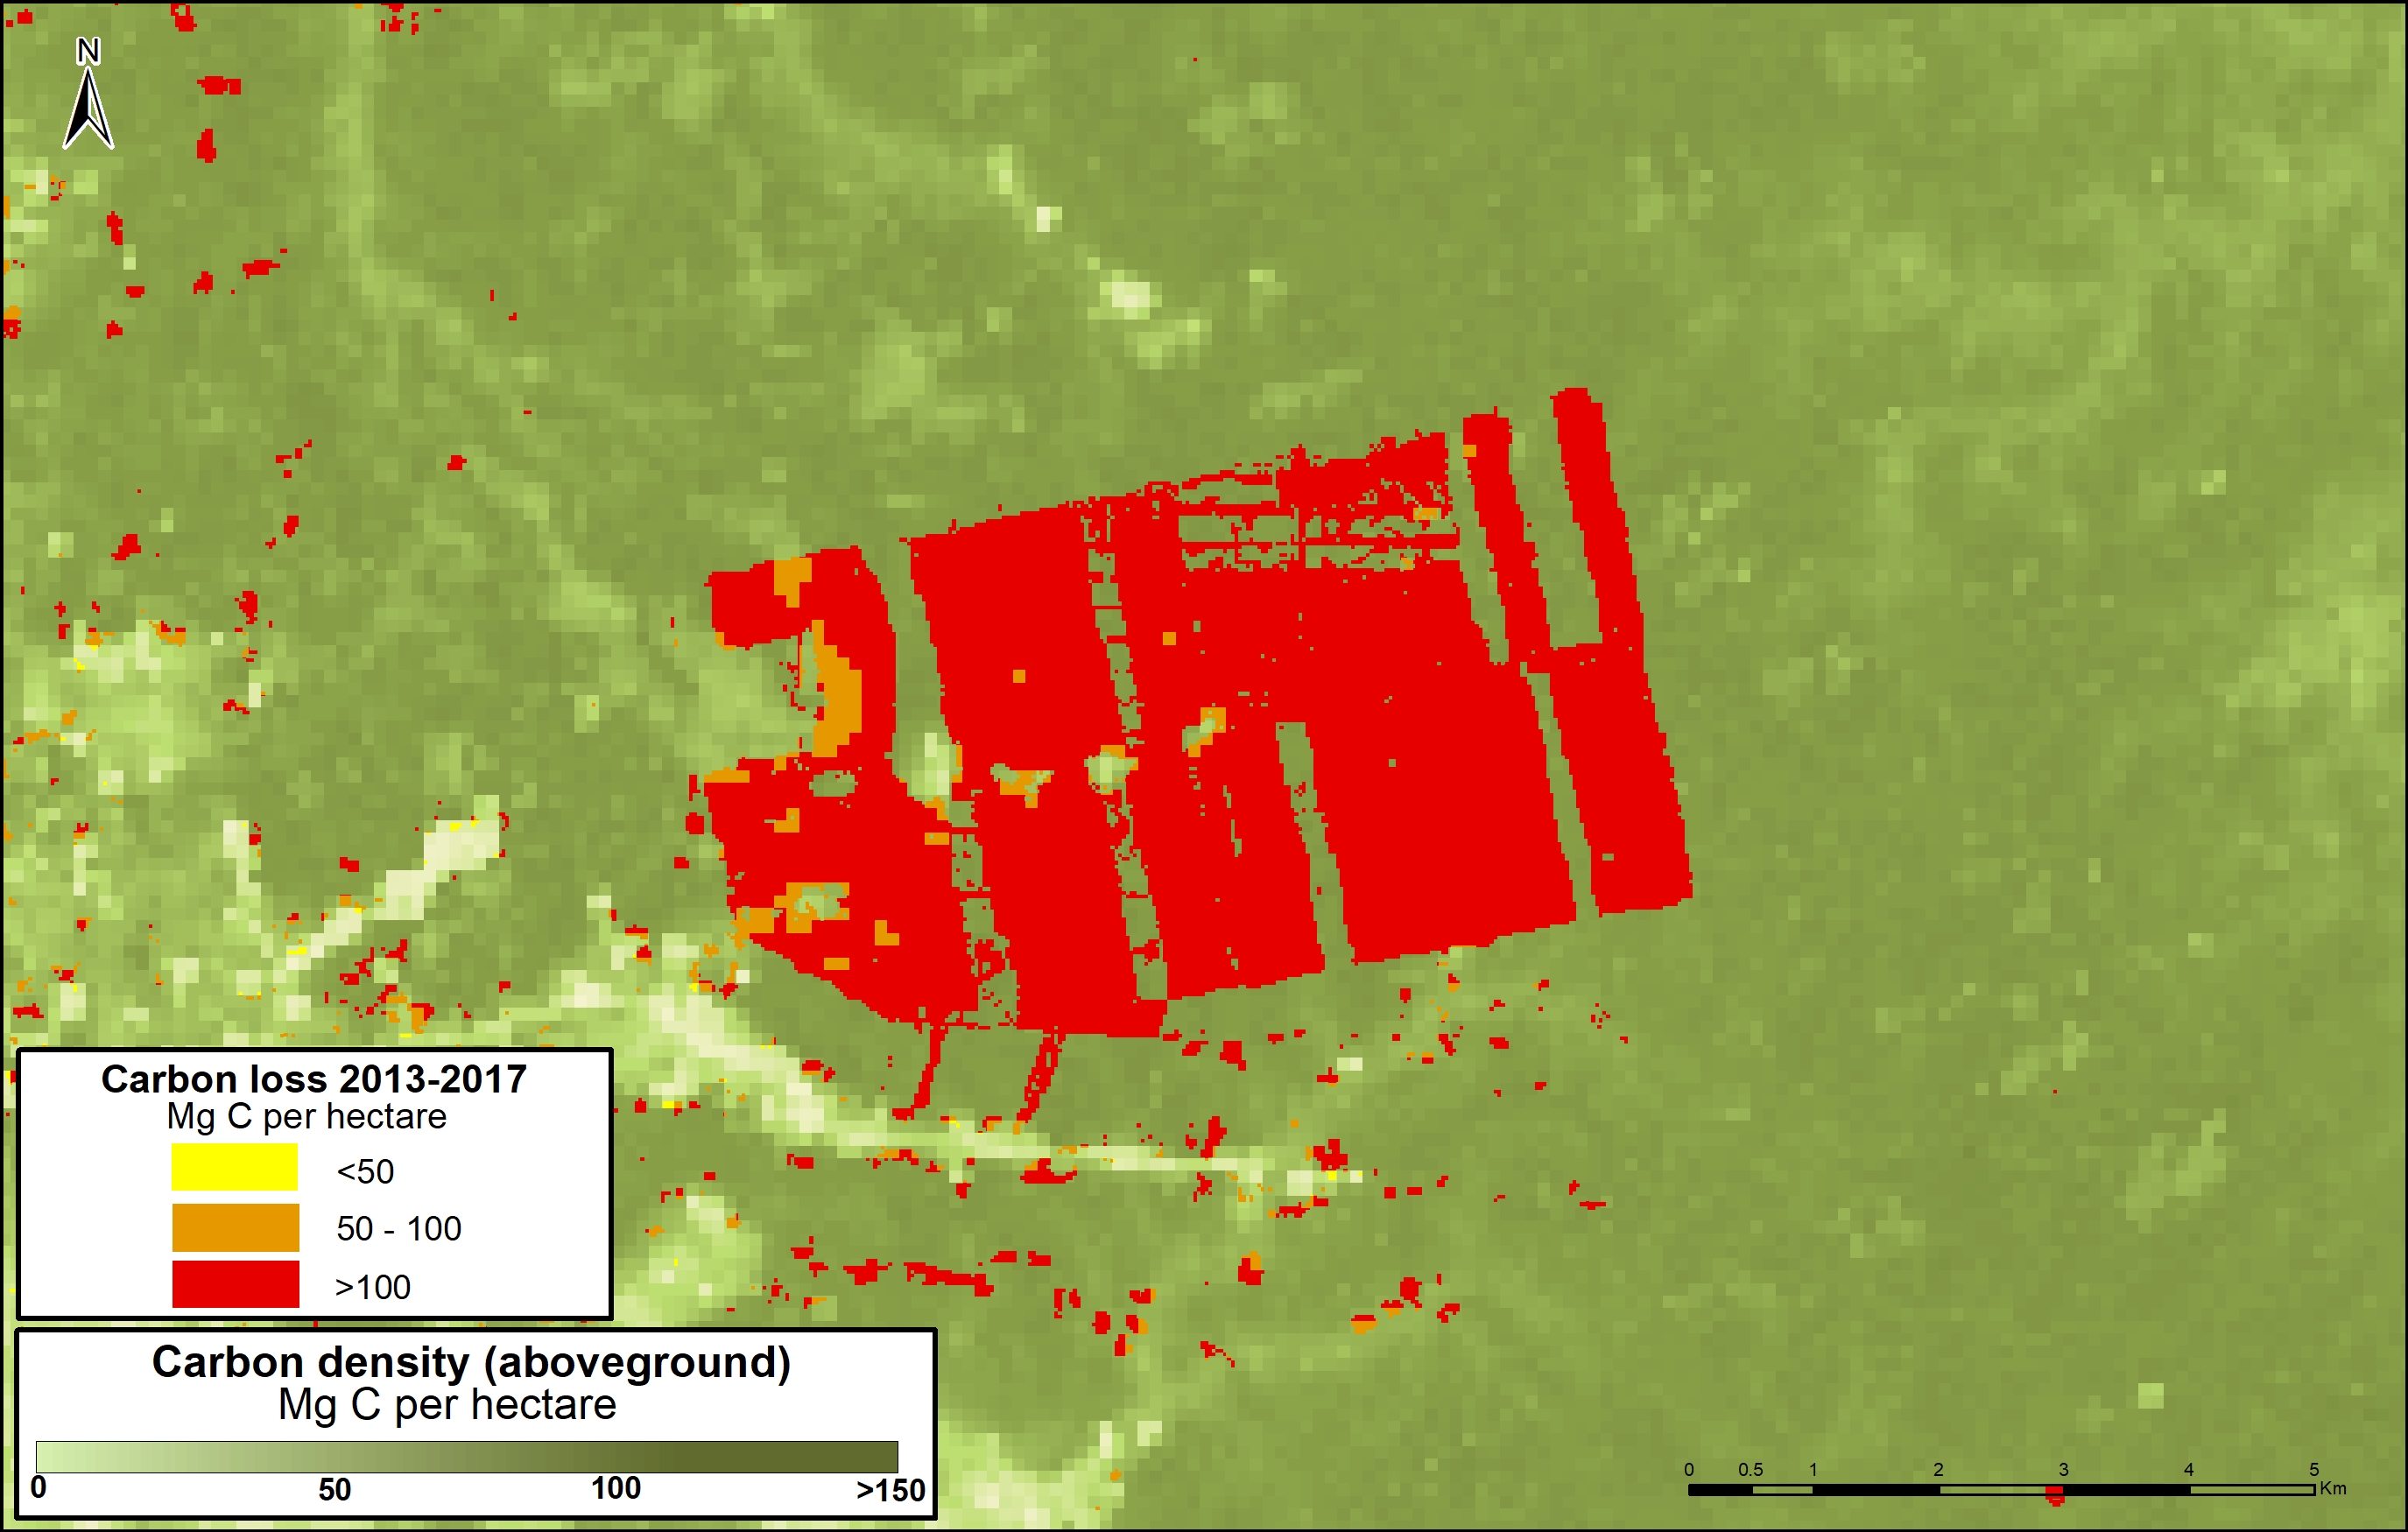
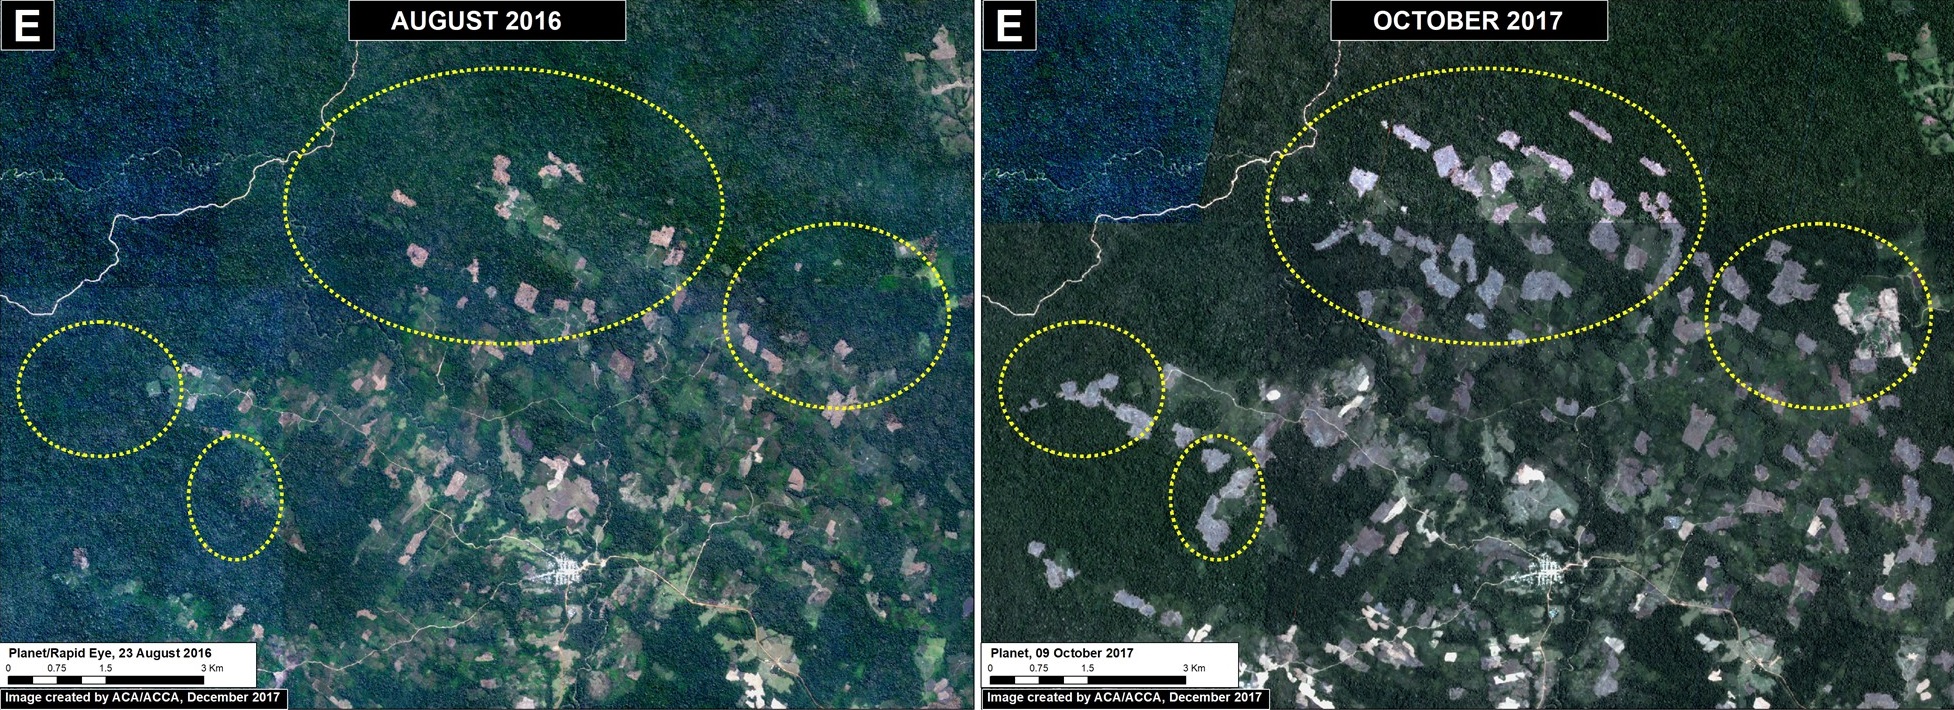
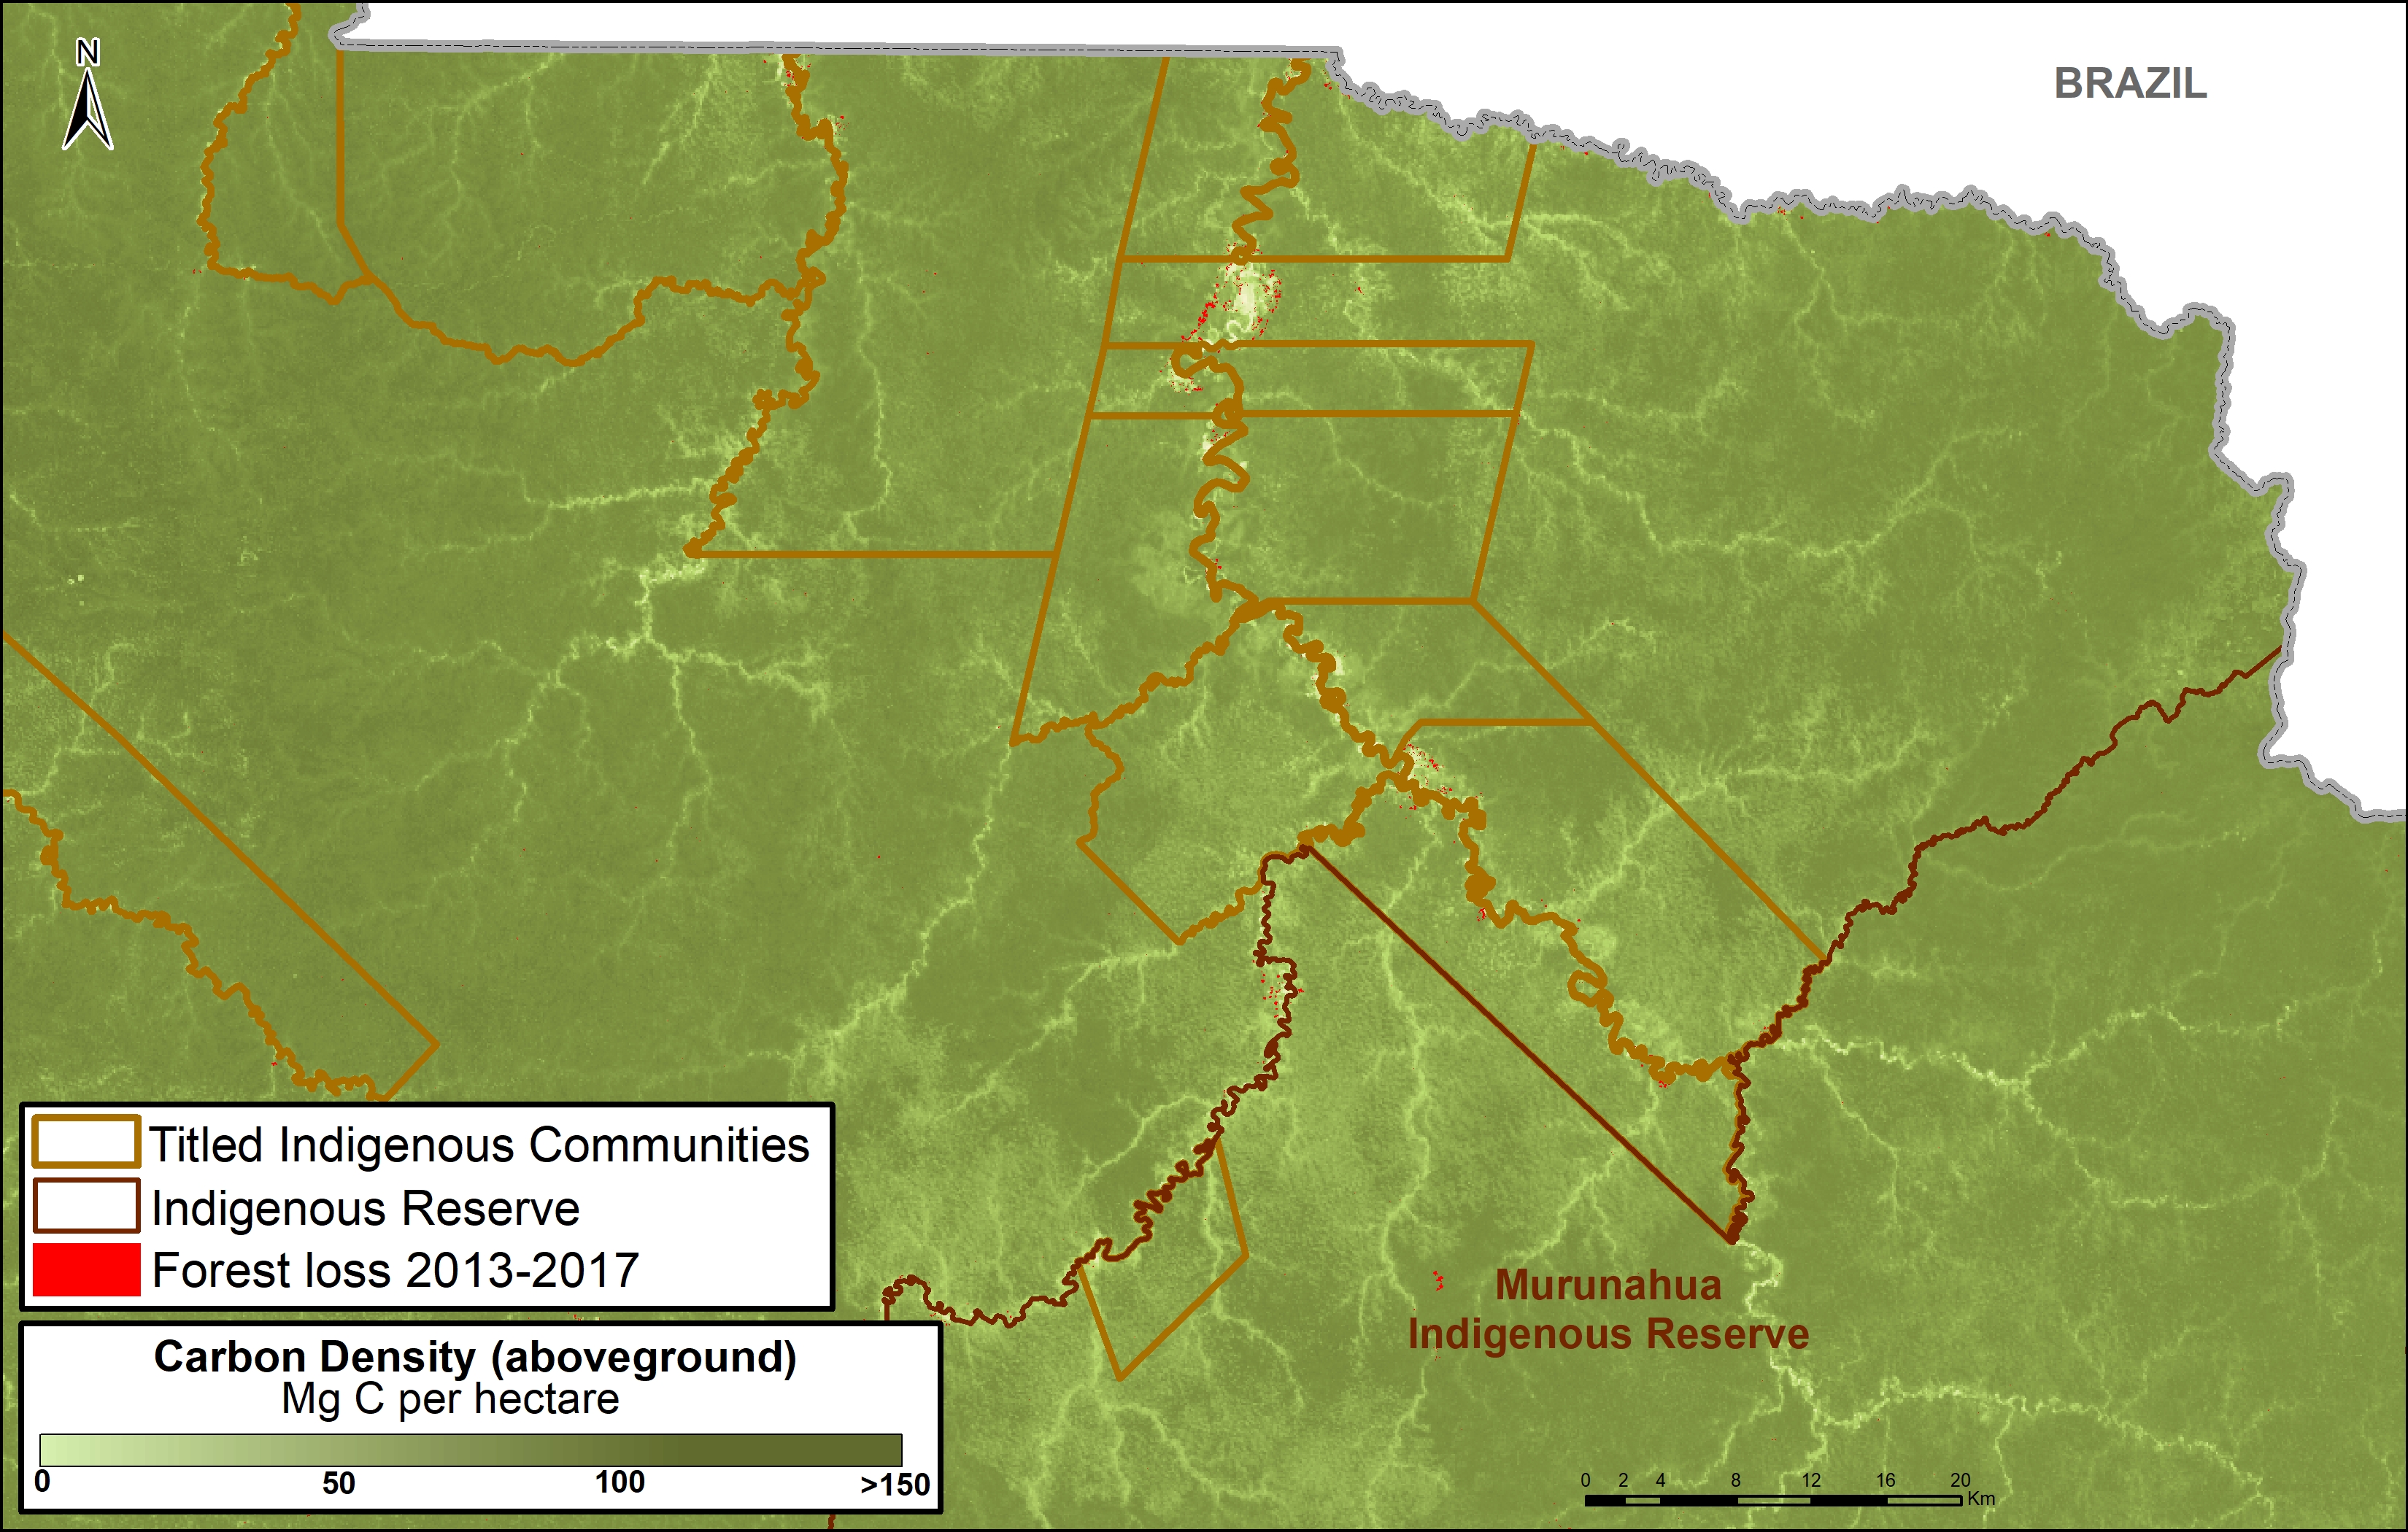
E. Murunahua Indigenous Reserve
The following Image E shows the carbon protected in the Murunahua Indigenous Reserve (for indigenous peoples in voluntary isolation) and the surrounding titled native communities.
References
1 UNFCCC. Emissions Summary for Peru. http://di.unfccc.int/ghg_profile_non_annex1
2 No incluye las emisiones por la degradación de bosques
3 Asner GP et al (2014). The High-Resolution Carbon Geography of Perú. Carnegie Institution for Science. ftp://dge.stanford.edu/pub/asner/carbonreport/CarnegiePeruCarbonReport-English.pdf
4 Sistema de Áreas Naturales Protegidas del Perú, que incluye áreas de administración nacional, regional, y privado. Datos de las tierras indígenas son de Instituto de Bien Común. Datos de pérdida forestal son de la Programa Nacional de Conservación de Bosques para la Mitigación del Cambio Climático (MINAM/PNCB).
5 UNFCCC. Emissions Summary for United States. http://di.unfccc.int/ghg_profile_annex1
Citation
Finer M, Mamani N (2017). Climate Change Defense: Amazon Protected Areas and Indigenous Lands. MAAP: 83.
Acknowledgments
This report was made possible by the generous support of the Norwegian Agency for Development Cooperation (NORAD).
![]()