Deforestation continues to increase in the land owned and operated by United Cacao near the town of Tamshiyacu in the northern Peruvian Amazon. Since 2013, we have documented the deforestation of 2,380 hectares (5,880 acres) related to this project, the vast majority at the expense of primary forest*. Of this total, 250 hectares were clear-cut after the Peruvian Ministry of Agriculture ordered the “paralyzation” of the company’s agricultural activities in December 2014**. Here in MAAP #27, we present evidence that indicates the deforestation related to this project will continue to expand in the coming months.
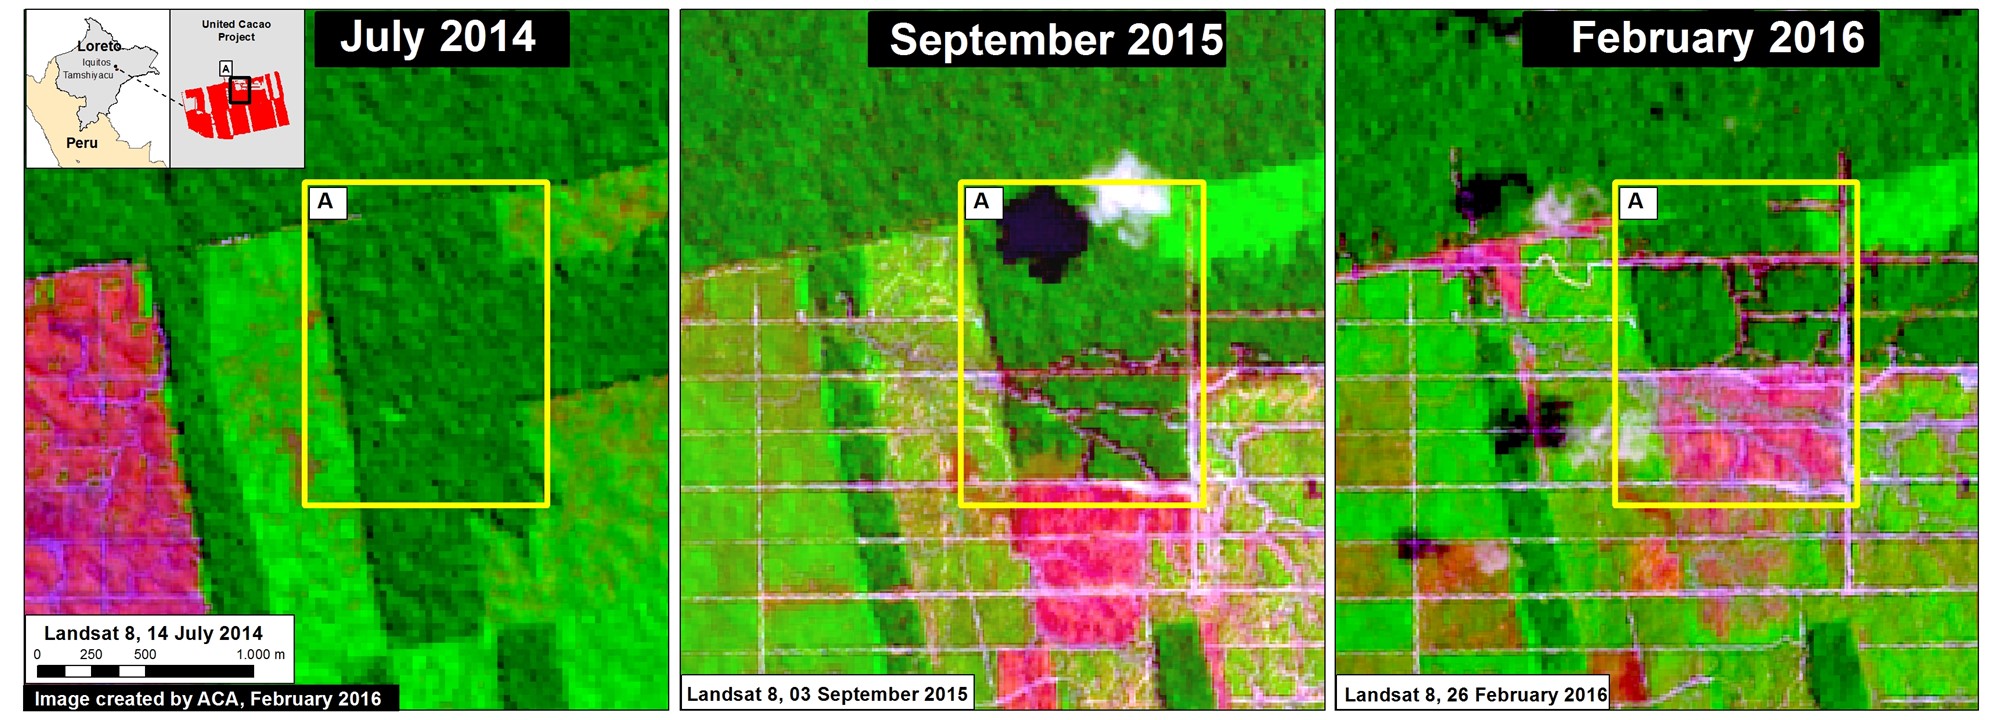
Image 27a shows a series of satellite images (Landsat) that shows the advance of deforestation in in the northern part of the United Cacao project. The left panel shows this area contained a remnant of primary forest (see dark green color in Inset A) in July 2014. The central panel shows that, by September 2015, a new access road network was constructed in the southern part of this area (see pink color, which indicates recently deforested areas). Finally, the right panel shows that in February 2016 (the most recent image), the southern part of that same area is now deforested, while a new access road network has been constructed to the north. Thus, if this pattern continues (access roads followed by large-scale deforestation), we predict that deforestation will soon occur in this northern area.
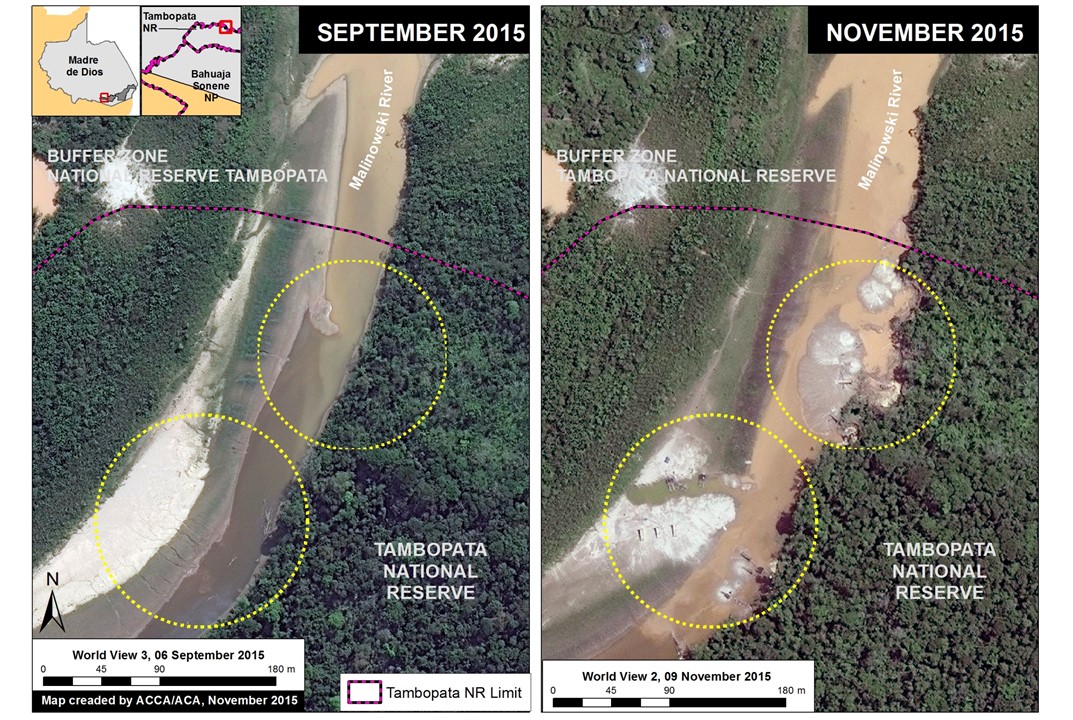
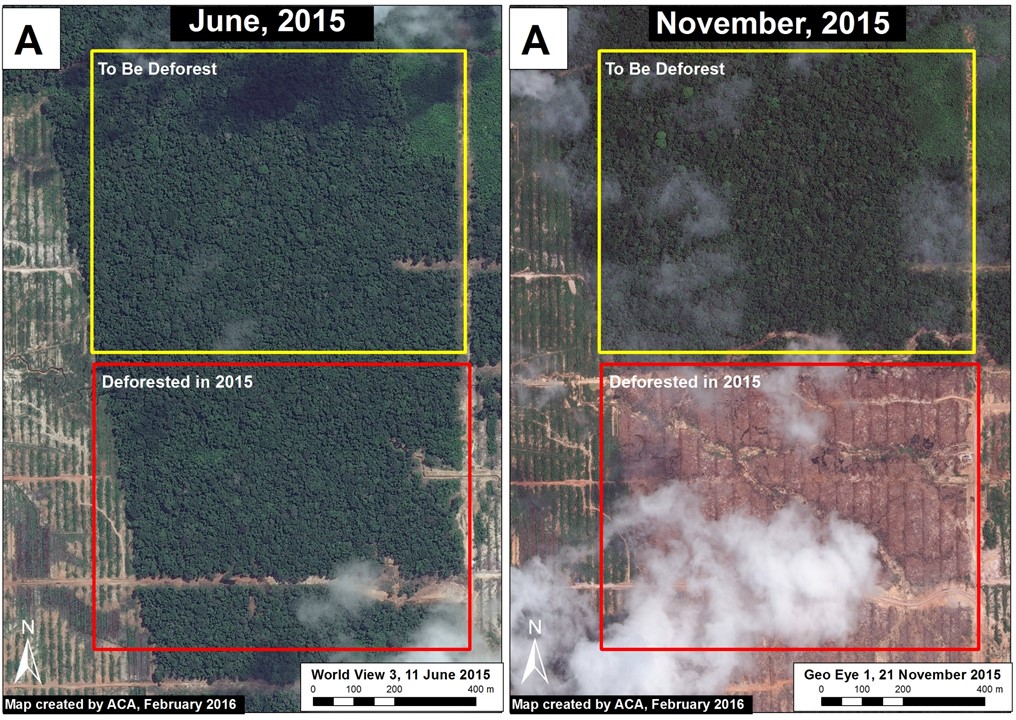
High-Resolution View
Image 27b shows, in high-resolution, the deforestation of primary forest between June (left panel) and November (right panel) of 2015 in the northern part of the United Cacao project described above (see red box in both images). The image also shows the area of primary forest that is now threatened with additional deforesation (see yellow box in both images).
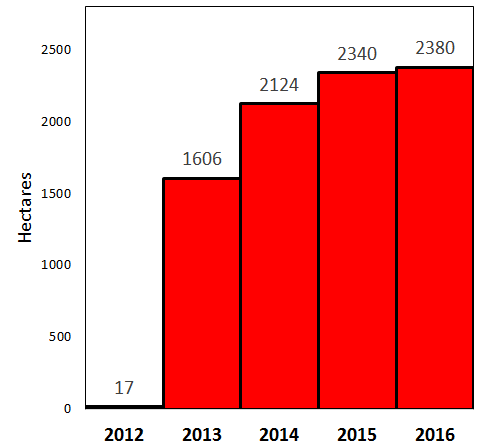
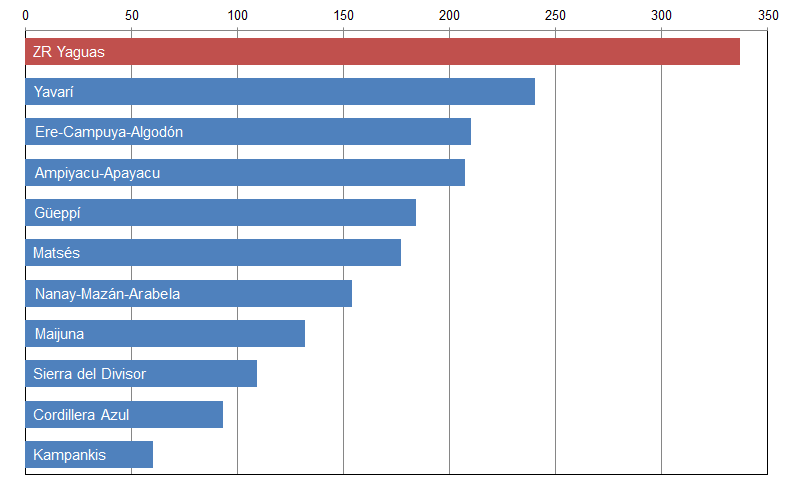
Deforestation Trend
The graph to the right shows the trend of accumulated deforestation in the United Cacao project area between 2012 and February 2016. The company began operations in early 2013, the same year as the large increase in deforestation. Also note that deforestation increased in 2015 despite the Ministry of Agriculture’s “paralyzation” order in late 2014.
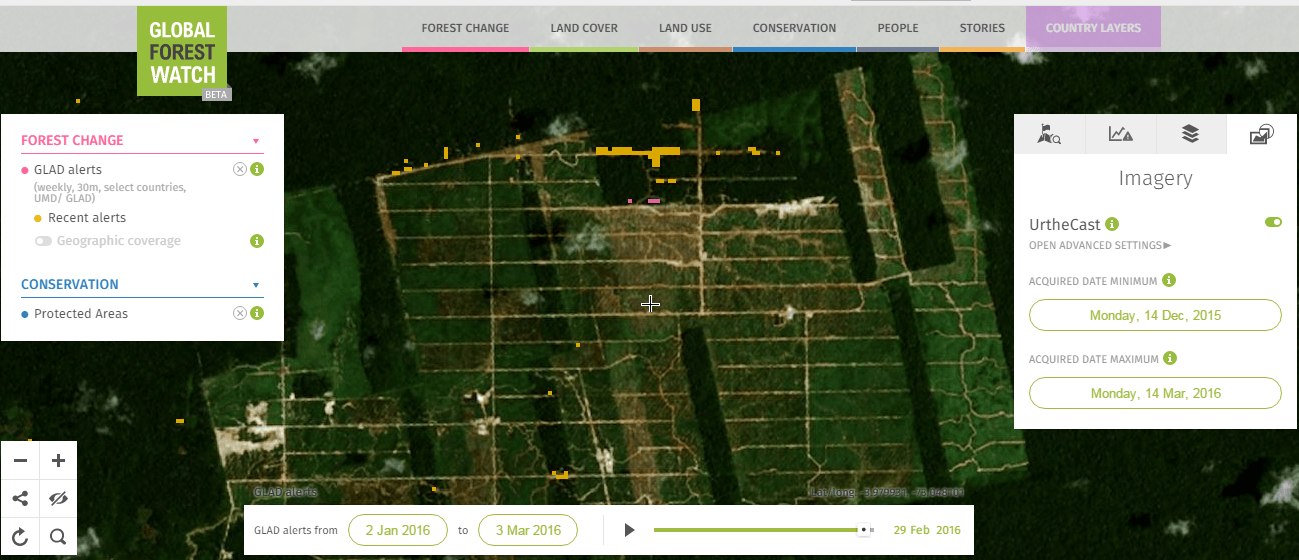
GLAD weekly alerts
It is worth emphasizing how quickly and precisely the new GLAD weekly alert system picked up the new access road construction in 2016 (see Image 27c). Also, click here to see this view on Global Forest Watch.
Notes
*According to the Supreme Decree (No. 018-2015-MINAGRI) approving the Regulations for Forest Management under the framework of the new 2011 Forestry Act (No. 29763), the official definition of primary forest in Peru is: “Forest with original vegetation characterized by an abundance of mature trees with species of superior or dominant canopy, which has evolved naturally.” Using methods of remote sensing, our interpretation of that definition are areas that from the earliest available image (in this case, from 1985) are characterized by dense closed-canopy coverage and experienced no major clearing events. See MAAP #9 and MAAP #2 for more details.
** Resolución de Dirección General N° 462-2014-MINAGRI-DVDIAR-DGAAA. A recent press release from the organization Environmental Investigation Agency reports that the order is still in effect (http://eia-global.org/blog/united-cacao-linked-companies-ordered-to-stop-operations-by-peruvian-author).
***Hansen, M.C., A. Krylov, A. Tyukavina, P.V. Potapov, S. Turubanova, B. Zutta, S. Ifo, B. Margono, F. Stolle, and R. Moore (2016) Humid tropical forest disturbance alerts using Landsat data. Environ. Res. Lett. 11: 034008. Accessed through Global Forest Watch: www.globalforestwatch.org
Citation
Finer M, Novoa S (2016) United Cacao Continues Deforestation of Primary Forest in Tamshiyacu (Loreto, Peru). MAAP: #27.