MAAP #208: Gold mining in the southern Peruvian Amazon, summary 2021-2024

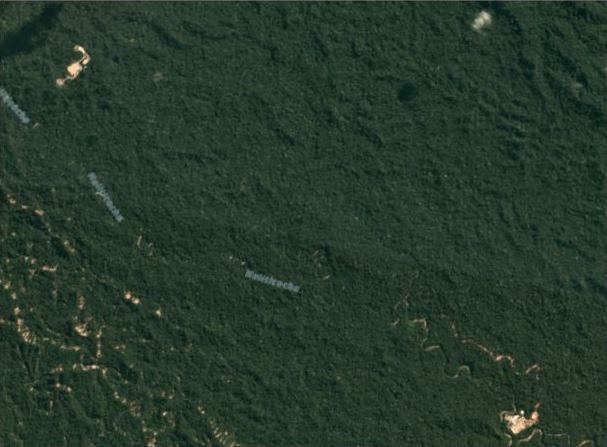
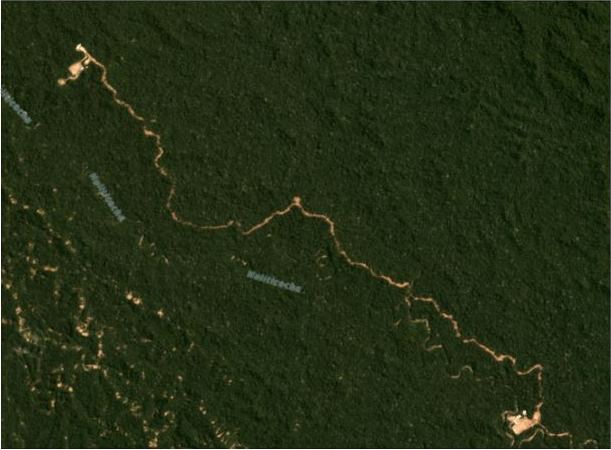
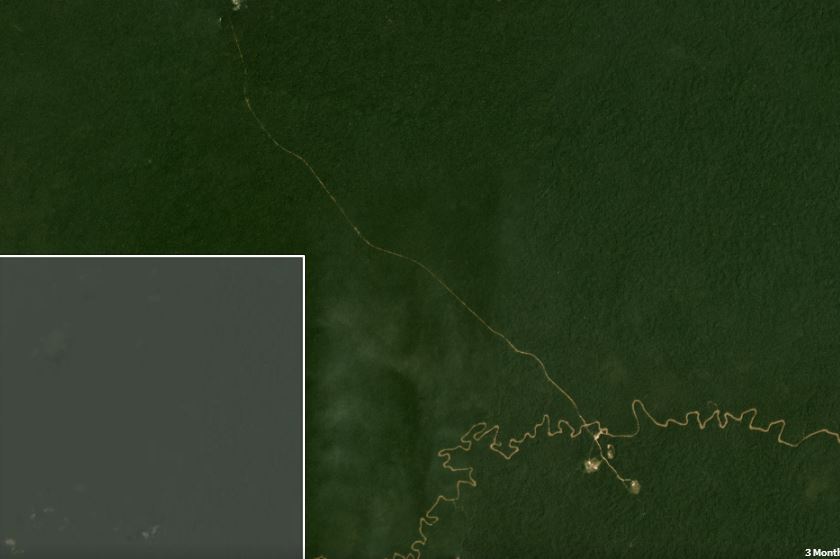
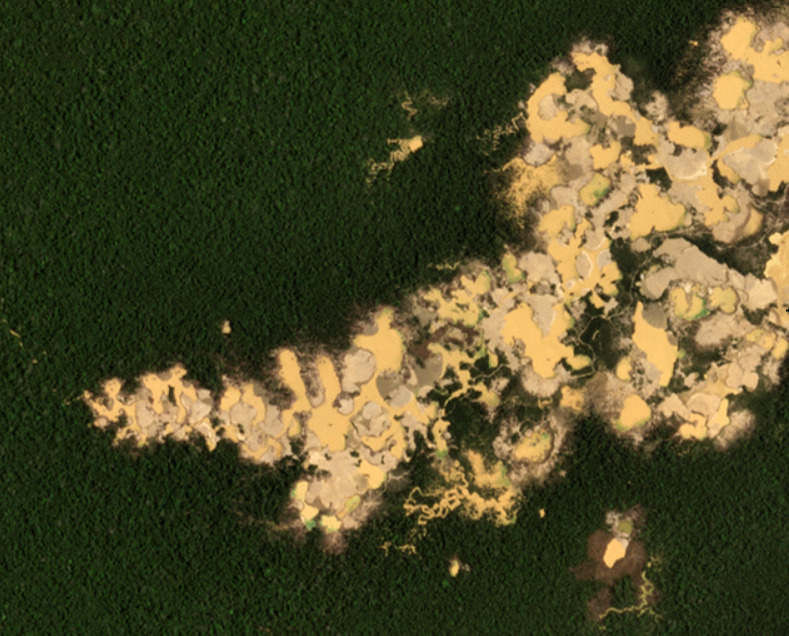
Figure 1. Recent expansion of illegal gold mining in the southern Peruvian Amazon. Data: Planet, NICFI

With the technical support of USAID (United States Agency for International Development) and Norad (Norwegian Agency for Development Cooperation),1 we have published a series of reports on the dynamic situation regarding gold mining in the southern Peruvian Amazon during recent years 2.

Illegal gold mining reached crisis levels between 2017 and 2018 in the area known as La Pampa (Madre de Dios region), eliminating thousands of hectares of primary forest in the buffer zone of the Tambopata National Reserve.

In early 2019, the Peruvian government implemented Operation Mercury, a multi-sectoral intervention against illegal mining, initially focusing on La Pampa. This operation was later replaced (in 2021) by the Restoration Plan, which included interventions in other critical mining areas of the Madre de Dios region in the southern Peruvian Amazon.

In this report, we offer a concise summary of the mining situation during the past three years (between January 2021 and March 2024) in the southern Peruvian Amazon, in the context of the Restoration Plan.

During this period, we recorded a total mining deforestation of 30,846 hectares (76,222 acres), equivalent to over 40,000 soccer fields.8

Of this total, three-quarters (74%) of the deforestation occurred within the official Mining Corridor, a large area (almost half a million hectares) where the government permits artisanal and small-scale mining to organize and promote this activity3. In other words, the vast majority of mining deforestation is not necessarily illegal, because it is in the corridor designated for this activity.

The remaining one-quarter (26%) of the deforestation corresponds to probable illegal mining. That is, mining activities carried out in prohibited areas outside the Mining Corridor, such as protected areas, their buffer zones, territories of Native Communities, and bodies of water.4

Base Map: Mining deforestation in the southern Peruvian Amazon

We highlight several important findings illustrated in the Base Map and Table 1, both presented below. In both cases, we highlight recent mining deforestation (between January 2021 and March 2024). Red indicates deforested areas outside of the Mining Corridor (representing our estimate of illegal mining), while yellow indicates recently deforested areas within the Mining Corridor.
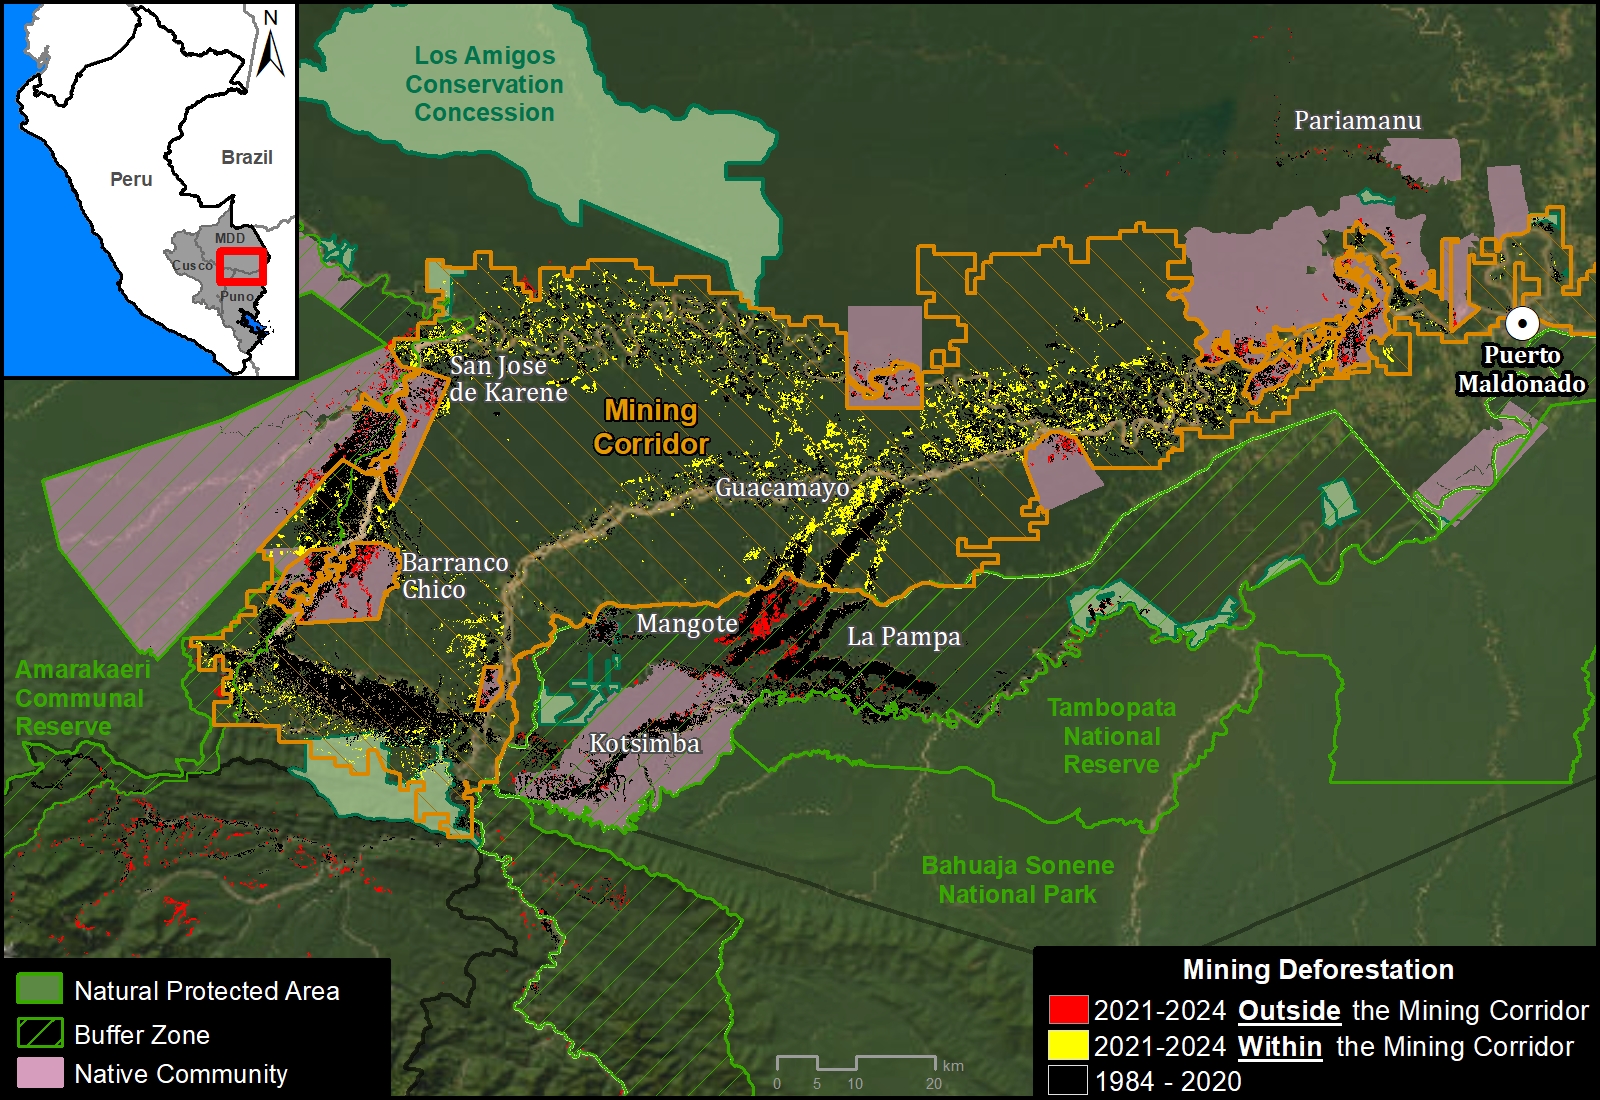
Base Map. Mining deforestation inside and outside the Madre de Dios Mining Corridor, in the southern Peruvian Amazon, between January 2021 and March 2024. Data: ACCA/MAAP.

We found that mining deforestation is concentrated within the Mining Corridor, representing 73.8% of the total (22,756 hectares). This is especially evident in the Guacamayo mining area and along the Madre Dios River.

The rest of the mining deforestation (26.2%) is outside the Mining Corridor. The majority of this deforestation (14.6%) is occurring in the 10 Native Communities of the area, covering a total of 4,494 hectares. The most affected communities are San José de Karene (1,099 ha), Barranco Chico (1,008 ha) and Tres Islas (827 ha), followed by Puerto Luz (305 ha), Boca Inambari (305 ha), Kotsimba (297 ha), San Jacinto (269 ha), Shiringayoc (267 ha), Arazaire (78 ha) and El Pilar (40 ha). However, there are different trends. For example, mining deforestation between 2021 and 2024 has decreased in Barranco Chico, while it has increased in San José de Karene, Tres Islas and Boca Inambari.

We also identified mining deforestation of 2,439 hectares (7.9%) in buffer zones of Protected Areas. The most affected are Tambopata National Reserve (such as the Mangote area, see Figure 1), Bahuaja Sonene National Park, and Amarakaeri Communal Reserve. However, it must be emphasized that mining within the actual Protected Areas has been effectively controlled by the Peruvian government, through the National Service of Protected Natural Areas (SERNANP).

In addition, we detected some mining deforestation (198 hectares) in Brazil nut forestry concessions located in the Pariamanu area.

Finally, it is important to mention that in the critical area known as La Pampa (noted above), the expansion of mining deforestation has been effectively stopped after Operation Mercury. A recent report (MAAP #193), however, showed a large increase in mining activity in previously deforested areas of La Pampa.
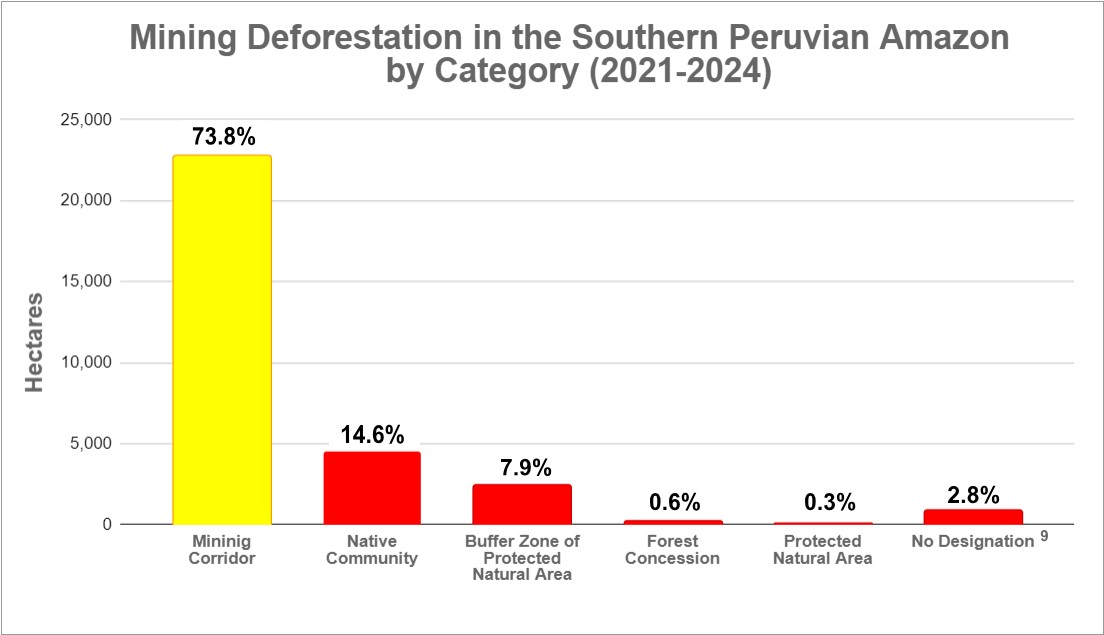
Table 1. Mining deforestation by category in the southern Peruvian Amazon, between January 2021 and March 2024. Data: ACA/MAAP.

Monitoring & Control of Native Communities by FENAMAD

As noted above, a large portion of the illegal mining deforestation in the southern Peruvian Amazon is occurring within the territory of the Native Communities. These Native Communities are part of an articulated federation known as FENAMAD, which is the regional representative organization of the indigenous peoples of the Madre de Dios River basin. FENAMAD defends the fundamental and collective rights of indigenous peoples and native communities, including indigenous peoples in situations of isolation and initial contact.

1. First, FENAMAD identifies priority communities threatened by illegal mining and requiring urgent monitoring.

2. Subsequently, Amazon Conservation leads real-time satellite monitoring in these prioritized communities and delivers confidential reports to FENAMAD.

3. FENAMAD then reviews the reports together with the territory monitors and the results are shared with the affected native communities who decide whether these cases require a legal process.

4. FENAMAD formulates the Environmental Legal Complaint files and delivers them to the corresponding government institutions (Prosecutor’s Office Specialized in Environmental Matters of Madre de Dios –FEMA, National Police of Peru –PNP, Ecological Police of Peru, among others).

5. Finally, in selected cases, the government organizes and directs an on-the-ground operation against illegal mining activity and associated equipment.

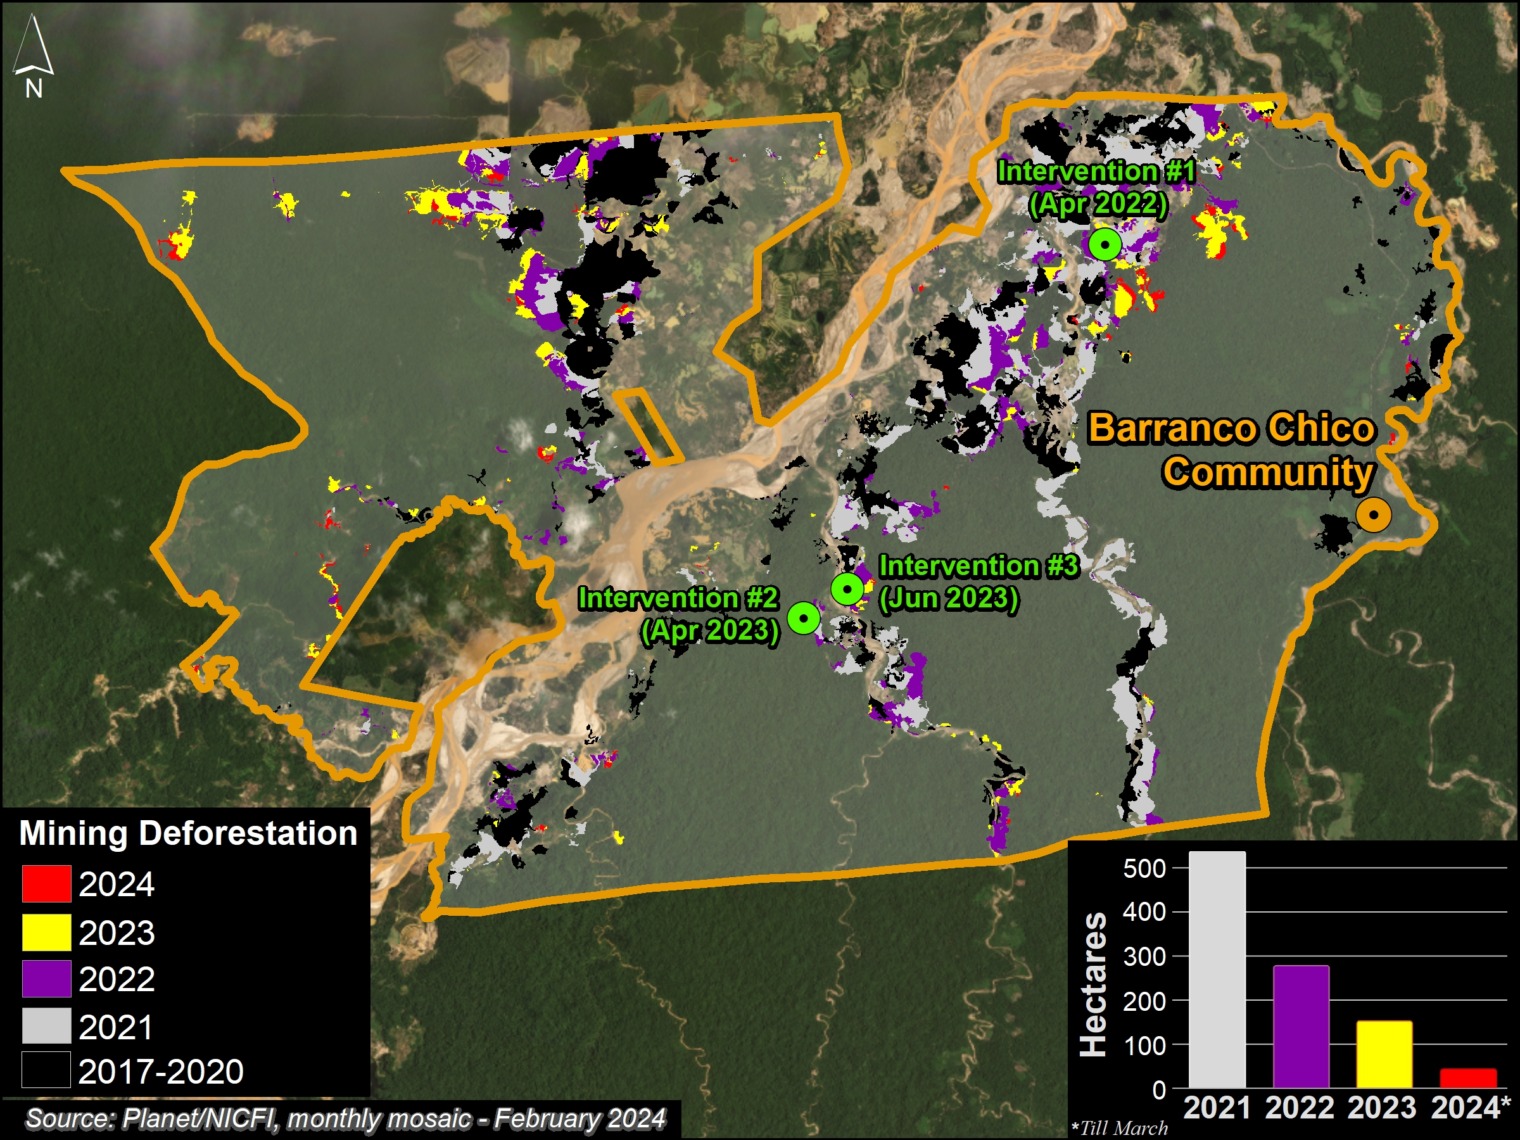
This process has led to the execution of 5 government-led operations between 2022 and 2024, in three communities: Barranco Chico, Kotsimba and San José de Karene (see Base Map).

Of these operations, 3 took place in the community of Barranco Chico,5 which has been especially affected by illegal mining deforestation (967 hectares in the last three years). Figure 2 indicates the location of these operations. It should be noted that mining deforestation in Barranco Chico has decreased between 2021 and 2024, likely due to these types of interventions.

Figure 2. Location of operations against illegal mining in the Barranco Chico Native Community.

The other operations occurred in the communities of Kotsimba6 and San José de Karene7.

It is worth noting that this collaboration between FENAMAD and Amazon Conservation, which is supported by the Norwegian Agency for Development Cooperation (NORAD), is currently expanding to additional native communities within the impacted region.

Notes

1 USAID Prevent works with the Government of Peru, civil society and the private sector to prevent and combat environmental crimes for the conservation of the Peruvian Amazon, particularly in the regions of Loreto, Madre de Dios and Ucayali. USAID’s Prevent Project also has support from the Norwegian Agency for Development Cooperation (NORAD).

2 Previous MAAP reports about gold mining in the southern Peruvian Amazon:

MAAP #195: GOLD MINING DEFORESTATION IN THE SOUTHERN PERUVIAN AMAZON, 2021-2023
https://www.maapprogram.org/2023/mining-deforest-peru
November 2023

MAAP #185: GOLD MINING DEFORESTATION IN THE SOUTHERN PERUVIAN AMAZON: 2021-2022 UPDATE
https://www.maapprogram.org/2023/peru-gold-mining-update/
June 2023

MAAP #171: DEFORESTATION IN MINING CORRIDOR OF PERUVIAN AMAZON (2021-2022)
https://www.maapprogram.org/2022/mining-corridor-peru/
December 2022

MAAP #154: ILLEGAL GOLD MINING IN THE PERUVIAN AMAZON – 2022 UPDATE
https://www.maapprogram.org/2022/gold-mining-peru-update/
May 2022

3 The Mining Corridor, named by Legislative Decree No. 1100, as the “Zone of small mining and artisanal mining in the department of Madre Dios”, catalogs mining activities as:

– Formal: It is carried out with authorization for exploration and exploitation in a specific area, with conditions and operations regulated by the legal framework of the mining sector. It has approved environmental, administrative and operational permits.

– Informal: Artisanal and small-scale mining operates in permitted areas for mineral extraction and uses permitted machinery. Although it does not have authorization to carry out mining activity, it is in the formalization process in accordance with the provisions of Legislative Decree No. 1105, which establishes provisions for the formalization process of small-scale mining and artisanal mining activities. Therefore, it is considered an administrative infraction, but not a crime.

– Illegal: Exploration, extraction and exploitation of mineral resources in prohibited areas (such as Protected Areas and bodies of water) and using prohibited machinery, failing to comply with administrative, technical and environmental requirements established in Peruvian legislation. This is a crime stipulated in article 207-A of the Penal Code, which carries a custodial sentence.

4 Although keep in mind that there may be mining concessions within the Native Community territories.

5 FEMA operations in the Barranco Chico community occurred in April 2022 (América Televisión video), April 2023 (El Comercio) and June 2023. There was an initial operation before the project in 2021.

6 FEMA operation in the Kotsimba community occurred in October 2023.

7 FEMA operation in the community of San José de Karene occurred in April 2024.

8 Of this total (30,846 hectares), 28,292 hectares occurred during 2021-2023, while 2,554 hectares occurred in the first quarter of 2024.

9 Undesignated refers to areas without a formal designation and not included in any of the other categories.

Methodology

We used LandTrendR, a temporal segmentation algorithm that identifies changes in pixel values over time, to detect forest loss within the mining corridor between January 2021 and March 2024 using the Google Earth Engine platform. Importantly, this method was originally designed for moderate resolution Landsat imagery (30 meters)1, but we adapted it for higher spatial resolution (4.7 meters) NICFI-Planet monthly mosaics.2

In addition, we created a baseline for the period 2016 – 2020 to eliminate previously deforested areas (pre 2021), to account for rapid changes in the natural revegetation process.

Finally, we manually separated forest loss from mining vs other causes, to report specifically on direct mining-related impacts between 2021 and 2024. We used several resources to help this manual process, such as alerts with radar images (RAMI) from the SERVIR Amazonía program, historical data from the Amazon Scientific Innovation Center – CINCIA (from 1985 to 2021), and forest loss data from the Peruvian state (National Forest Conservation Program for Climate Change Mitigation) and the University of Maryland.

  1. Kennedy, R.E., Yang, Z., Gorelick, N., Braaten, J., Cavalcante, L., Cohen, W.B., Healey, S. (2018). Implementation of the LandTrendr Algorithm on Google Earth Engine. Remote Sensing. 10, 691.
  2. Erik Lindquist, FAO, 2021

Acknowledgments

We especially thank FENAMAD for this important strategic collaboration.

This report was prepared with the technical support of USAID through the Prevent Project. Prevent (Proyecto Prevenir in Spanish) works with the Government of Peru, civil society, and the private sector to prevent and combat environmental crimes for the conservation of the Peruvian Amazon, particularly in the regions of Loreto, Madre de Dios, and Ucayali. USAID’s Prevent Project also has support from the Norwegian Agency for Development Cooperation (NORAD).

This publication is made possible by the generous support of the American people through USAID. The contents are the sole responsibility of the authors and do not necessarily reflect the views of USAID or the United States Government.

Citation

Finer M, Mamani N (2024) Gold mining in the southern Peruvian Amazon, summary 2021-2024. MAAP: 208.

 

MAAP #211: Illegal roads and Deforestation in Indigenous Reserves & National Parks of the Colombian Amazon

Illegal roads are a major threat to the Colombian Amazon, often opening remote primary forests to the main drivers of deforestation: cattle pastures, land grabbing and coca production.

Base Map. Illegal roads causing recent deforestation. Data: MAAP/ACA, FCDS.

These illegal roads threaten protected areas (including national parks) and indigenous territories (known as Resguardos in Colombia).

In 2024, in collaboration with our Colombian partner FCDS, we have documented these impacts in two important areas in the heart of the Colombian Amazon: the Llanos del Yari-Yaguara II Indigenous Reserve and the adjacent Chiribiquete National Park (see Base Map).

Most notably, in the Llanos del Yari-Yaguara II Indigenous Reserve, we see the construction of a new road, causing massive deforestation of primary forests, both within and adjacent to the territory (856 hectares, or 2,115 acres, in total).

In Chiribiquete National Park, we see the expansion of deforestation of 64 hectares (158 acres) along an illegal road penetrating the northwest sector of this important protected area.

Below, we show satellite images for both cases.

Llanos del Yari- Yaguara II Indigenous Reserve

Since March 2023, a new 14-kilometer illegal road has been built in this area, of which 5.3 km is within the northeastern sector of the Llanos del Yari- Yaguara II Indigenous Reserve, located in the department of Guaviare. Figures 1 and 2 show that this construction has caused massive deforestation: 856 hectares (2,115 acres), of which 394 hectares are within the Reserve, between February 2023 (left panel) and March 2024 (right panel). This deforestation is presumably for new cattle pasture, facilitated by the new road. Note that Figure 1 shows the satellite images without markings, while Figure 2 adds markings for the illegal road construction and associated deforestation.

Figure 1. Deforestation along the new illegal road in the Llanos del Yari- Yaguara II Indigenous Reserve, without markings. Data: Planet, NICFI.
Figure 2. Deforestation along the new illegal road in the Llanos del Yari- Yaguara II Indigenous Reserve, with markings. Data: Planet, NICFI.

Chiribiquete National Park

In the adjacent northwest sector of Chiribiquete National Park, deforestation continues to expand along an existing illegal road, known as the Tunia-Ajaju road, located in the department of Caquetá. Figures 3-6 show the deforestation of 64 hectares (56 hectares in zone B and 8 hectares in zone C) along this road inside the national park, between March 2023 (left panel) and March 2024 (panel right). This deforestation is presumably for new cattle pastures, facilitated by the road. Note that Figures 3 and 5 show the satellite images without markings, while Figures 4 and 6 add markings for the illegal road construction and associated deforestation.

Figure 3. Deforestation along the new illegal road in Chiribiquete National Park (zone B), without markings. Data: Planet, NICFI.
Figure 4. Deforestation along the new illegal road in Chiribiquete National Park (zone B), with markings. Data: Planet, NICFI.
Figure 5. Deforestation along the new illegal road in Chiribiquete National Park (zone C), without markings. Data: Planet, NICFI.
Figure 6. Deforestation along the new illegal road in Chiribiquete National Park (zone C), with markings. Data: Planet, NICFI.

Citation

Finer M, Ariñez A (2024) Illegal roads and Deforestation in Indigenous Reserves & National Parks of the Colombian Amazon. MAAP: 211.


MAAP #200: State of the Amazon in 2023

The first MAAP report, published in March 2015, took a detailed look at the escalating gold mining deforestation in the Peruvian Amazon.

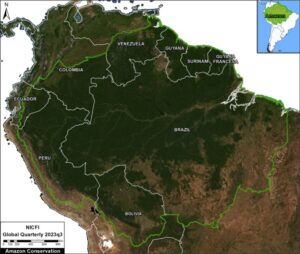
Figure 1. Most recent cloud-free view of the entire Amazon biome (2023, quarter 3). Data: Planet, NICFI, ACA/MAAP.

The following 198 reports, over the past 8.5 years, continued to examine the most urgent deforestation-related issues across the Amazon.

For our 200th report, we provide our rapid assessment of the current state of the Amazon.

Overall, the situation is dire, with the Amazon nearing two critical deforestation-induced tipping points. The first is the widely feared conversion of moist rainforests to drier savannahs, due to decreased moisture recycling across the Amazon (see MAAP #164). The second is the more newly feared conversion of the Amazon as a critical carbon sink buffering global climate change, to a carbon source fueling it (see MAAP #144).

There is cause for hope, however. It is possible in the long term to protect the core Amazon, as nearly half is now designated as protected areas and indigenous territories, both of which have much lower deforestation rates than surrounding areas (see MAAP #183). Also, new NASA data reveals the Amazon is still home to abundant carbon reserves in these core areas (see MAAP #160 and MAAP #199).

Also on the positive news front, we recently reported a major reduction (over one-half) in primary forest loss between the current year 2023 and last year 2022 across the Amazon, especially in Brazil and Colombia (MAAP #201).

Much is made about Amazon fires in the media, but over the past several years we have revealed that the vast majority of major fires across the Amazon (namely, in Brazil, Bolivia, Peru, and Colombia) are actually burning recently deforested areas (MAAP #168). It is only during intense dry seasons that some of these fires escape and become actual forest fires.

Figure 1 shows the most recent cloud-free view of the entire Amazon biome. On the positive, one can clearly see the core Amazon still stands. On the negative, however, the expanding deforestation around the edges is evident.


Major Deforestation Fronts – 2023

In this section, we review the current major deforestation fronts across the Amazon.

Figure 2 indicates these fronts (insets A-H) in relation to deforestation hotspot data over the past 8 years during MAAP’s active monitoring timeframe (2015-2022). Below we describe each deforestation area, by country. Common drivers across numerous Amazon countries include roads (MAAP #157), agriculture (MAAP #161), cattle, and gold mining (MAAP #178).

Also note that further below, in the Annex, we show the relative order of total Amazon primary forest loss by country over the past two years: Brazil by far the highest, followed by a middle pack of Bolivia, Peru, and Colombia, followed by lower levels in Venezuela, Ecuador, Suriname, Guyana, and French Guiana.

Figure 2. Amazon forest loss hotspots, 2015-2022. Data: UMD, Planet/NICFI, ACA/MAAP.


Brazilian Amazon

Figure 3. Major forest loss hotspots in the Brazilian Amazon. Data: UMD, Planet/NICFI, ACA/MAAP.

Brazil continues to be, by far, the leading source of Amazonian deforestation (MAAP #187), led by three major drivers: cattle pasture expansion near roads, soy plantations, and gold mining.

Deforestation for new cattle pasture is concentrated along the extensive road networks spanning the eastern and southern Brazilian Amazon (for example, Inset A).

Deforestation for expanding soy plantations is concentrated in the southeast Brazilian Amazon (Inset B; see MAAP #161).

Gold mining deforestation impacts numerous sites, including several indigenous territories (for example, Inset C; see MAAP #178).

Bolivian Amazon

Figure 4. Major forest loss hotspots in the Bolivian Amazon. Data: UMD, Planet/NICFI, ACA/MAAP.

Bolivia has emerged as the clear second-leading source of Amazonian deforestation, with a major increasing trend over the past two years (MAAP #187).

The deforestation is concentrated in the soy frontier located in the southeast (Inset D, see MAAP #179).

Note that, increasingly, this soy deforestation is carried out by Mennonite colonies (MAAP #180). We revealed that Mennonites caused the deforestation of over 210,000 hectares since 2001, including 33,000 hectares since 2017.

Peruvian Amazon

Figure 5. Major forest loss hotspots in the Peruvian Amazon. Data: UMD, Planet/NICFI, ACA/MAAP.

Peru is the third-leading source of Amazonian deforestation (MAAP #187).

In the central Amazon, we have been highlighting the rapid deforestation for new Mennonite colonies (see MAAP #188). MAAP reports revealed, in real-time, Mennonite deforestation growing from zero in 2016, to 3,400 hectares in 2021, to 4,800 hectares in 2022, to 7,032 hectares in 2023.

In the southern Amazon, gold mining deforestation continues to be a major cause of deforestation, primarily in indigenous communities, protected area buffer zones, and within the official Mining Corridor (MAAP #185). Most recently, we showed that gold mining has caused the deforestation on nearly 24,000 hectares between just 2021 and 2023 (MAAP #195).

Colombian Amazon

Figure 6. Major forest loss hotspots in the Colombian Amazon. Data: UMD, Planet/NICFI, ACA/MAAP.

Colombia is the fourth-leading source of Amazonian deforestation.

Deforestation in Colombia spiked following the 2016 peace agreement between the Colombian government and the FARC guerilla group (MAAP #120), but was the only country with a notable deforestation decrease in 2022 (MAAP #187).

Forest loss is concentrated in an “arc of deforestation” surrounding numerous Protected Areas (such as Chiribiquete, Tinigua, and Macarena National Parks) and Indigenous Reserves.

In Colombia, the major direct deforestation driver is cattle pasture, but this expansion is largely caused by land grabbing as a critical indirect driver. Coca plantations also continue to be an important direct driver in certain remote areas.

Both cattle and coca are impacting protected areas, especially Tinigua and Chiribiquete National Parks (cattle); and Macrarena National Park and Nukak National Nature Reserve (coca).

Ecuadorian Amazon

Figure 7. Major forest loss hotspots in the Ecuadorian Amazon. Data: UMD, Planet/NICFI, ACA/MAAP, RAISG.

Although accounting for just 1% of total loss across the Amazon, deforestation in the Ecuadorian Amazon was the highest on record in 2022 (18,902 hectares), up a striking 80% since 2021.

There are several deforestation hotspots caused by gold mining (see MAAP #182), oil palm plantation expansion, and small-scale agriculture.

Venezuelan Amazon

There is a deforestation hotspot caused by gold mining in Yapacana National Park (see MAAP #173MAAP #156MAAP #169).

Annex: Amazon Primary Forest Loss (By Country), 2021-2022

Acknowledgments

We deeply thank the following funders for supporting MAAP over the past 10 years:
International Conservation Fund of Canada (ICFC)
Norwegian Agency for Development Cooperation (NORAD)
United States Agency for International Development (USAID)
MacArthur Foundation
Andes Amazon Fund (AAF)
Wyss Foundation
Erol Foundation
Global Forest Watch/World Resources Institute
Overbrook Foundation
Global Conservation

We also thank our key data providers:
Planet (optical satellite imagery)
University of Maryland (automated forest loss alerts)
Global Forest Watch (portal featuring integrated forest loss alerts)
NICFI monthly mosaics
CLASlite (our original forest loss detection tool)

Citation

Finer M, Mamani N, Novoa S, Ariñez A (2023) State of the Amazon in 2023. MAAP: 200.

MAAP #201: Amazon Deforestation Carbon Update for 2023

Graph 1. Major decrease in primary forest loss in 2023 compared to both last year 2022 and the recent peak year 2020, across the entire Amazon biome. Data: ESA/S2, GFW, ACA/MAAP.

As national policymakers begin the global COP28 climate summit in Dubai, we provide here a concise update on the current state of  Amazon forest loss and remaining carbon reserves, both based on the latest cutting-edge data.

For Amazon forest loss, we analyze the primary forest loss alerts known as GLAD-S2, which are based on 10-meter resolution optical imagery from the European Space Agency’s Sentinel-2 satellite1. These advanced alerts have been available from 2019 to present.

For Amazon carbon reserves, we analyze the newly updated version of NASA’s GEDI data2, which used lasers aboard the International Space Station to provide recent estimates of aboveground biomass density on a global scale. This data has a 1-kilometer resolution and covers the time period of April 2019 – March 2023.

In summary, we report two key findings:

  • A dramatic reduction (over one-half) in primary forest loss between the current year 2023 and last year 2022 across the Amazon. The biggest declines were documented in the Brazilian and Colombian Amazon (59% and 67%, respectively).
  • Over 78 billion metric tons of aboveground biomass across the Amazon biome, which converts to over 37 billion metric tons of carbon. The highest carbon densities are located in the northeast (Suriname, French Guiana, and northeast Brazil) and southwest (southern Peru) sections of the Amazon.

Amazon Forest Loss

We estimate that forest loss dropped by 55.8% between 2023 (911,740 hectares) and 2022 (2,062,939 hectares). The loss is even more striking (dropping by over two-thirds, 67.7%) when compared to 2020 (2,823,475 hectares). It is important to emphasize that these are all directly relevant comparisons, covering the same time frame of January to early November for each year.

Graph 1 (see above) illustrates this major decrease in primary forest loss in 2023 compared to both last year 2022 and the recent peak year 2020, across the entire Amazon biome.

Graphs 2 and 3 (see below) break down these results for the Brazilian Amazon and western Amazon (Bolivia, Peru, and Colombia), respectively. Note the especially large forest loss declines in Brazil (59%) and Colombia (67%). We did document an increase in primary forest loss in three countries of the northeast Amazon (Suriname, Guyana, and Venezuela) during 2023, but this seems to be mostly due to natural causes.

Graph 2. Major decrease in primary forest loss in 2023 compared to both last year 2022 and the recent peak year 2020, in the Brazilian Amazon. Data: ESA/S2, GFW, ACA/MAAP.
Graph 3. Major decrease in primary forest loss in 2023 compared to both last year 2022 and the recent peak year 2020, in the western Amazon (Bolivia, Peru, Colombia). Data: ESA/S2, GFW, ACA/MAAP.

Although primary forest loss is way down across the Amazon in  2023, we did document the clearing of nearly a million hectares (911,740 ha). Figure 1 shows the distribution of this loss. Note the concentrations in the following sections of the Amazon: eastern and southern Brazil, across Bolivia, central and southern Peru, northwest Colombia. Hotspots in the northeast Amazon (Suriname, Guyana, and Venezuela) are mostly due to natural causes.

Figure 1. Primary forest loss across the Amazon in 2023. Data: ESA/S2, GFW, ACA/MAAP, NICFI.


Amazon Carbon Reserves

Figure 2 displays aboveground biomass across the Amazon biome. Note the highest carbon densities (indicated in bright yellow) are located in the northeast Amazon (Suriname, French Guiana, and the northeast corner of Brazil) and southwest Amazon (southern Peru). Also note that many parts of Ecuador, Colombia, Venezuela, Guyana, Bolivia, Brazil and northern Peru have high carbon densities as well.

As first reported in MAAP #199, we calculated over 78 billion metric tons of aboveground biomass across the Amazon biome (78,184,161,090 metric tons). Using a general assumption that 48% of this biomass is carbon3, we estimate over 37 billion metric tons of carbon across the Amazon (37,528,397,323 metric tons).

Note that these totals are likely underestimates given that the laser-based data has not yet achieved full coverage across the Amazon (that is, there are many areas where the lasers have not yet recorded data, leaving visible blanks in the maps above).

Figure 2. Aboveground biomass density (carbon estimate) across the Amazon biome, with country boundaries. Data: NASA/GEDI, NICFI.

Notes

1Information for GLAD-S2 alerts obtained from Global Forest Watch. Alerts are within a primary forest mask, where previous forest loss was removed Pickens et al 2020). These alerts are operating in the primary humid tropical forest areas of South America from January 2019 to the present. We present data covering the time frame of January 1 – November 8 for each year, so all noted annual comparisons are appropriate. Based on our analysis of final annual forest loss data for the years 2021 and 2022, we determined that using both High and Medium confidence alerts were the most accurate and conservative predictor of ultimate outcome (that is, not including Low confidence alerts).

Citation:

Pickens, A.H., Hansen, M.C., Adusei, B., and Potapov P. 2020. Sentinel-2 Forest Loss Alert. Global Land Analysis and Discovery (GLAD), University of Maryland.

2GEDI L4B Gridded Aboveground Biomass Density, Version 2.1.
https://daac.ornl.gov/cgi-bin/dsviewer.pl?ds_id=2299

3Domke et al (2022) How Much Carbon is in Tree Biomass?. USDA/Forest Service.
https://www.fs.usda.gov/research/nrs/news/highlights/how-much-carbon-tree-biomass#summary

Acknowledgements

This work was supported by NORAD (Norwegian Agency for Development Cooperation) and ICFC (International Conservation Fund of Canada).

Citation

Finer M, Ariñez A, Mamani N (2023) Amazon Deforestation & Carbon Update for 2023. MAAP: 201.

Acknowledgments

This report was made possible by the generous support of the Norwegian Agency for Development Cooperation (NORAD).

MAAP #195: Gold Mining Deforestation in the Southern Peruvian Amazon, 2021-2023

In the context of overall Amazon gold mining, where illegal mining is rampant, southern Peru is an important case study given that the government has created the “Mining Corridor“, where mining is allowed in order to organize and promote this activity.

maaproject.org-maap-195-deforestacion-minera-en-2023-en-la-amazonia-peruana-sur-Panel-A-CorredorMinero2023-Intro-640x580
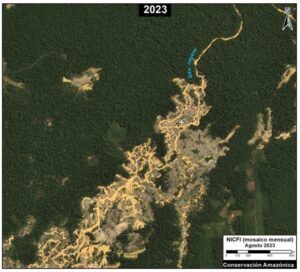
Figure 1. Recent deforestation in the Mining Corridor of the Madre de Dios region in the southern Peruvian Amazon (Guacamayo zone). Data: Planet.

In this large area, officially known as the “Zone of small-scale and artisanal mining in the department of Madre Dios,” mining activity can be formal, informal, or illegal, depending on the location and legal compliance (see more details in the Notes section).

Knowing the level of mining deforestation that occurs within its limits is important because, although it may not be illegal, it can be considerable given that the Mining Corridor covers a large area of almost half a million hectares (498,296 ha).

Indeed, we estimate the mining deforestation of 18,174 hectares within the Mining Corridor over the last three years (2021-2023).

In addition, we identified the mining deforestation of 5,707 hectares outside the Mining Corridor, that is, in prohibited areas and thus likely illegal mining.

Consequently, we found a total mining deforestation of 23,881 hectares (59,011 acres) during this period (2021-2023) in southern Peru.

Of this total, 76% of the deforestation occurred within the Mining Corridor, while the remaining 24% corresponds to surrounding illegal mining.

Base Map: Mining Deforestation in the Southern Peruvian Amazon

The Base Map highlights the most recent mining deforestation in the years 2021-2023 (shown in red) in relation to the historical loss of forests in the area (shown in black), both inside and outside the Mining Corridor.

Base Map. Mining deforestation inside and outside the Madre de Dios Mining Corridor, in the southern Amazon of Peru, during the years 2021 and 2023. Data: ACCA/MAAP.

Note that mining deforestation is concentrated within the Mining Corridor, representing 76% of the total. This is especially evident in the Guacamayo mining area (See Zooms A and B) and along the Madre Dios River.

The rest of the mining deforestation (24%) is outside the Mining Corridor. The majority of this deforestation is occurring in the 10 Indigenous Communities of the area, covering  3,406 hectares. The most affected communities are Barranco Chico (Zoom C), San José de Karene, Tres Islas, and Kotsimba.

Mining deforestation has also been identified in buffer zones of protected natural areas. The most affected are Tambopata National Reserve, Bahuaja Sonene National Park and Amarakaeri Communal Reserve. However, it must be emphasized that mining within protected natural areas has been effectively controlled by the Peruvian State, through the National Service of Protected Natural Areas (SERNANP).

Additionally, a certain amount of mining deforestation (161 hectares) has been detected in Brazil nut forest concessions located in the Pariamanu area (Zoom D).

Finally, it is worth mentioning an area of importance in the buffer zone of Tambopata National Reserve, known as La Pampa (Zoom E). This area was the epicenter of destructive mining deforestation between 2014 and 2018. However, the imagery reveals that after Operation Mercurio, which began in early 2019, the expansion of mining deforestation in La Pampa basically stopped. Despite this, a recent report has shown a large increase in mining activity in previously deforested areas of La Pampa (MAAP #193).
High Resolution Zooms (A-E)

The following high-resolution zooms compare mining deforestation between the year 2020 (left panel) and the current time period of 2023 (right panel). Zooms A and B are located inside the Mining Corridor (Guacamayo area), while Zooms C-E are located outside.

Zoom A. Mining Corridor (Guacamayo zone – west)

Zoom B. Mining Corridor (Guacamayo zone – east)

Zoom C. Barranco Chico Indigenous Community

Zoom D. Brazil Nut Concession, Pariamanu zone

Zoom E. La Pampa

Notes

The Mining Corridor, designated by Legislative Decree No. 1100 as the “Zone for small-scale and artisanal mining in the department of Madre de Dios,” categorizes mining activities as follows:

  • Formal: Completed formalization process with approved environmental and operational permits.
  • Informal: In the process of formalization; Operates only in authorized extraction areas, uses permitted machinery, and is considered an administrative offense, not a crime.
  • Illegal: Operates in prohibited areas such as bodies of water (e.g., rivers or lakes), uses prohibited machinery, is considered a criminal offense, and is punishable by imprisonment.

Methodology

We used LandTrendR, a temporal segmentation algorithm that identifies changes in pixel values over time, to detect forest loss within the Mining Corridor between 2021 and 2023 using the Google Earth Engine platform. It is important to note that this method was originally designed for Landsat images with moderate resolution (30 meters)1, but we adapted it for higher spatial resolution NICFI-Planet monthly mosaics (4.7 meters).2

Additionally, we created a baseline for the period 2016-2020 to eliminate old deforested areas (prior to 2021) due to rapid changes in the natural regrowth process.

Finally, we manually separated forest loss due to mining and other causes between 2021 and 2023 to specifically report on direct impacts related to mining. For this part of the analysis, we used various resources to aid the manual process, such as radar image alerts (RAMI) from the SERVIR Amazonia program, historical data from CINCIA from 1985 to 2020, forest loss data from the Peruvian government (National Forest Conservation Program for Climate Change Mitigation), and the University of Maryland.

  1. Kennedy, R.E., Yang, Z., Gorelick, N., Braaten, J., Cavalcante, L., Cohen, W.B., Healey, S. (2018). Implementation of the LandTrendr Algorithm on Google Earth Engine. Remote Sensing. 10, 691.
  2. Erik Lindquist, FAO, 2021

Acknowledgements

This report was prepared with the technical support of USAID through the Prevent Project. Prevent (Proyecto Prevenir in Spanish) works with the Government of Peru, civil society, and the private sector to prevent and combat environmental crimes for the conservation of the Peruvian Amazon, particularly in the regions of Loreto, Madre de Dios, and Ucayali.

Disclaimer: This publication is made possible by the generous support of the American people through USAID. The contents are the sole responsibility of the authors and do not necessarily reflect the views of USAID or the United States Government.


Citation

Finer M, Mamani N, Ariñez A (2023) Gold Mining Deforestation in the Southern Peruvian Amazon, 2021-2023. MAAP: 195.

MAAP #125: Detecting Illegal Logging with Very High Resolution Satellites

Very high resolution satellite image showing illegal logging in the southern Peruvian Amazon. Data: Maxar. Analysis: MAAP/ACCA.

Illegal logging in the Peruvian Amazon is mainly selective and, until now, difficult to detect through satellite information.

In this report, we present the enormous potential of very high resolution satellite imagery (<70 cm) to identify illegal logging.

The leading entities that offer this type of data are Planet (Skysat) and Maxar (Worldview).

We emphasize that this technique has the potential to detect the illegal activity in real time, when preventive action is still possible.

This is an important advance because when an intervention normally occurs, such as detaining a boat or truck with illegal timber, the damage is done.

Below, we show a specific case of using very high resolution satellite imagery to detect and confirm probable illegal logging in the southern Peruvian Amazon (Madre de Dios region).


Case: Turbina SAC

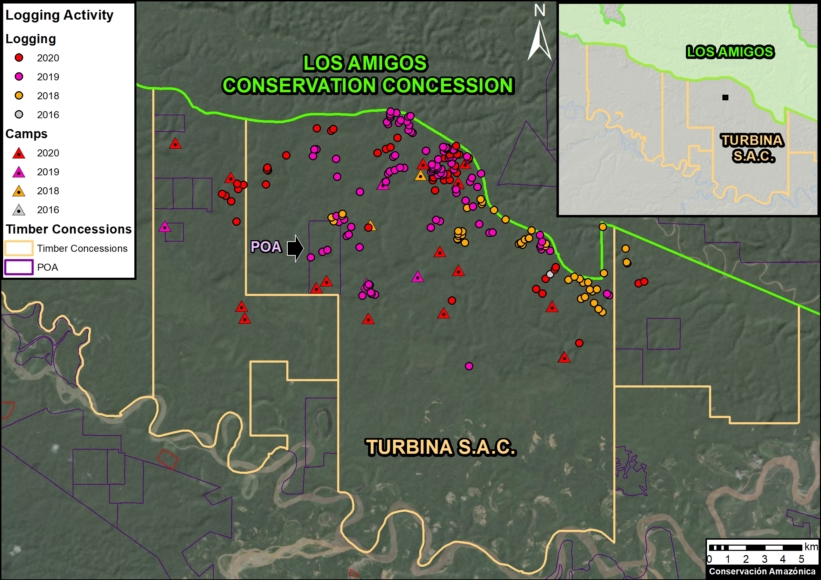
The Base Map below shows the intensity of probable illegal logging activity* in the Turbina SAC forestry concession, from 2016 to the present. Specifically, it shows the exact points of illegal logging events (felled trees) and logging camps, as identified through our analysis of very high-resolution satellite images. Note that this forestry concession is adjacent to the Los Amigos Conservation Concession, an important long-term (20 years) biodiversity conservation area.

Base Map. Illegal logging activities in the Turbina SAC forestry concession. The size of the points is for reference only. Data: MAAP/Amazon Conservation.

Very High Resolution Satellite Imagery

Below, we show a series of very high-resolution satellite images, courtesy of the innovative satellite companies Planet and Maxar.

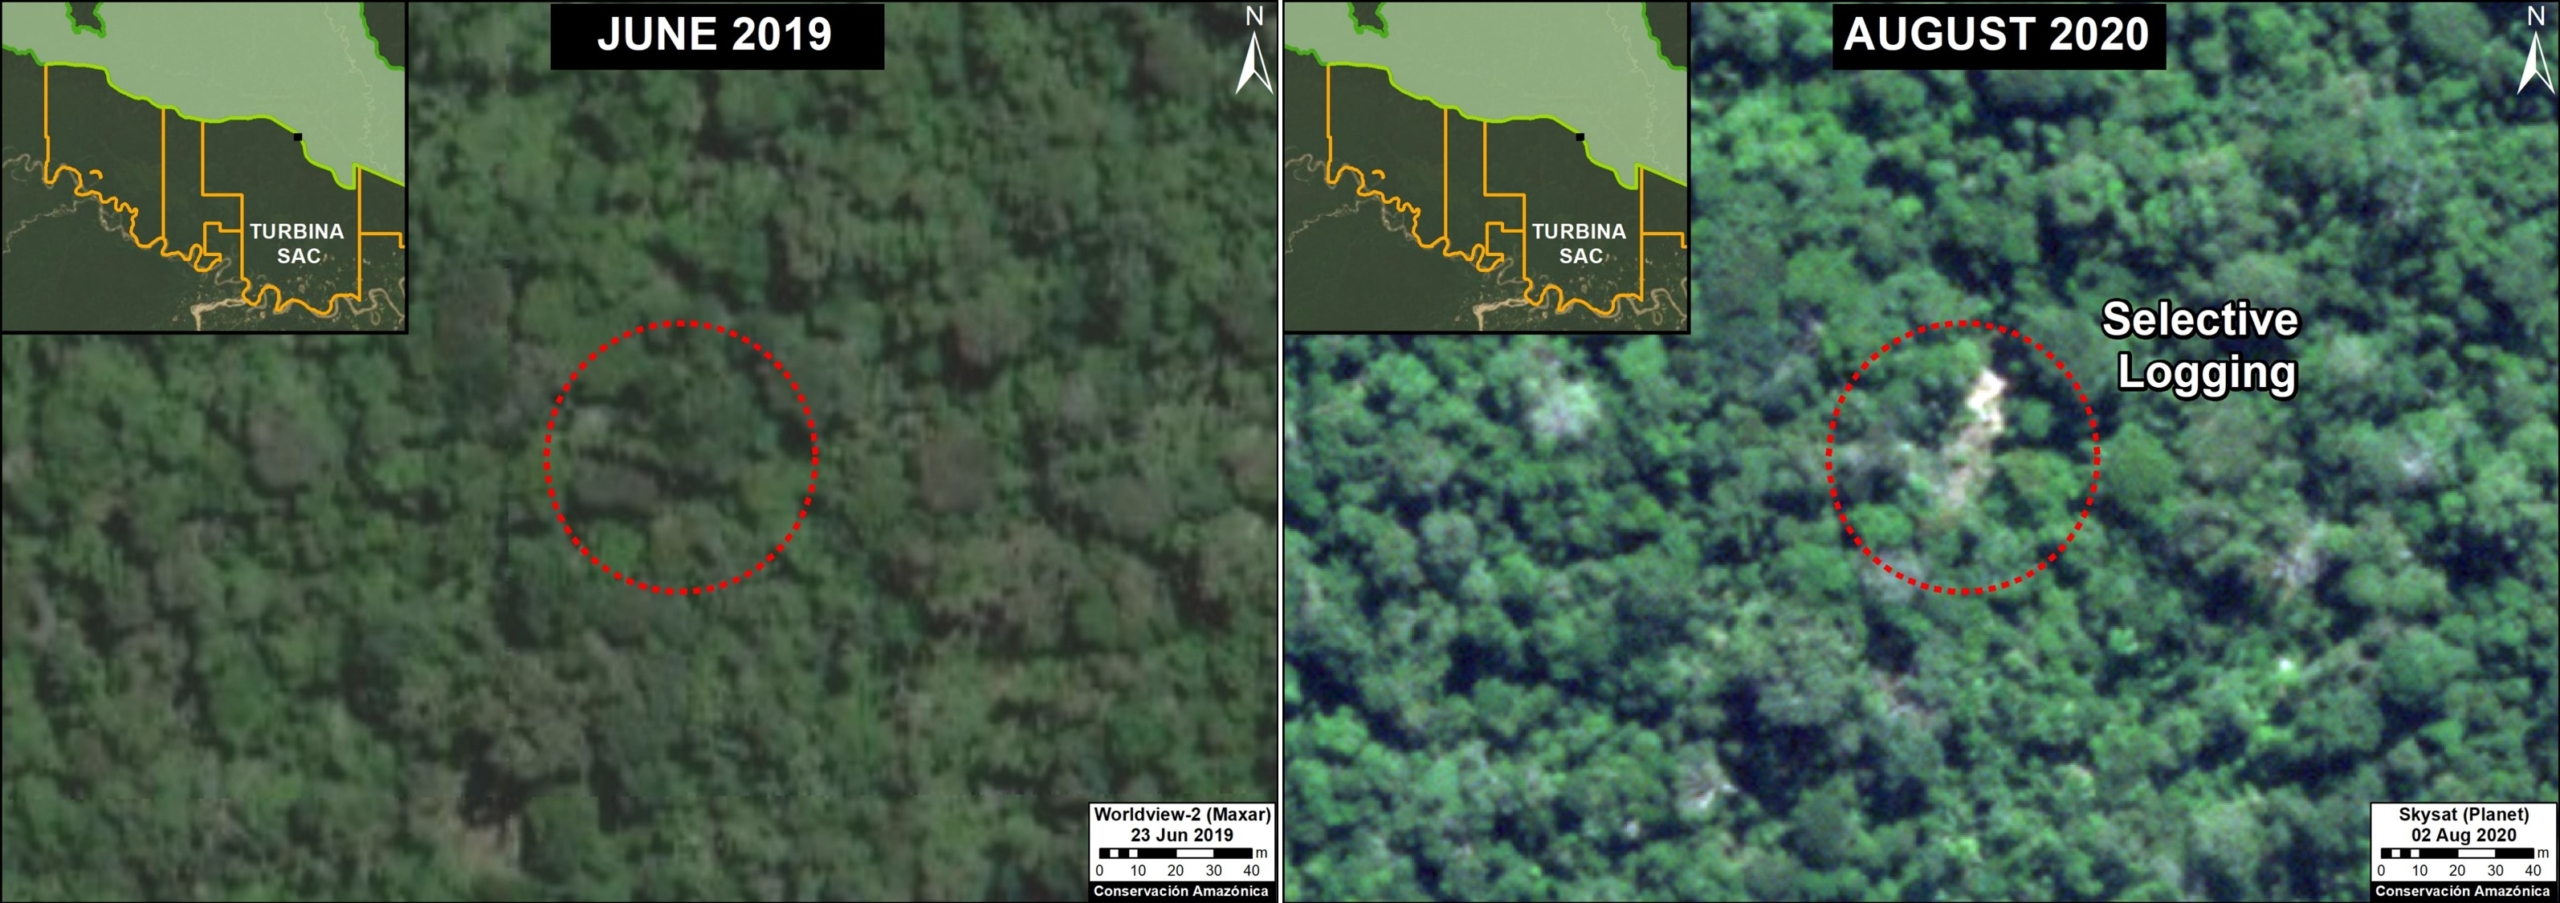
The first image shows the identification of probable illegal logging between June 2019 (left panel) and August 2020 (right panel). The red circle indicates the exact area (canopy) of the illegally logged tree.

The identification of illegal logging between June 2019 (left panel) and August 2020 (right panel). Click to enlarge. Data: Maxar, Planet, MAAP.

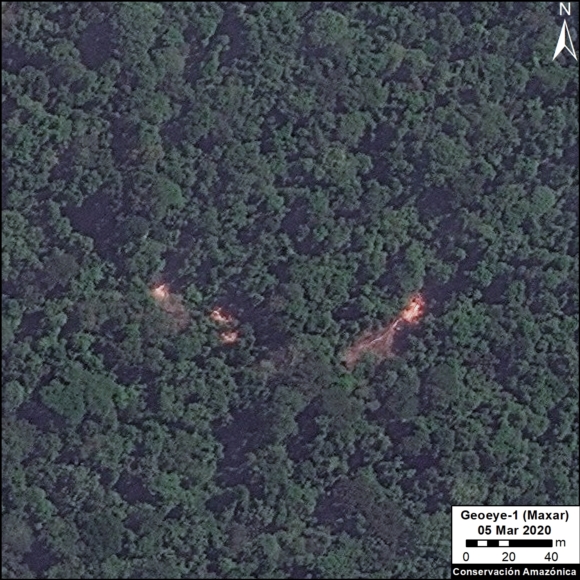
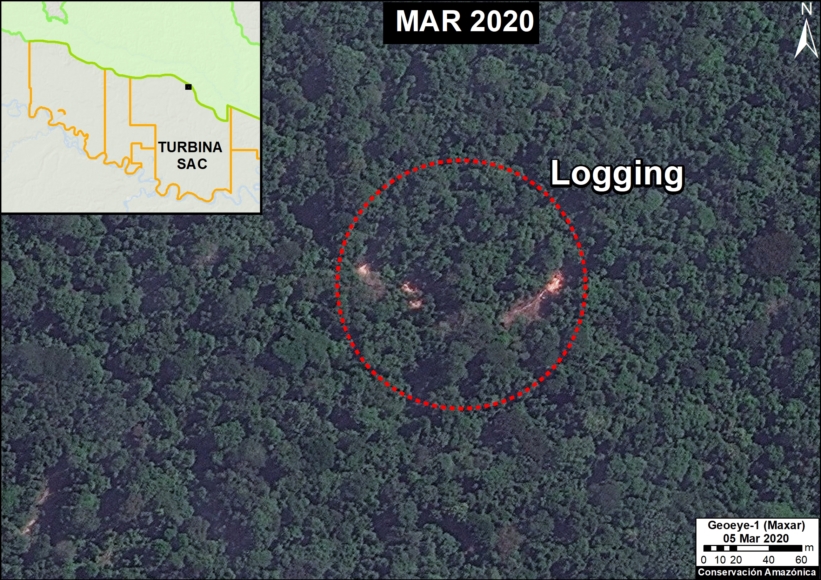
The following image shows the identification of illegal logging in March 2020. The red circle indicates the exact area of the illegally logged trees.

Identification of illegal logging. Data: Maxar, MAAP.

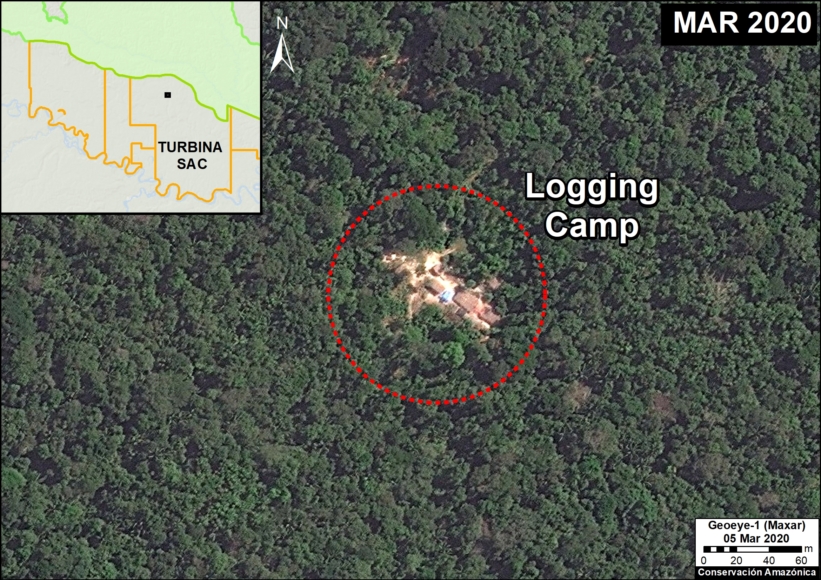
The following image shows the identification of a logging camp in March 2o20. The red circle indicates the area of the camp.

Satellite image of an illegal logging camp. Data: Maxar, MAAP.

*Statement on Legality

We determined that this logging activity is illegal from a detailed analysis of official information from the Peruvian Government (specifically, the Peruvian Forestry Service, SERFOR, and forestry oversight agency, OSINFOR). This information indicates that, although the concession is in force (Vigente), its status is classified as Inactive (Inactiva). In addition, 2013 was the last year that this concession had an approved logging plan (Plan Operativo de Aprovechamiento, or POA), and it was for a different sector of the concession from the newly detected logging activity.

To confirm our assumption of illegal activity, we requested the technical opinion from the corresponding regional forestry and wildlife authority, however, as of the date of publication of this report, we have not yet received a response.

Thus, with the information we had at the time of publication, we concluded the logging was illegal as it was not conducted within a current management plan.

Methodology

We carried out the analysis in two main steps:

The first step was the visual interpretation and digitization of new logging events and associated logging camps within the Turbina forestry concession. This analysis was based on the evaluation of submetric images obtained from the satellite companies Planet and Maxar, for the period 2019-20. It is worth noting that for Planet, we had the new ability to “task” new images for a specific area, rather than waiting for an image to appear by other means. Logging in the Peruvian Amazon is usually highly selective for high-value species, thus its detection requires a comparative analysis of images (before and after), in such a way that the trees cut during the study period (2019-20 in this case) can be identified.

The second step focused on an analysis of the legality of the identified logging events. The locations of the logged trees and camps were cross-referenced with spatial information on the state and status of forestry concessions provided by the GeoSERFOR (SERFOR) portal, as well as the areas delimited in the annual operational plans of the concessions, verified by OSINFOR and distributed through the SISFOR portal (WMS). We considered both spatial and temporal aspects to the forestry concession data.

Citation

Novoa S, Villa L, Finer M (2020) Detecting Illegal Logging with Very High Resolution Satellites. MAAP: 125.

Acknowledgments

We thank A. Felix (USAID Prevent), M.E. Gutierrez (ACCA), and G. Palacios for their helpful comments on this report.

This report was conducted with technical assistance from USAID, via the Prevent project. Prevent is an initiative that, over the next 5 years, will work with the Government of Peru, civil society, and the private sector to prevent and combat environmental crimes in Loreto, Ucayali and Madre de Dios, in order to conserve the Peruvian Amazon.

This publication is made possible with the support of the American people through USAID. Its content is the sole responsibility of the authors and does not necessarily reflect the views of USAID or the US government.

MAAP Colombia: Chiribiquete – Deforestation Hotspots in the Colombian Amazon, part 3

MAAP #86: Deforestation Hotspots in the Colombian Amazon, part 3: Chiribiquete-Macarena

We present our third report* in a series investigating deforestation hotspots in the Colombian Amazon. Here, we focus on the “Chiribiquete-Macarena” hotspot, located between the Chiribiquete and La Macarena National Parks.

The Colombian government is finalizing plans to expand the boundaries of Chiribiquete National Park, an important step for conservation. However, we show (with high-resolution images) that deforestation is surging in the area and rapidly expanding towards these new boundaries. In fact, in 2018, deforestation has entered the newly expanded park.

MAAP #86: Deforestation Hotspots in the Colombian Amazon, part 3: Chiribiquete-Macarena

https://www.maapprogram.org/chiribiquete/


*The first report focused on the “Caguan” hotspot in the department of Caquetá. The second report focused on the “La Paya” hotspot in the department of Putumayo.

MAAP #58: Link between Peru’s Flooding and Warm Coastal Waters

In previous articles MAAP #56 and MAAP #57, we presented a series of striking satellite images of the recent deadly floods in northern Peru. Satellites provide additional types of data critical to better understanding events such as extreme flooding. Here, we present two more types of satellite data related to the flooding: ocean water temperature and precipitation.


Warming Coastal Waters

Image 58a. Data: NOAA

Satellite data from NOAA (the U.S. National Oceanic and Atmospheric Administration) clearly shows the warming of the northern Peruvian coastal waters immediately before and during the heavy rains and flooding (1, 2). Specifically, Image 58a shows the sudden warming in January, followed by intensifying warming in February and March (white inset box indicates primary flooding zone). Peruvian experts have referred to this phenomenon as “coastal El Niño”.

Heavy Rains

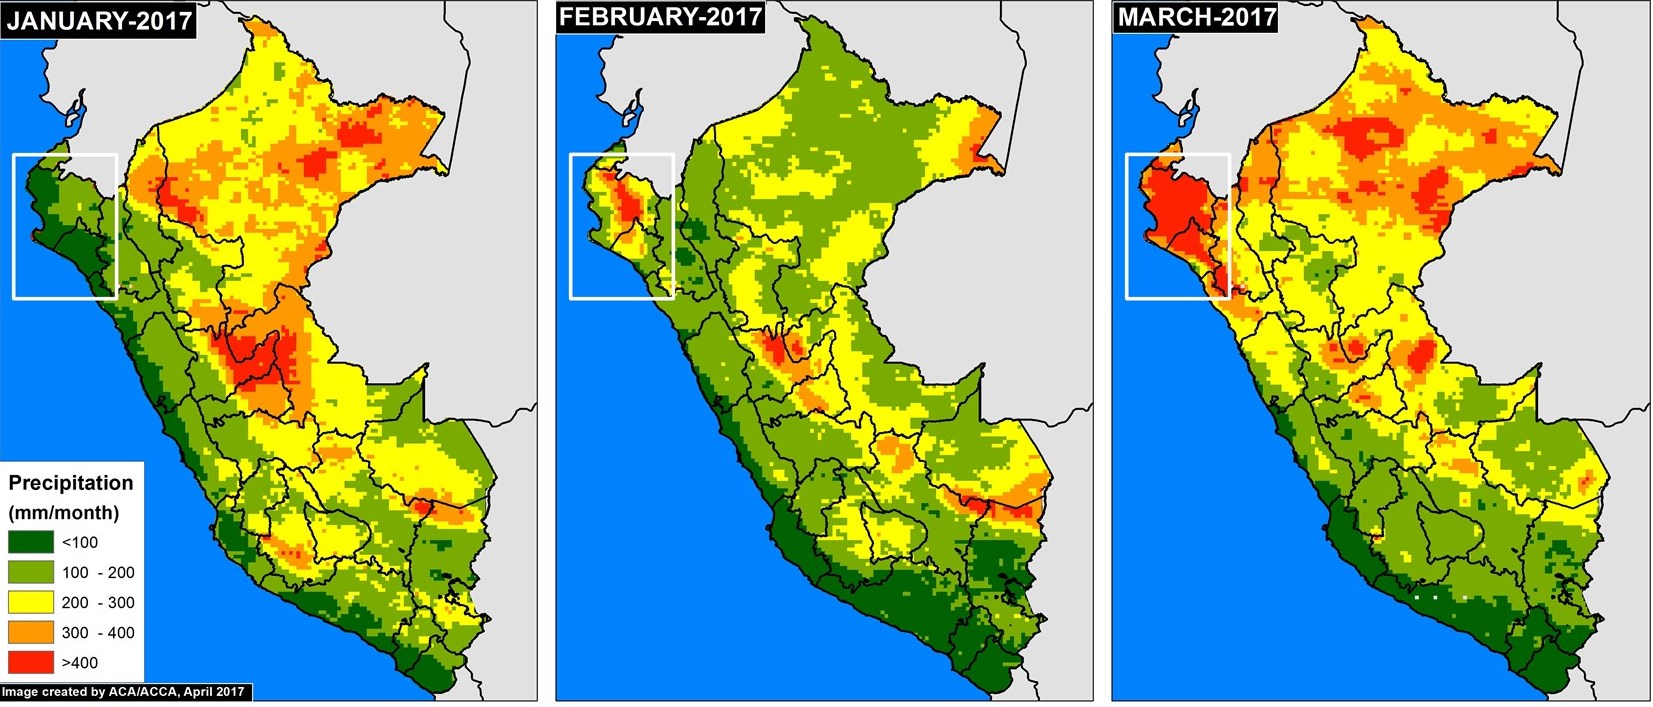
Image 58b. Data: Senamhi, GPM/NASA

Image 58b shows the resulting accumulated monthly precipitation totals (white inset box indicates primary flooding zone). In January, as expected, the dry northern coast had much lower precipitation than the Amazon region to the east. In February and March, however, the northern coast experienced abnormally intense rainfall, even more than many parts of the Amazon.

Floods linked to Climate Change?

Questions have emerged regarding the link between the deadly Peruvian floods and climate change (3). As seen in the images above, the sudden appearance of warm coastal waters coincides with intense rains in the primary flooding zone. Additional analysis is needed to better understand the link between the Peruvian floods and climate change, but such events are consistent with predictions related to heavy rains fueled by ocean warming due to climate change (3). Climate change could also increase the frequency or intensity of El Niño events (4).

References

  1. Villa, L. (27 de marzo 2017). Radar Sentinel-1: Evaluación Preliminar del Impacto del Niño Costero en Perú (Parte II). [Mensaje en un blog]. Recuperado de: http://luciovilla.blogspot.com/2017/03/radar-sentinel-1-evaluacion-preliminar_27.html
  2. Villa, L. (17 de marzo 2017). Radar Sentinel-1: Evaluación Preliminar del Impacto del Niño Costero en Perú (Parte I). [Mensaje en un blog]. Recuperado de: http://luciovilla.blogspot.com/2017/03/radar-sentinel-1-evaluacion-preliminar.html
  3. Berwyn B (2017) Peru’s Floods Follow Climate Change’s Deadly Extreme Weather Trend. Inside Climate News. Link: https://insideclimatenews.org/news/24032017/peru-floods-extreme-weather-climate-global-warming-el-nino
  4. Fraser B (2017) Coastal El Niño catches Peru by surprise. EcoAmericas March 2017.

Citation

Finer M, Novoa S, Gacke S (2017) Link between Peru’s Flooding and Warm Coastal Waters. MAAP: 58.

MAAP: What satellites show us about Peru’s flooding

Image 57. Data: ESRI, INEI, MINAM. Click to enlarge.

Satellites provide unique information that is critical to understanding events on Earth, including the recent deadly flooding in northern Peru.

In the previous MAAP #56, we showed a series of satellite images of the deadly floods that recently hit northern Peru.

Here, we highlight how satellites can show us the extent, indicators, impacts, and causes of the flooding.

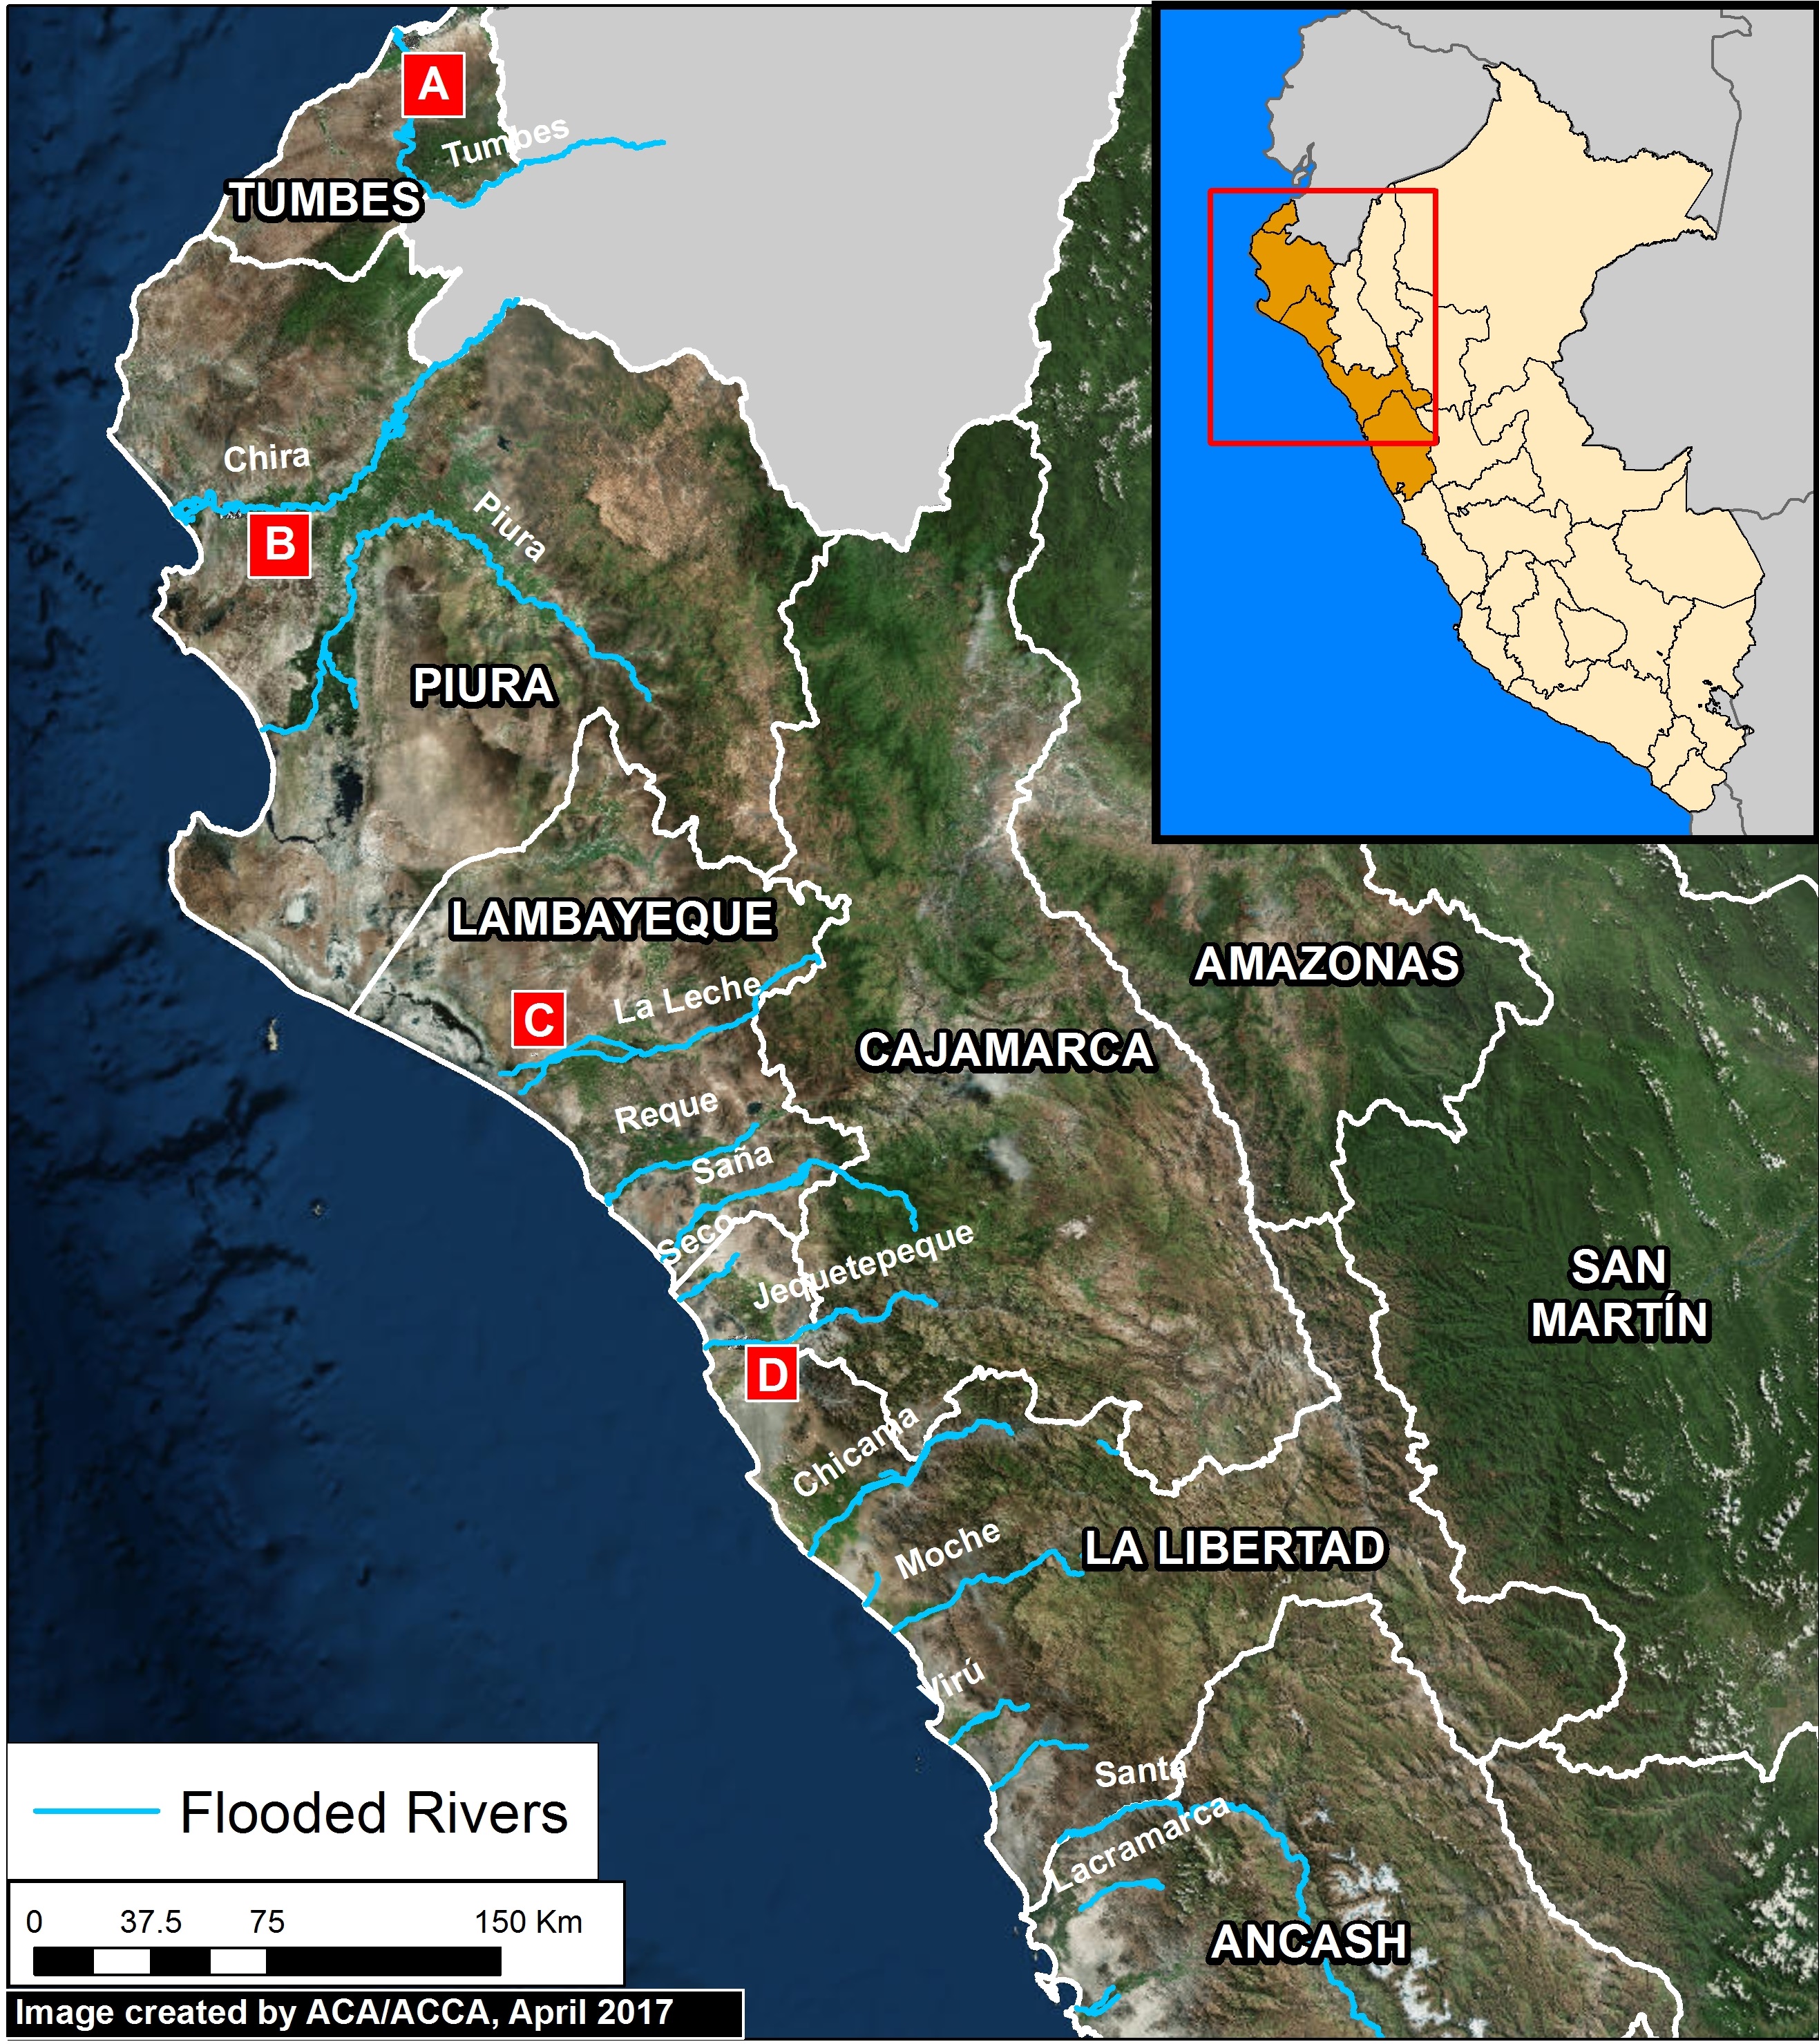
Image A (see left) shows the general extent of the flooding in northern Peru. Analyzing satellite imagery, we identified 13 major rivers that flooded, indicated in blue.


Indicators of Flooding

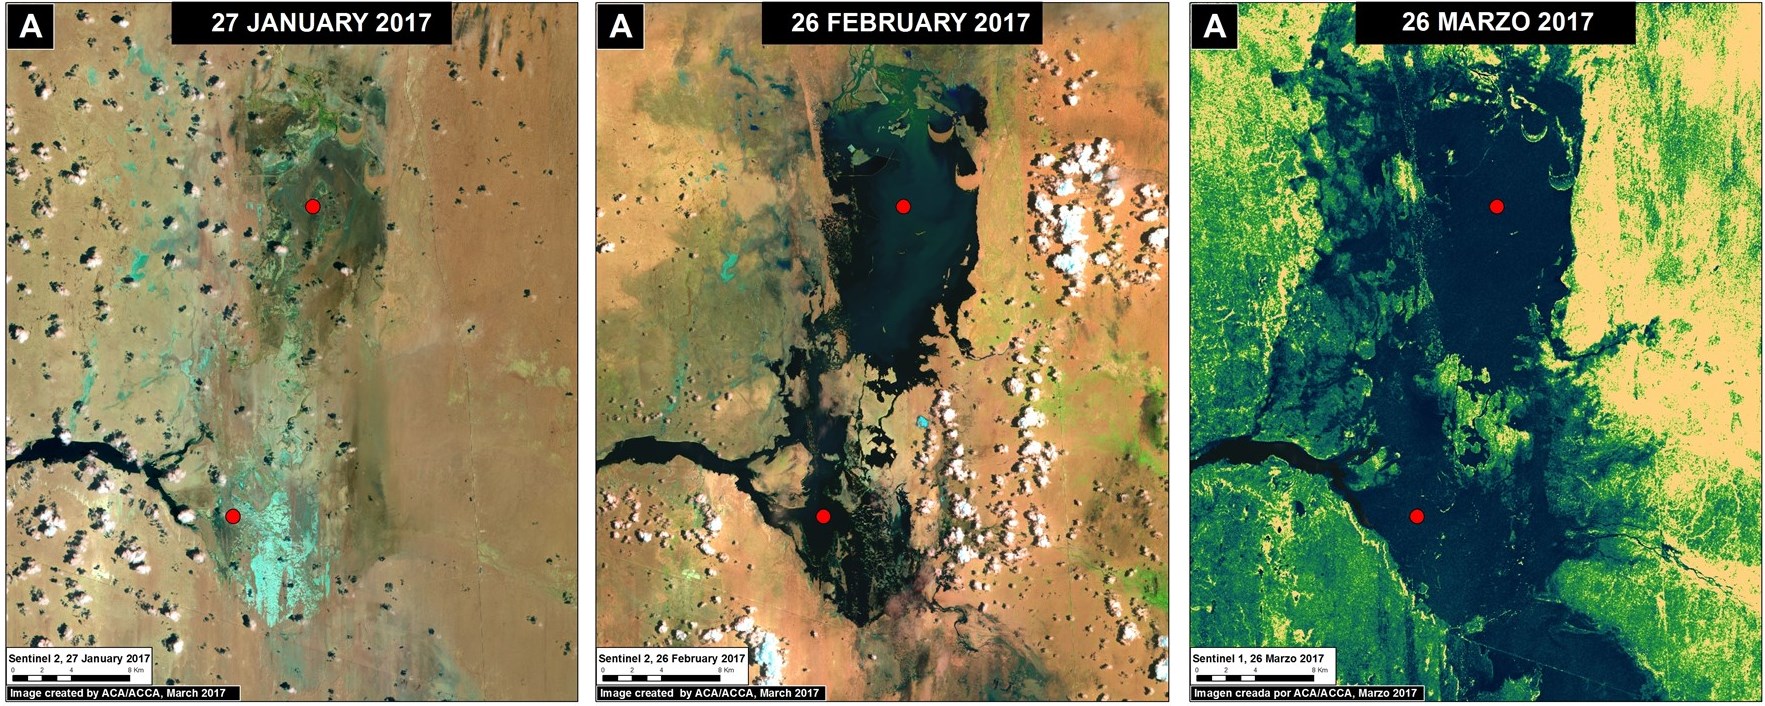
An indicator of intense rains and flooding in northern Peru is the formation of the temporary lagoons La Niña and La Niña Sur, in the region of Piura. Image B shows the rapid formation of the lagoons between late January (left panel) and March 2017 (right panel).

Image B. Data: ESA

Impact of Flooding

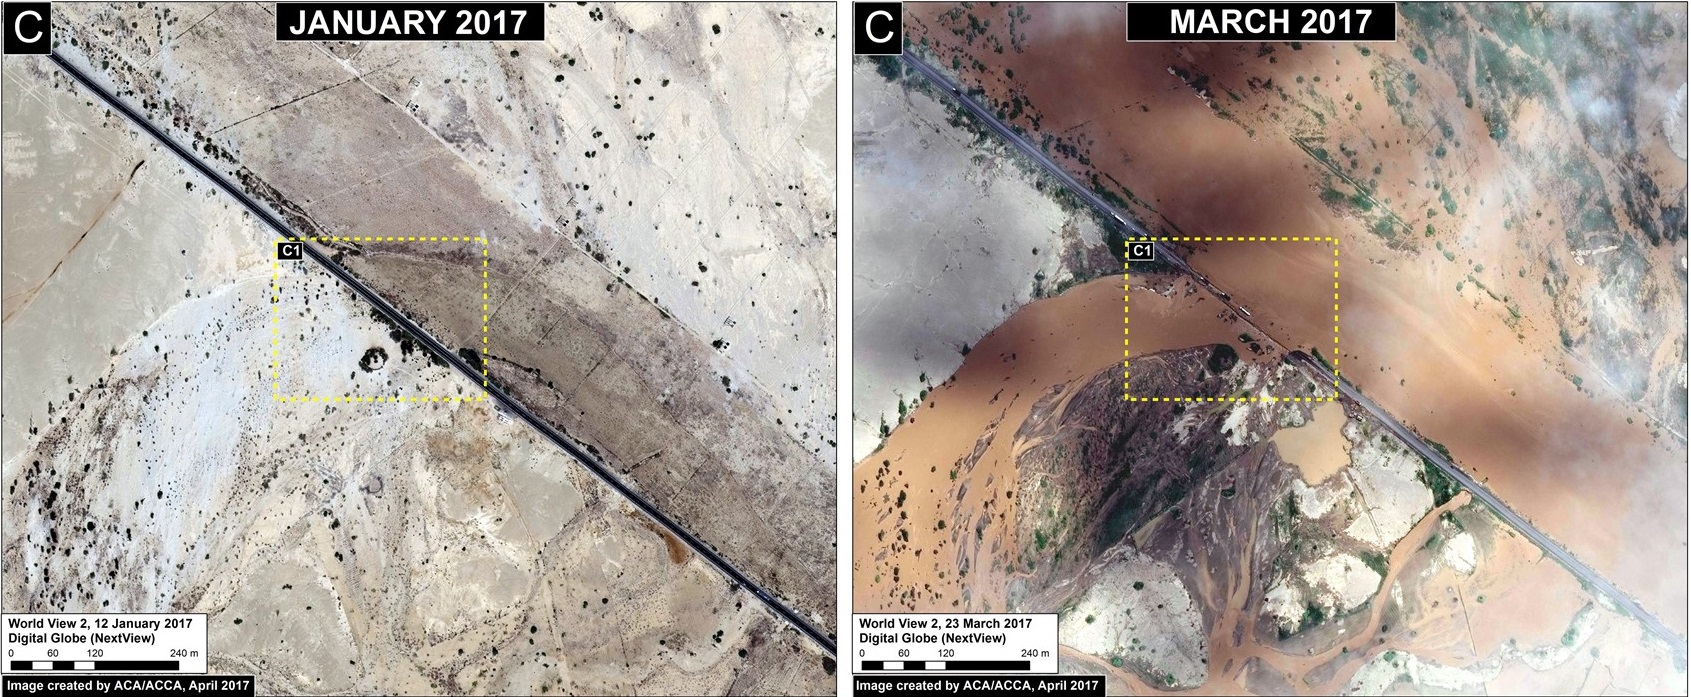
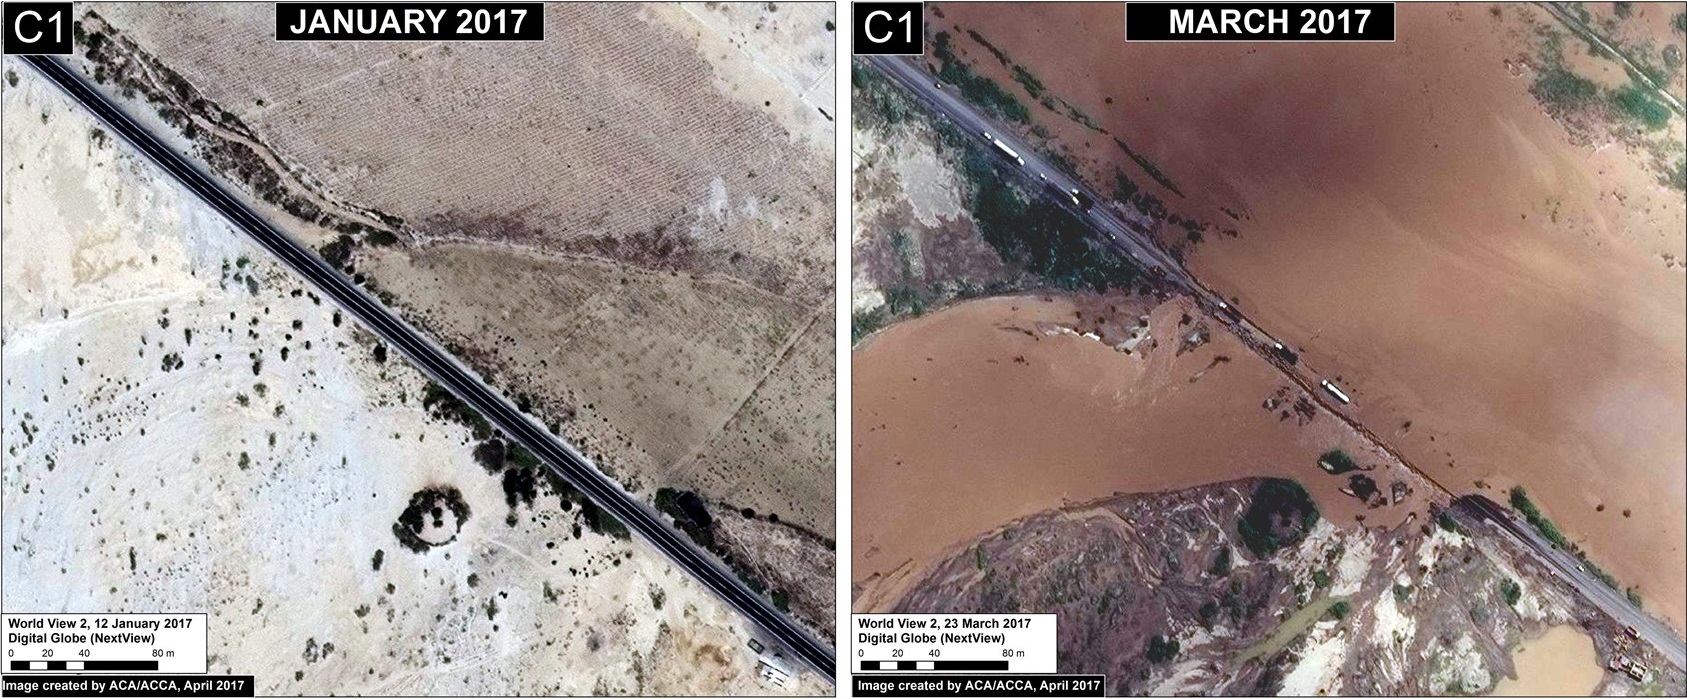
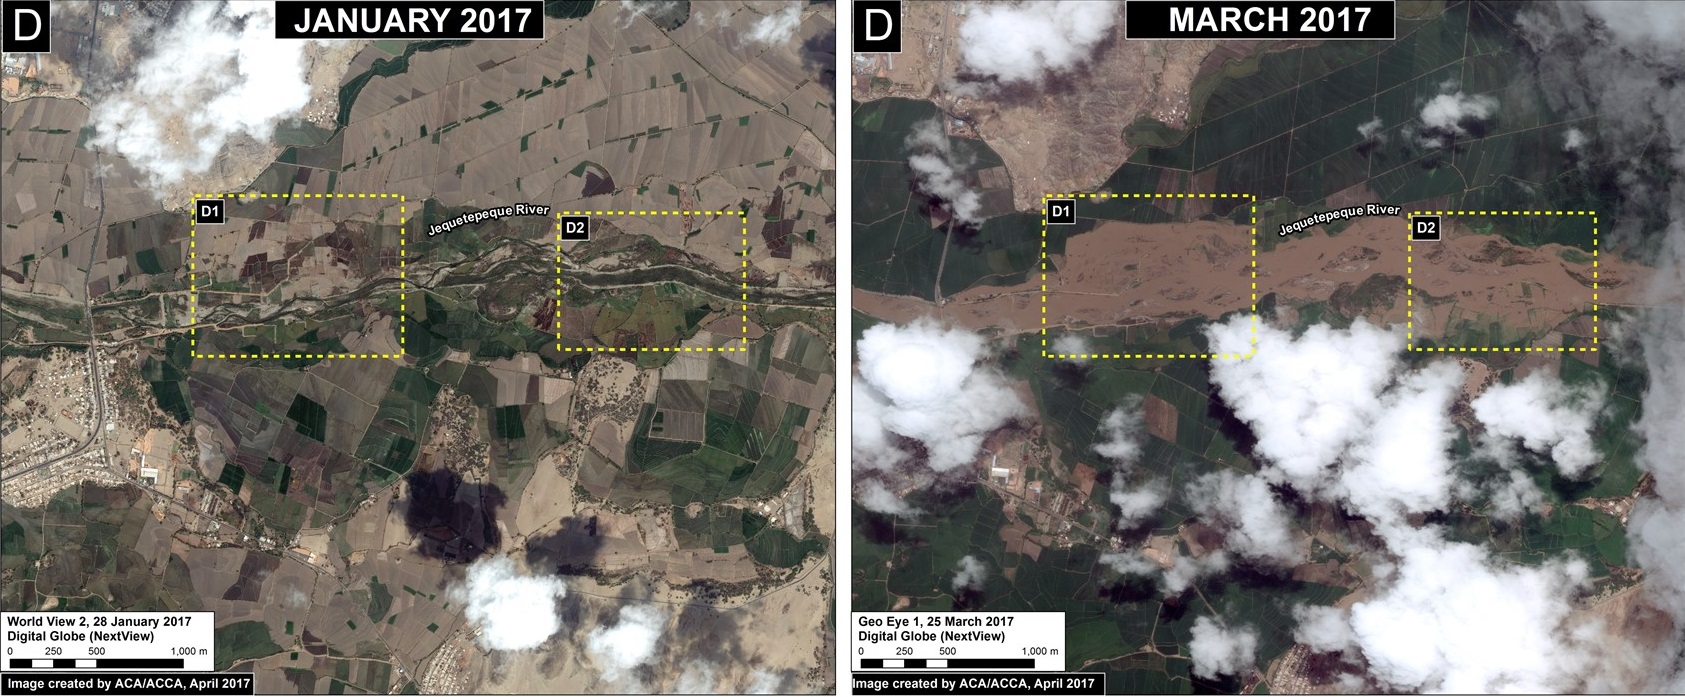
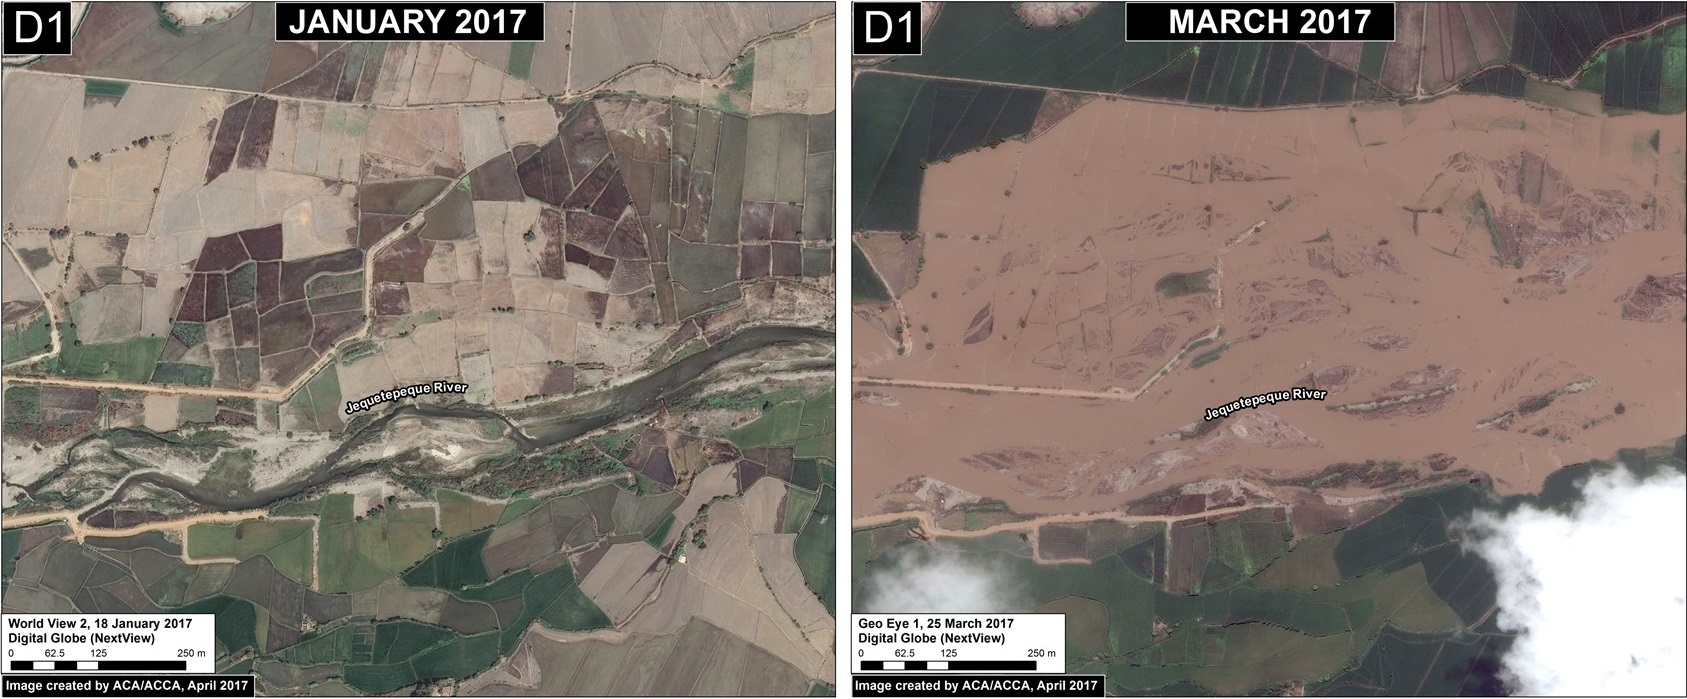
The centerpiece of our analysis is a series of high resolution satellite images of the flooding. Images C and D show, in striking detail, some of the local impacts to the Panamerican Highway and croplands between January (left panel) and March (right panel) 2017.

Image C. Data: DigitalGlobe (Nextview)
Inset C1. Data: DigitalGlobe (Nextview)
Image D. Data: DigitalGlobe (Nextview)
Inset D1. Data: DigitalGlobe (Nextview)

Causes of Flooding

Satellites also provide data about the link between ocean water temperature and the heavy rains causing the floods. Image E shows the warming of the northern Peruvian coastal waters immediately before and during the heavy rains and flooding. Peruvian experts have referred to this phenomenon as “coastal El Niño”.

Image E. Data: NOAA


Image F shows  the resulting accumulated monthly precipitation totals (white inset box indicates primary flooding zone). In January, as expected, the dry northern coast had much lower precipitation than the Amazon region to the east. In February and March, however, the northern coast experienced abnormally intense rainfall, even more than many parts of the Amazon.

Image F. Data: Senamhi, GPM/NASA

Citation

Novoa S, Finer M (2017) What satellites show us about Peru’s flooding. MAAP.