As gold prices continue to increase (over 30% during the last 12 months), small-scale gold mining activity has emerged as one of the major deforestation drivers across the Amazon.
It often targets remote areas, thus impacting carbon-rich primary forests within protected areas and Indigenous territories. Moreover, in many cases, we presume that this mining is illegal based on its location within conservation areas (such as protected areas and Indigenous territories) and outside mining concessions.
Given the vastness of the Amazon, however, it has been a challenge to accurately monitor mining deforestation across all nine countries of the biome in a timely manner.
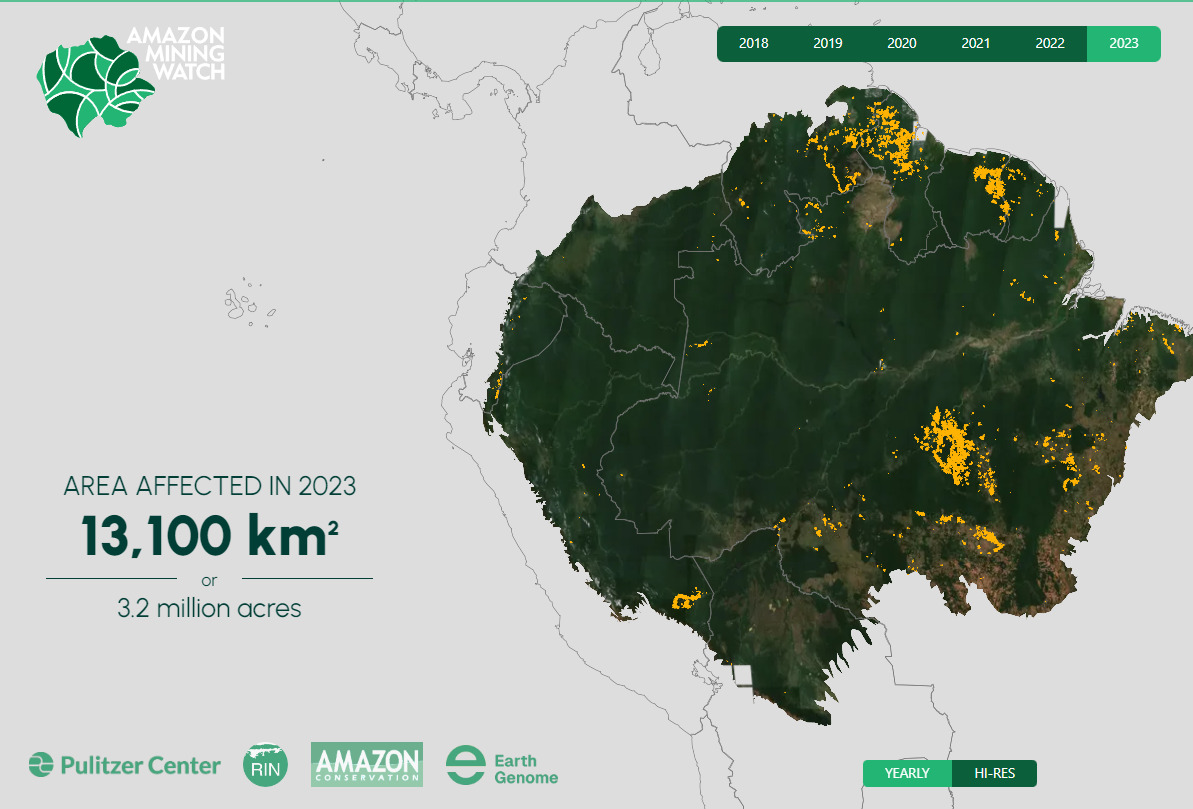
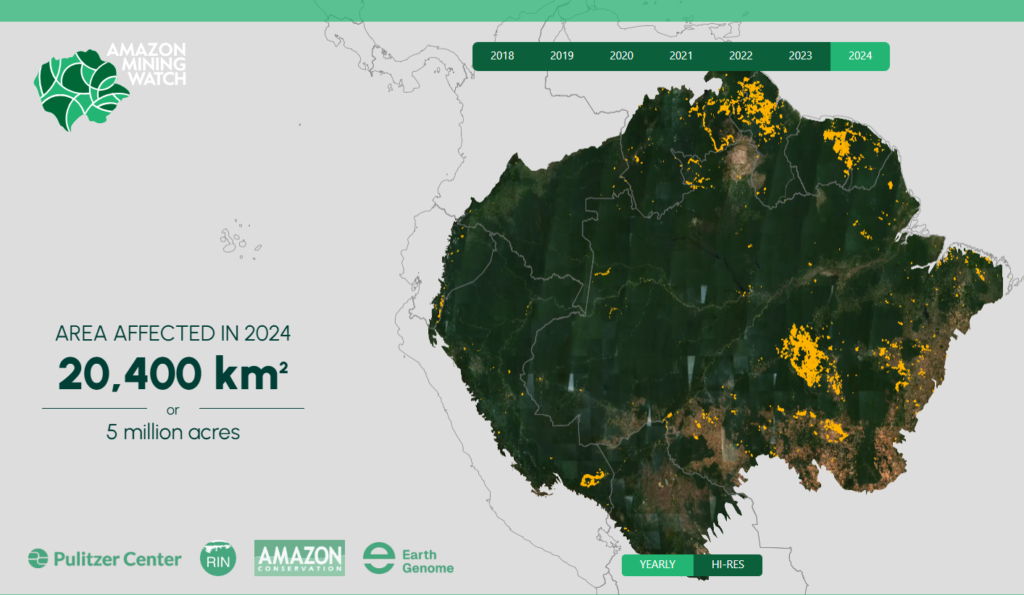
In MAAP #212, we presented the initial results of the new AI-based dashboard (known as Amazon Mining Watch) designed to address this issue. AMW is a partnership between Earth Genome, Amazon Conservation, and the Pulitzer Center’s Rainforest Investigations Network.
This online tool (see Intro Image) analyzes satellite imagery archives to estimate annual mining deforestation footprints across the entire Amazon, from 2018 to 2024 (Note 1). Although the data is not designed for precise area measurements, they can be used to give general estimates. The algorithm is based on 10-meter resolution imagery from the European Space Agency’s Sentinel-2 satellite and produces 480-meter resolution pixelated mining deforestation alerts.
By analyzing the annual mining deforestation footprints across years (since 2018), we are able to detect annual trends and estimate the overall cumulative impact. Here, we present an update focused on the newly added 2024 data.
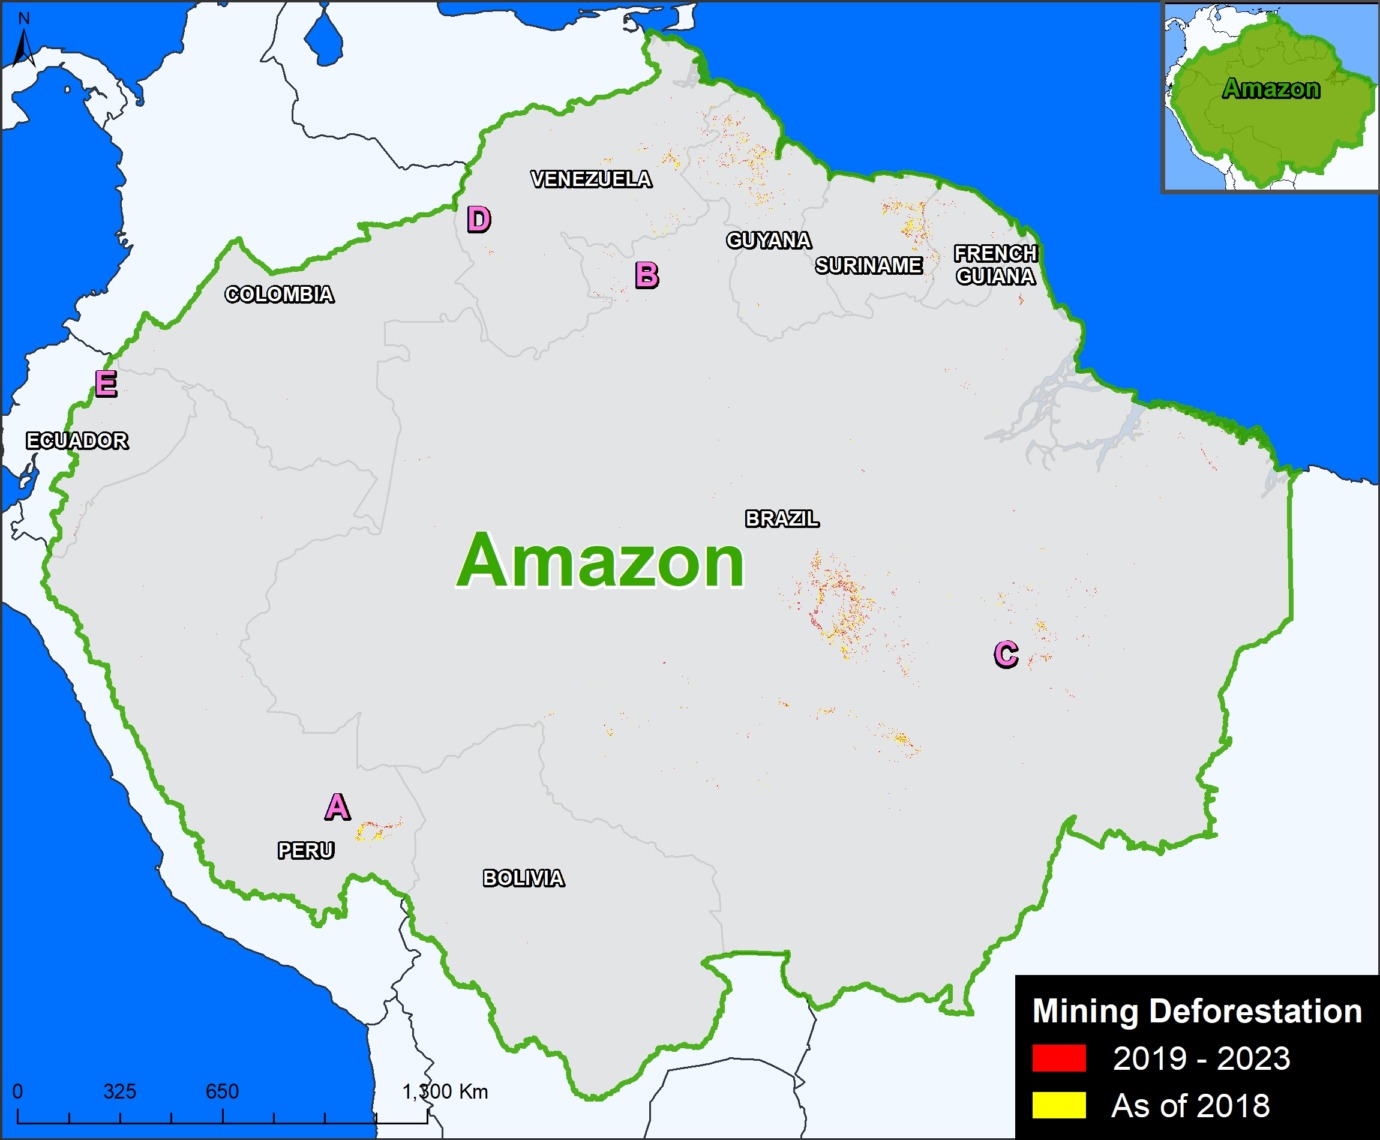
This data reveals that gold mining is actively causing deforestation in all nine countries of the Amazon (see Base Map below). The countries with the highest levels of new gold mining deforestation in 2024 are 1) Brazil, 2) Guyana, 3) Suriname, 4) Venezuela, and 5) Peru.
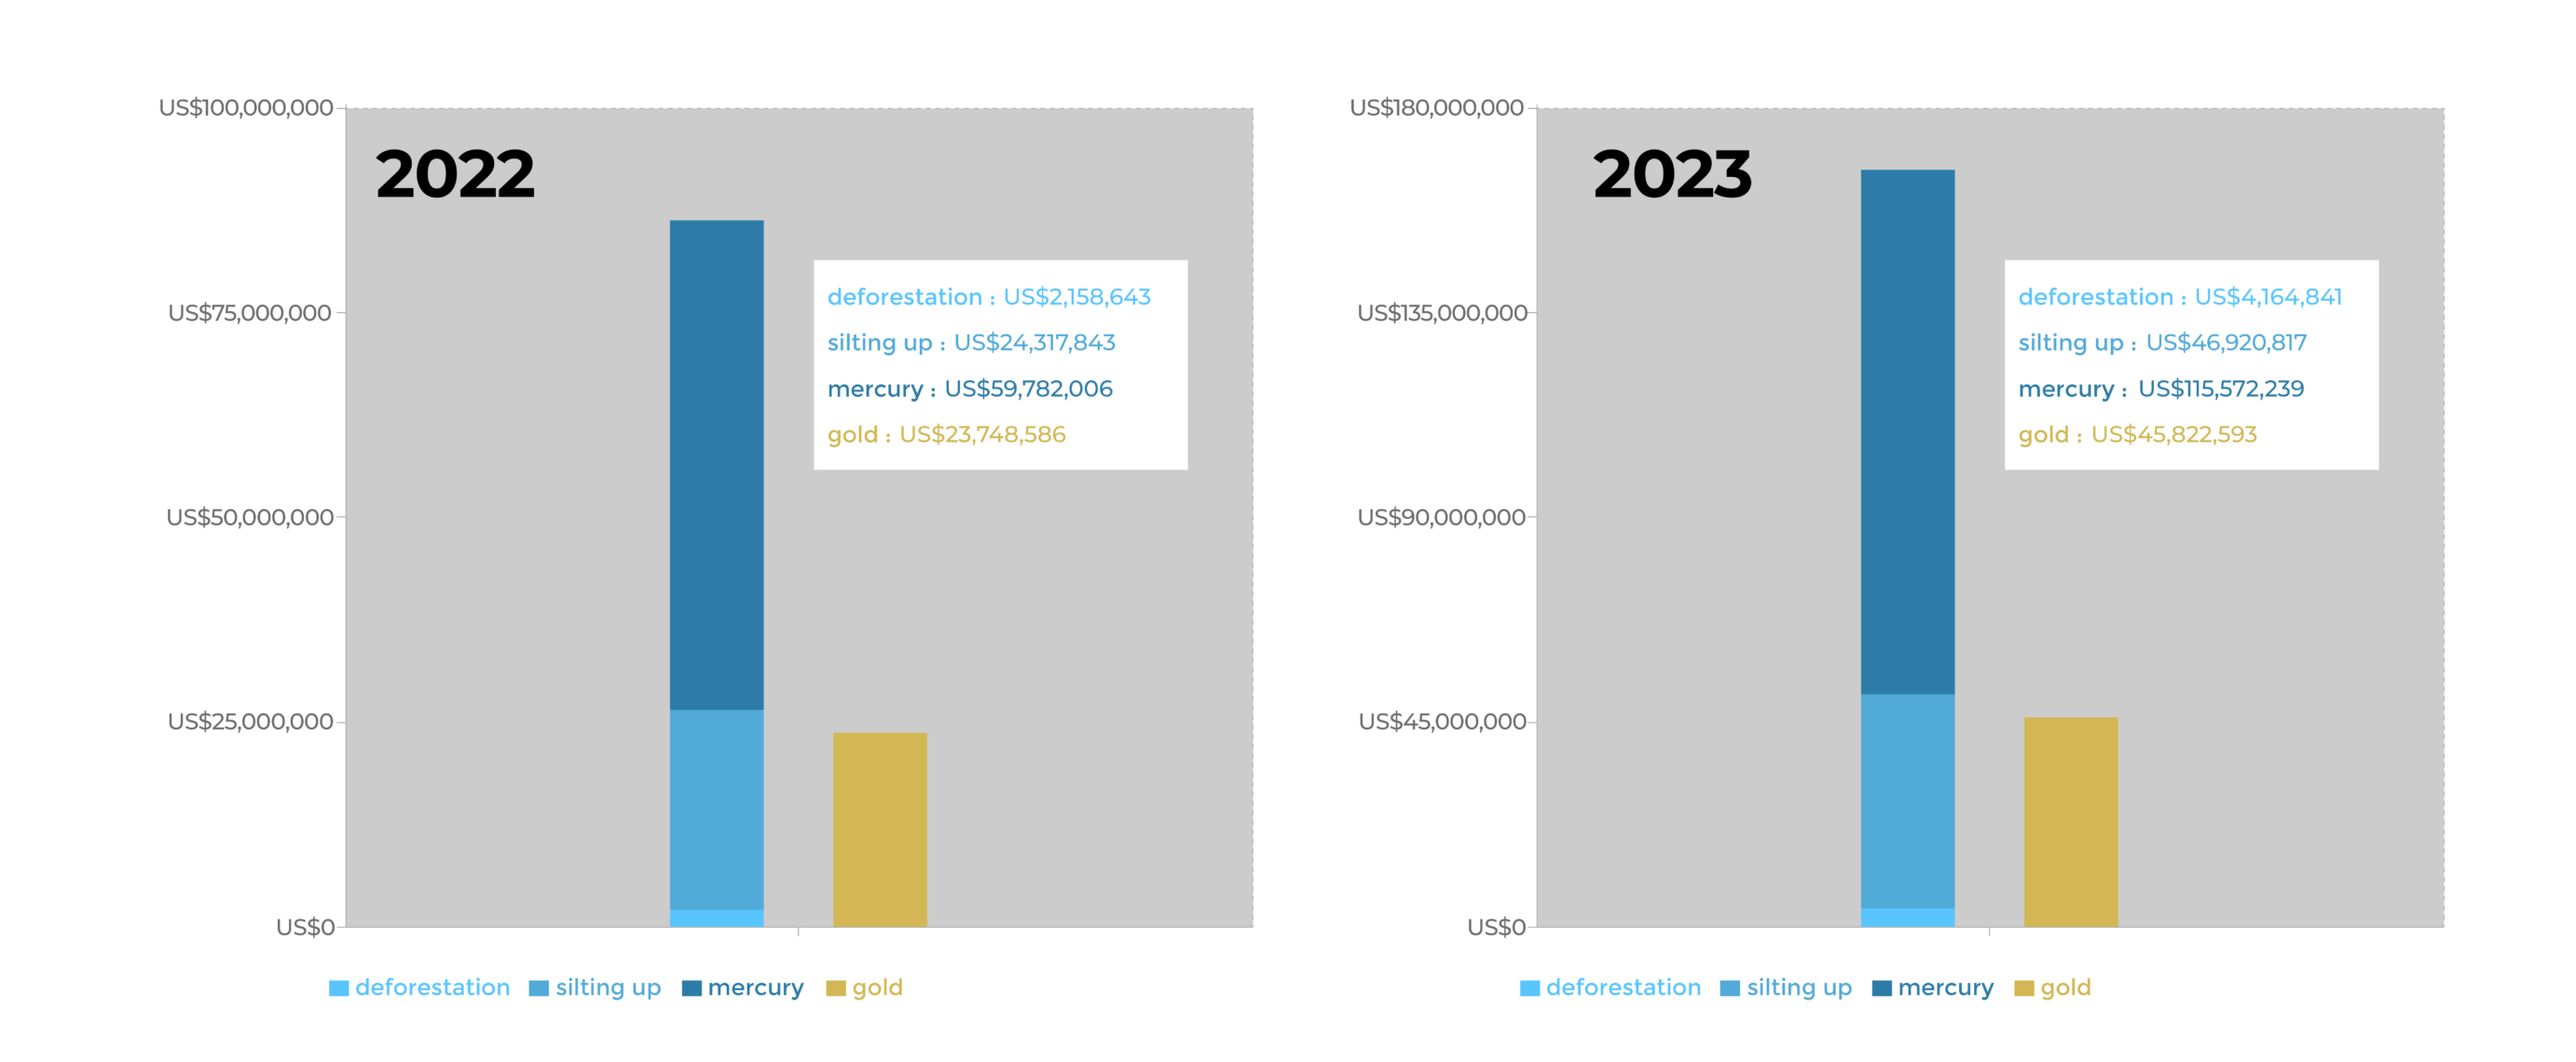
As a note regarding future steps, the Amazon Mining Watch partnership is currently working to enhance the functionality of the dashboard, to increase the frequency of the information produced (quarterly mining alerts), and facilitate the production of targeted, high-quality reports on key monitoring areas anywhere in the Amazon. The AMW will be a one-stop shop platform including real-time visualization of: 1) AI-based detection of mining deforestation across all nine Amazonian countries; 2) Hotspots of urgent mining cases, including river-based mining; and 3) the socio-environmental costs of illegal gold mining with the Conservation Strategy Fund (CSF) Mining Impacts Calculator.
MAJOR FINDINGS
Amazon & National Scale Patterns
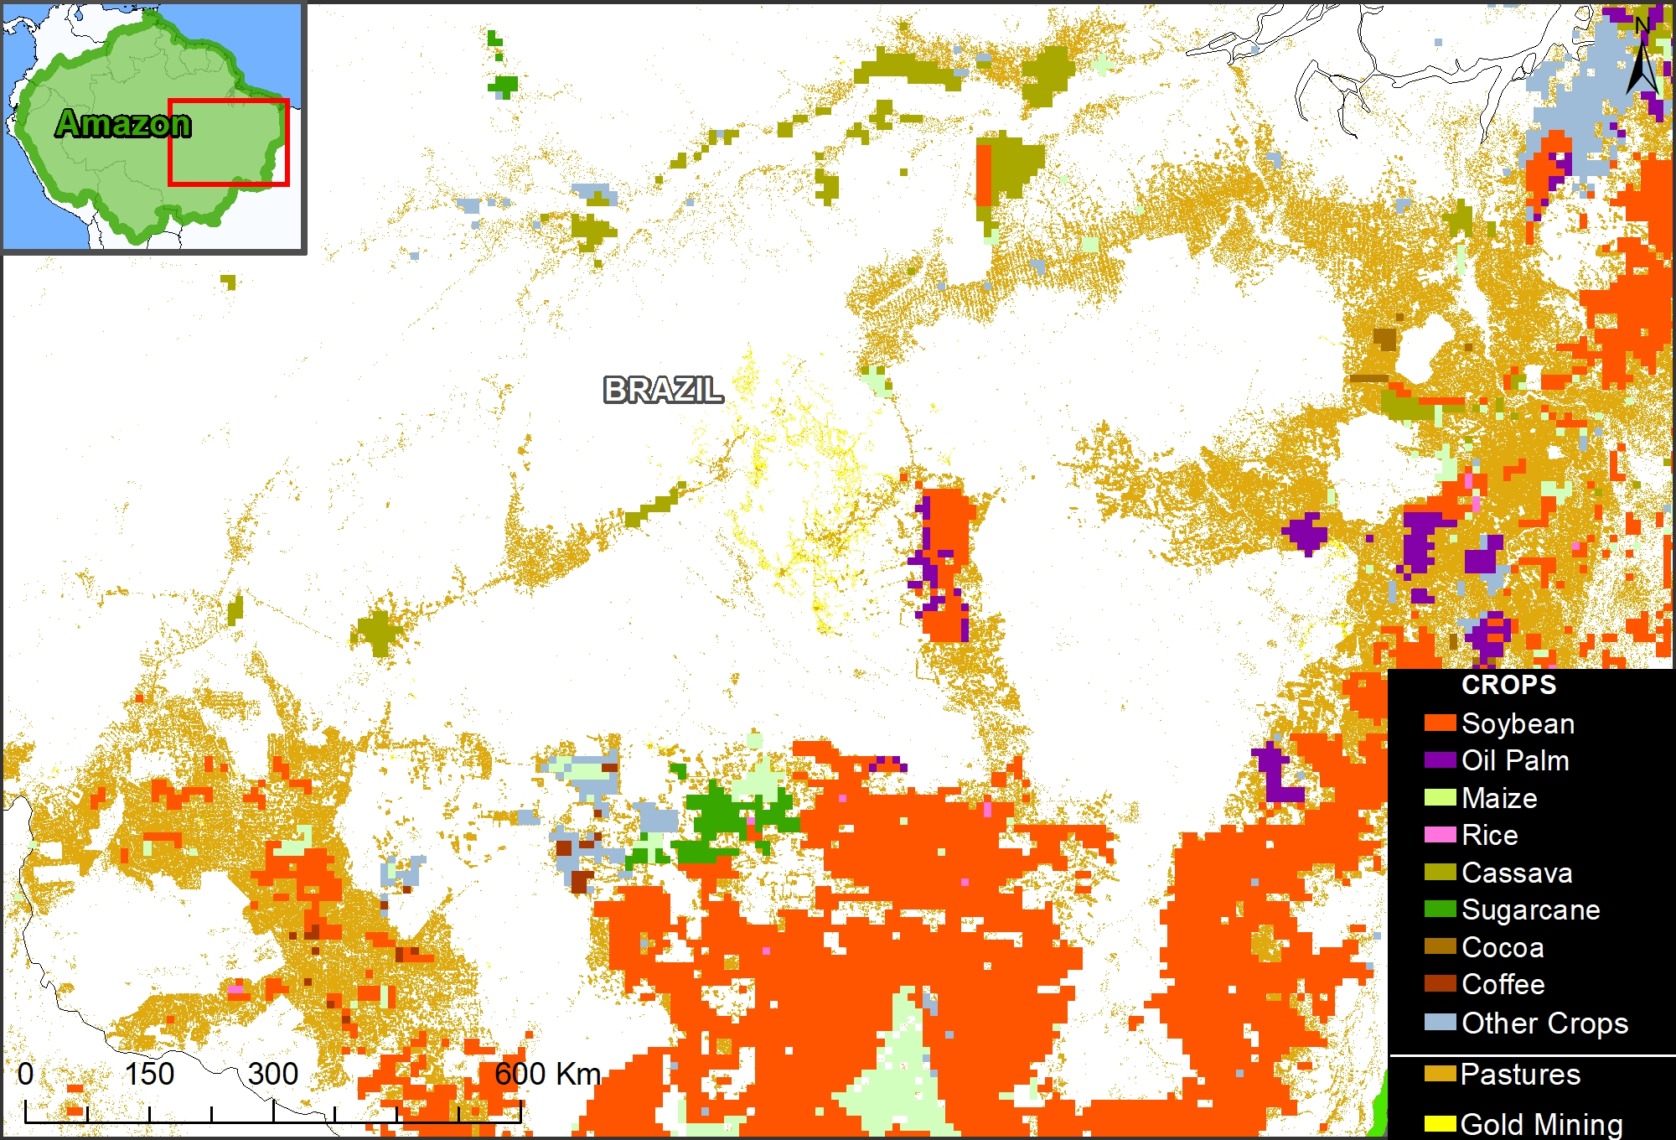
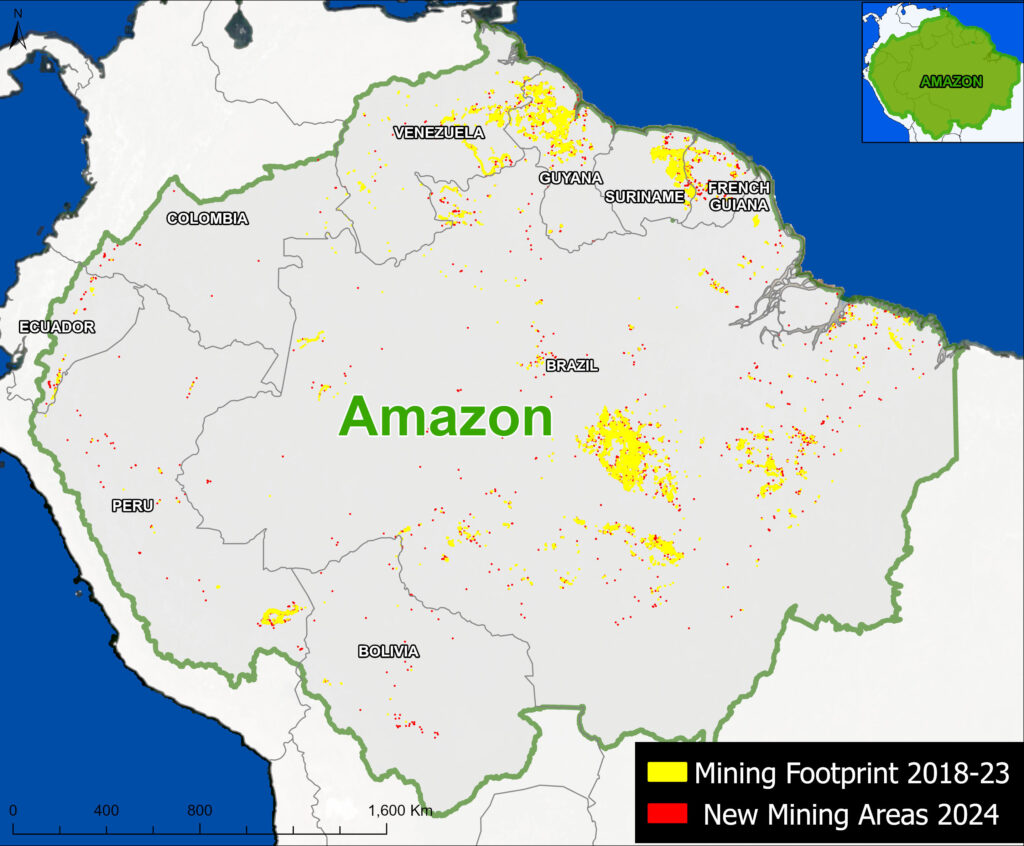
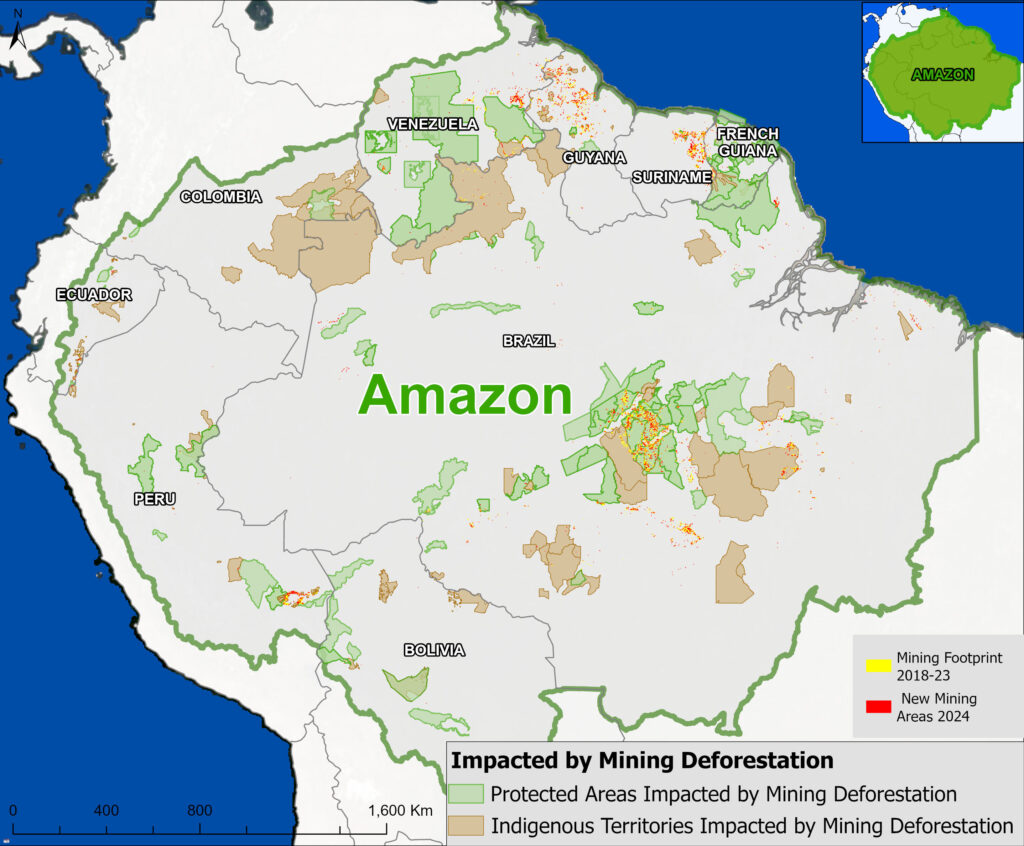
The Base Map below presents the gold mining footprint across the Amazon, as detected by the AMW algorithm. This data serves as our estimate of gold mining deforestation.
Yellow indicates the accumulated mining deforestation footprint for the years 2018- 2023; that is, all areas that the algorithm classified as a mining site vs other types of terrain, such as forest or agriculture. Red indicates the new mining areas detected in 2024.
Three major Amazon gold mining regions stand out: southeast Brazil (between the Tapajos, Xingu, and Tocantis Rivers), Guyana Shield (Venezuela, Guyana, Suriname, and French Guiana), and southern Peru (Madre de Dios).
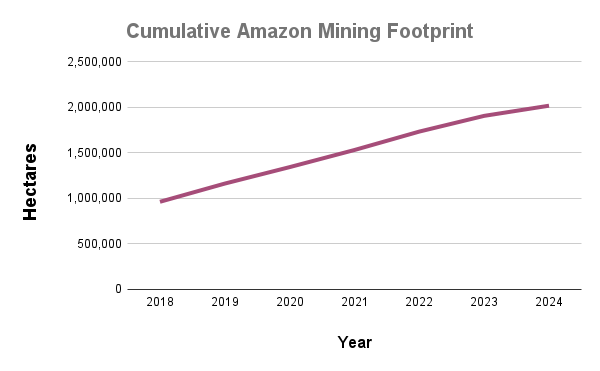
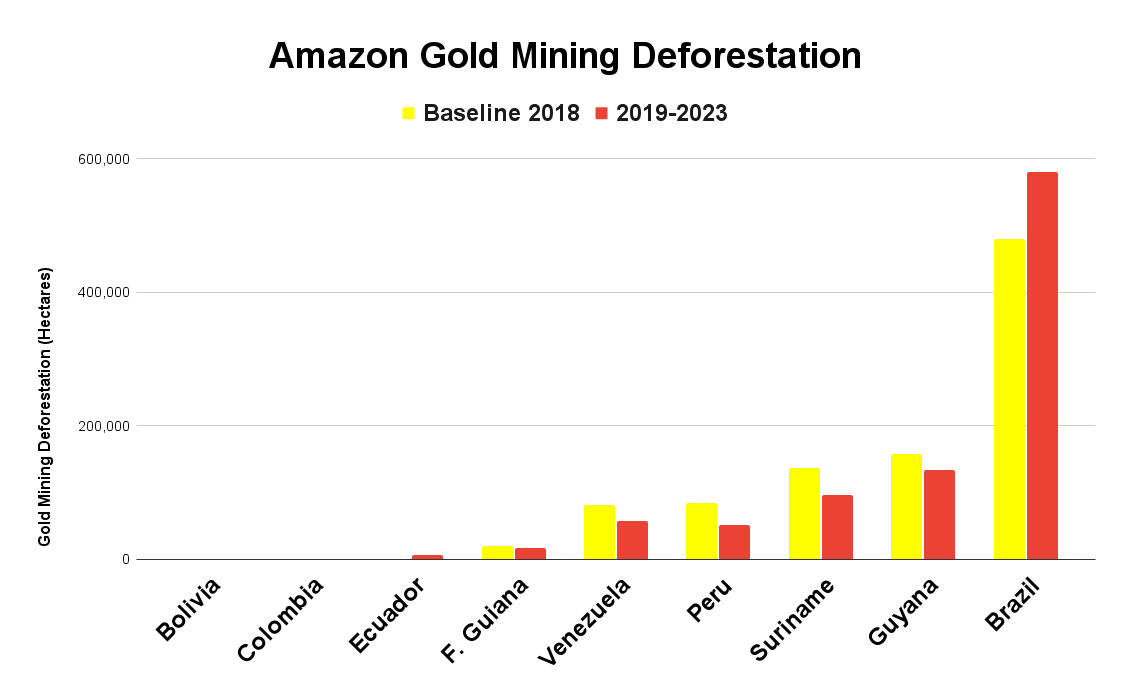
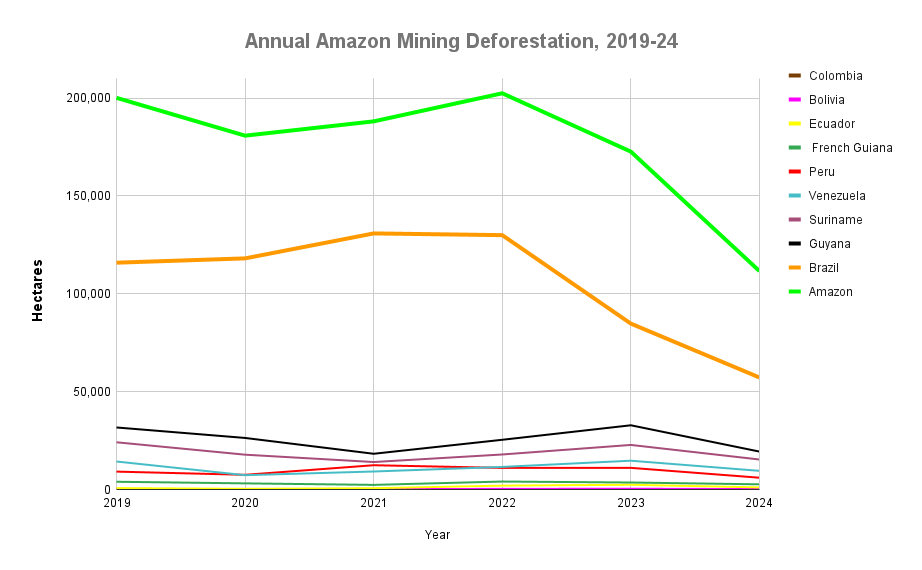
Graph 1 quantifies the spatial data detected by the AMW algorithm.
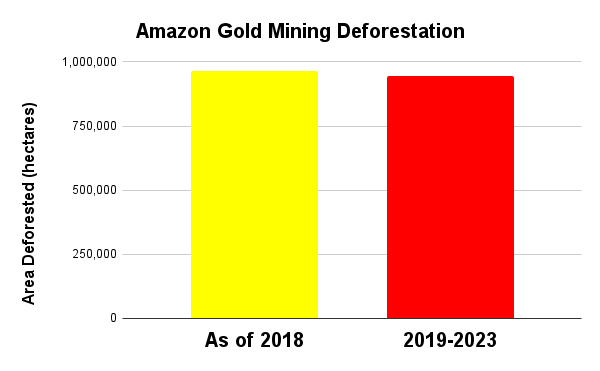
The cumulative mining deforestation footprint in 2024 was 2.02 million hectares (4.99 million acres)
For context, the initial mining deforestation footprint was around 970,000 hectares in 2018, the first year of Amazon Mining Watch data.
Between 2019 and 2024, we estimate that the gold mining deforestation grew by 1.06 million hectares (2.61 million acres).
Thus, over half (52.3%) of the cumulative footprint has occurred in just the past six years.
Graph 2 shows that, of the total accumulated mining (2.02 million hectares), over half has occurred in Brazil (55.3%), followed by Guyana (15.4%), Suriname (12.4%), Venezuela (7.3%), and Peru (7.0%).
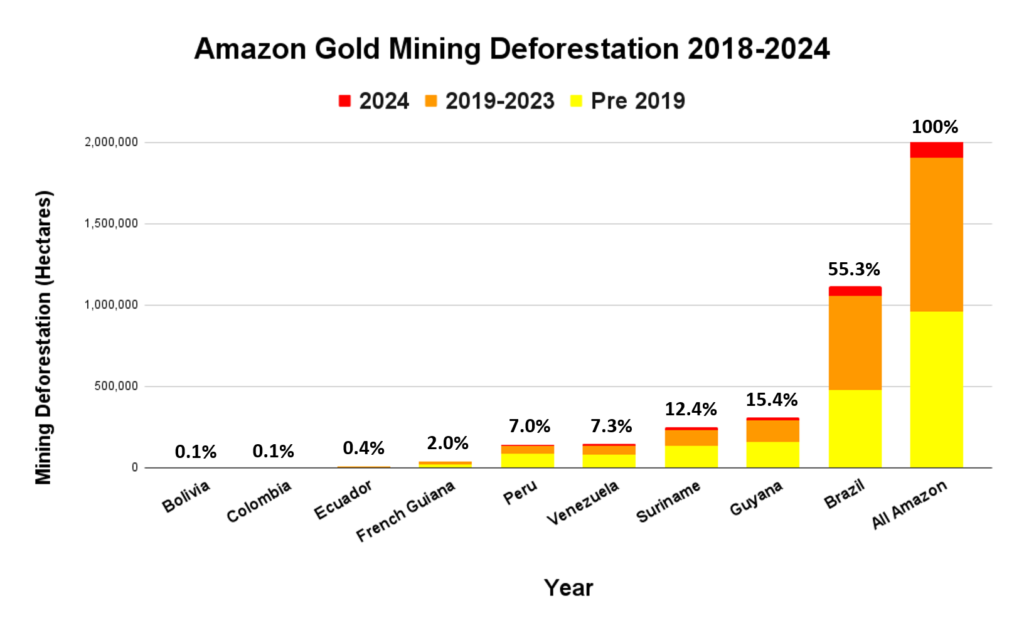
Graph 3 digs deeper into the AMW data, revealing additional trends between years. This data highlights the annual changes in detected mining deforestation. Note the trend across the entire Amazon at the top in green for overall context, followed by each country. Note that Brazil (orange line) accounts for much of the annual mining (over 50%).
In 2024, we documented the new gold mining deforestation of 111,603 hectares (275,777 acres). This total represents a decrease of 35% relative to the previous year 2023 and 45% relative to the peak year 2022.
The countries with the highest levels of new gold mining deforestation in 2024 were 1) Brazil (57,240 ha), 2) Guyana (19,372 ha), 3) Suriname (15,323 ha), 4) Venezuela (9,531 ha), and 5) Peru (6,020 ha). However, all five of these countries saw a major decrease in 2024, between 33% (Brazil and Suriname) and 46% (Peru).
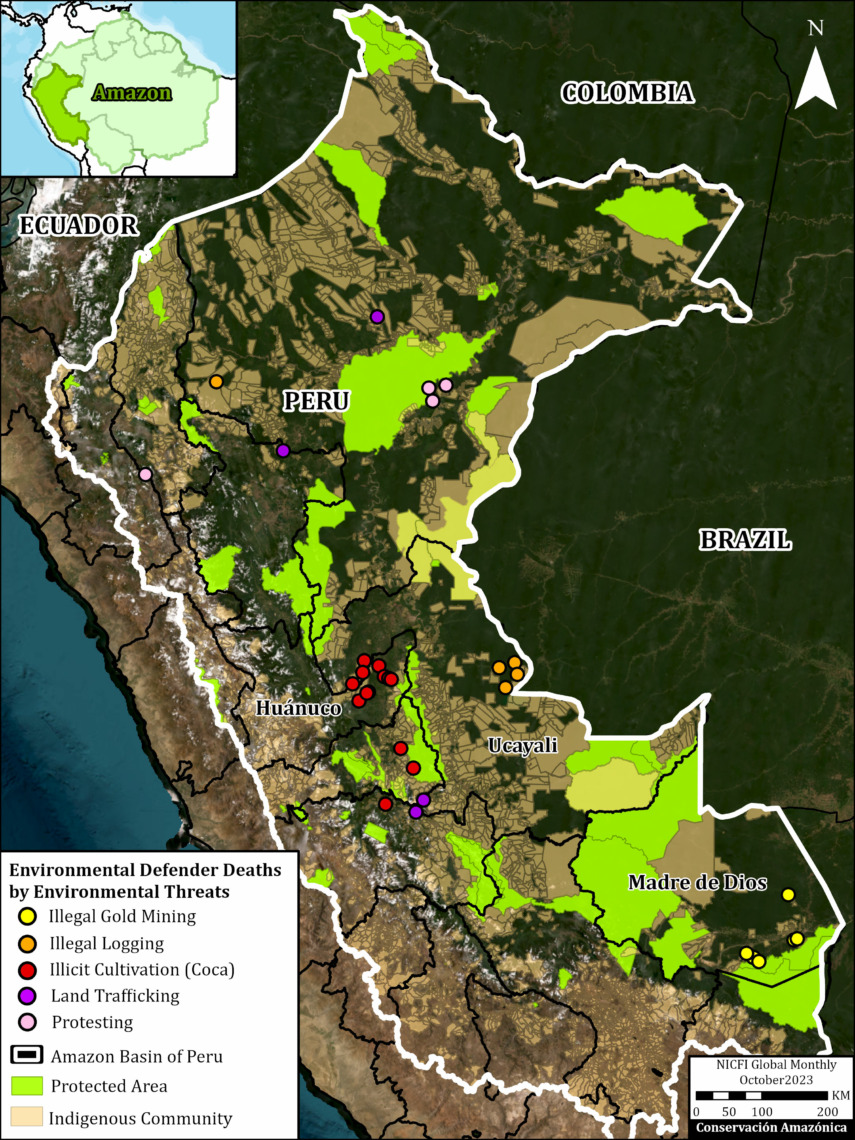
Protected Areas & Indigenous Territories
We estimate that 36% of the accumulated mining deforestation in 2024 (over 725,000 hectares) occurred within protected areas and Indigenous territories (Figure 1; Note 2), where much of it is likely illegal.
Notably, the vast majority of this overall mining deforestation in protected areas and Indigenous territories has occurred in Brazil (88%).
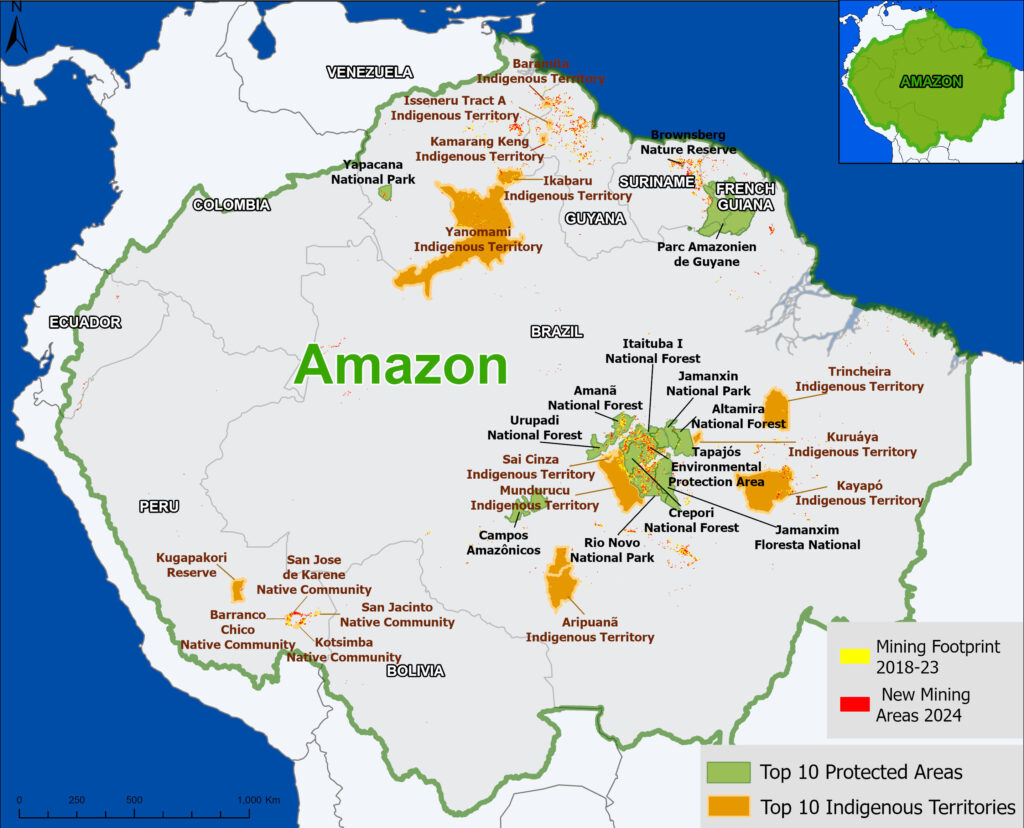
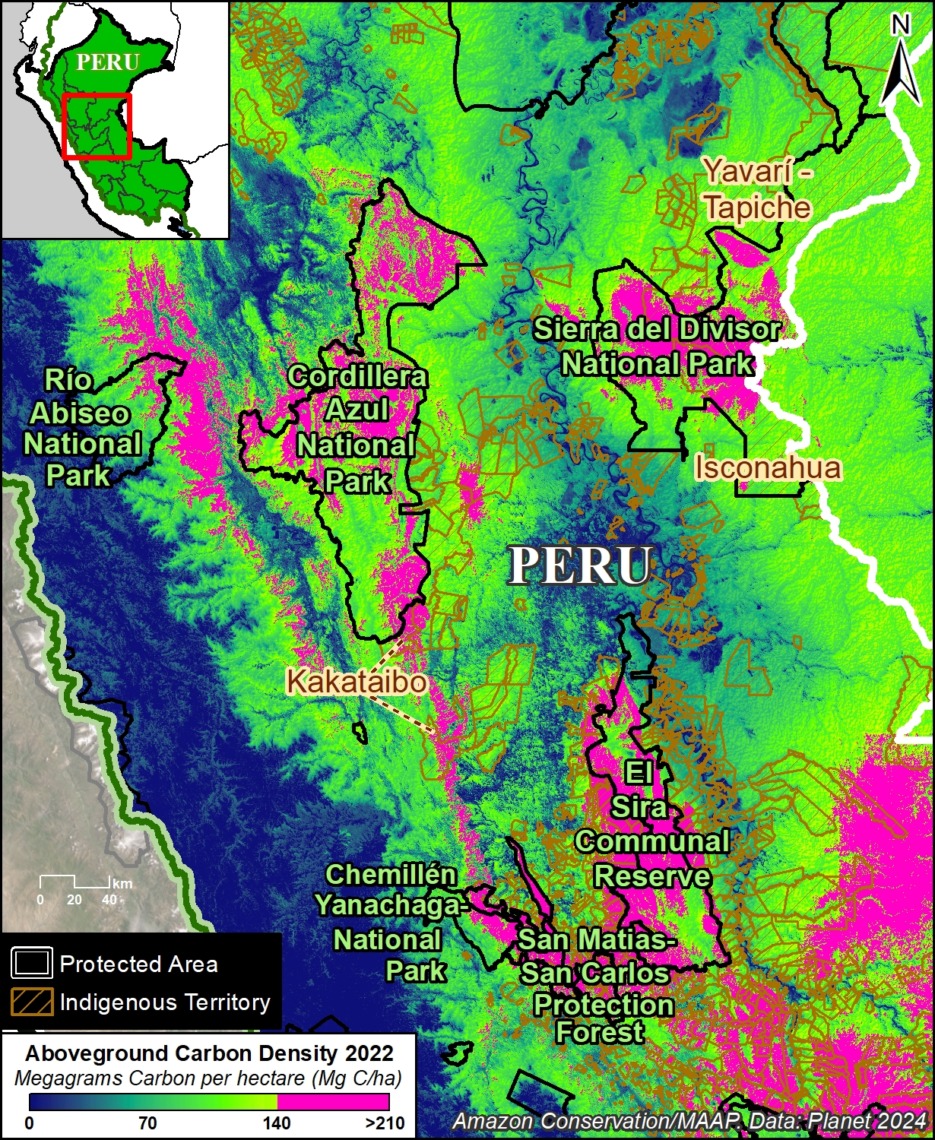
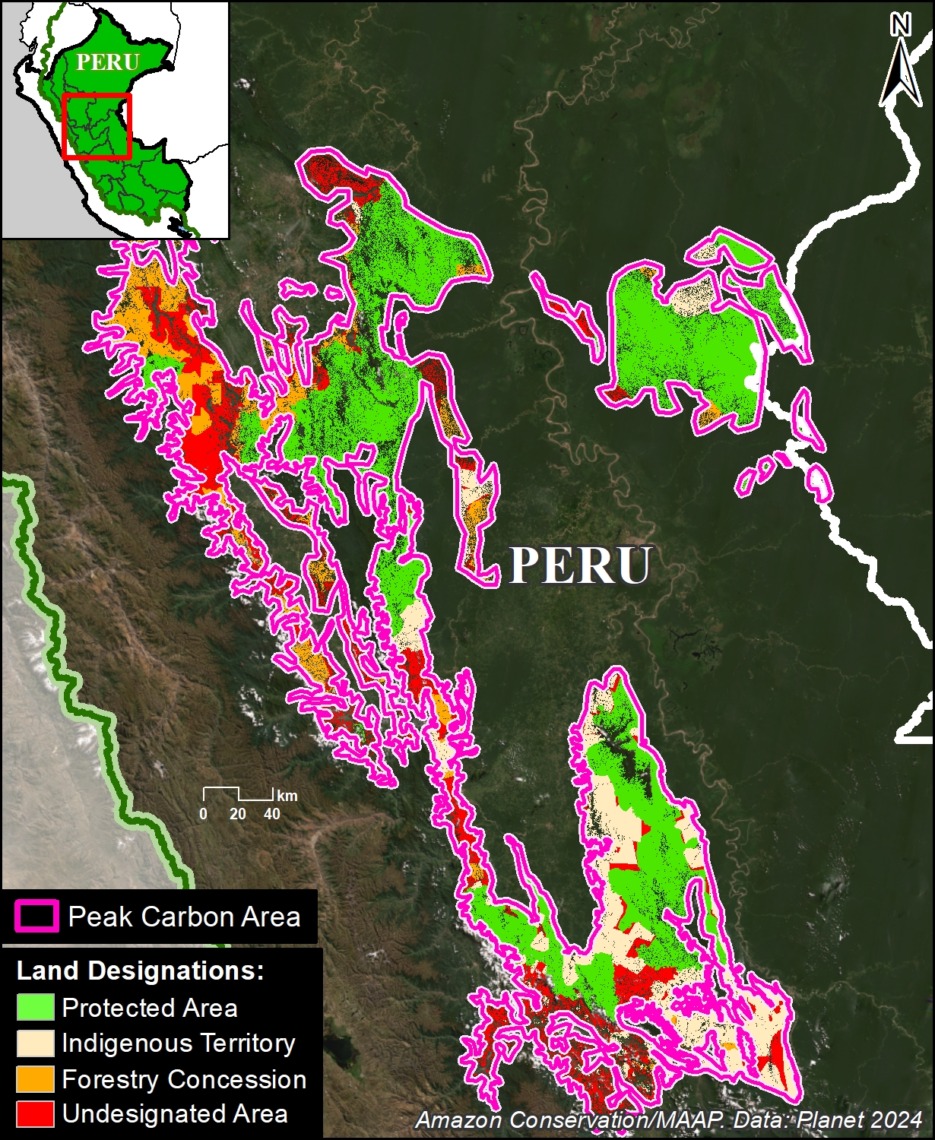
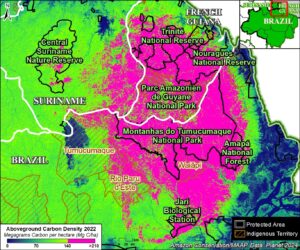
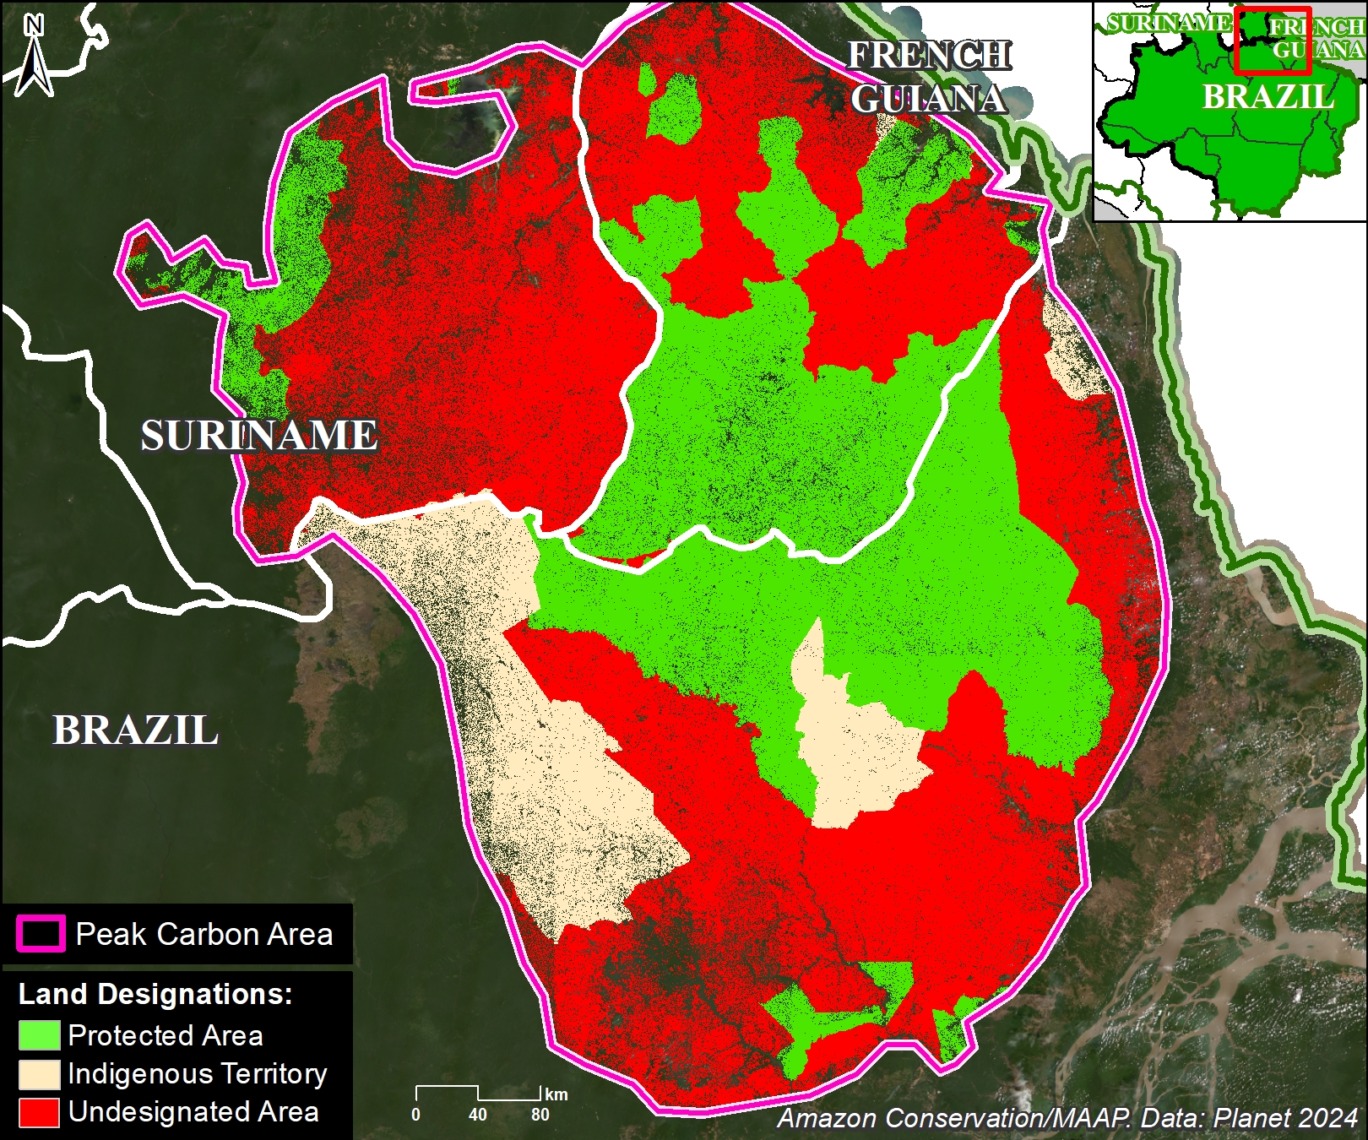
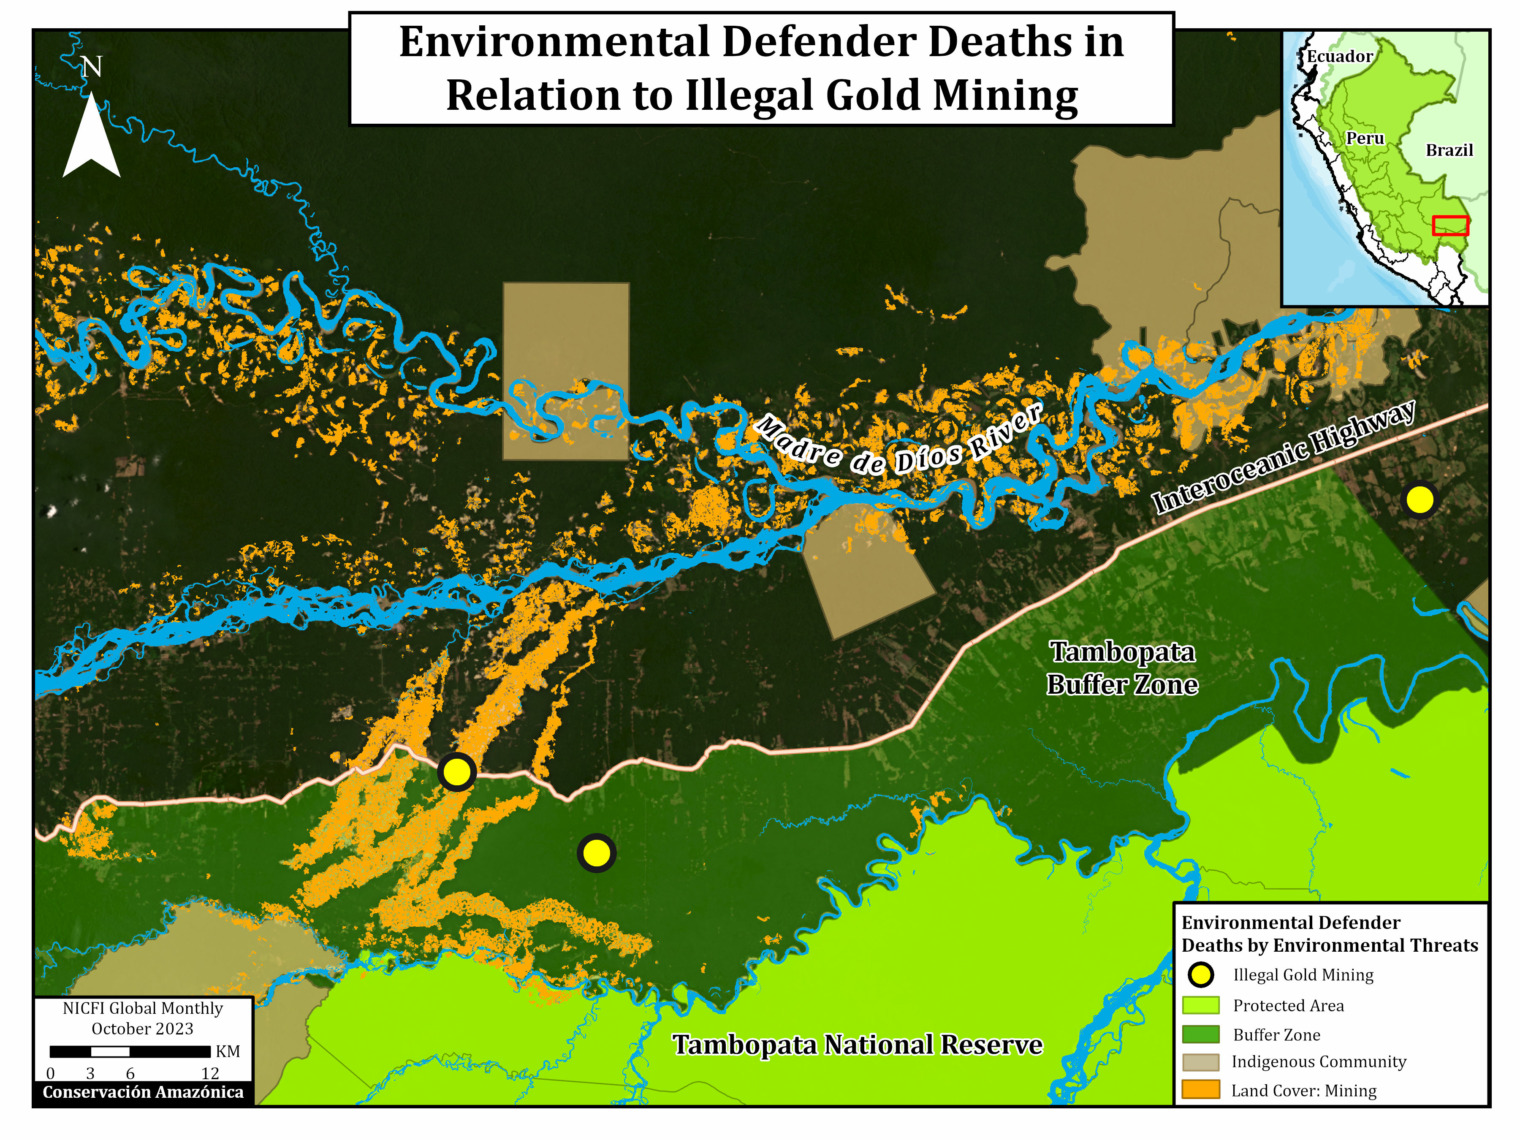
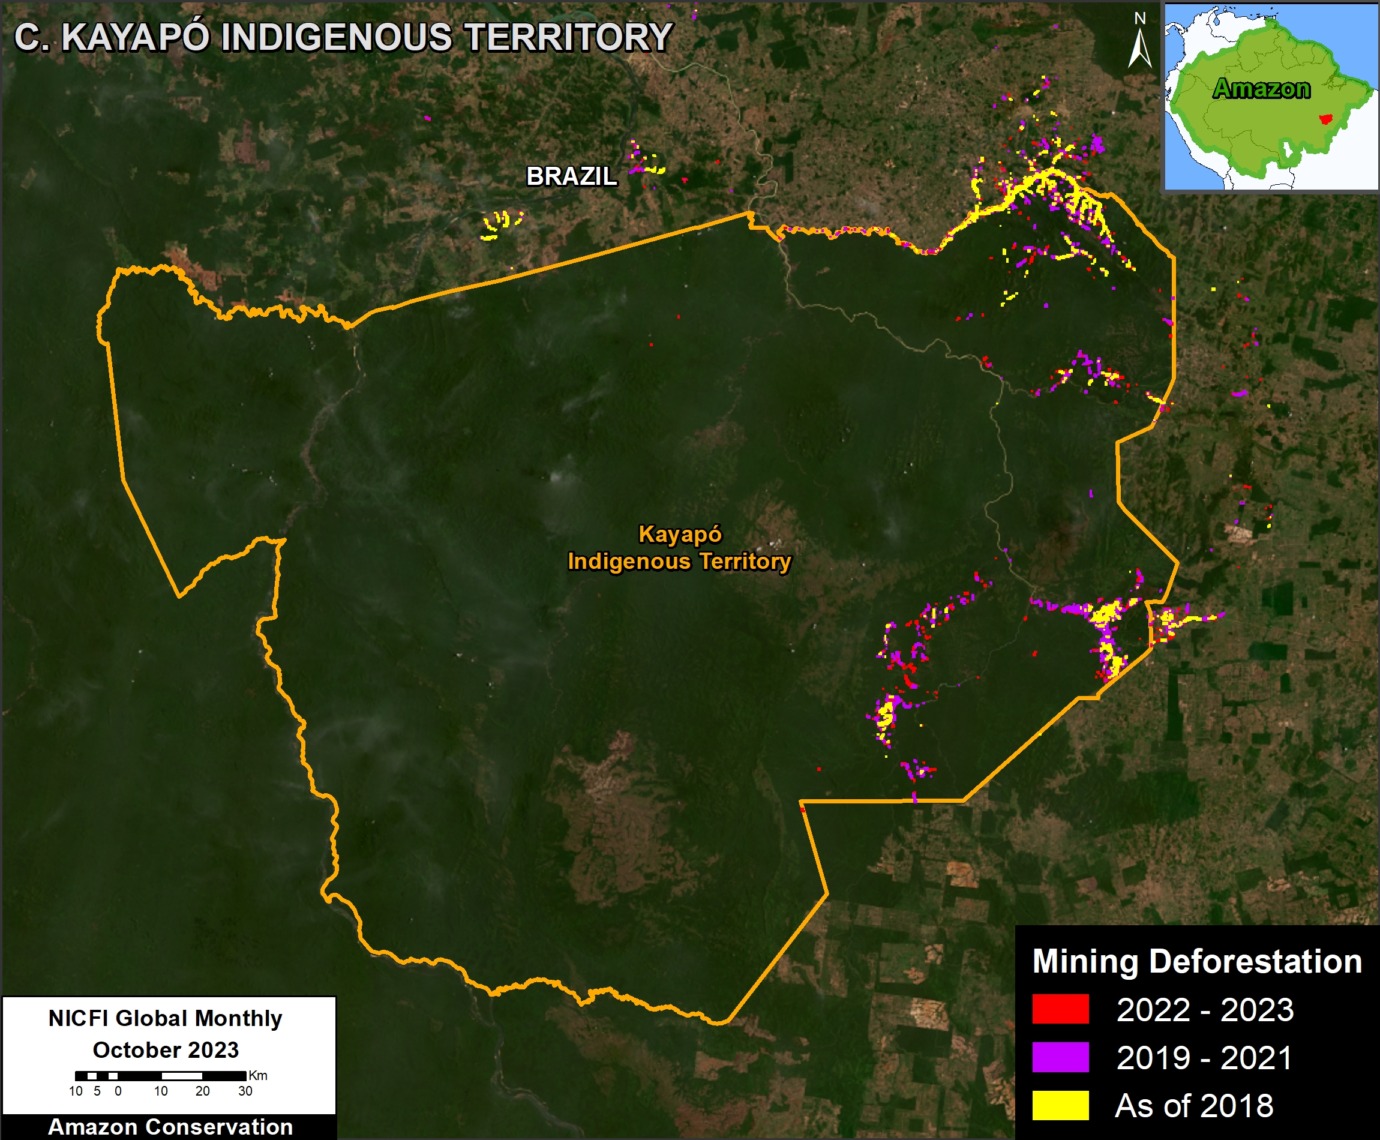
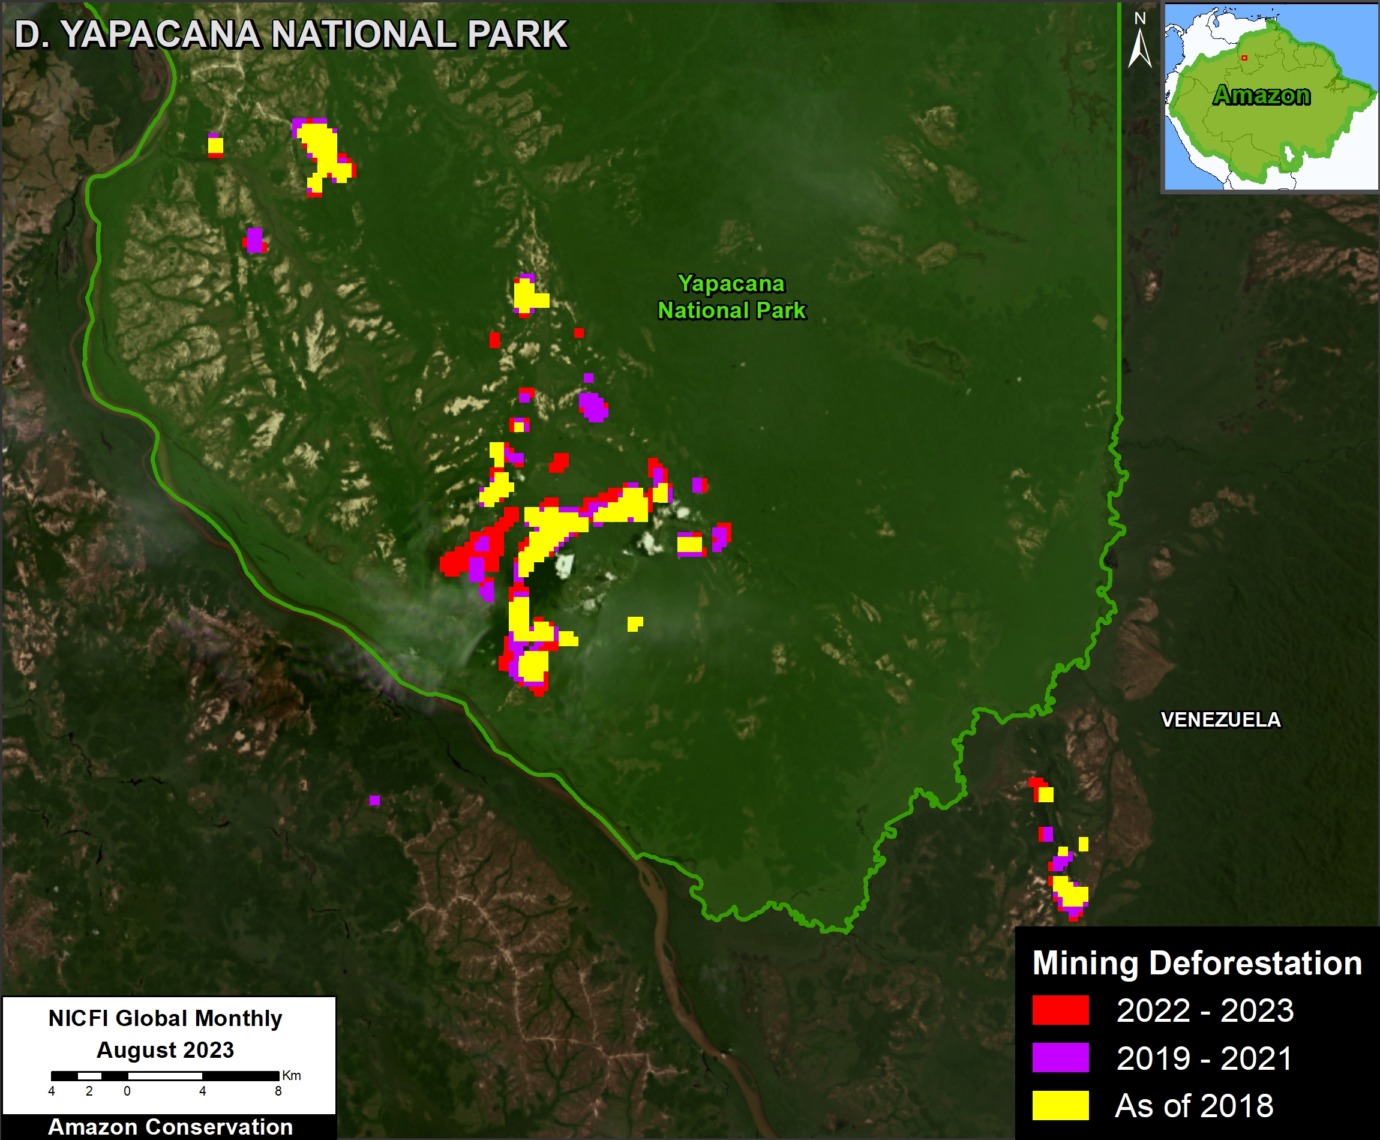
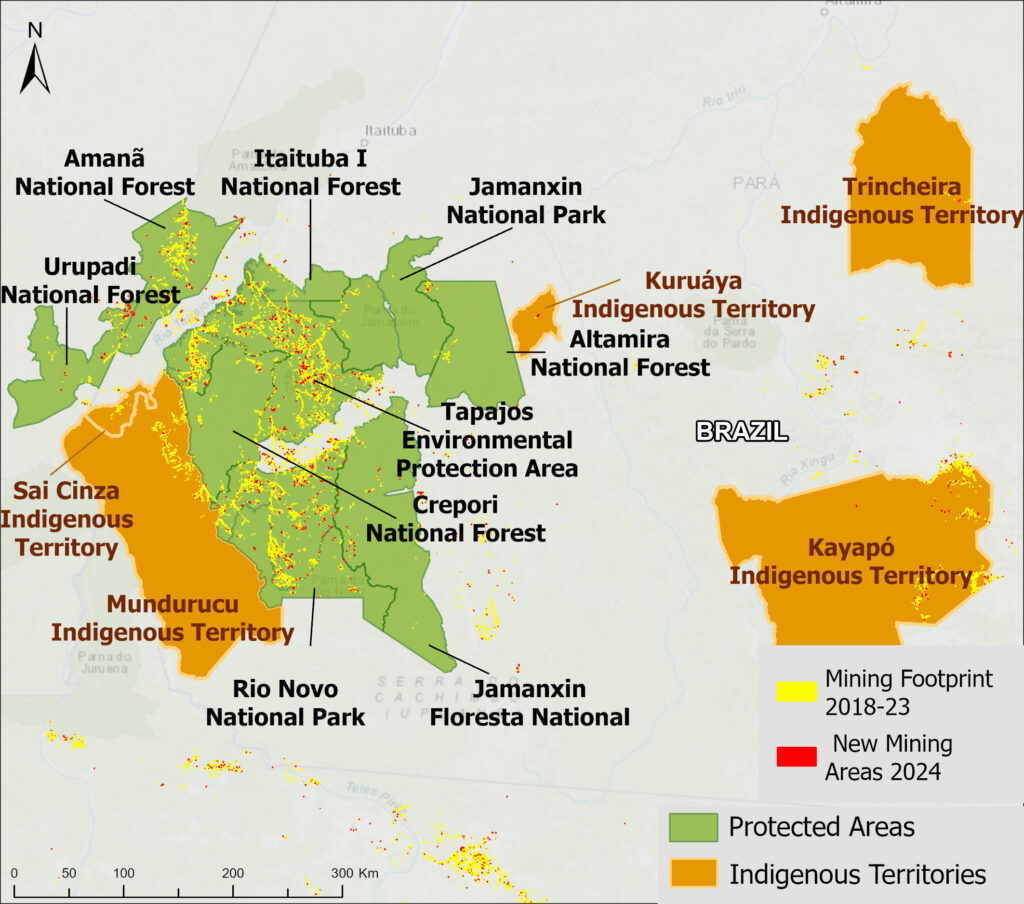
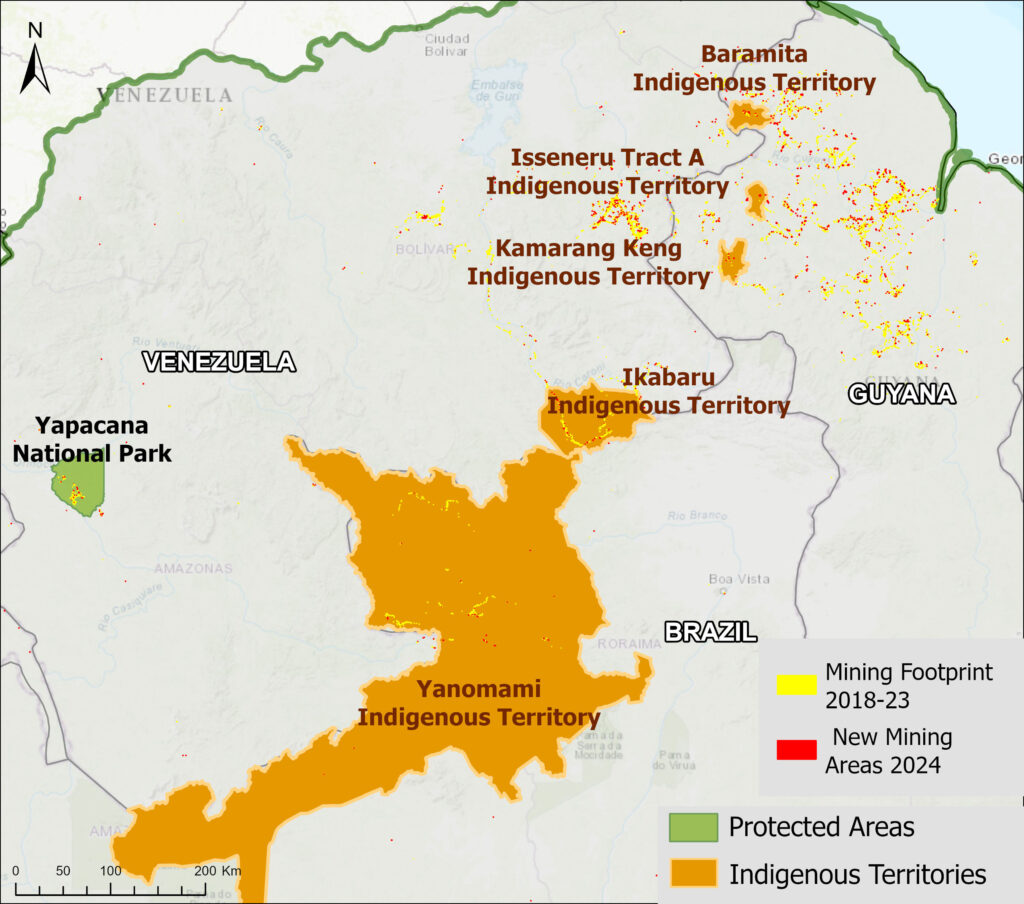
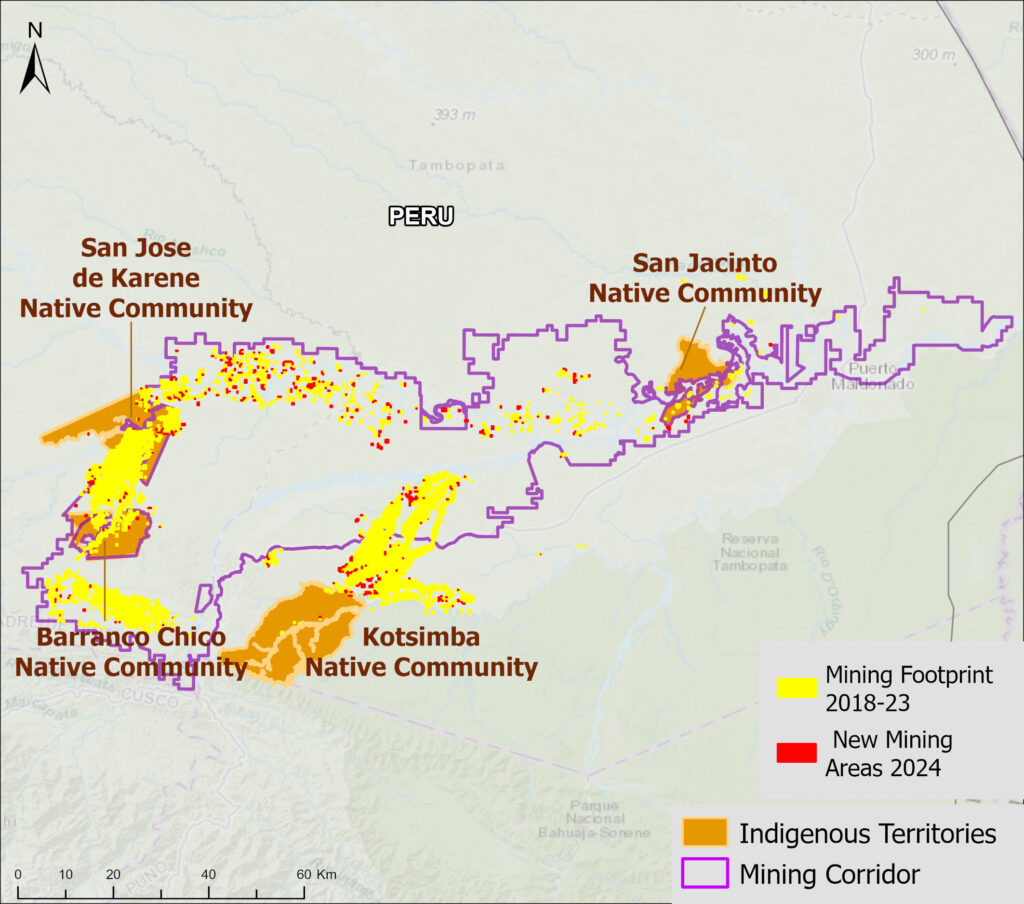
Figure 2a illustrates the top ten for both protected areas and Indigenous territories, in terms of both accumulated mining deforestation footprint and new mining deforestation in 2024. Figures 2b-d show zooms of the three main mining areas: southeast Brazil (2b), Guyana Shield (2c), and southern Peru (2d).
The top nine most impacted protected areas (in terms of accumulated footprint) are all in Brazil, led by Tapajós Environmental Protection Area. This area has lost over 377,000 hectares, followed by Amanã and Crepori National Forests, Rio Novo National Park, Urupadi, Jamanxim, and Itaituba National Forests, Jamanxim National Park, and Altamira National Forest. The top ten is rounded out by Yapacana National Park in Venezuela.
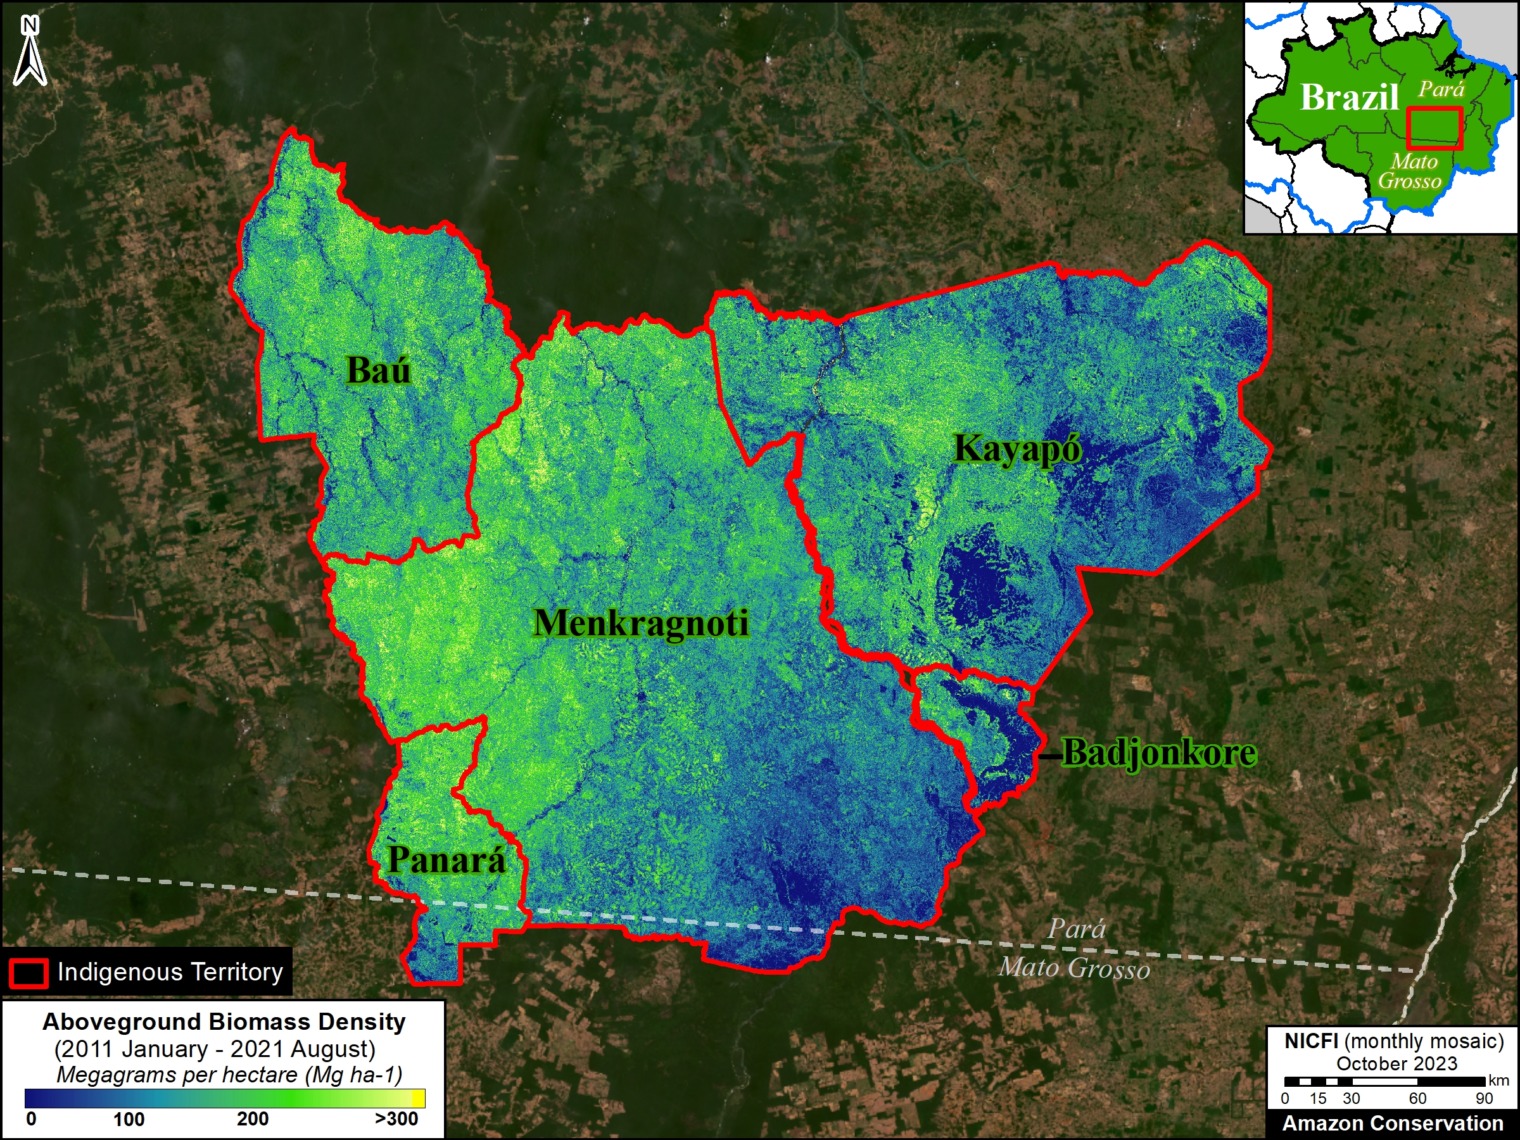
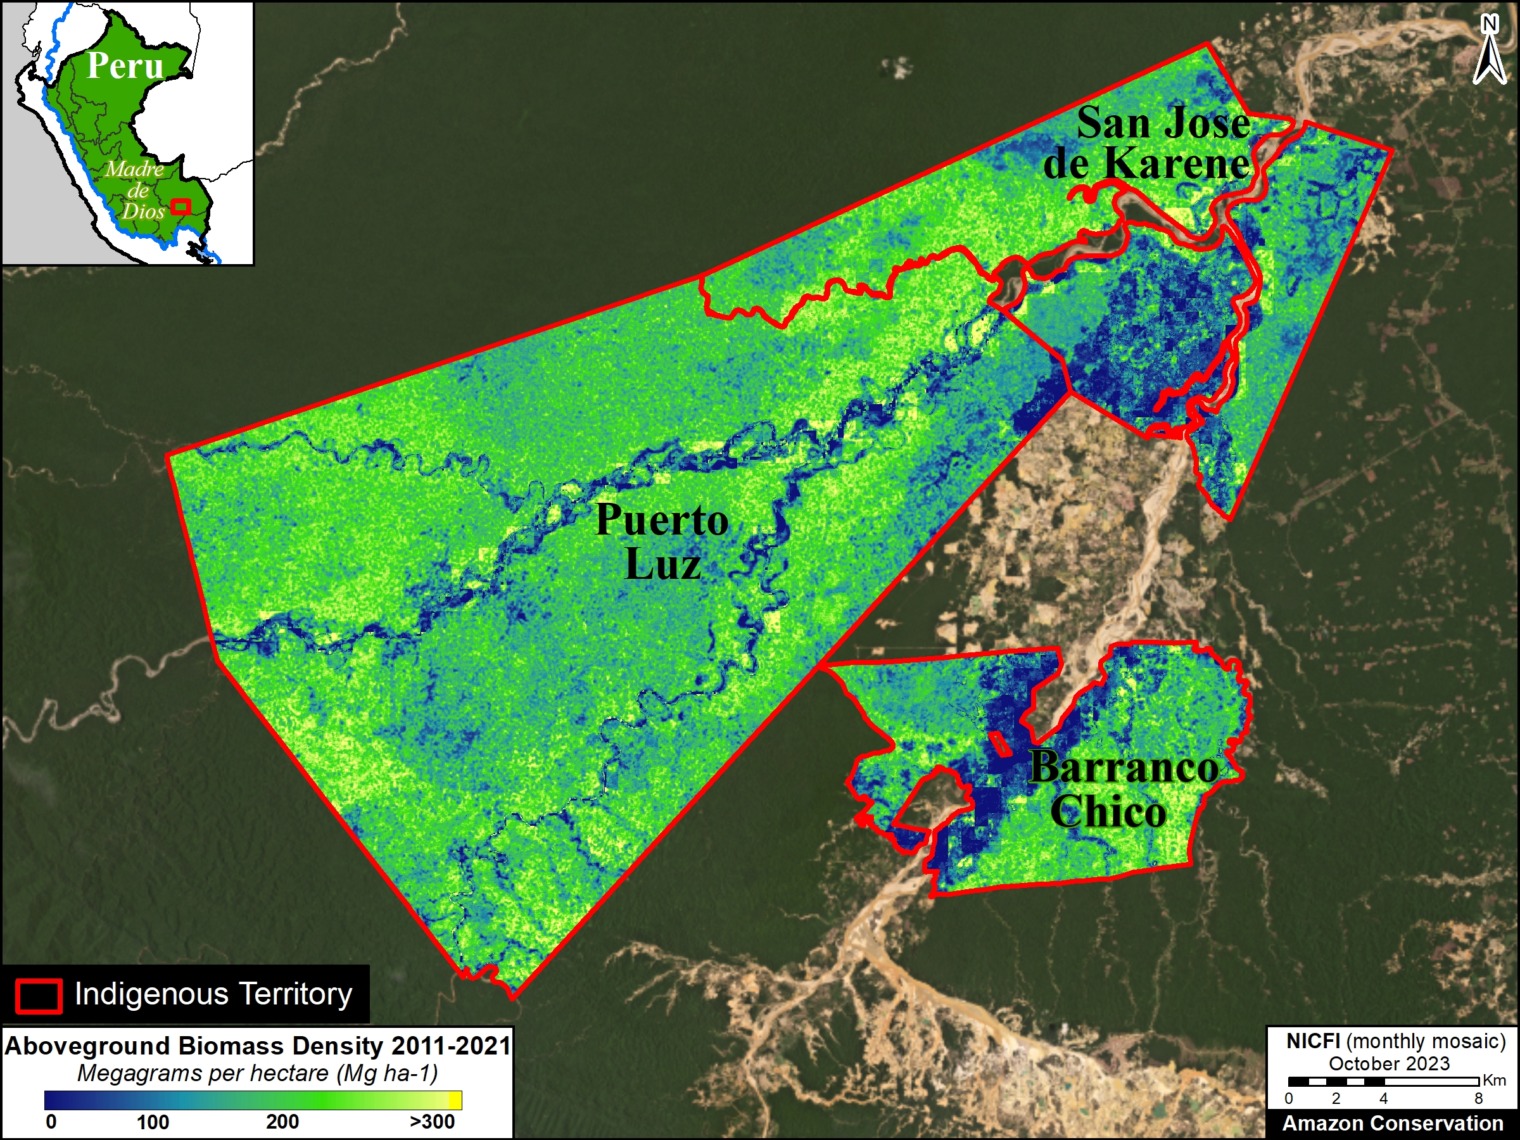
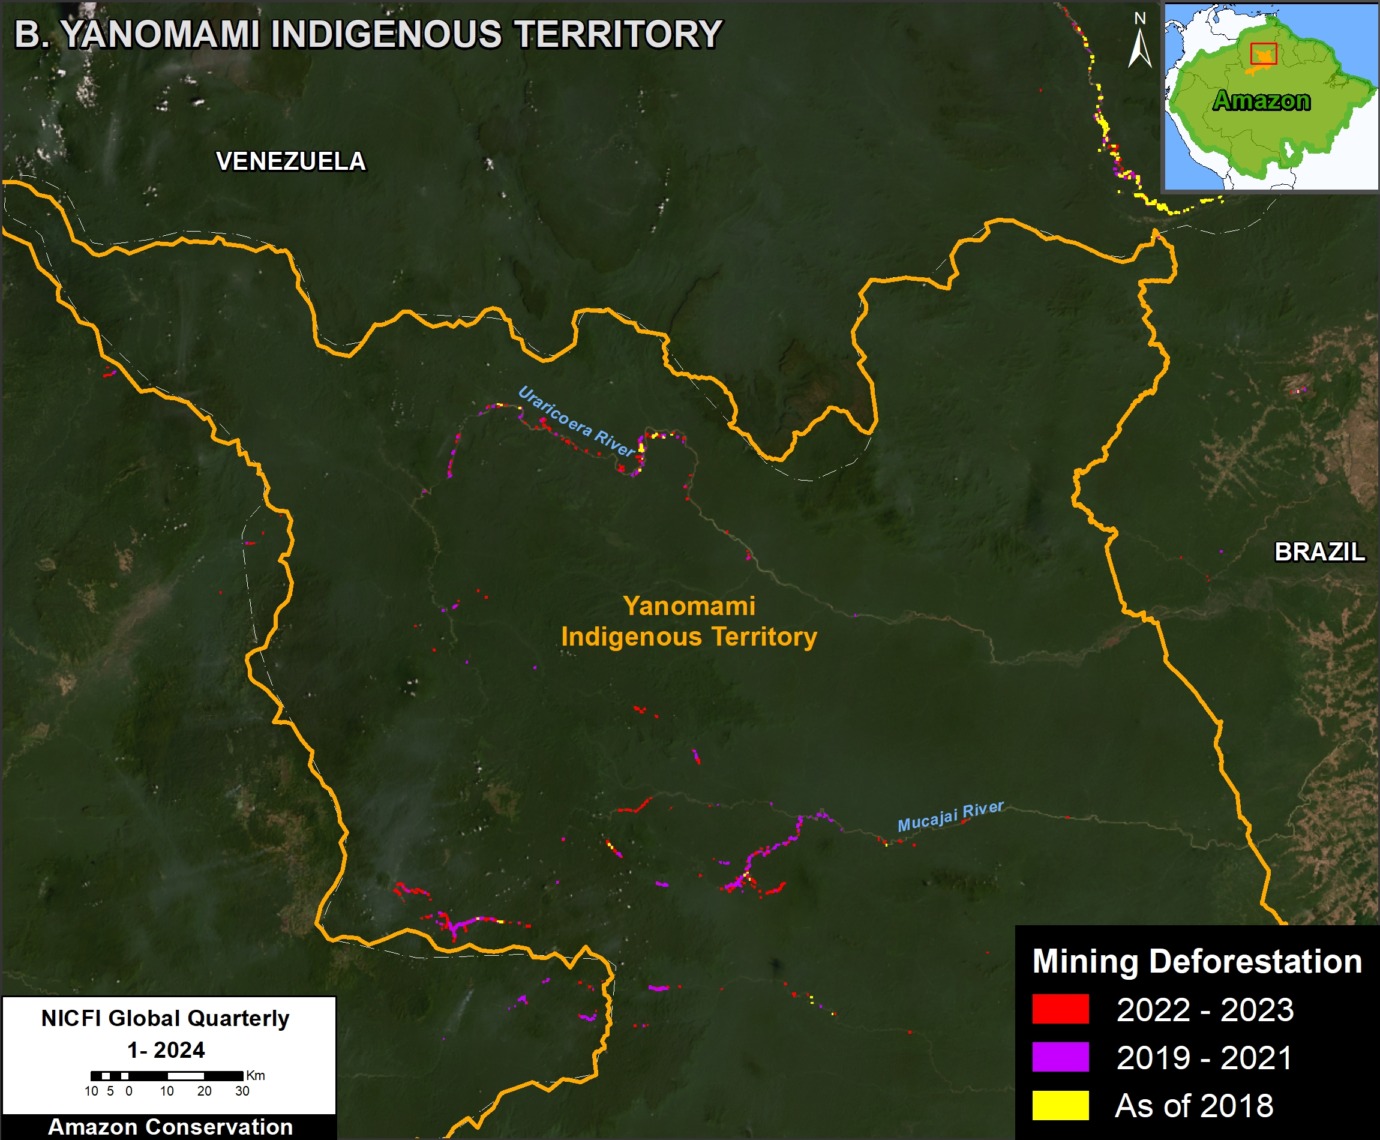
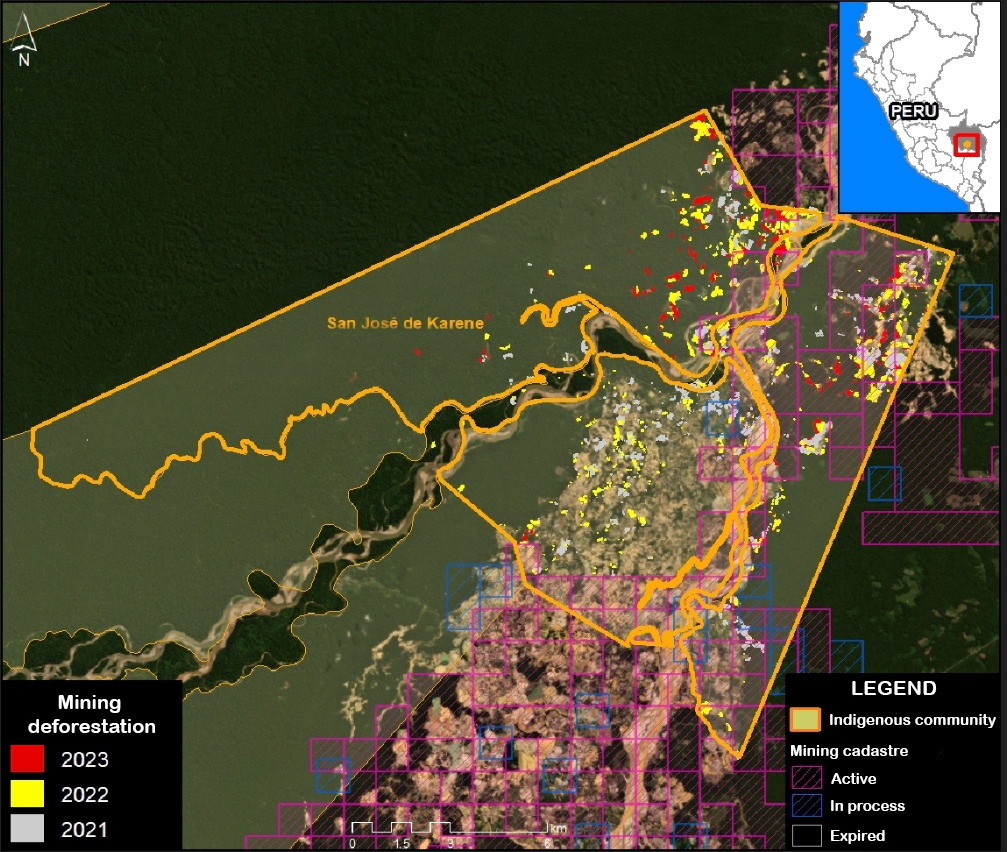
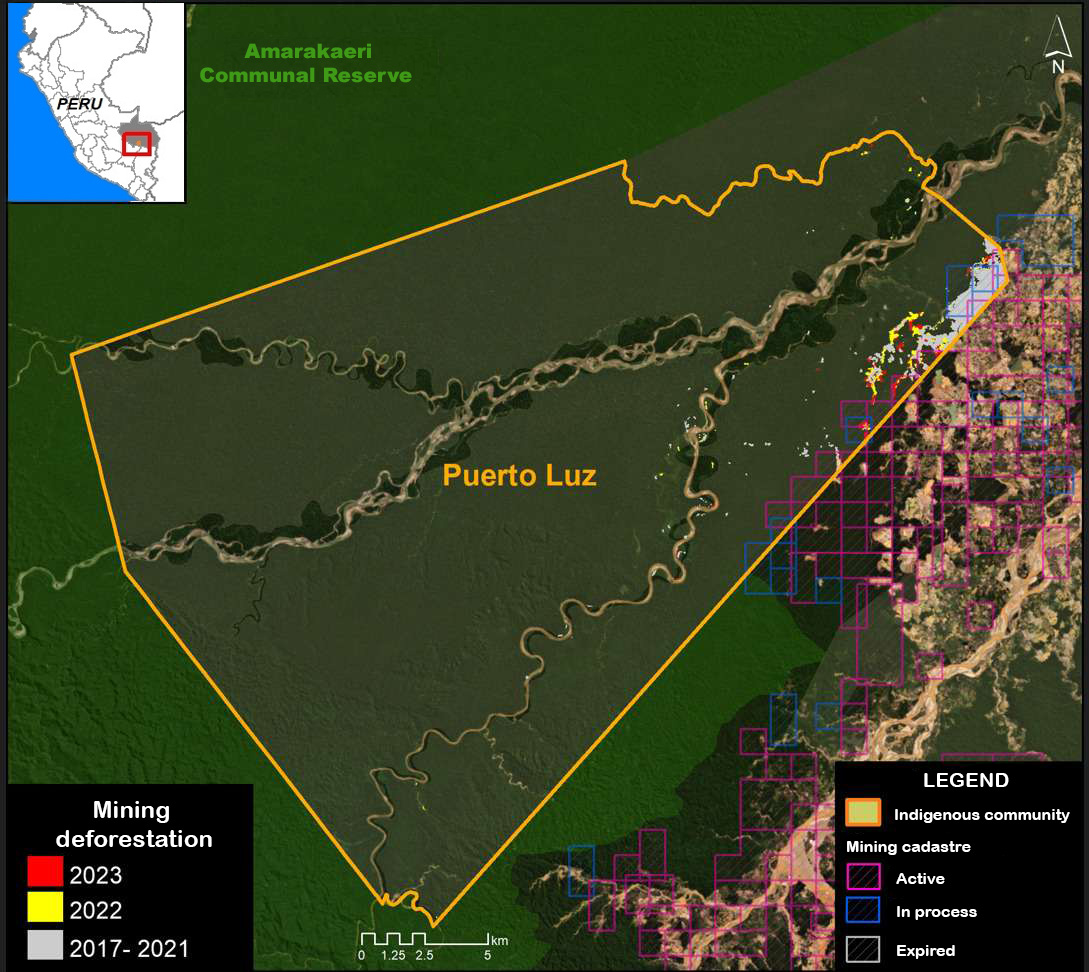
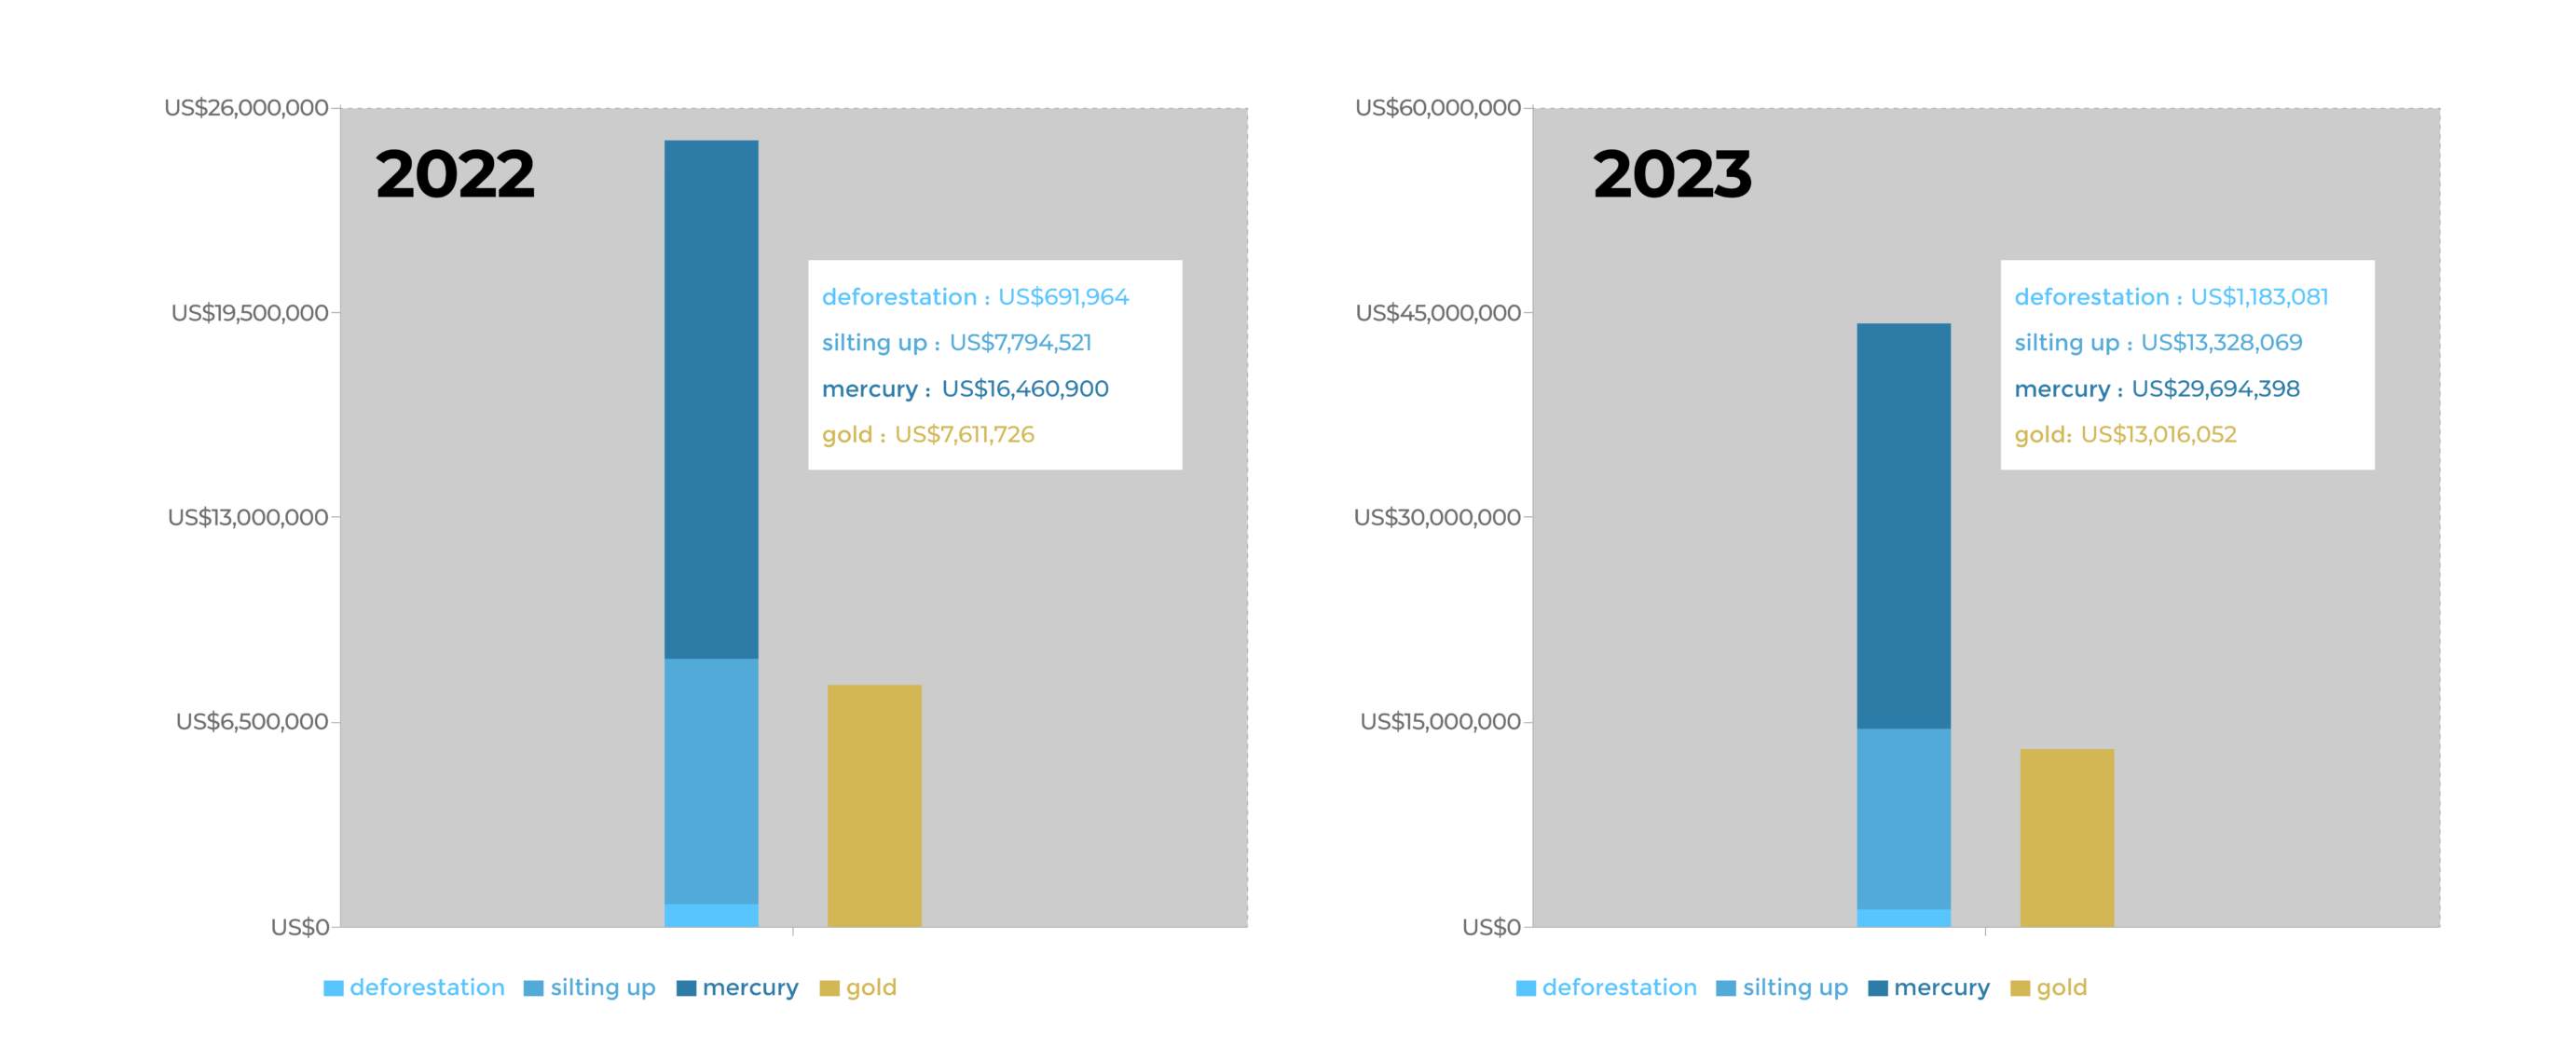
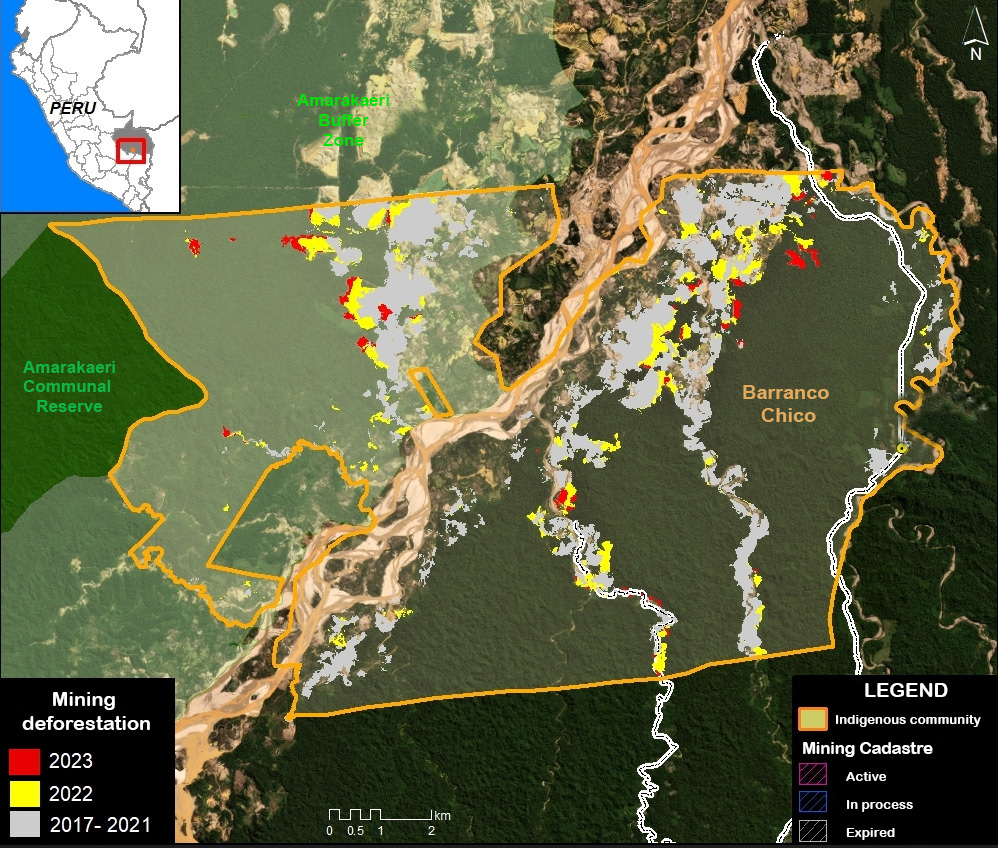
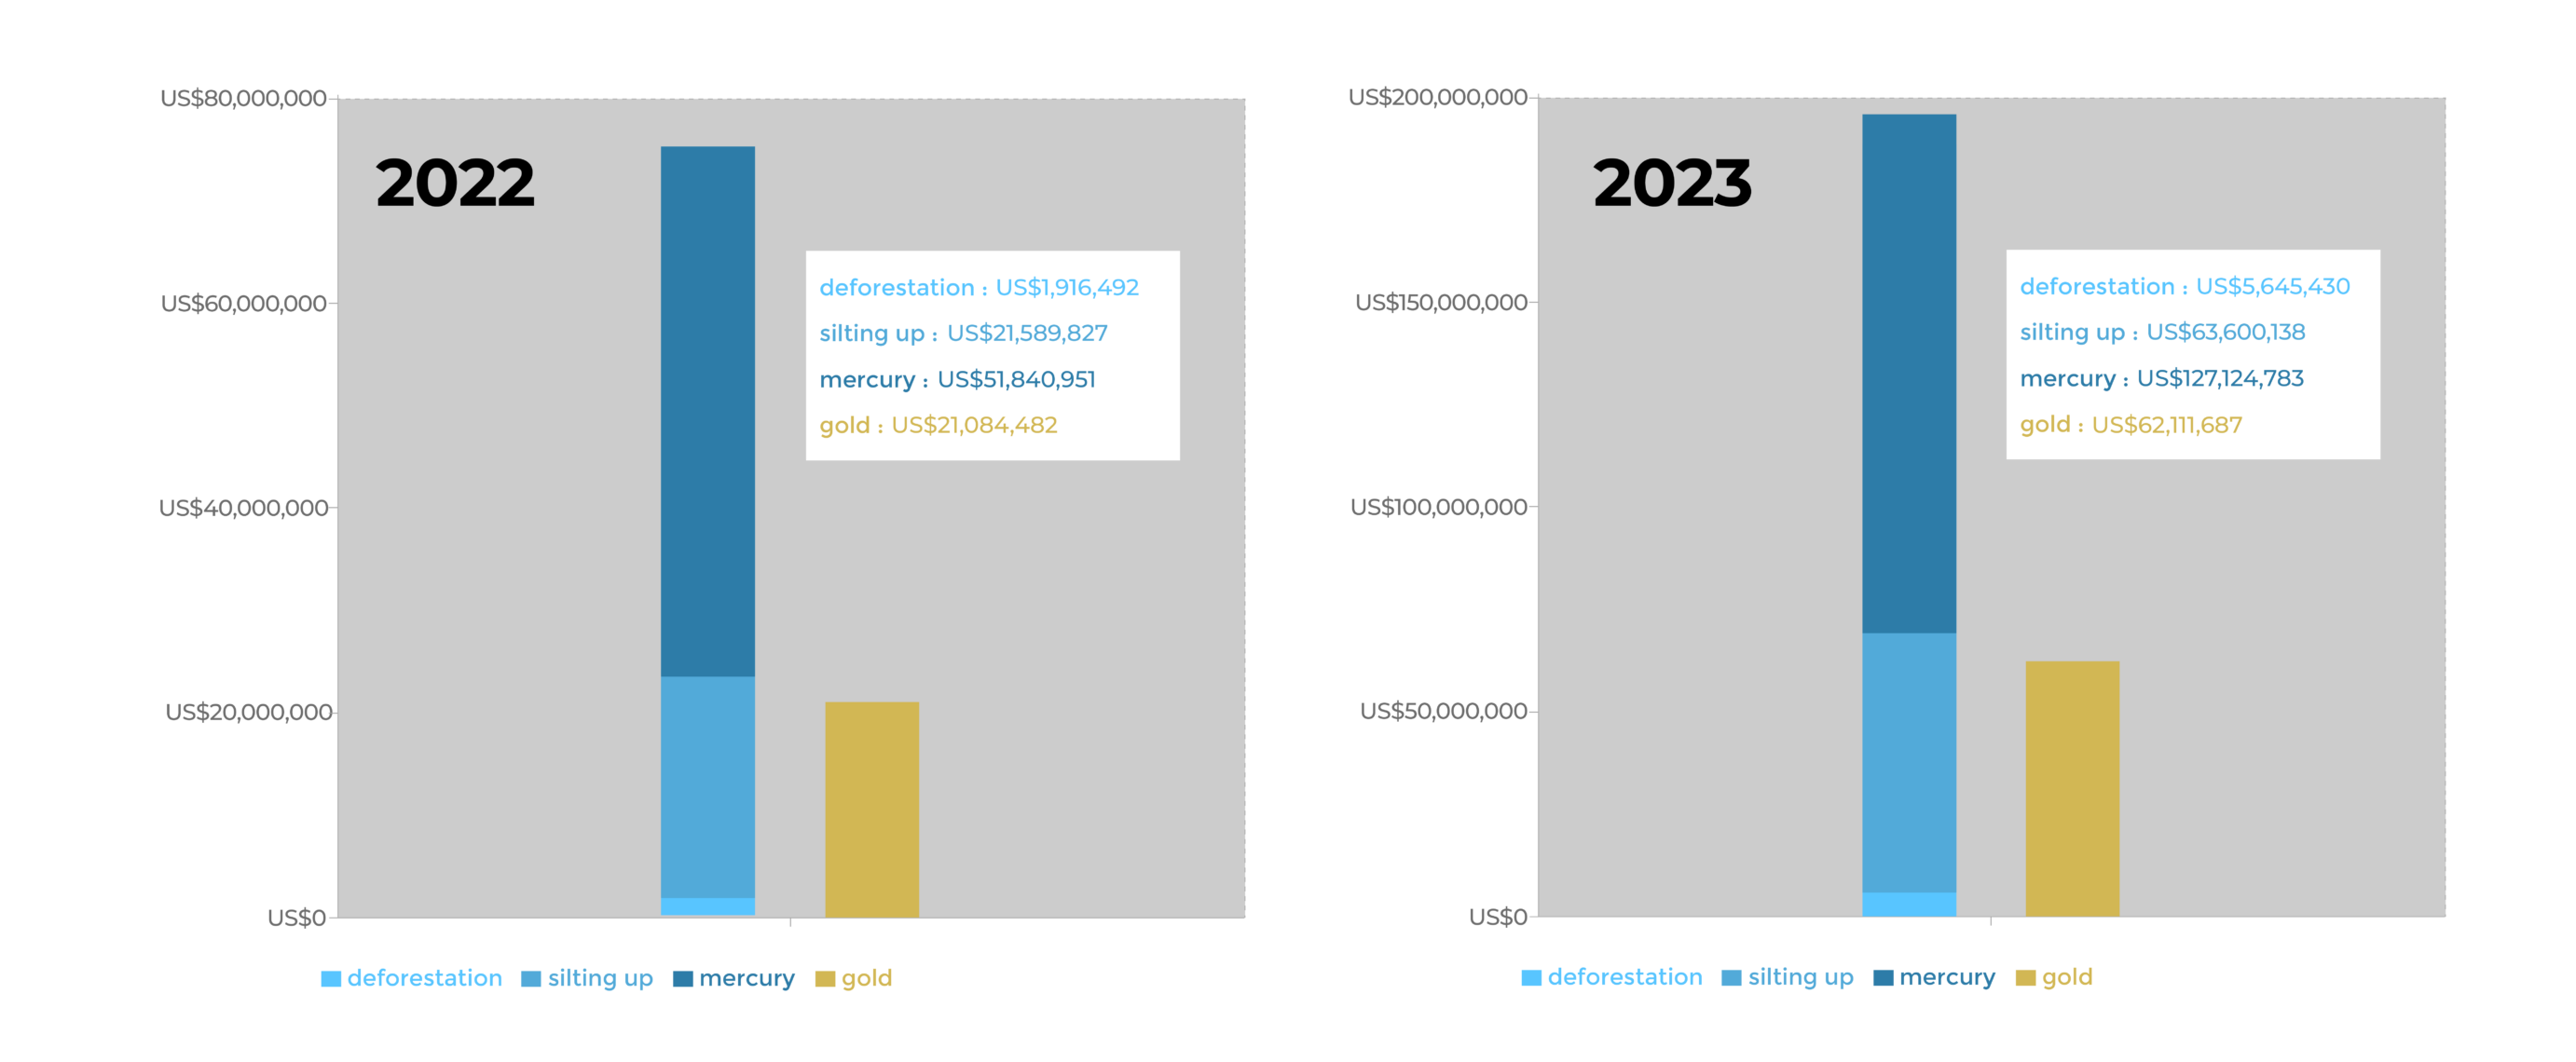
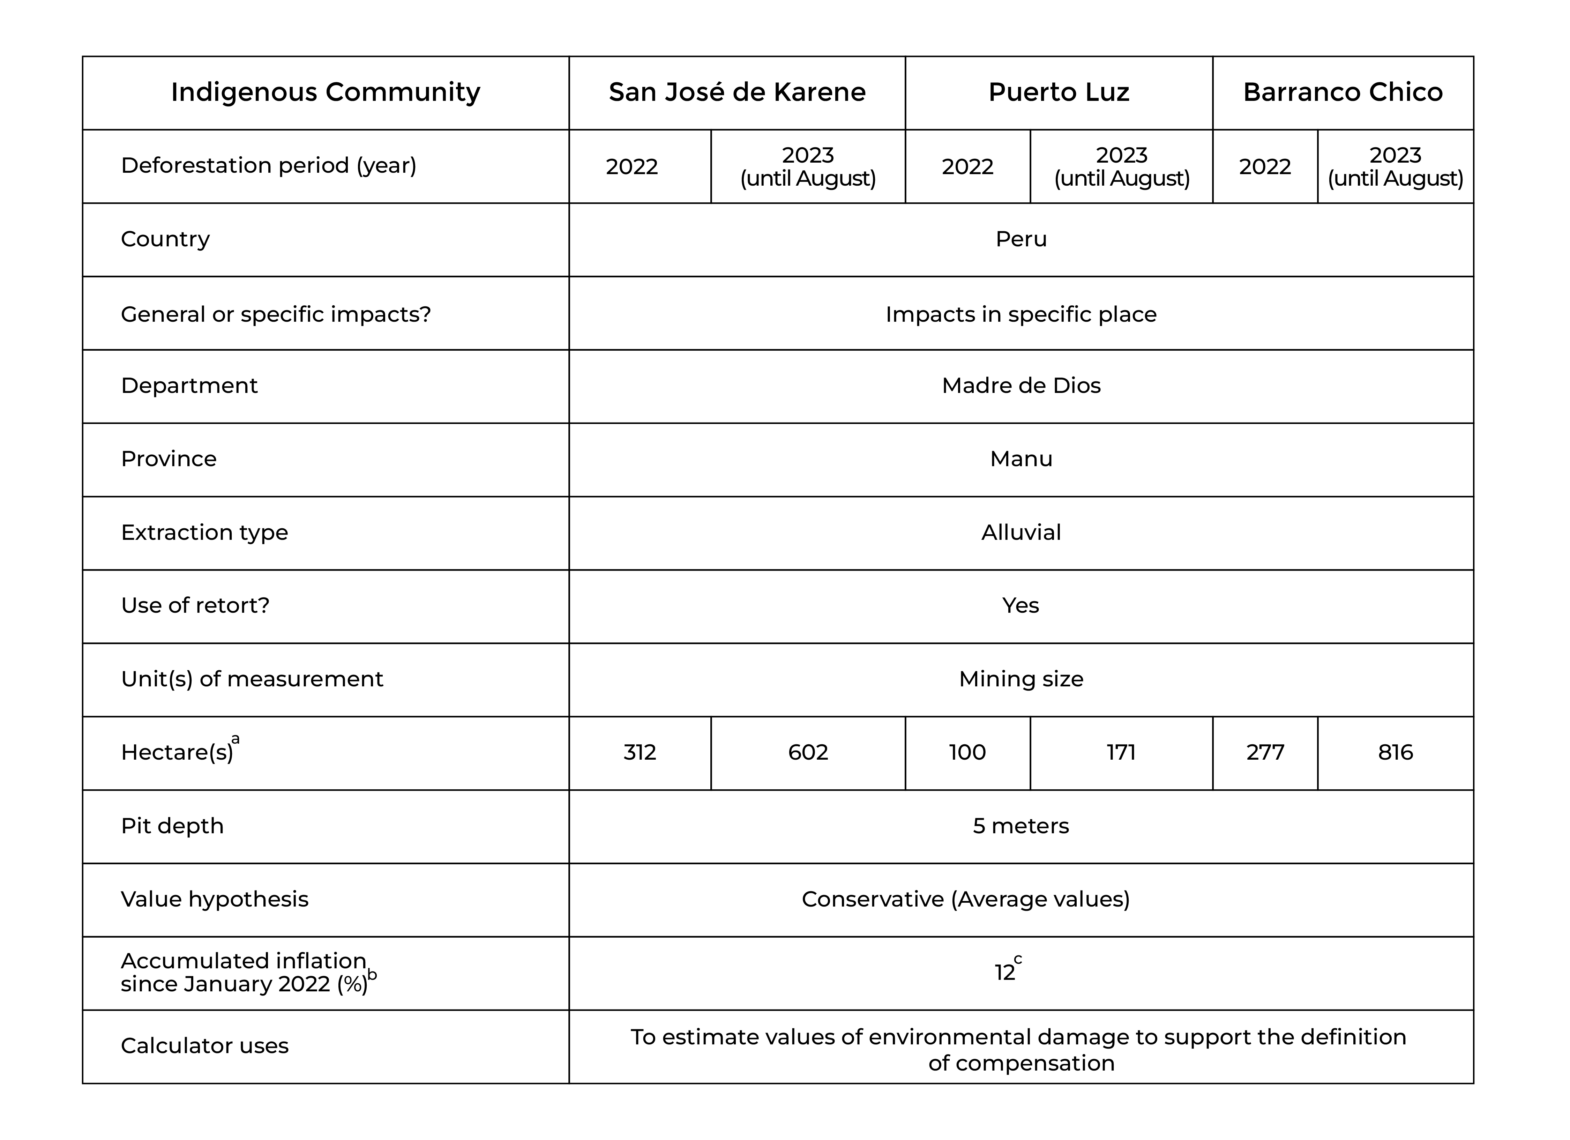
The three most impacted Indigenous territories are also in Brazil: Kayapó, Mundurucu, and Yanomami. Together, these three territories had a mining footprint of nearly 120,000 hectares. Fourth on the list is Ikabaru in Venezuela, followed by three in southern Peru (San Jose de Karene, Barranco Chico, and Kotsimba) with mining impact of over 17,000 hectares. Rounding out the top ten are Sai Cinza and Trincheira/Bacajá in Brazil, and San Jacinto in Peru.
We also estimate the expansion of over 38,000 hectares of new mining deforestation in protected areas and Indigenous territories in 2024. The protected area with the highest levels of new mining deforestation in 2024 was Tapajós Environmental Protection Area (nearly 19,000 hectares), followed by Amanã and Urupadi National Forests in Brazil, Rio Novo and Jamanxim National Parks in Brazil, Crepori National Forest in Brazil, Campos Amazonicos National Park in Brazil, Yapacan National Park in Venezuela, Guyane Regional Park in French Guiana, and Brownsberg Nature Reserve in Suriname.
Finally, the Indigenous territory with the highest levels of new mining deforestation in 2024 was Kayapó in Brazil (over 2,100 hectares), followed by Ikabaru in Venezuela, Yanomami, Aripuana, and Mundurucu in Brazil, Baramita in Guyana, Kuruáya in Brazil, Isseneru and Kamarang Keng, San Jose de Karene in Peu. It is worth noting that Kayapó, Mundurucu, and Yanomami territories in Brazil all experienced declines in the mining deforestation rate in 2024. For example, Yanomami went from its peak in 2021 to the lowest on record in 2024.
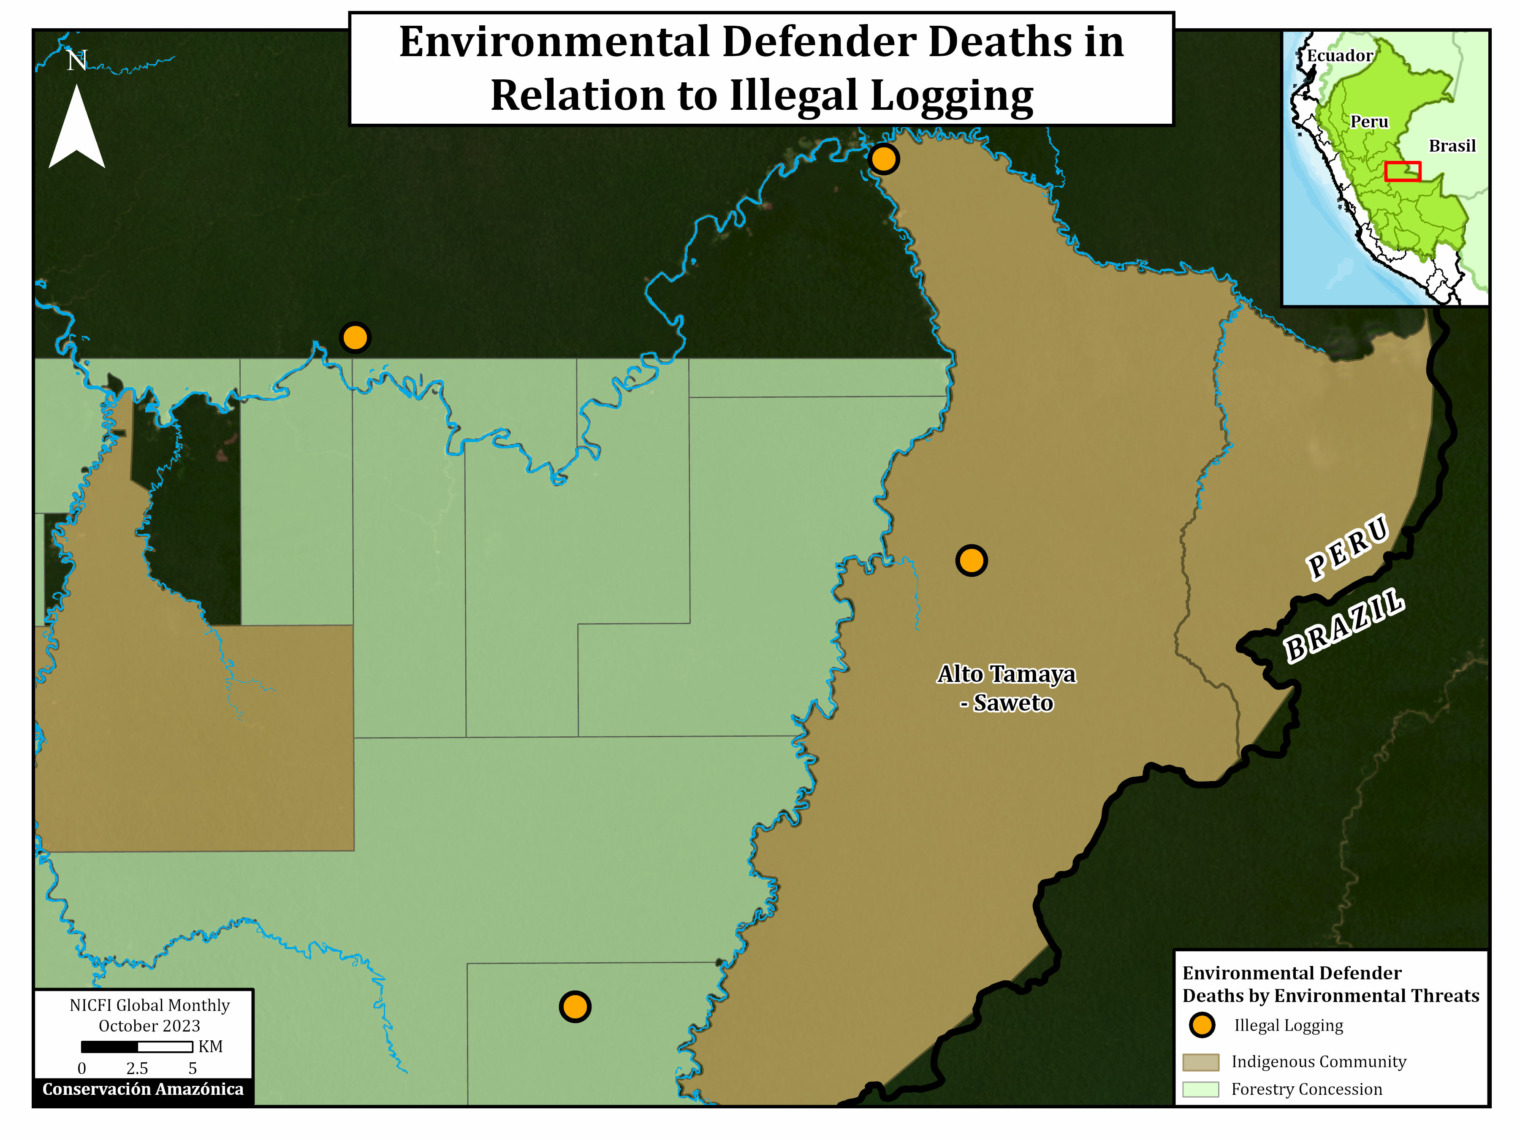
Most impacted areas in eastern Brazilian Amazon
Most impacted areas in the Guyana Shield
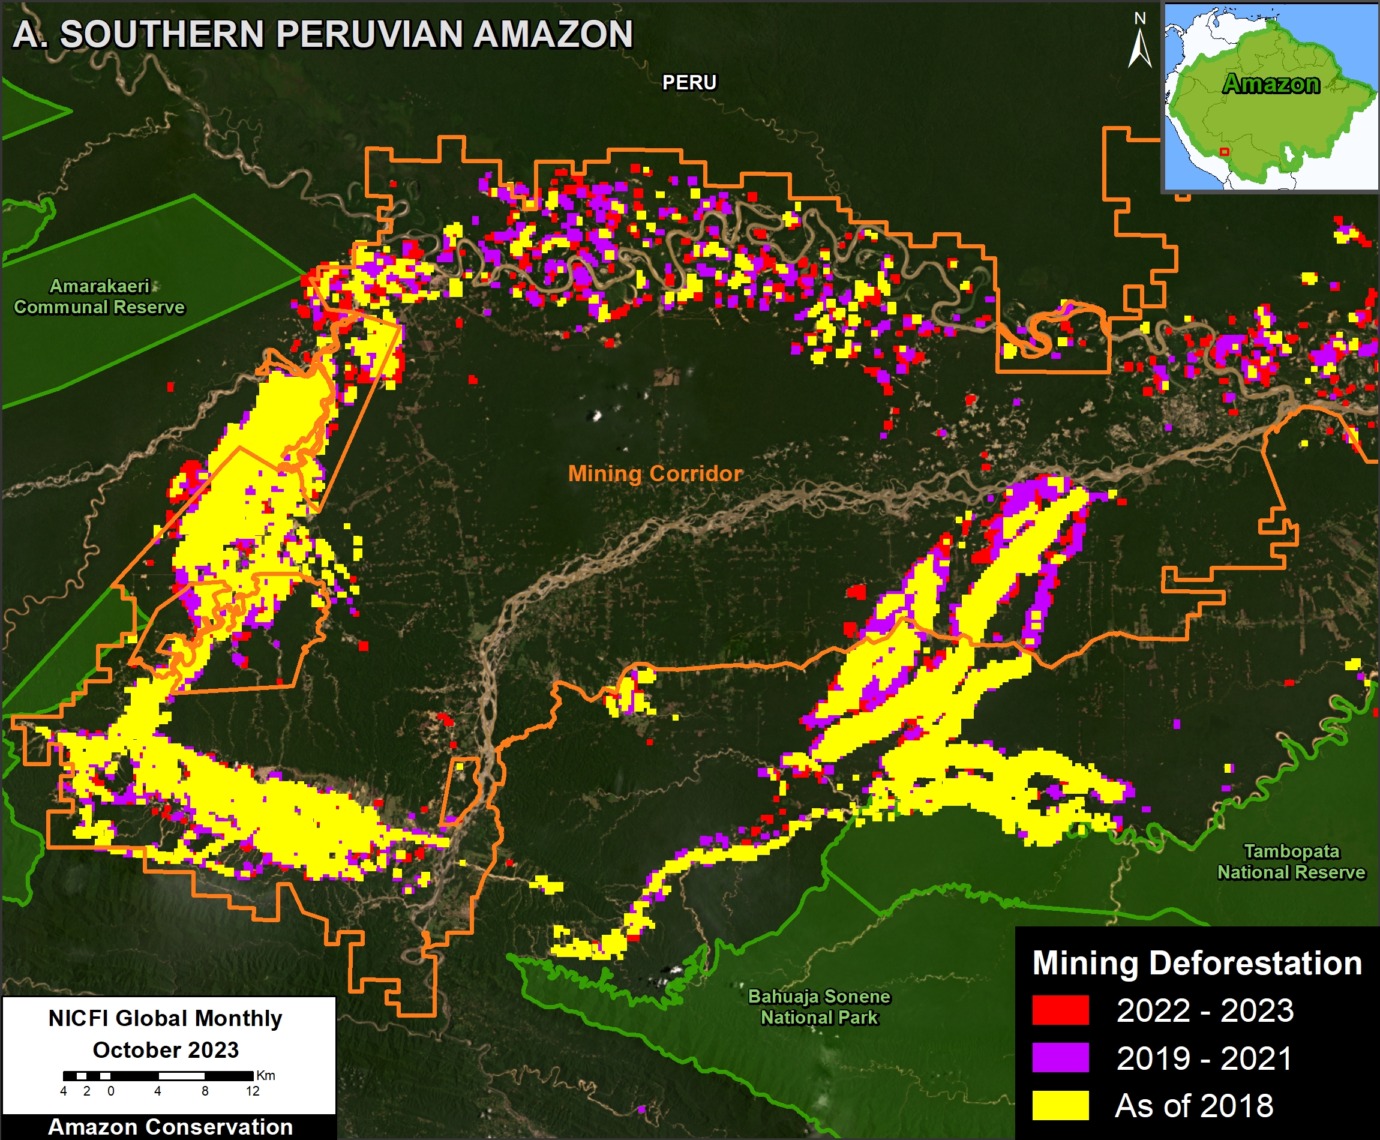
Most impacted areas in the southern Peruvian Amazon
Conclusion & Policy Implications
Despite a recent downward trend in mining across the region, small-scale mining continues to be a major driver of deforestation and ecosystem degradation in the Amazon.
Our analysis shows that over one-third of this mining occurs within protected areas and Indigenous territories, the vast majority in Brazil. However, since the return of the Lula administration in 2023, Brazil has been ramping up enforcement efforts. This has contributed to the rapid decrease in area lost to mining across the Amazon, given Brazil’s outsized contribution to regional figures. This highlights again the importance of protected areas and Indigenous territories as a crucial policy instrument for the protection of the region’s ecosystems.
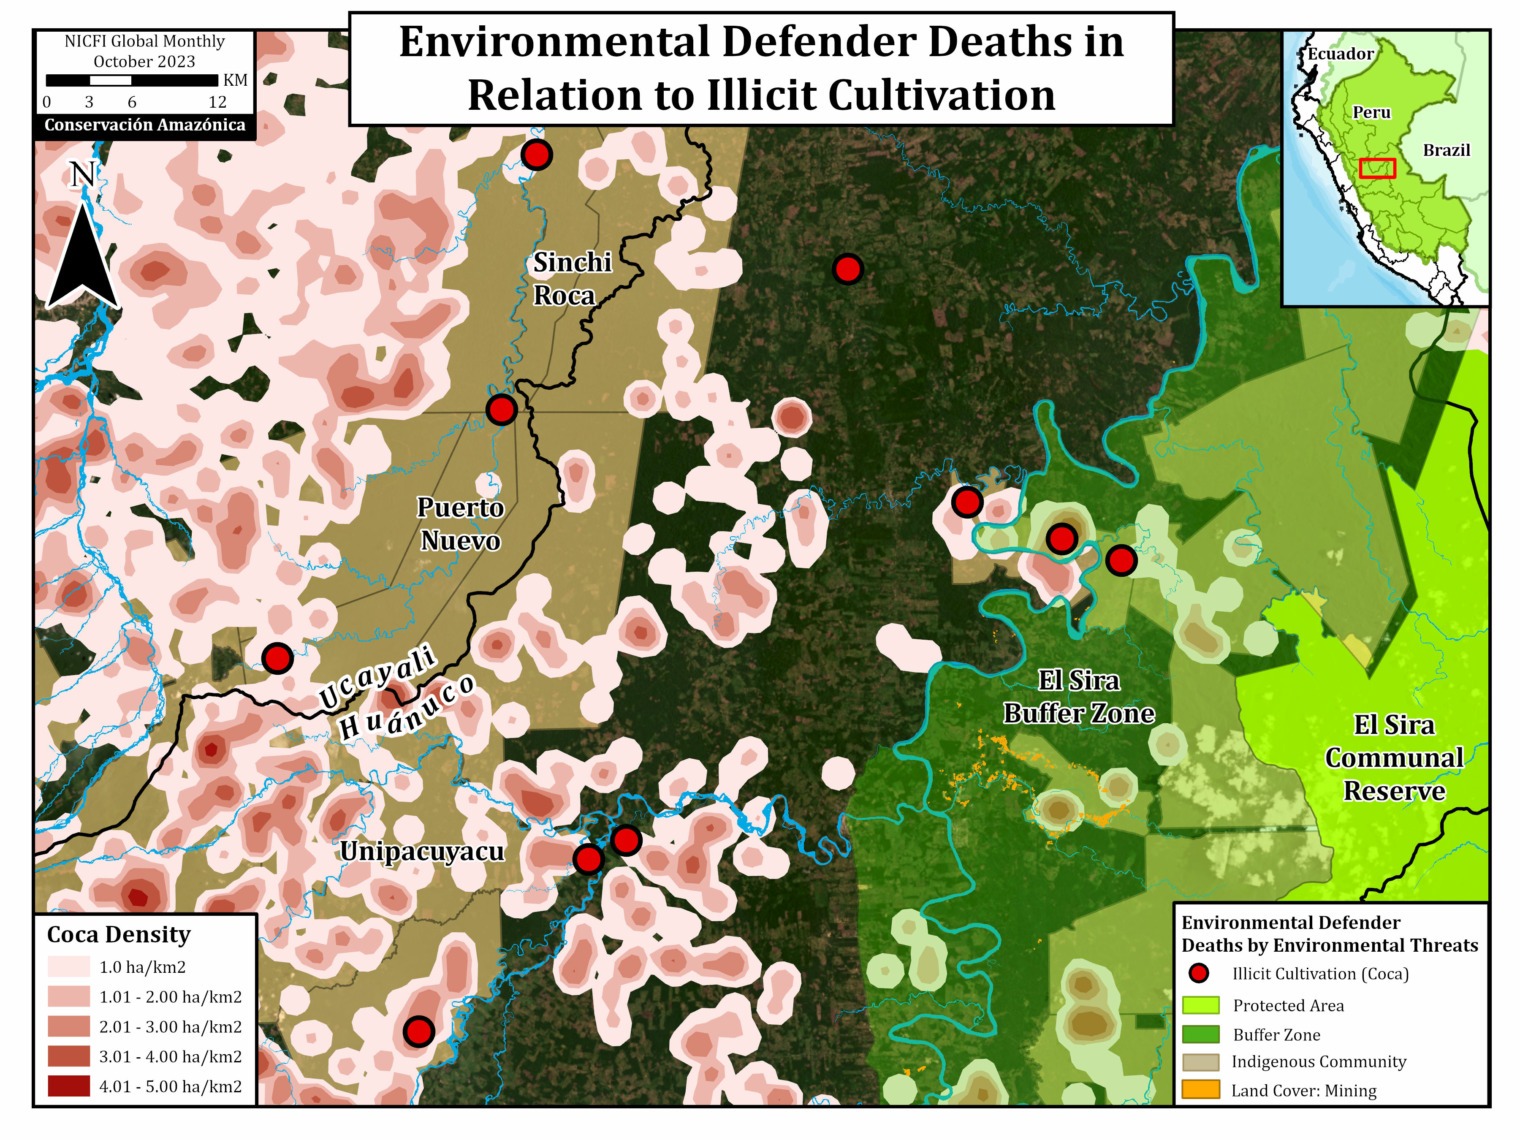
Although advances have been made in reducing illegal mining from protected areas in southern Peru, it continues to impact several Indigenous territories (MAAP #208, MAAP #196), particularly those surrounding the government-designated Mining Corridor. In fact, the most affected Indigenous territory in Peru, San Jose de Karene, has already lost over a third of its total area to illegal gold mining. These territories are part of a regional organization known as FENAMAD, which has been supporting legal actions to help the government make decisions for a rapid response to illicit activities (such as illegal mining) that affect indigenous territories. This process led to the execution of five government-led operations between 2022 and 2024, in three communities: Barranco Chico, Kotsimba and San José de Karene (MAAP #208).
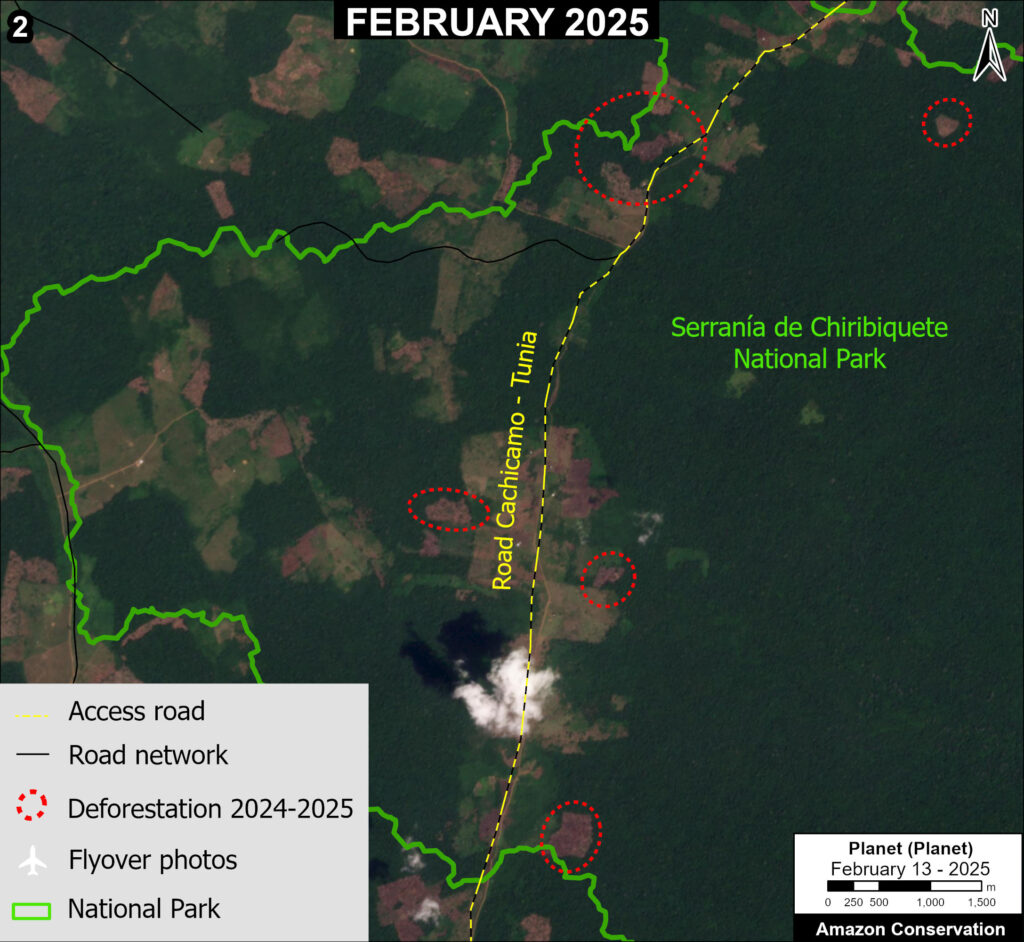
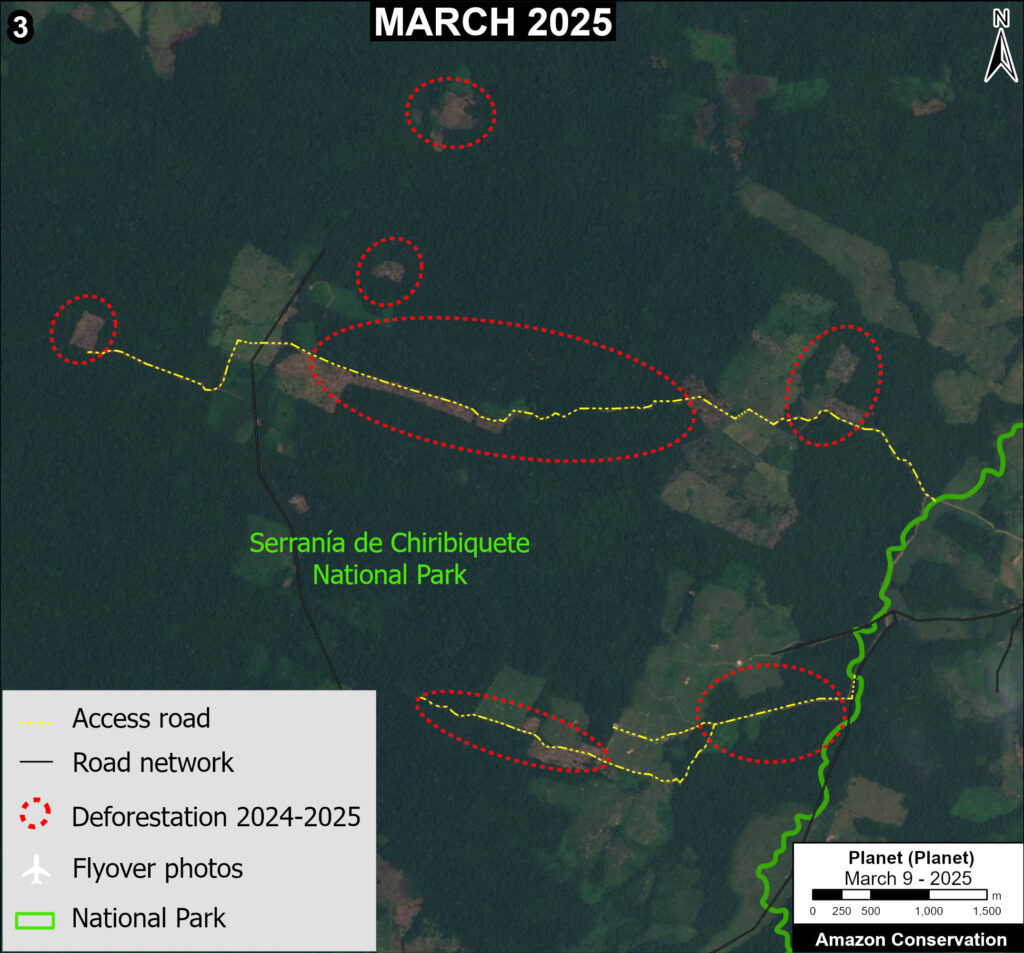
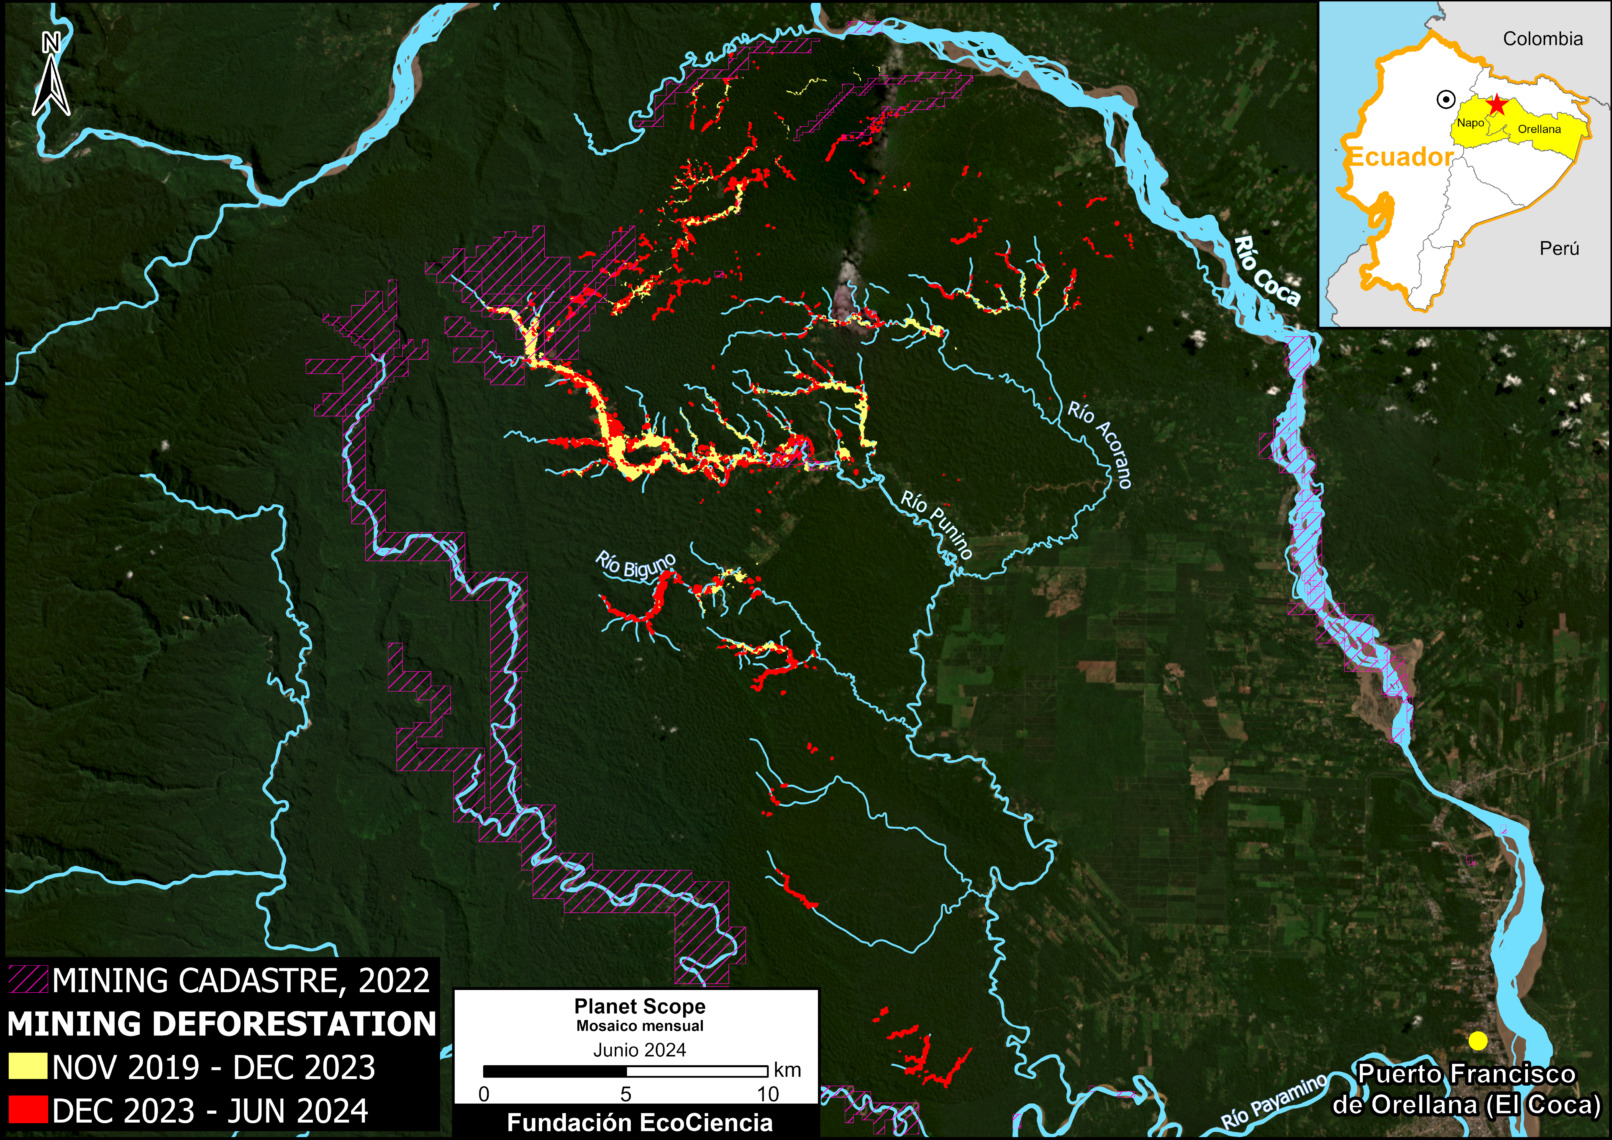
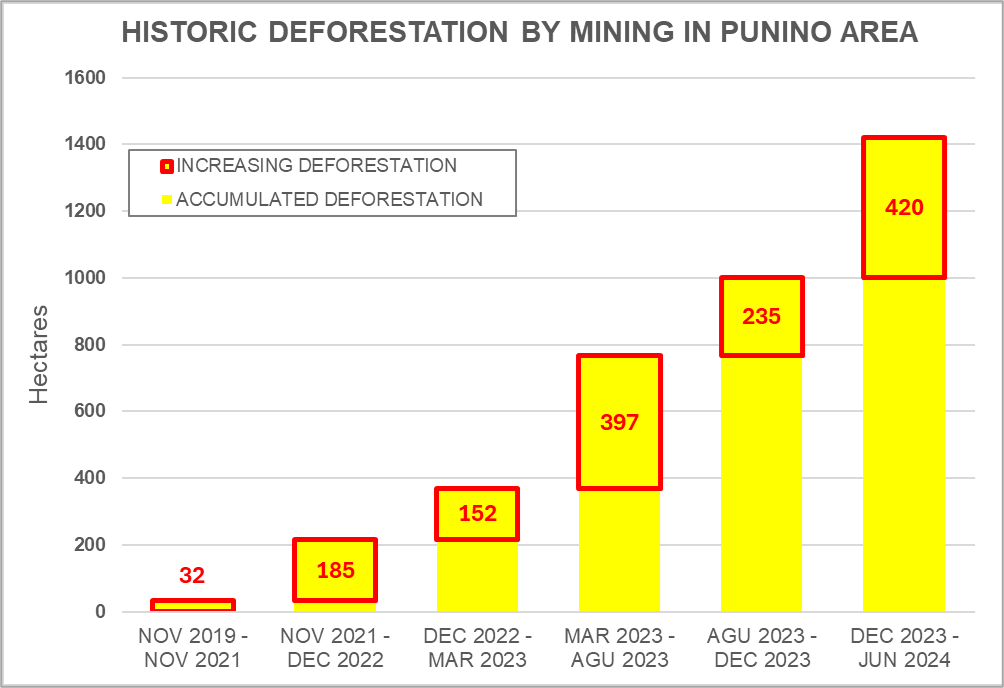
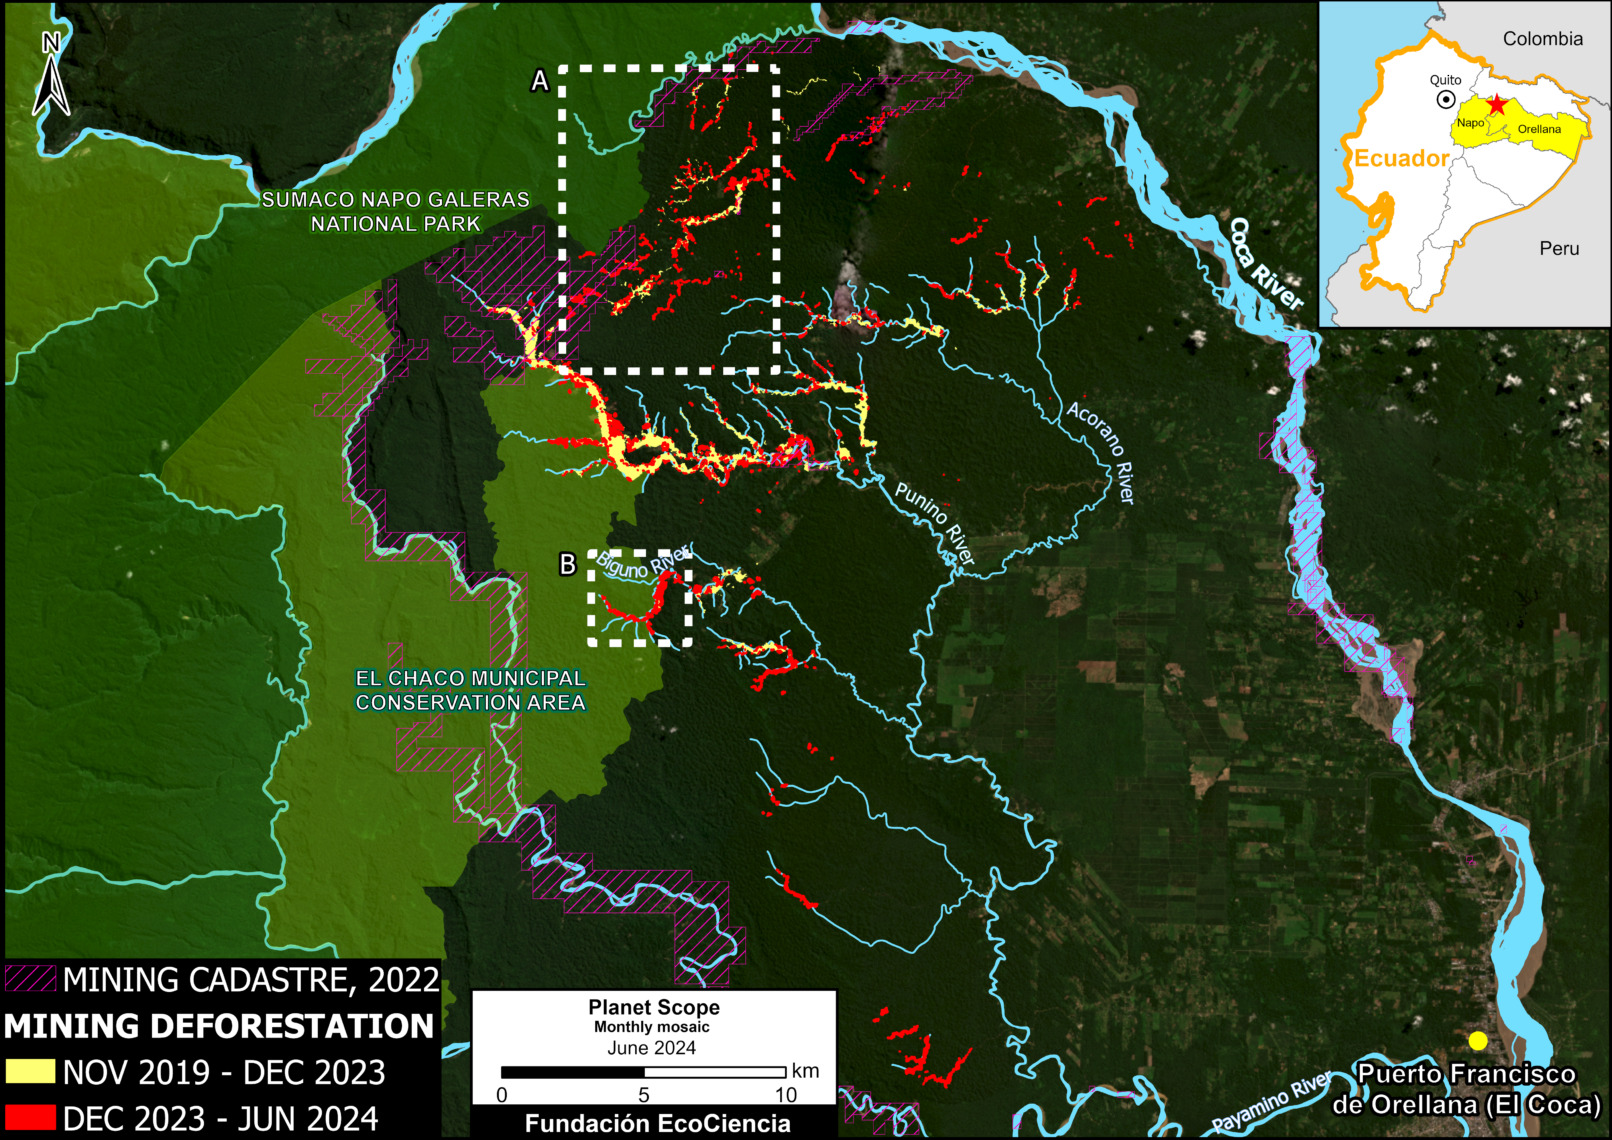
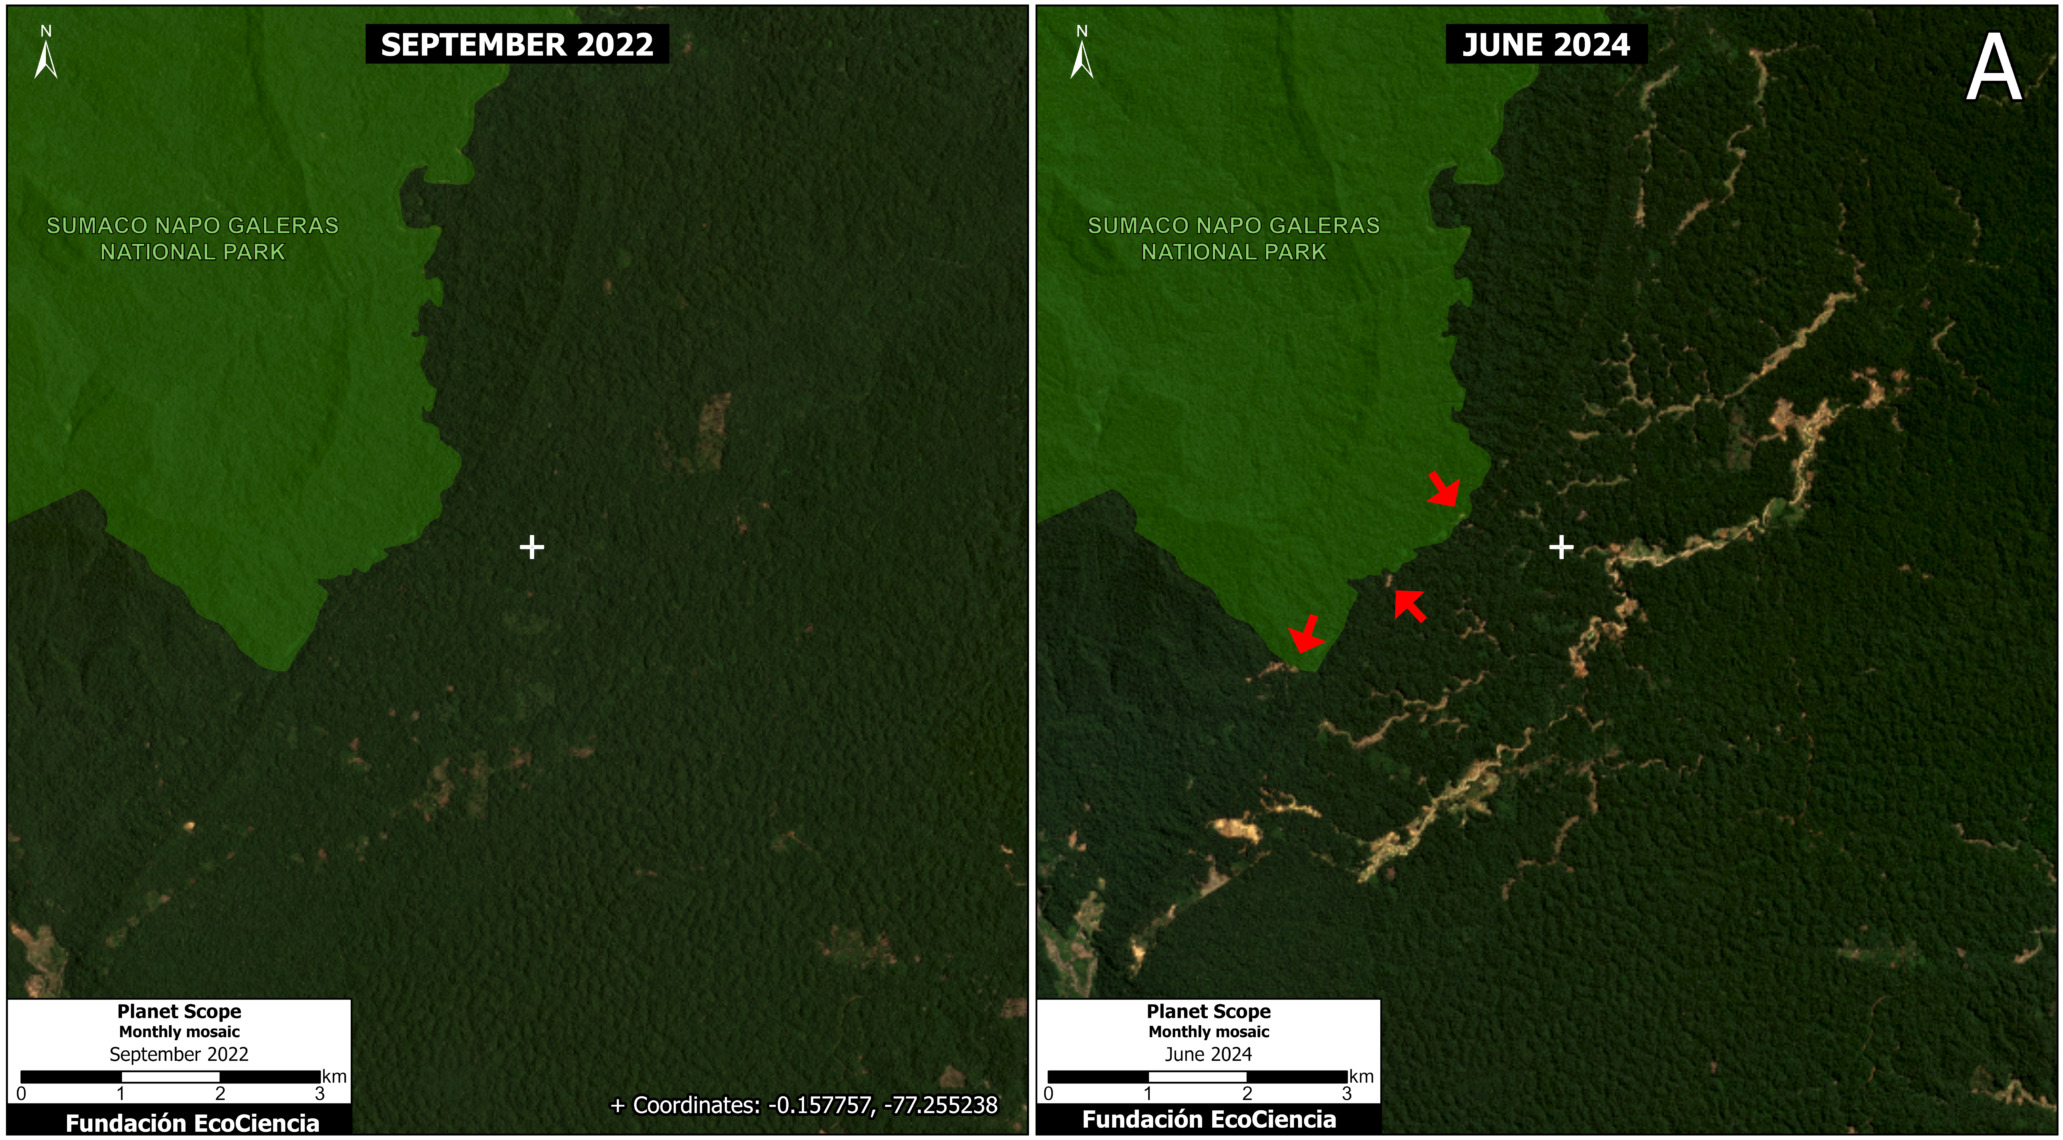
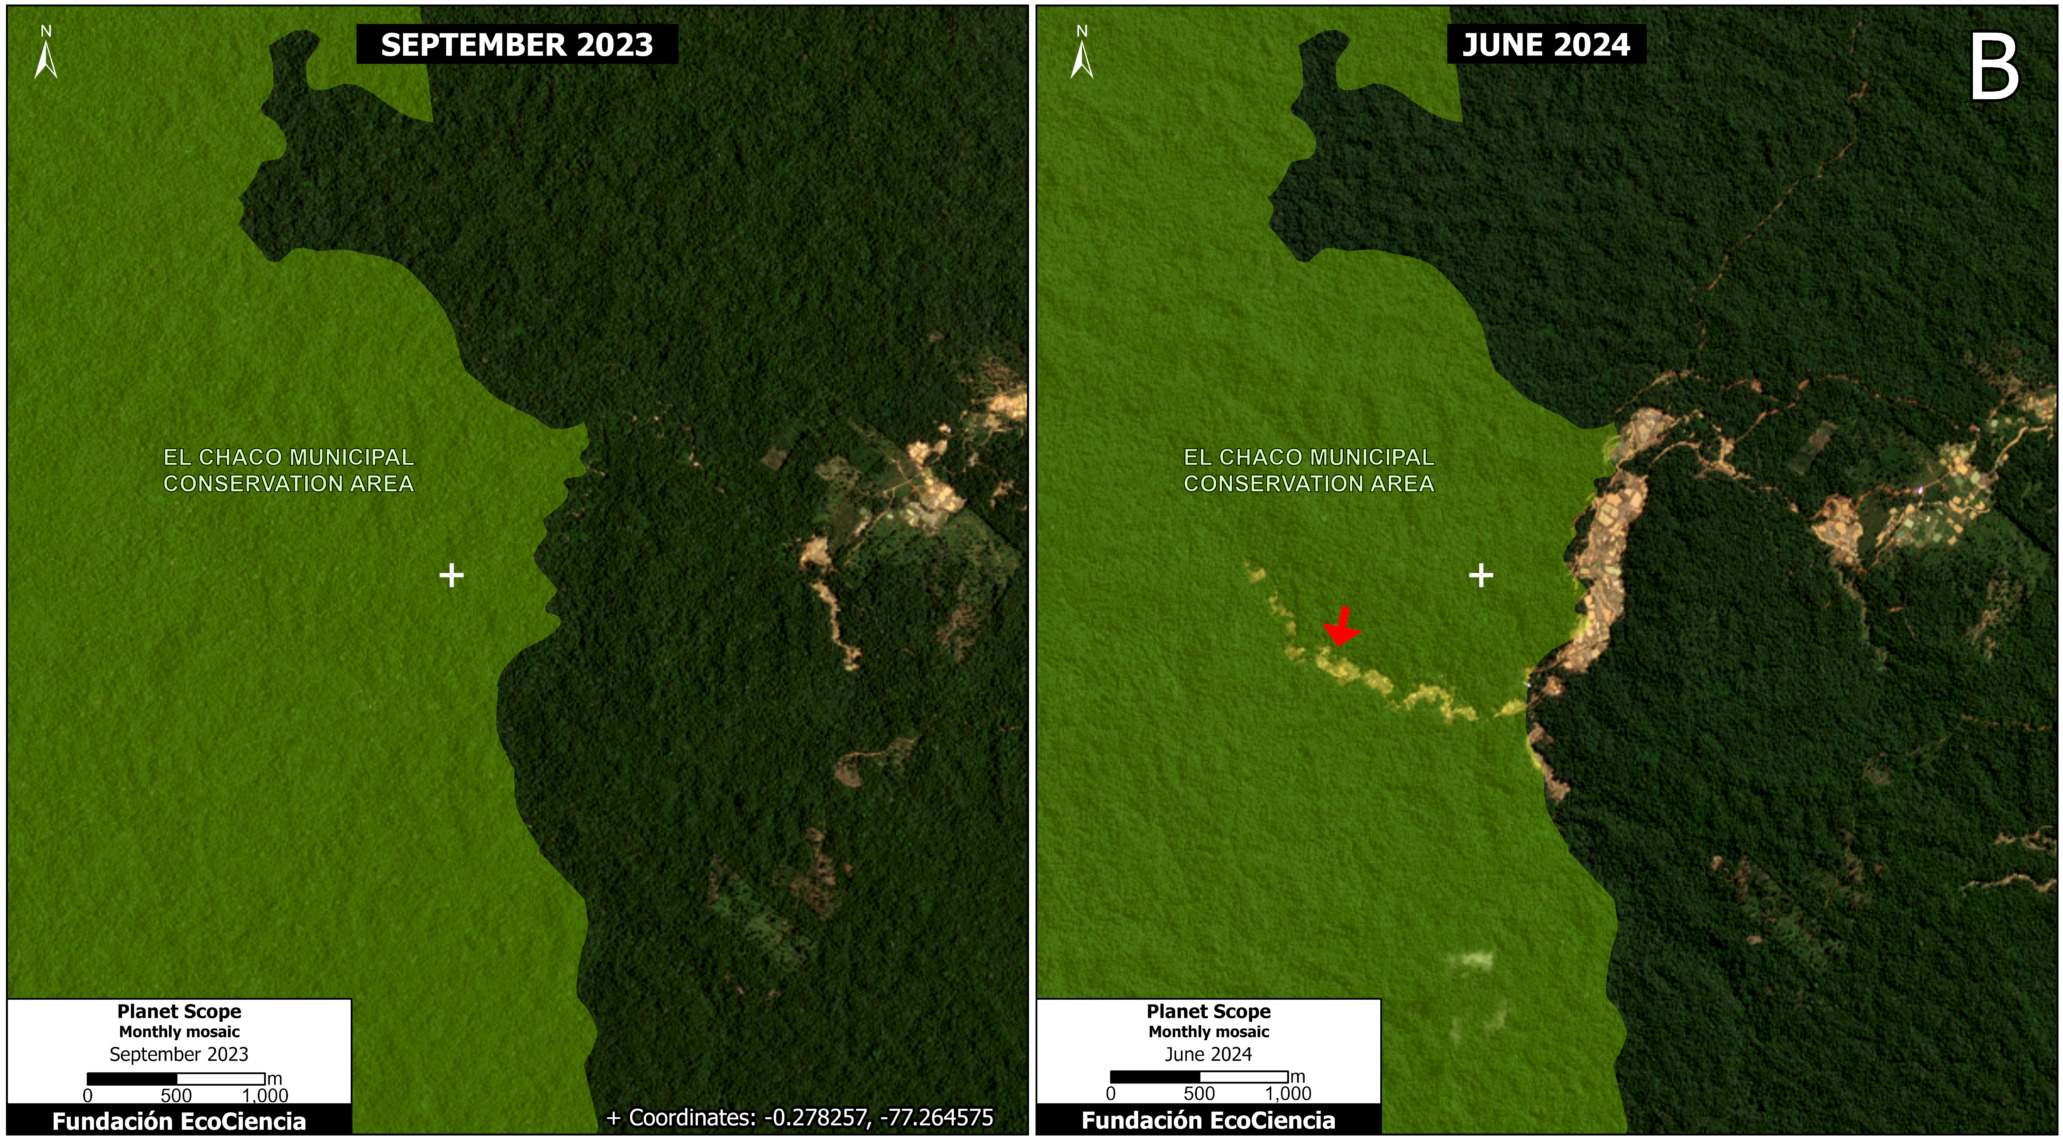
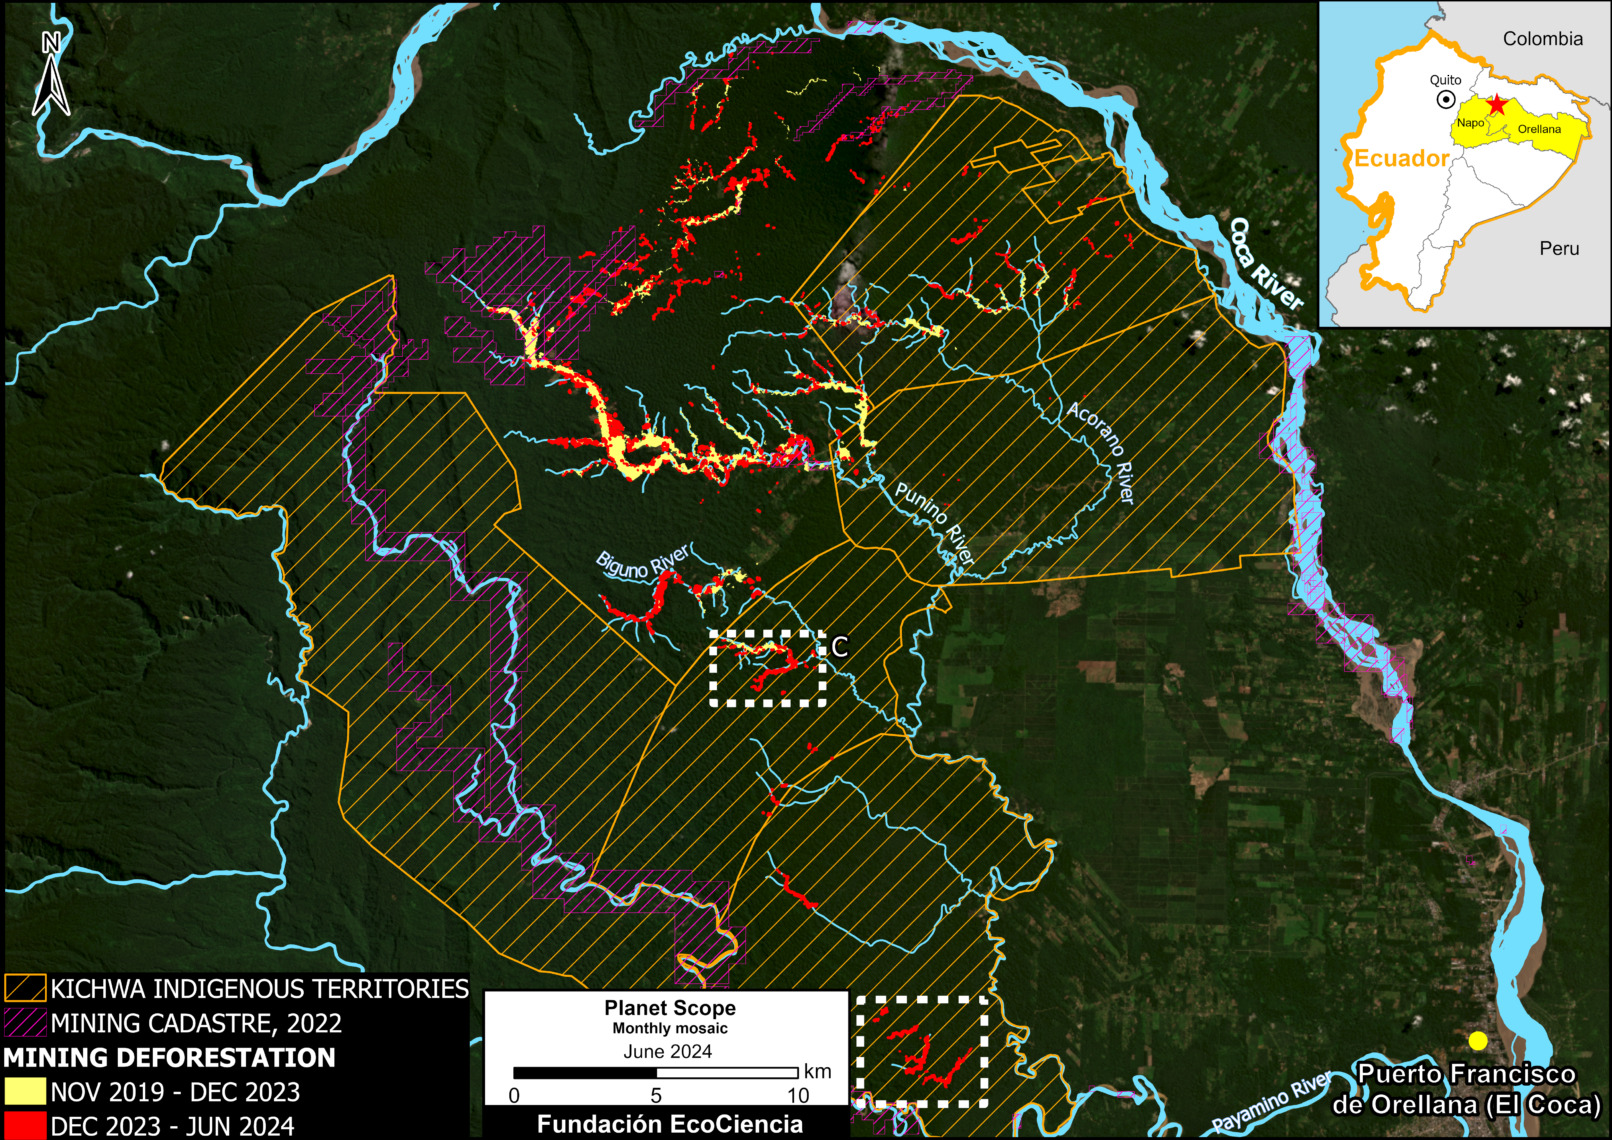
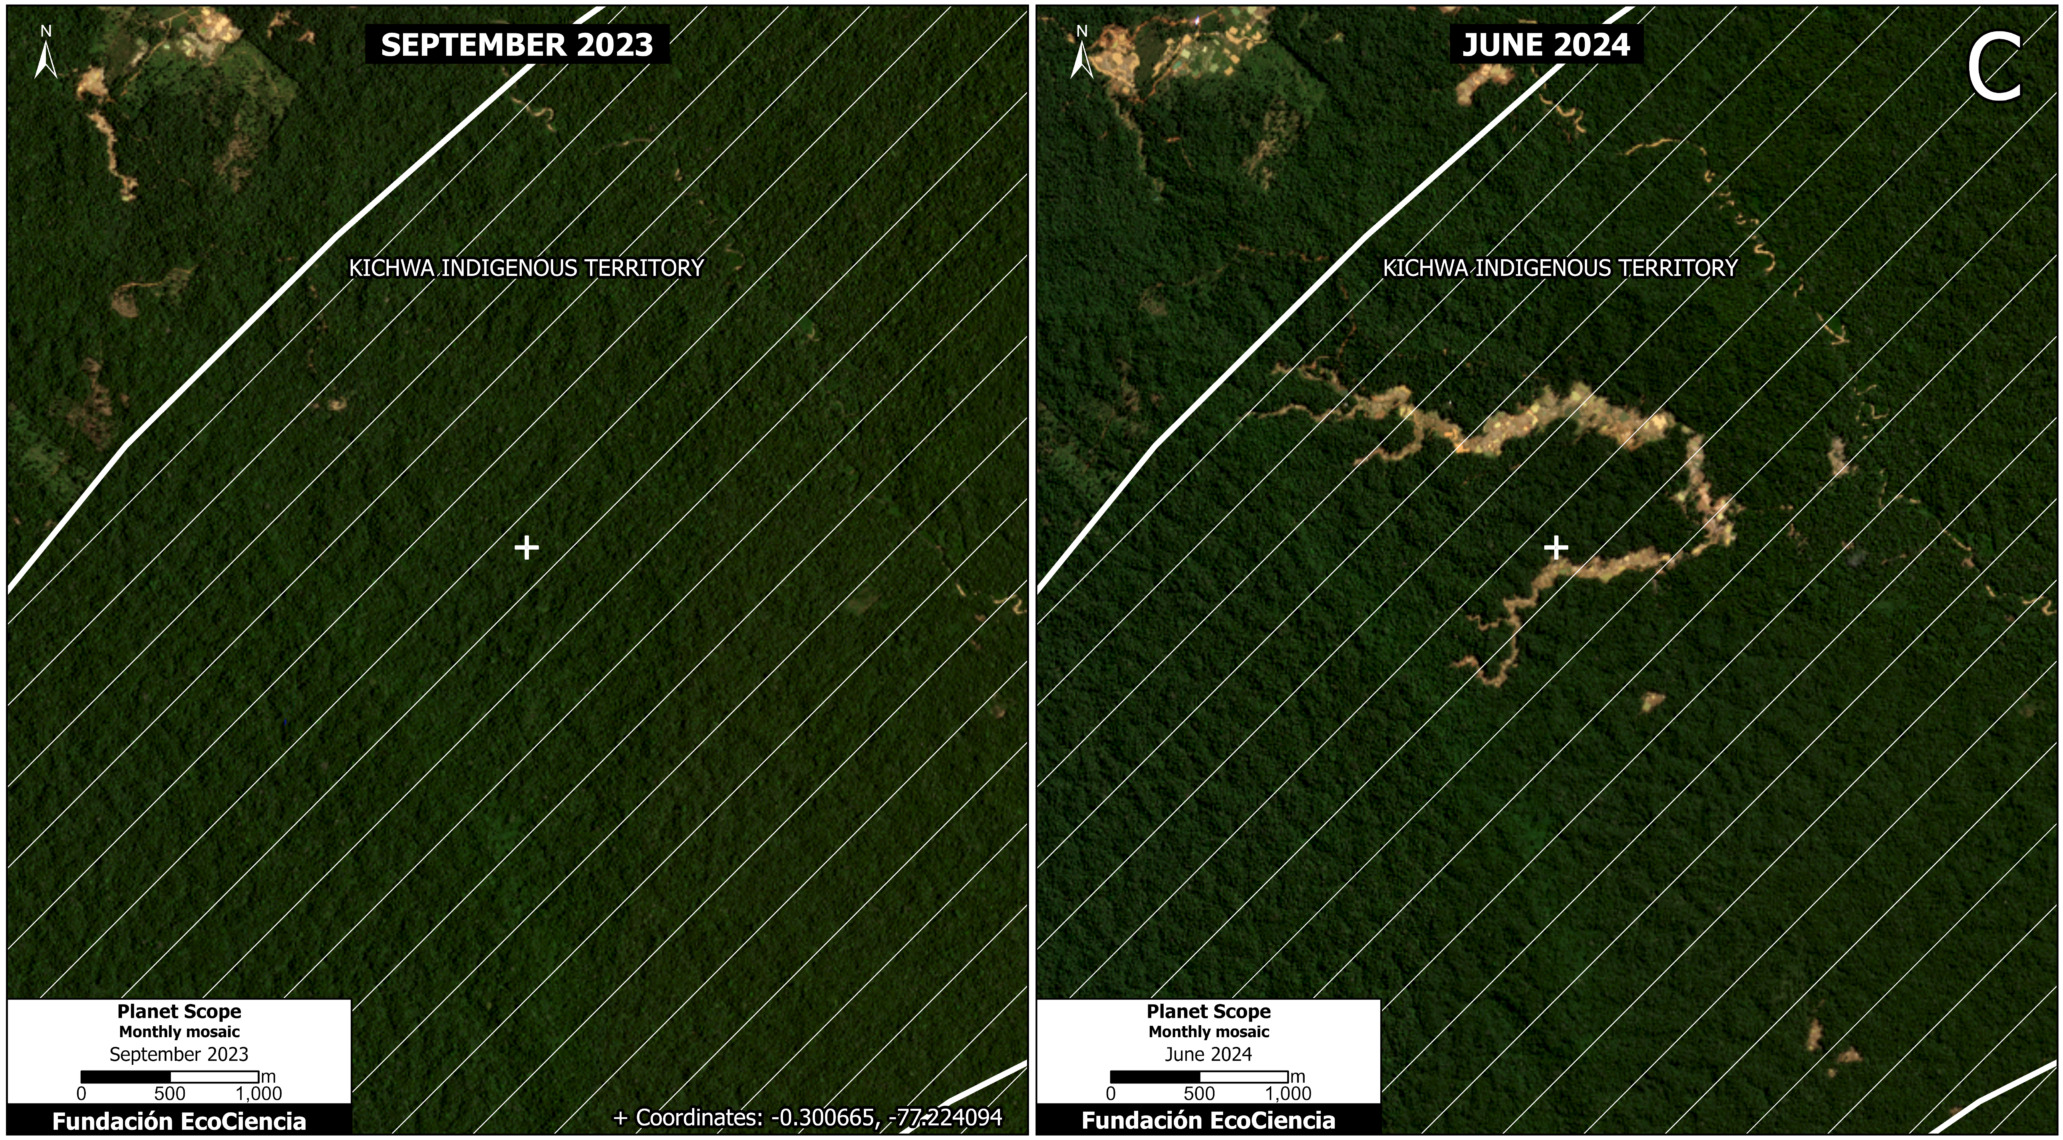
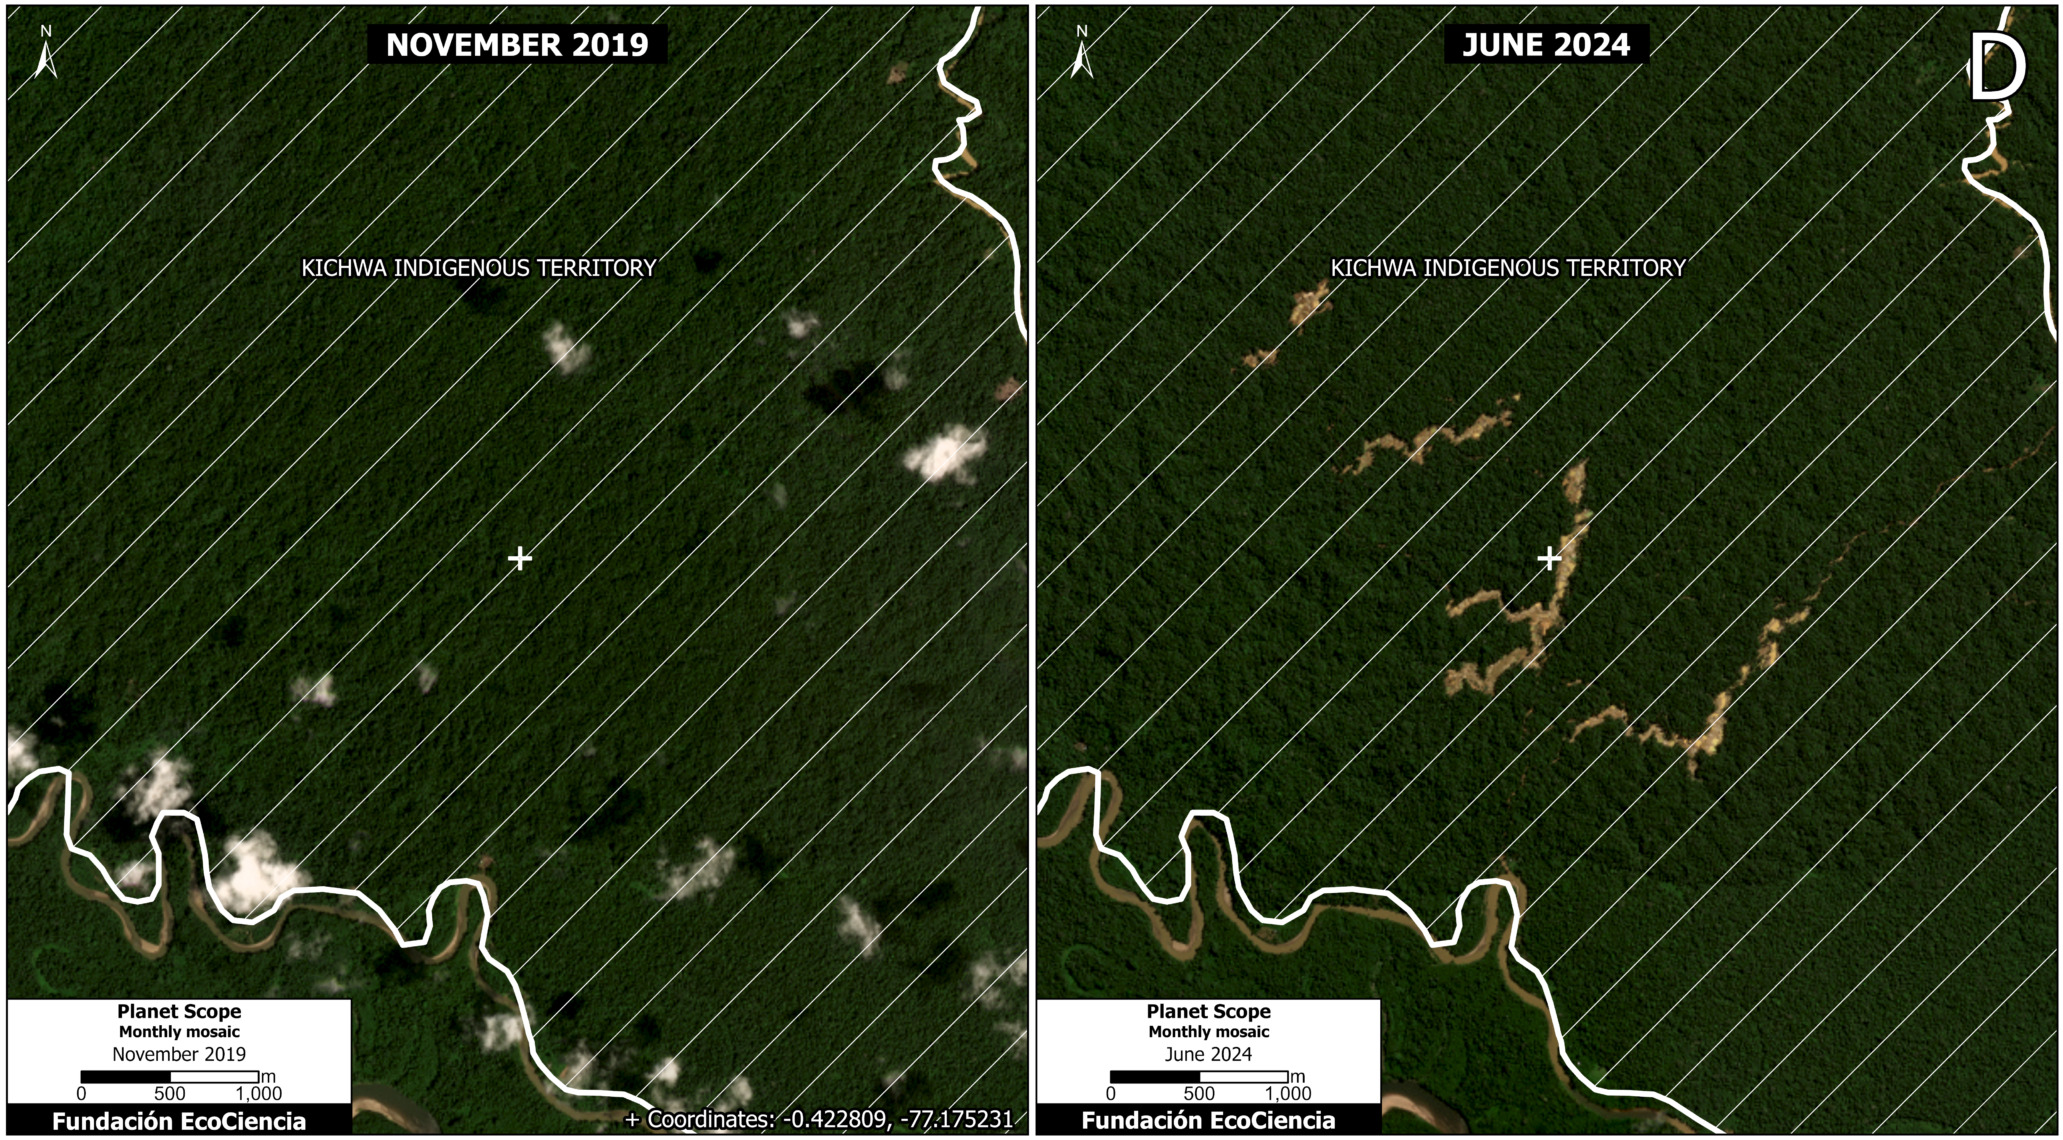
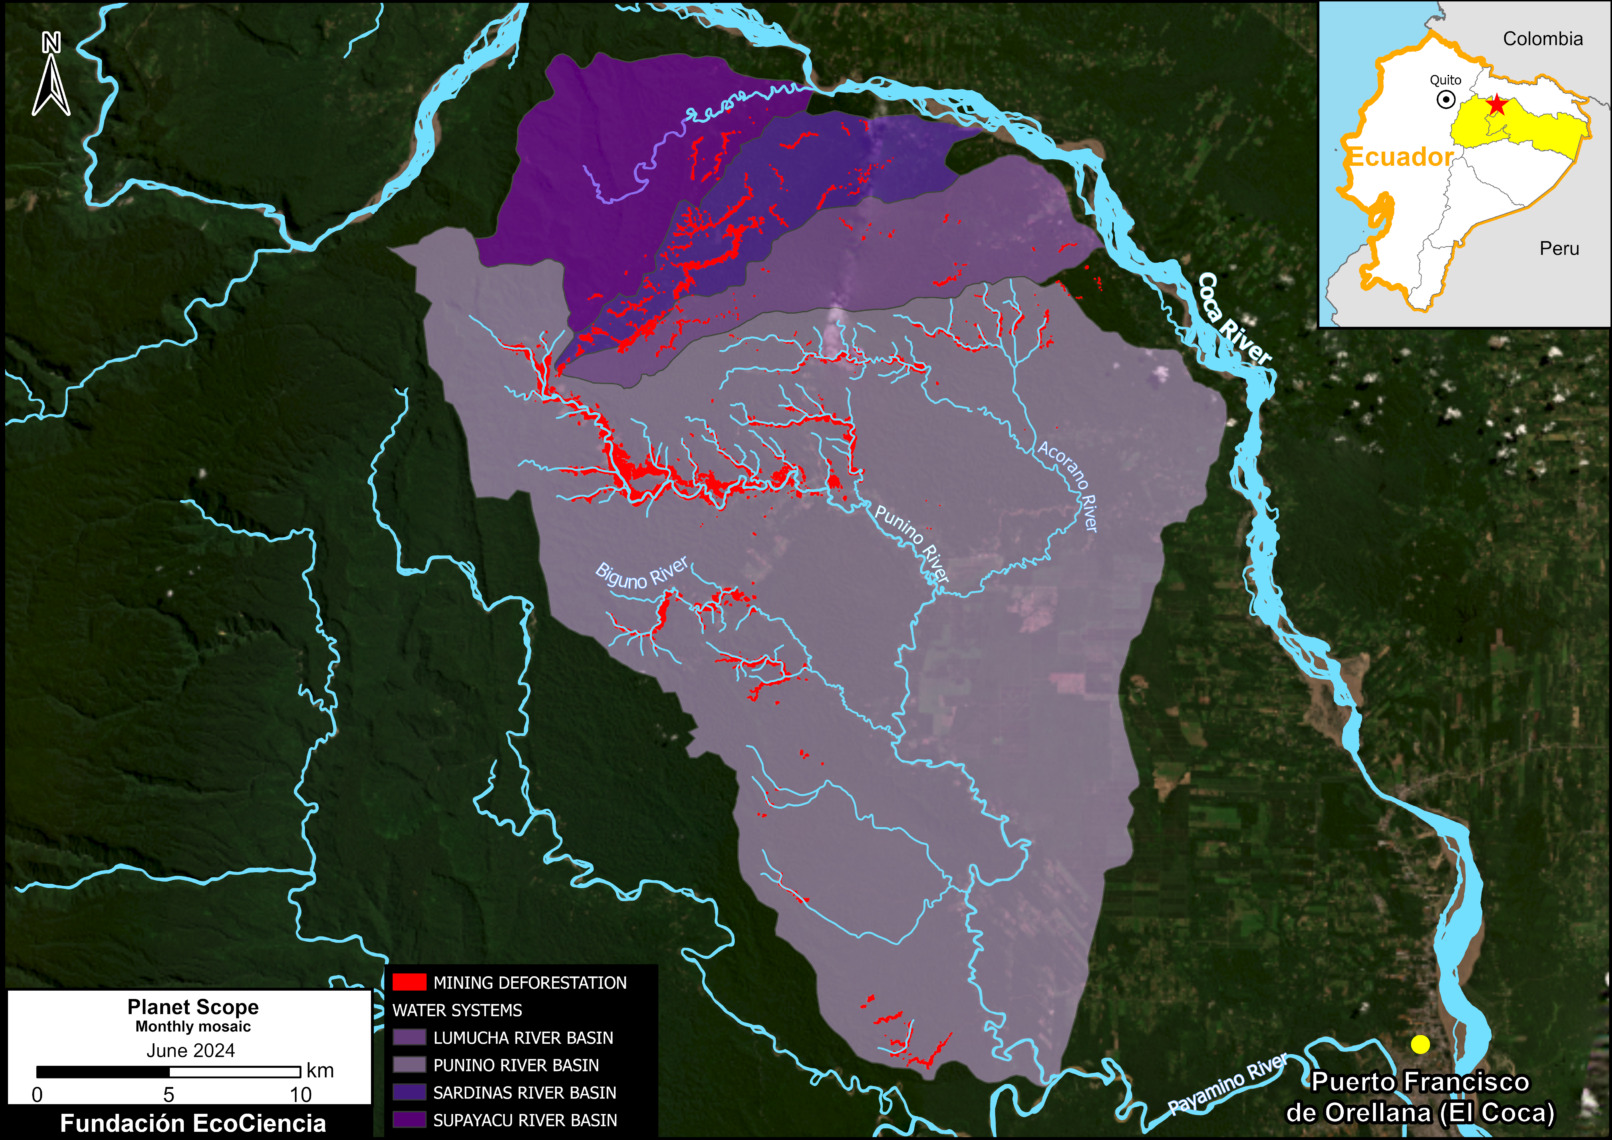
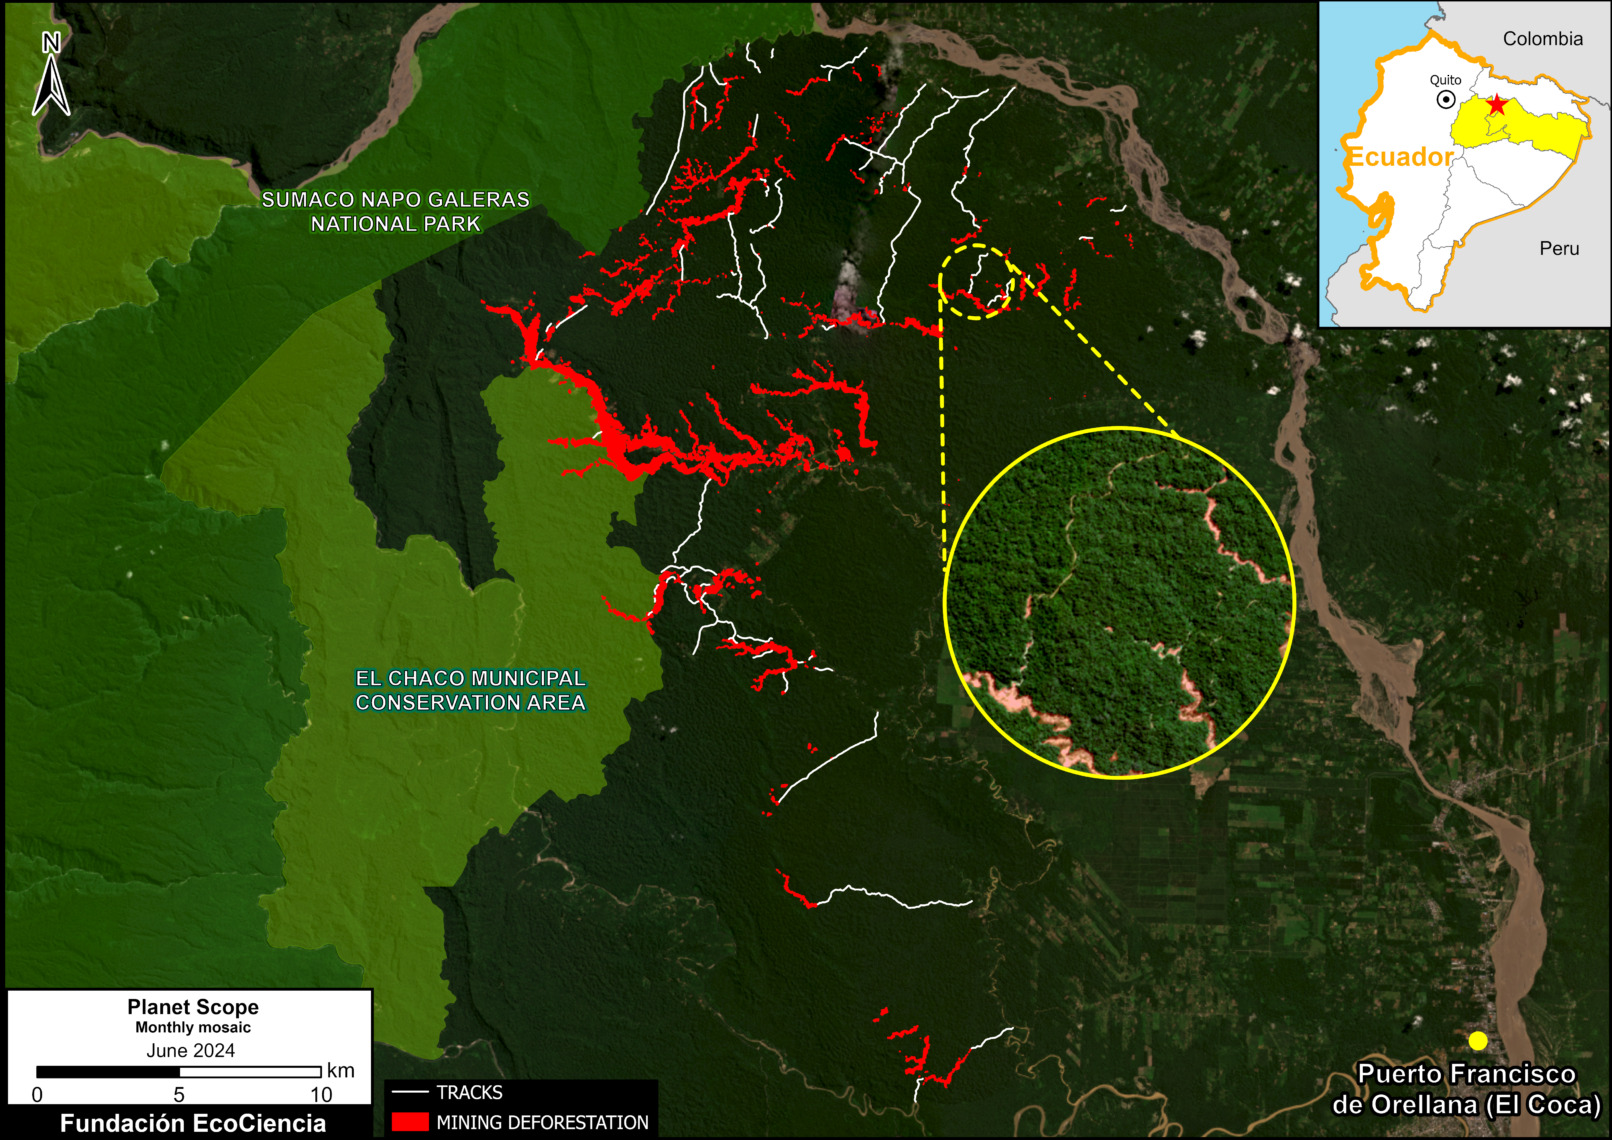
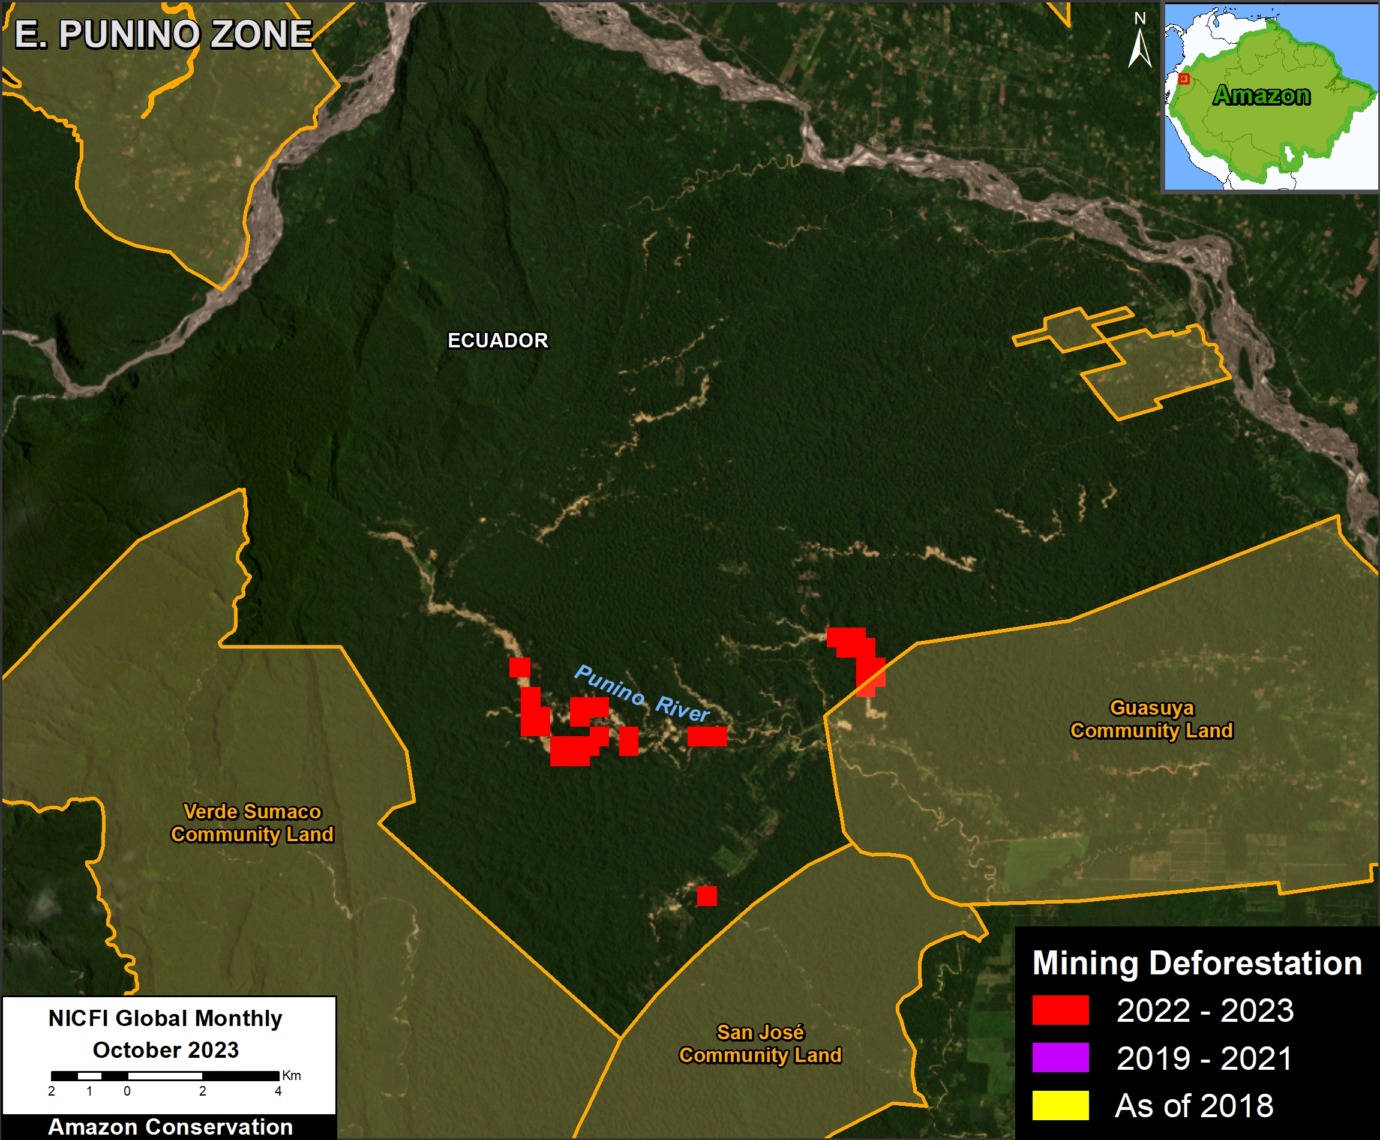
In Ecuador, mining deforestation continues to threaten numerous sites, including protected areas and Indigenous territories, along the Andes-Amazon transition zone (MAAP #206, MAAP #221, MAAP #219). An upcoming series of reports will detail these threats.
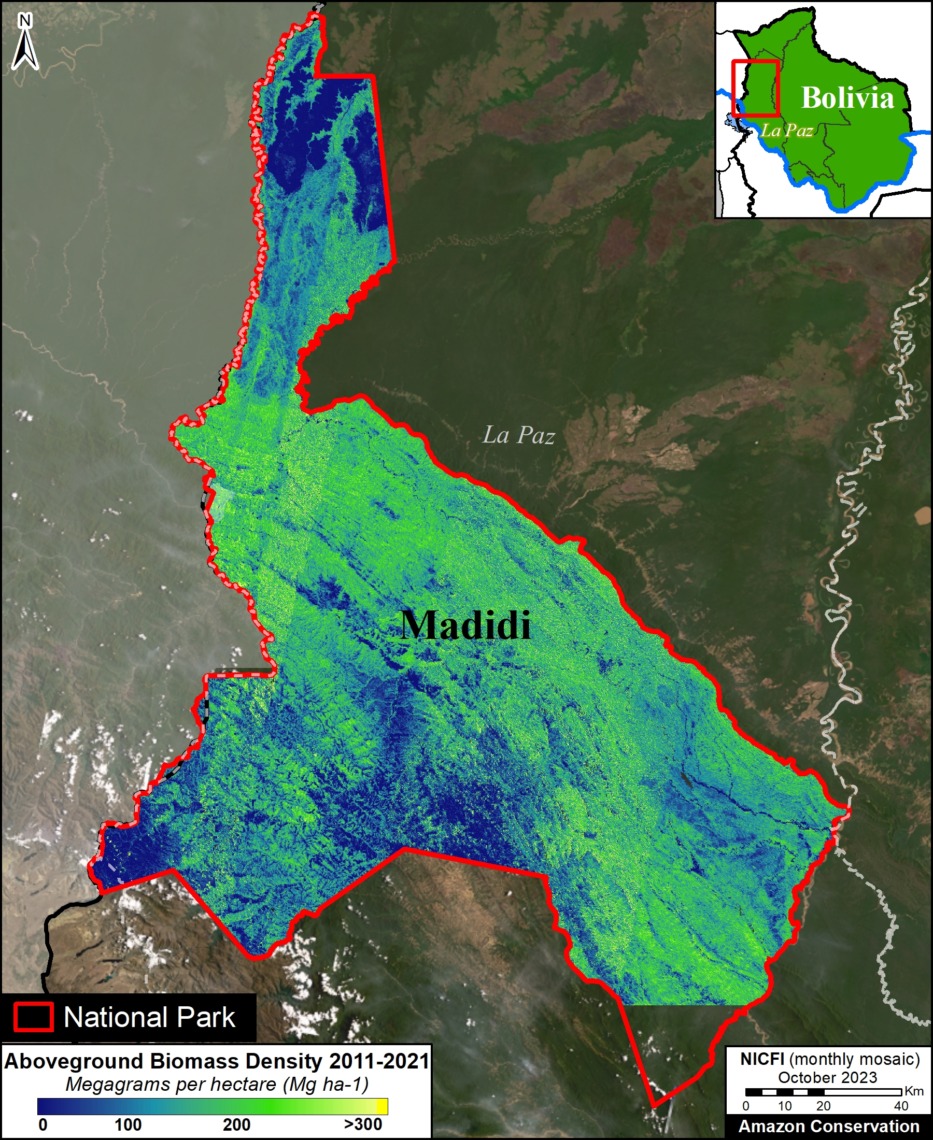
AMW is an emerging and powerful new tool, but it does have some caveats. One is that any mining activity less than 500 square meters may not be accurately detected. For example, we have been monitoring small-scale mining in several protected areas, such as Madidi National Park in Bolivia and Puinawai National Park in Colombia, that are not yet detected by the algorithm. In these cases, direct real-time monitoring with satellites is still needed. These areas will soon be added to the AMW as mining “Hotspots” (MAAP#197).
This is also the case for river-based mining that does not cause a large footprint on the ground. Imagery with very high resolution has revealed active river barge mining in northern Peru (MAAP #189) and along the Colombia/Brazil border (MAAP#197). These areas will also soon be added to the AMW as mining “Hotspots”.
As effective as enforcement might be, it will have to compete in 2025 with an activity that is more lucrative than ever, with the price of gold now over 3,000 US$ an ounce, driven by global economic uncertainty. While the threat has receded, it is likely to roar back in at the first opportunity or sign that enforcement is lowering its guard. Tools such as the Amazon Mining Watch, which will eventually publish quarterly updates of newly detected mining deforestation areas, can help governments and local community defenders alike to spot new fronts of gold mining and take action as fast as possible, as well as to valuate socio environmental damages to assess the required (financial) efforts to restore damages caused by illegal mining.
The only tool of this kind to be truly regional in coverage, the AMW can also help foster regional cooperation, in particular in transfrontier areas where a lack of interoperability between official monitoring systems might hamper interventions that are aimed at combating a phenomenon that is linked to other nature crimes and is mostly controlled by international organized crime.
In the coming years, the MAAP and AMW teams will continue to publish both quarterly and annual reports of the dynamic mining situation in each country and across the Amazon.
Notes
1. Note that in this report, we focus on mining activity that causes deforestation. The vast majority is artisanal or small-scale gold mining, but other mining activities have also been detected, such as iron, aluminum, and nickel mines in Brazil and Colombia. Additional critical gold mining areas in rivers that are not yet causing deforestation (such as in northern Peru, southeast Colombia, and northwest Brazil; see MAAP #197), are not included in this report. This information is not yet displayed in Amazon Mining Watch, but future updates will include river-based mining hotspots.
2. Our data source for protected areas and Indigenous territories is from RAISG (Amazon Network of Georeferenced Socio-Environmental Information), a consortium of civil society organizations in the Amazon countries. This source (accessed in December 2024) contains spatial data for 5,943 protected areas and Indigenous territories, covering 414.9 million hectares across the Amazon.
Acknowledgments
This report was made possible by the generous support of the Gordon and Betty Moore Foundation.
We thanks colleagues from partner organizations around the Amazon for helpful comments on the report, including: Earth Genome, Conservación Amazónica (ACCA & ACEAA) & Federación Nativa del Río Madre de Dios y Afluentes (FENAMAD), Fundación EcoCiencia, Fundación para la Conservación y el Desarrollo Sostenible (FCDS), and Instituto Centro de Vida (ICV) & Instituto Socioambiental (ISA).
This report was made possible by the generous support of the Gordon and Betty Moore Foundation.
![]()