MAAP #171: Deforestation in Mining Corridor of Peruvian Amazon (2021-2022)

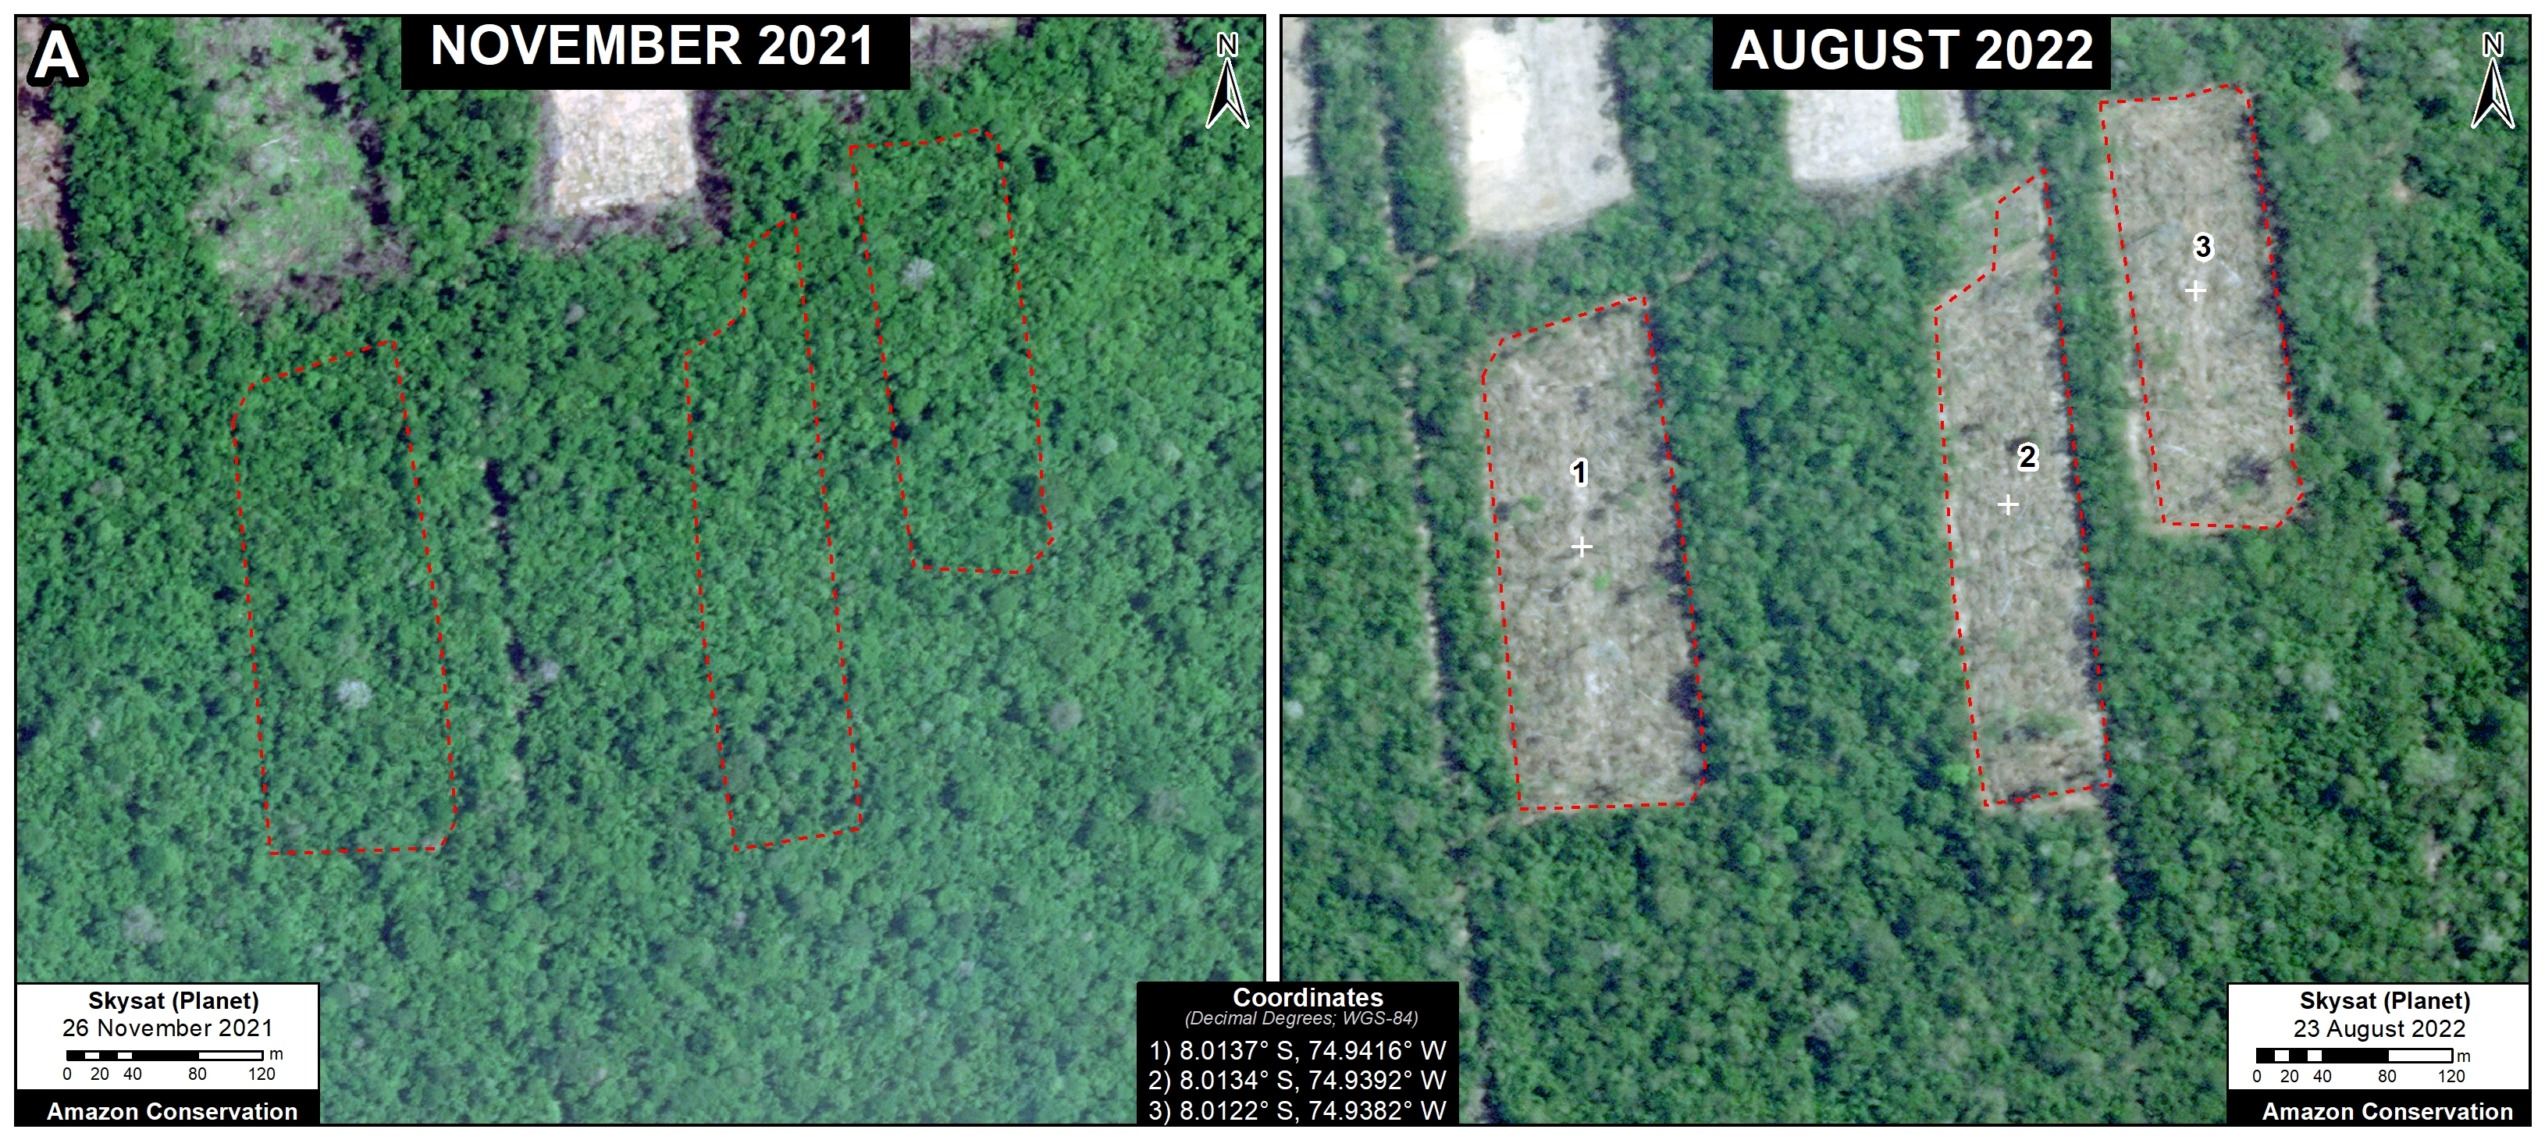
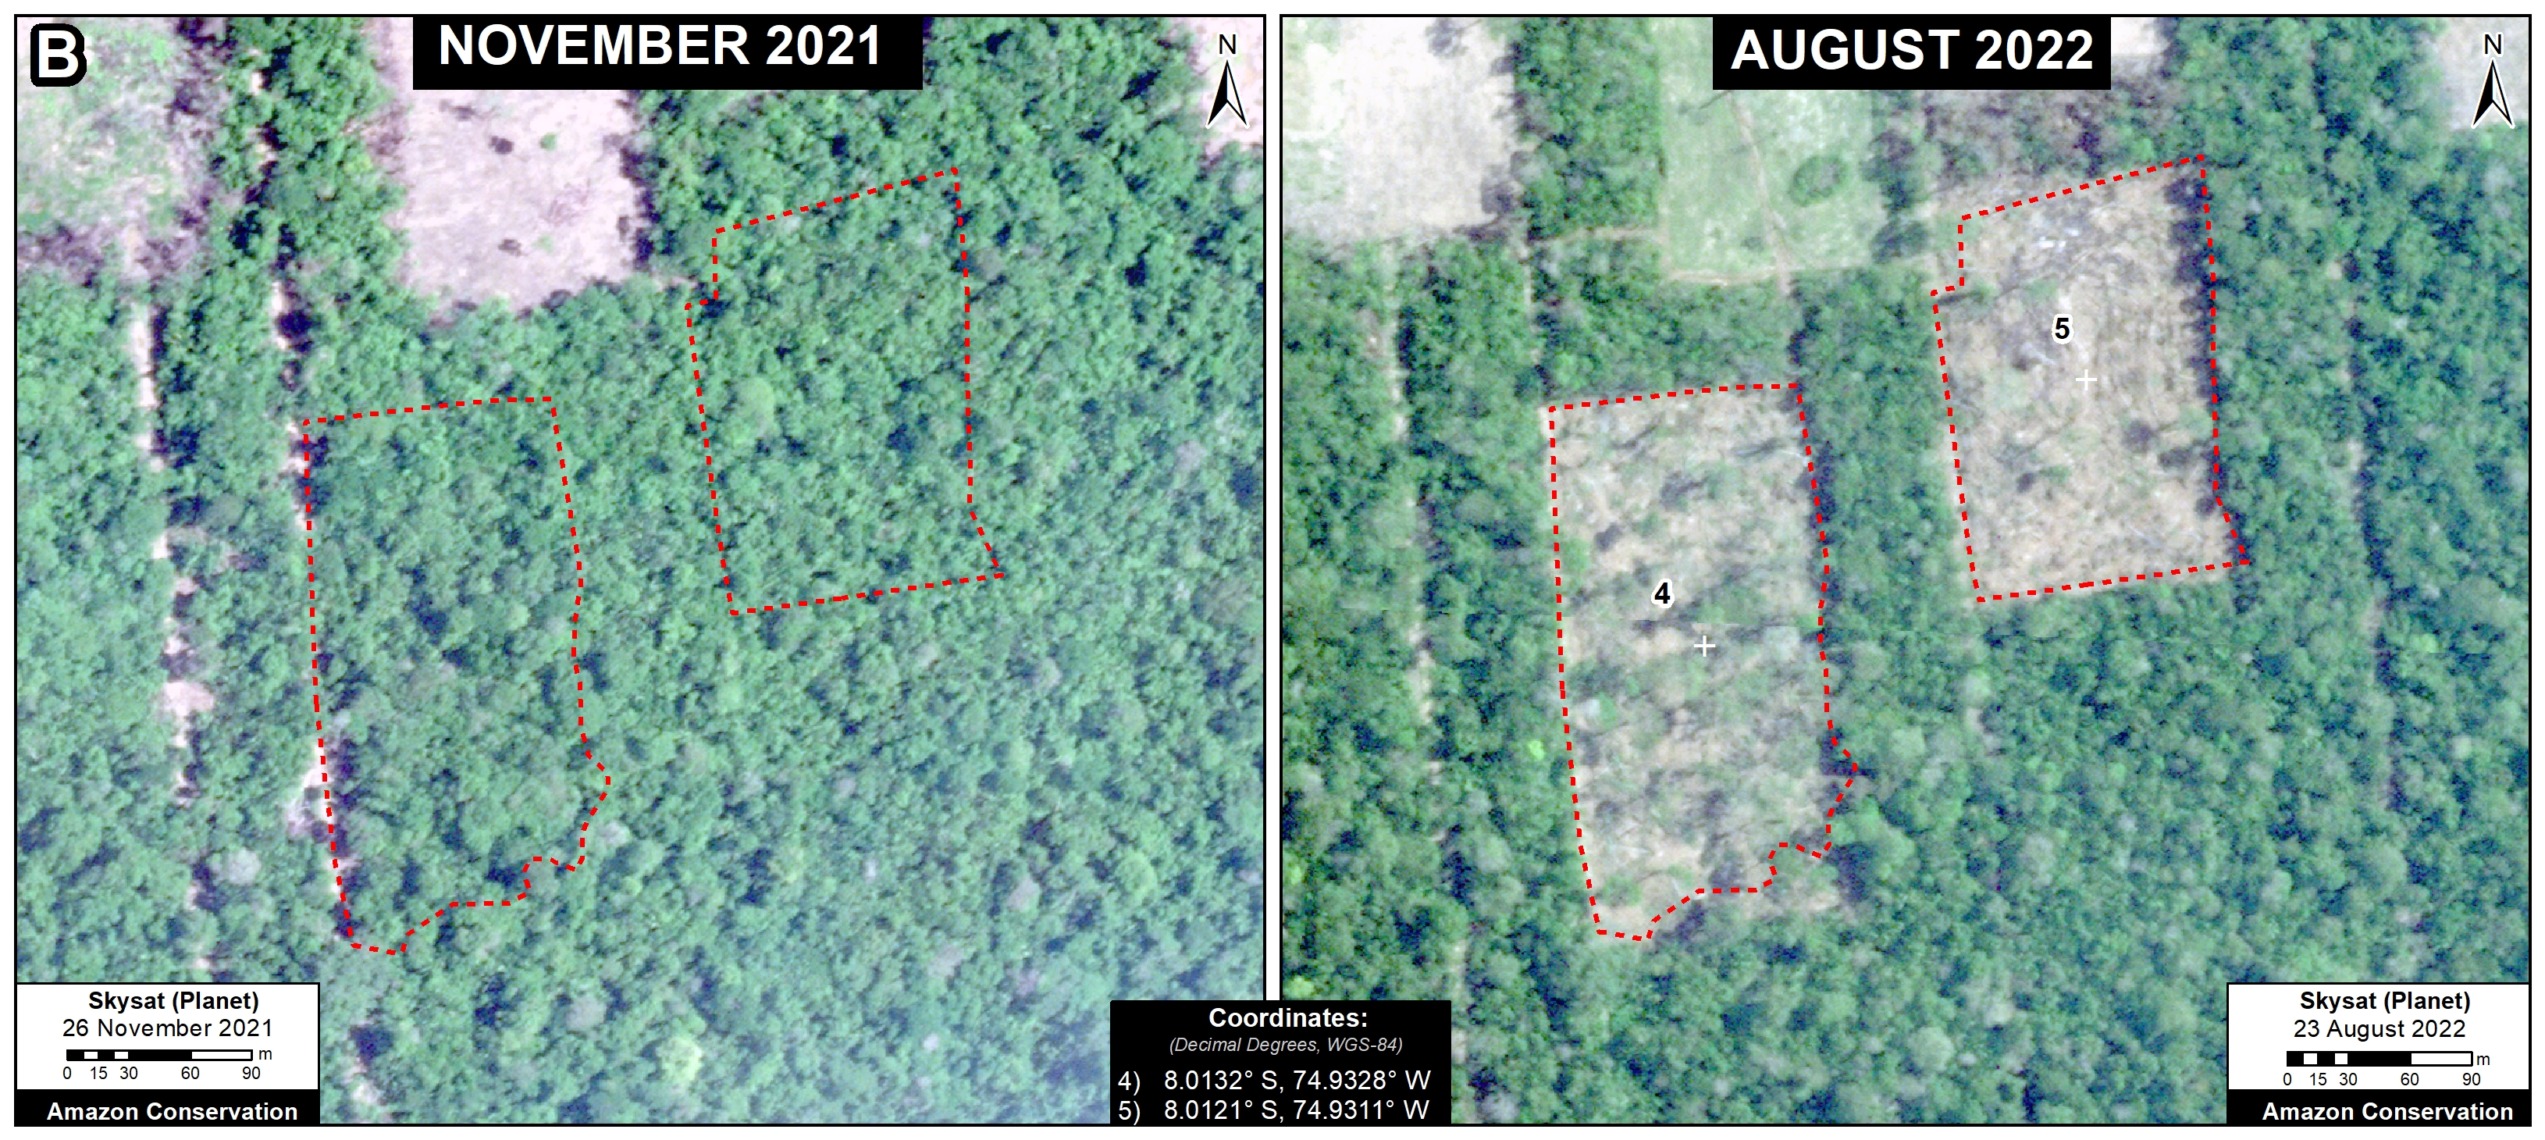
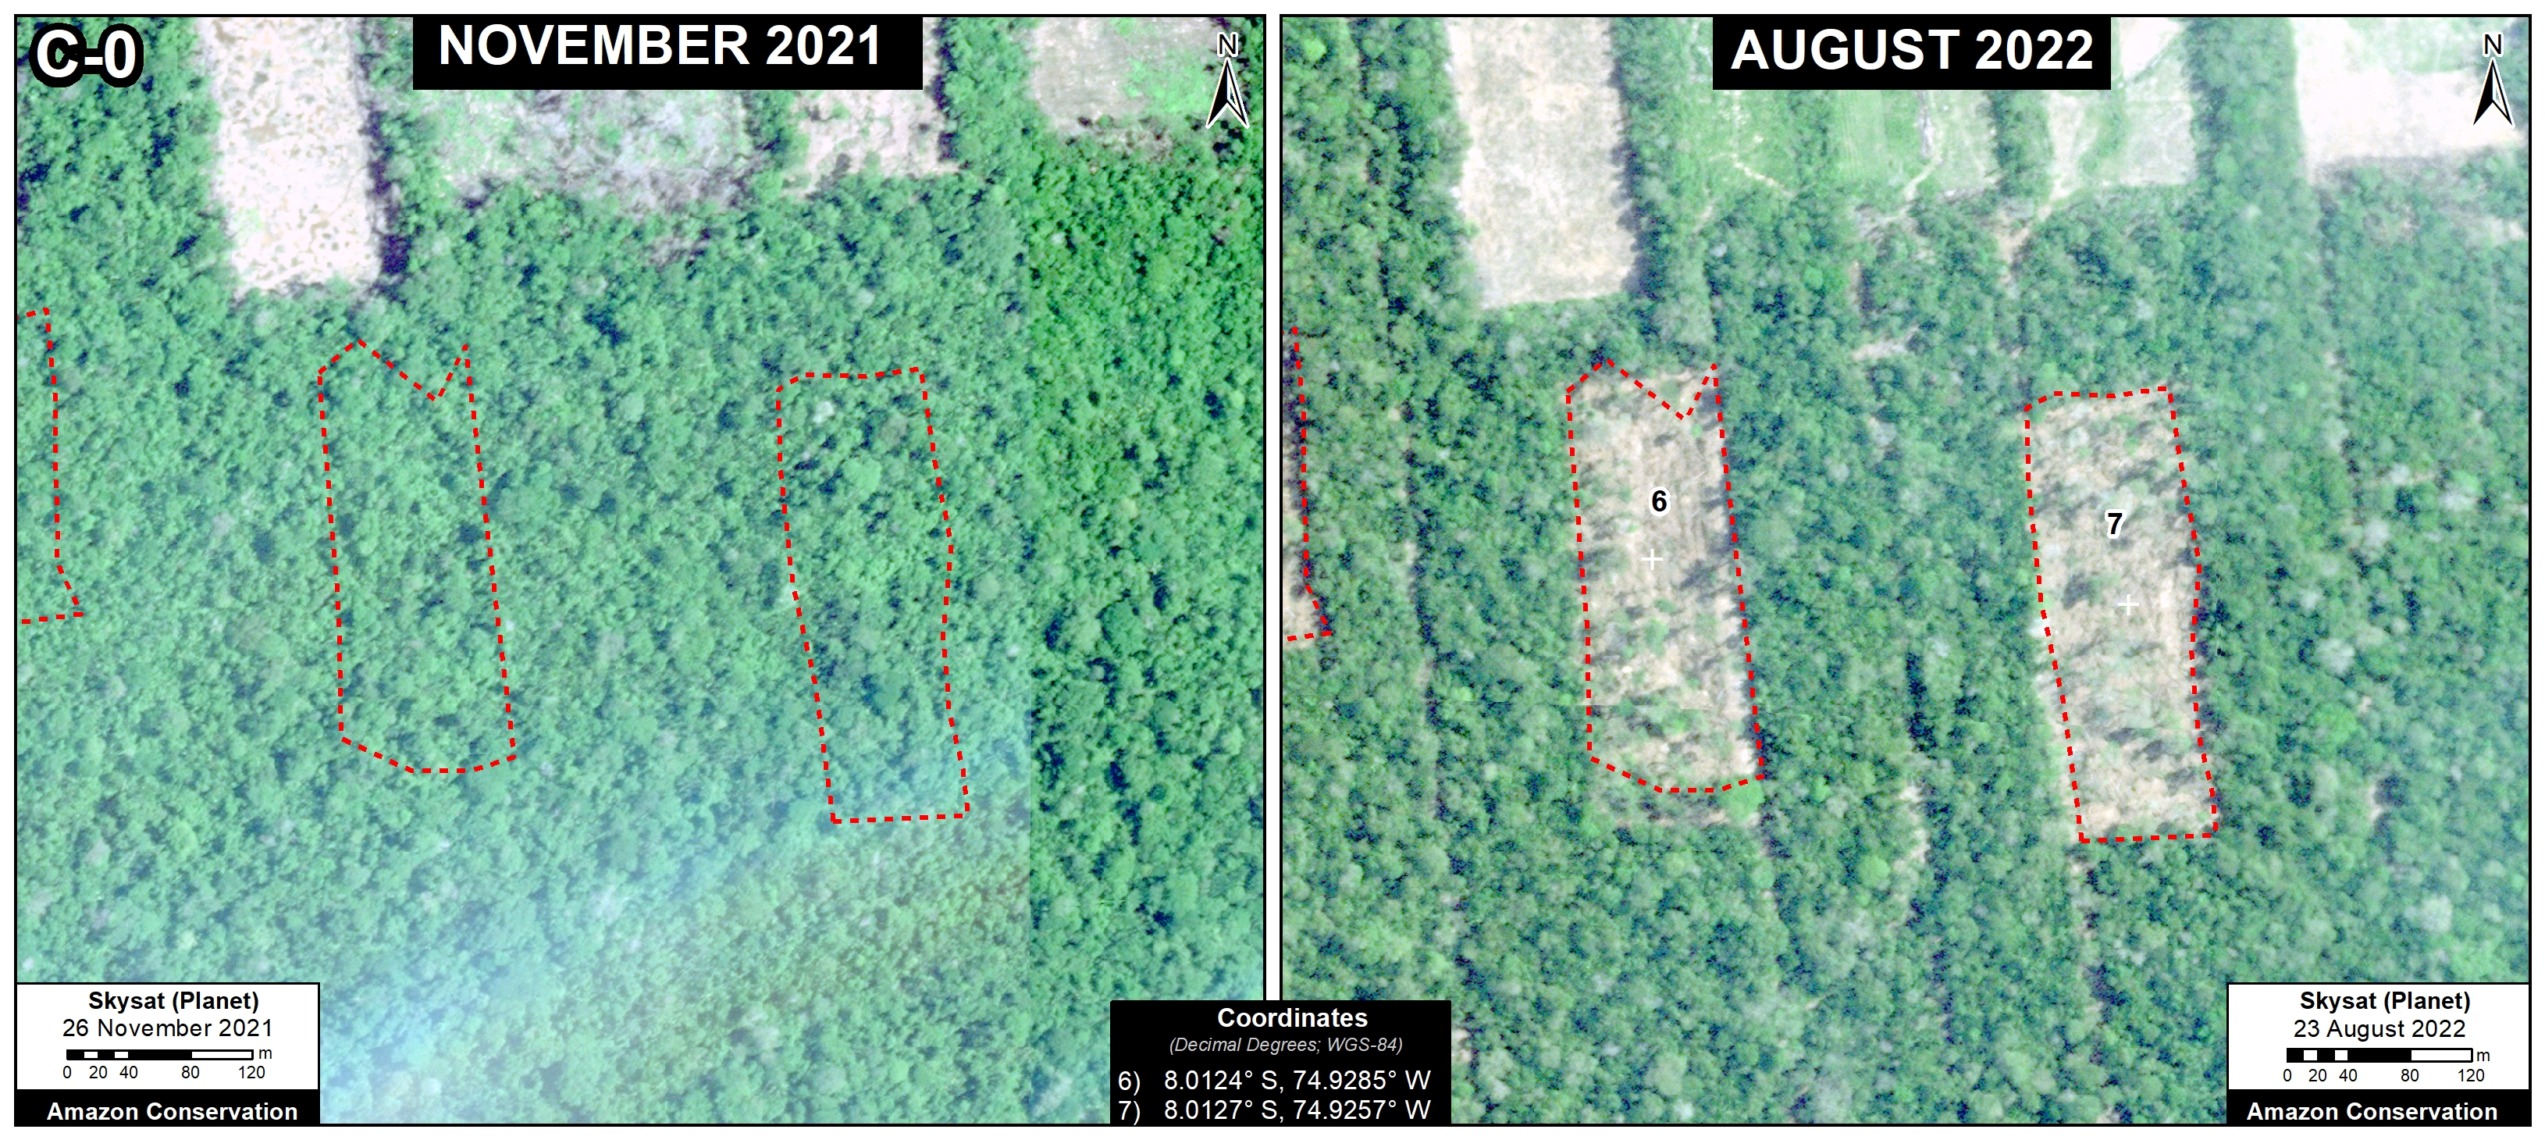
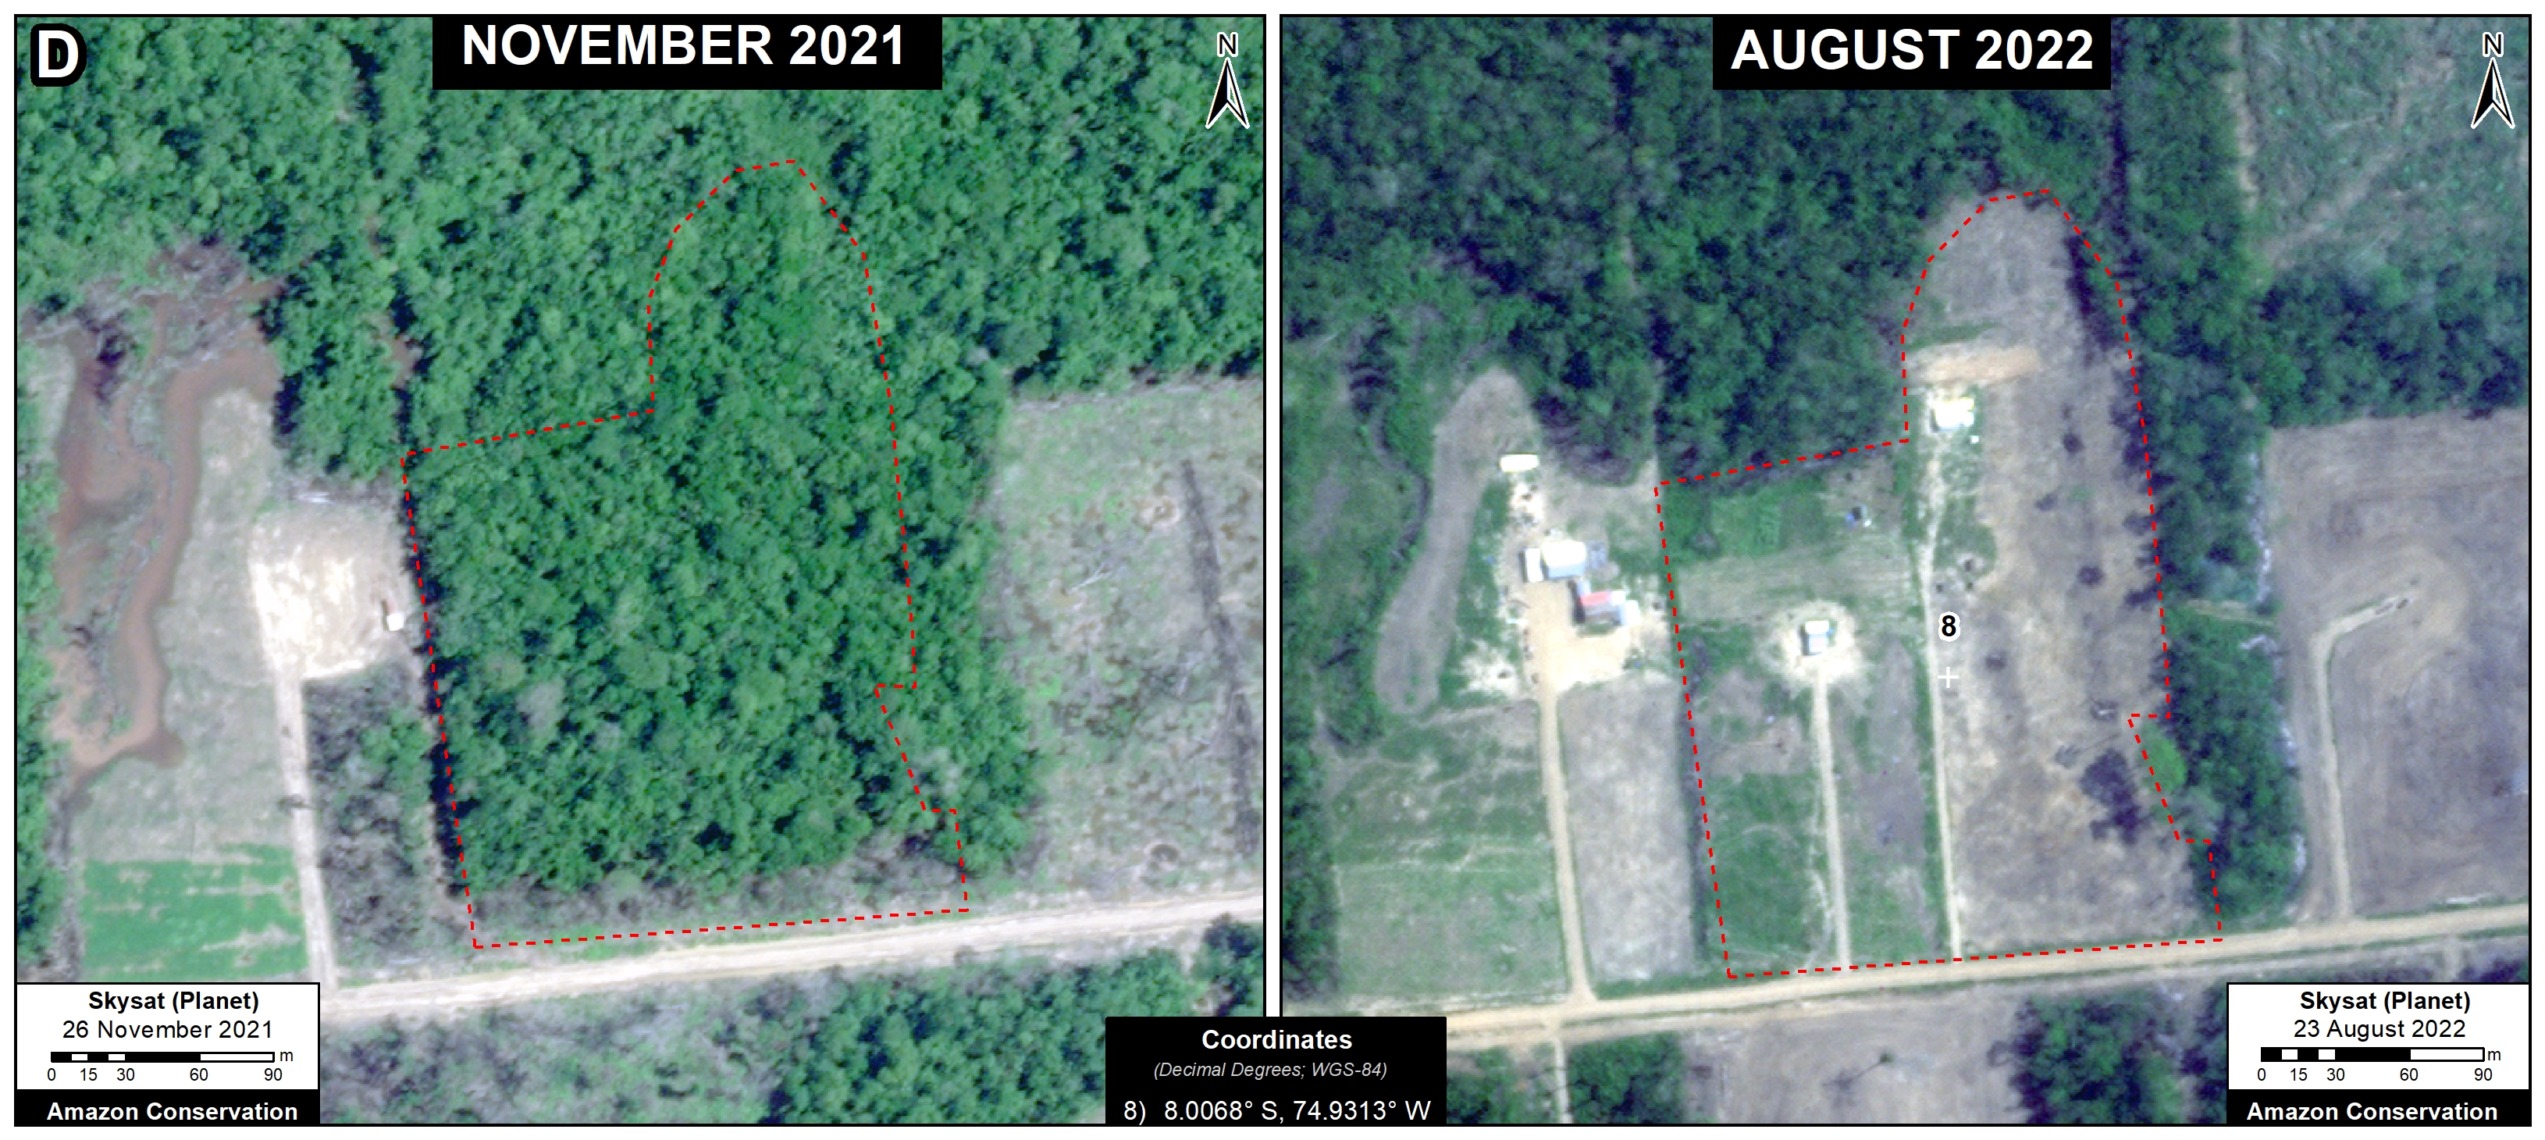
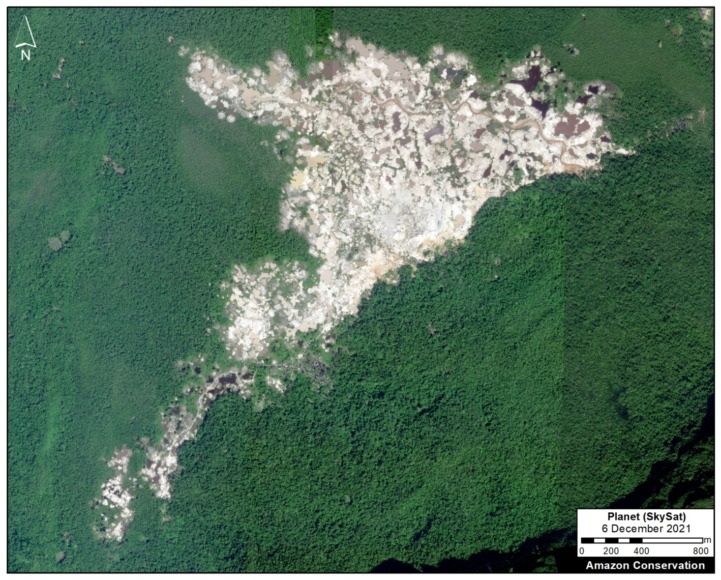
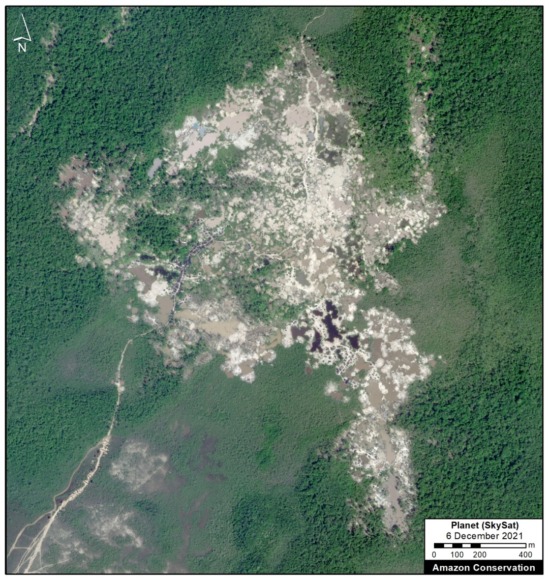
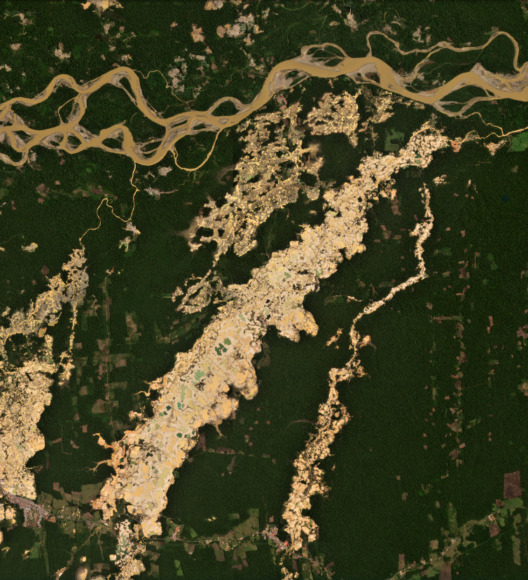
Figure 1. Recent mining deforestation in the Guacamayo zone of the Mining Corridor (Madre de Dios region of the southern Peruvian Amazon). Data: Planet.

Gold mining continues to be one of the main deforestation drivers in the southern Peruvian Amazon (Madre de Dios region).

In a recent report (MAAP #154), we highlighted the key cases of illegal mining in this area.

In an attempt to organize mining activities and promote a formalization process,* the Peruvian government has delimited a large Mining Corridor in Madre de Dios (see Base Map below).

Here, we analyze recent (2021 – 2022) deforestation in the Mining Corridor, using a novel methodology.

Deforestation within its limits is important because, although it may not be illegal, can be considerable due to the large area covered by the Mining Corridor (498,296 hectares, or 1.2 million acres).

The key part of this analysis is the novel ability to distinguish mining deforestation from agriculture deforestation, which is also common in the area.

In summary, we estimate the direct mining deforestation of 11,200 hectares (27,675 acres) in the Mining Corridor over the last two years (2021-22).

Deforestation in the Mining Corridor

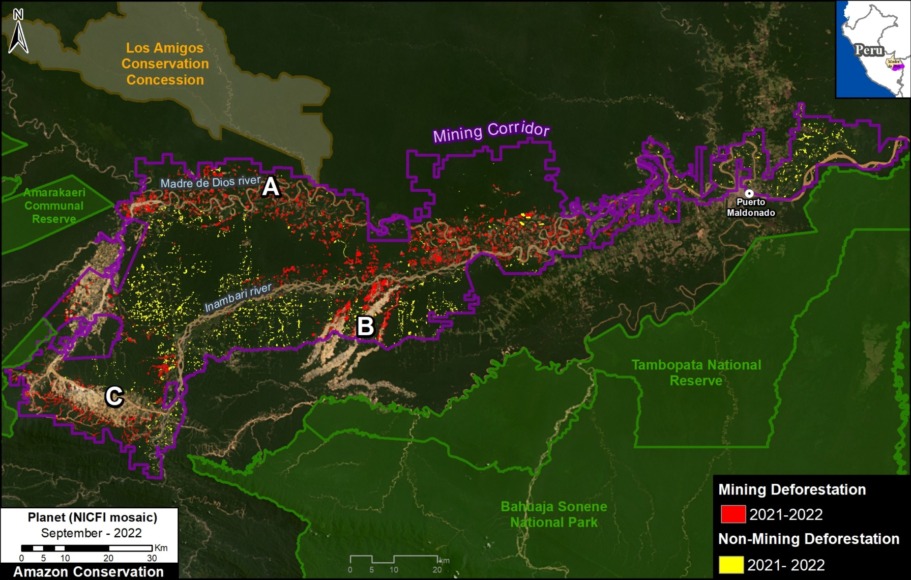
Base Map. Mining (red) vs Agriculture (yellow) deforestation within the Mining Corridor in the southern Amazon of Peru (Madre de Dios region), during the years 2021 and 2022. Data: ACCA/MAAP.

We found a total deforestation of 16,000 hectares (39,500 acres) within the Mining Corridor over the past two years (2021 and 2022).

Of this deforestation total, 70% is directly linked to gold mining (11,200 hectares; indicated by red on the Base Map), while the remaining 30%  loss is agricultural expansion (4,800 hectares; indicated by yellow).

In the Base Map, note that mining deforestation is largely concentrated in three general areas:
(A) along the Madre Dios River, (B) the Guacamayo mining zone (also see Figure 1, above), and (C) around the perimeter of the Huepetuhe mining zone.

*Note on the mining formalization process in Peru

In the Mining Corridor, officially called the “Zona de pequeña minería y minería artesanal en el departamento de
Madre de Dios,” declared by Legislative Decree No. 1100, mining activities can be classified into one of three scenarios:

1) Formal: Formalization process completed, with approved environmental and operational permits.
2) Informal: In the process of being formalized, operating in spaces where extraction is allowed and using permitted machinery. This type is considered an administrative offense, not a crime.
3) Illegal: Operating in prohibited areas such as bodies of water (for example, a river or a lake) and/or using prohibited machinery. This type is considered a crime and is punishable by jail.

Methodology

We used LandTrendr, a temporal segmentation algorithm that identifies changes in pixel values through time, to detect forest loss within the mining corridor in 2021 (September 2020 – September 2021) and 2022 (September 2021 – July 2022). It is important to emphasize this method was originally designed for moderate-resolution (30 meters) Landsat imagery,1 but we adapted it for higher-resolution (4.7 meters) NICFI-Planet monthly mosaics.2

Additionally, we created a baseline for the period 2016- 2020 to eliminate old agriculture and mining areas (pre-2021) due to rapid changes in the natural re-vegetation process.

Finally, we manually separated the mining and non-mining forest loss for 2021 and 2022, in order to report specifically on direct mining-related impacts. For this part of the analysis, we used various resources to aid the manual process, such as radar-based alerts (RAMI), CINCIA historical data from 1985 to 2020, and forest loss data from the Peruvian government (PNCB) and the University of Maryland.

1. Kennedy, R.E., Yang, Z., Gorelick, N., Braaten, J., Cavalcante, L., Cohen, W.B., Healey, S. (2018). Implementation of the LandTrendr Algorithm on Google Earth Engine. Remote Sensing. 10, 691.
2.  Erik Lindquist, FAO, 2021

Acknowledgments

We thank S. Otoya for helpful comments on this report.

This report was conducted with technical assistance from USAID, via the Prevent project. Prevent works with the Government of Peru, civil society and the private sector to prevent and combat environmental crimes for the sake of the conservation of the Peruvian Amazon, particularly in the regions of Loreto, Madre de Dios and Ucayali.

This publication is made possible with the support of the American people through USAID. Its content is the sole responsibility of the authors and does not necessarily reflect the views of USAID or the US government.


Citation

Mamani N, Finer M (2022) Deforestation in Mining Corridor of Peruvian Amazon (2021-2022). MAAP: 171.

MAAP #166: Mennonites have deforested 4,800 hectares (11,900 acres) in the Peruvian Amazon

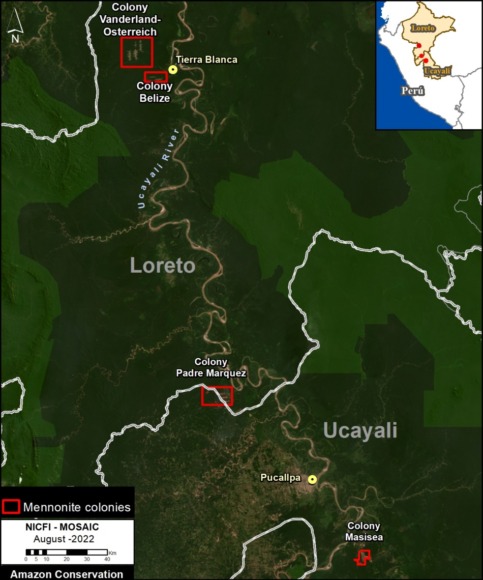
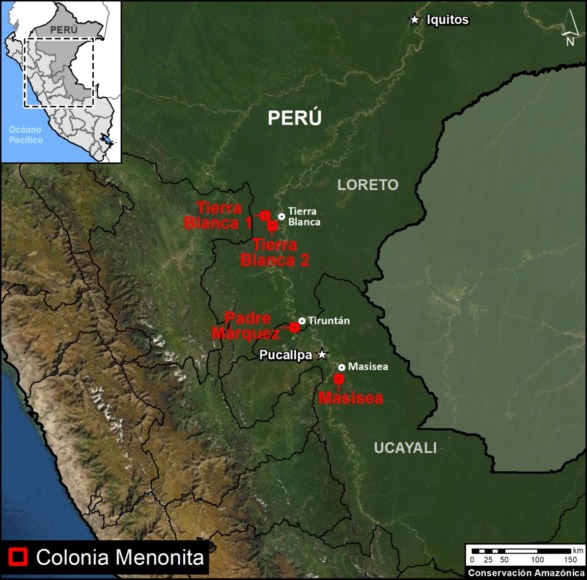
Base Map. Mennonite colonies in the Peruvian Amazon. Data: ACA/MAAP.

Since 2017, the Mennonites have arrived in the Peruvian Amazon and created 5 new colonies.

Here, we show that these colonies have caused the deforestation of more than 4,800 hectares (11,860 acres) of tropical forest, including 650 hectares (1,600 acres) in 2022.

The Base Map shows the current situation regarding the Mennonites in Peru. Note that the 5 colonies are indicated in red.

The Padre Marquez colony, located on both sides of the border between the regions of Ucayali and Loreto, has caused the deforestation of 976 hectares (2,412 acres). It is the newest colony (and represents the most urgent current situation), created in 2021 and with a great expansion in the current year 2022.

The Vanderland, Osterreich and Belize colonies, located near the town of Tierra Blanca (Loreto region), have caused the deforestation of 2,884 hectares (7,126 acres) since 2017. These colonies are also expanding in 2022.

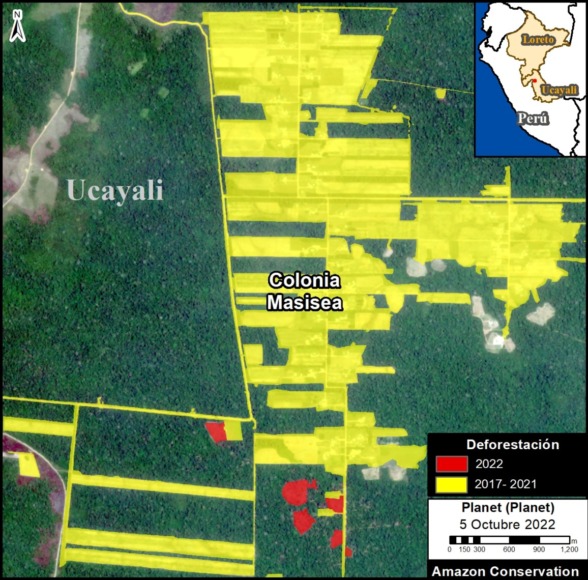
The Masisea colony, located south of the city of Pucallpa (Ucayali region), has caused the deforestation of 960 hectares (2,372 acres) since 2017.

In total, we have documented the deforestation of 4,819 hectares (11,908 acres) in the five new Mennonite colonies in the Peruvian Amazon.

Below, we detail the deforestation history in each colony since 2017, with an emphasis on the most recent loss in 2022.

Deforestation in Mennonite Colonies (Peruvian Amazon)

Padre Marquez Colony

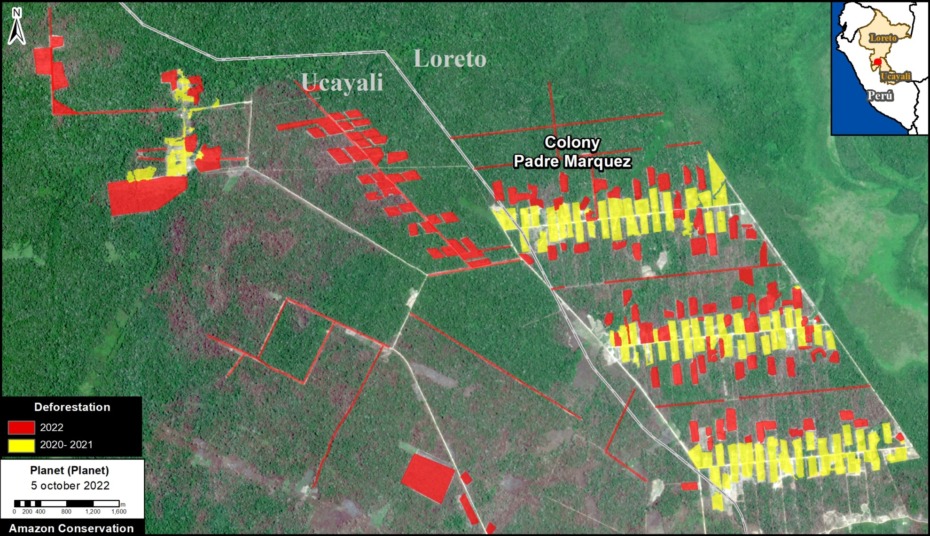
This colony is located on both sides of the border between the departments of Ucayali and Loreto, and has received its name since it originated in the district of Padre Marquez (Loreto). It is the newest colony, created in 2021 with the deforestation of 466 hectares (1,150 acres). This colony had a large expansion in 2022 (perhaps forming a new colony?), with additional deforestation of 491 hectares (1,213 acres). In total, we documented the deforestation of 976 hectares (2,412 acres) in the Padre Marquez colony, between the two years 2021 and 2022 (see yellow and red, respectively, in the image below). It should be emphasized that we estimate the additional degradation of 1,600 hectares (3,954 acrres) by fires that have escaped from the Mennonite plantations into the surrounding forests.

Deforestation in the Padre Marquez Mennonite colony. Data: ACA/MAAP, Planet.
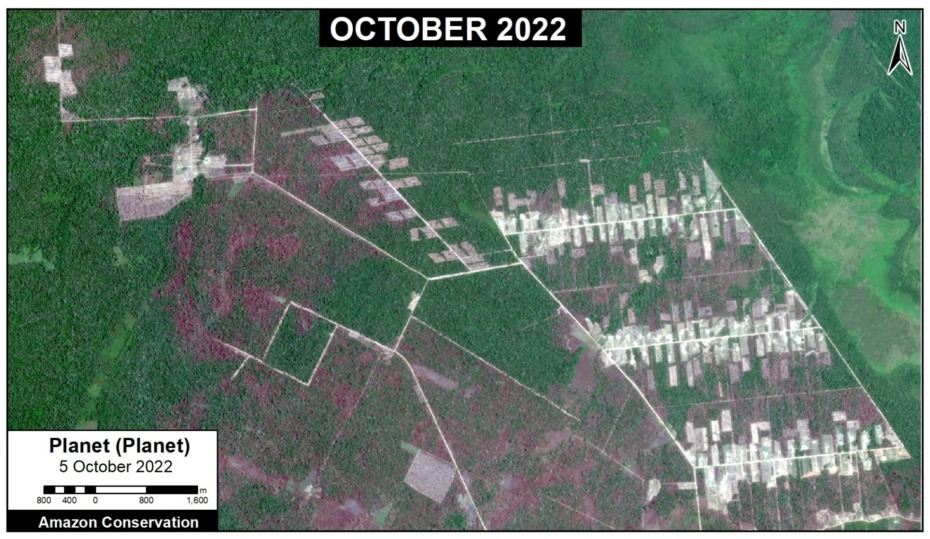
Recent image of deforestation in the Padre Marquez Mennonite colony. Data: Planet.

Vanderland & Osterreich Colonies

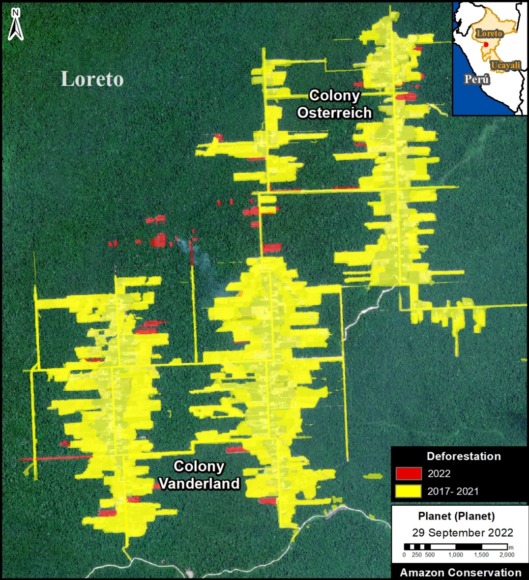
These two colonies are located near the town of Tierra Blanca, in the Loreto region. Deforestation was highest between the years 2017 and 2020, with the loss of 2,300 hectares (5,683 acres) (see yellow in the image, below). In 2022, we have detected the new deforestation of 71 hectares (175 acres) (see red).

Deforestation in the Vanderland & Osterreich Mennonite colonies. Data: ACA/MAAP, Planet.
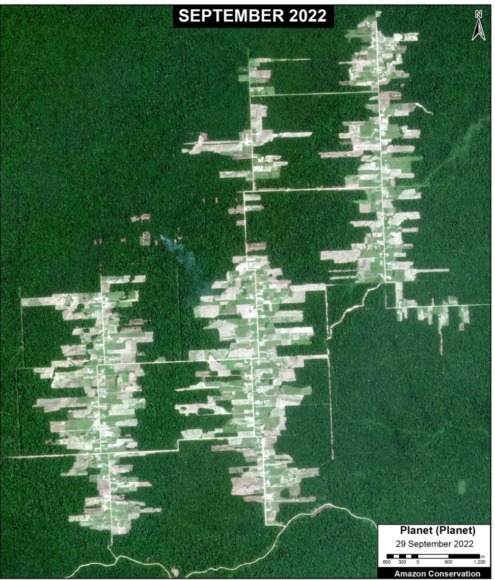
Recent image of deforestation in the Vanderland & Osterreich Mennonite colonies. Data: Planet.

Belize Colony

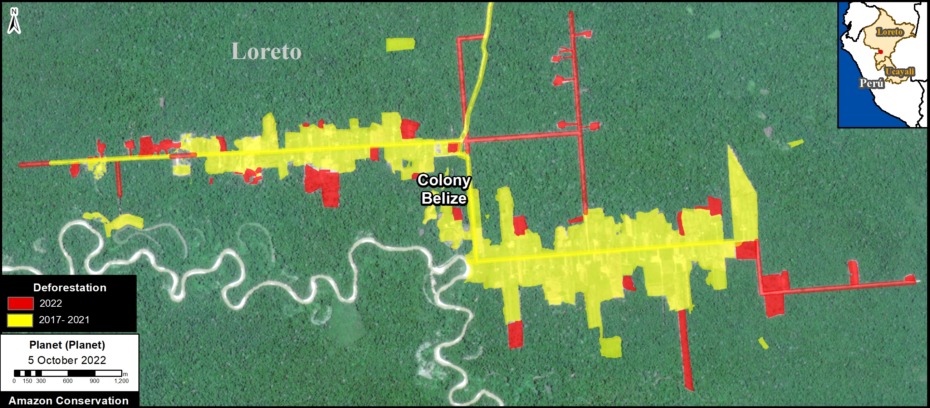
This colony is also located near the town of Tierra Blanca (Loreto region) and also registered the highest deforestation between 2017 and 2020, with the loss of 438 hectares (1,082 acres). In 2022, we have detected a new deforestation of 74 hectares (182 acres). Note that this most recent 2022 deforestation is expanding deeper into the surrounding forest.

Deforestation in the Belize Mennonite colony. Data: ACA/MAAP, Planet.
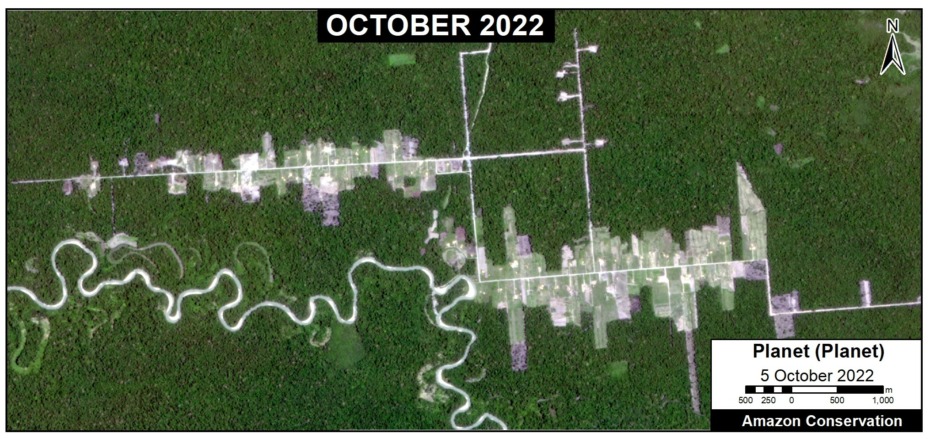
Recent image of deforestation in the Belize Mennonite colony. Data: Planet.

Masisea Colony

Esta colonia se ubica en la región Ucayali, y es la única que se ubica al sur de la ciudad de Pucallpa. La deforestación fue más alta entre los años 2017 y 2019, con la pérdida de 944 hectáreas. Al este, hubo una expansión en el 2021 de 47 hectáreas adicionales. No hemos detectado expansión notable en el 2022.

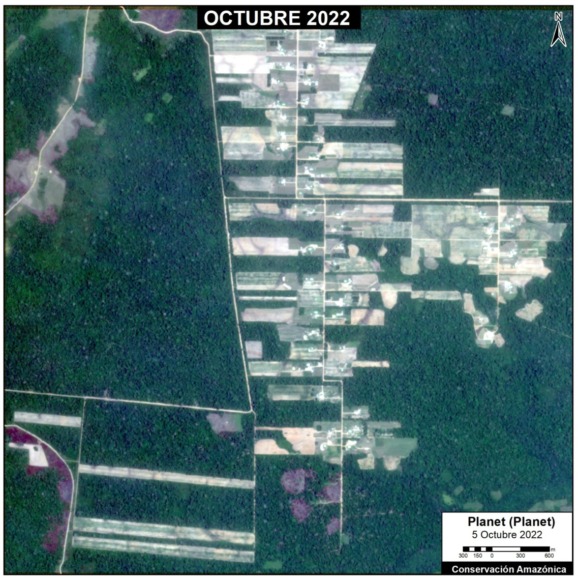
This colony is located in the Ucayali region, and is the only one located south of the city of Pucallpa. Deforestation was highest between 2017 and 2019, with the loss of 944 hectares (2,332 acres). To the east, there was an expansion in 2021 of an additional 47 hectares (117 acres). We have not detected notable expansion in 2022.

Deforestation in the Masisea Mennonite colony. Data: ACA/MAAP, Planet.
Recent image of deforestation in the Masisea Mennonite colony. Data: Planet.

Citation

Finer M, Ariñez A (2022) Mennonites have deforested 4,800 hectares (11,900 acres) in the Peruvian Amazon. MAAP: 166.

MAAP #164: Amazon Tipping Point – Where Are We?

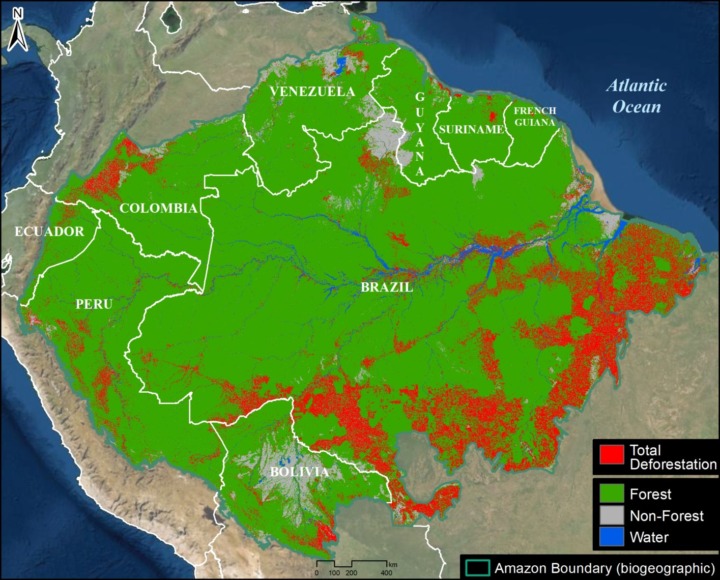
Base Map. Total Amazon forest loss. Data: ACA/MAAP.

It is increasingly reported that the largest rainforest in the world, the Amazon, is rapidly approaching a tipping point.

As repeatedly highlighted by the late Tom Lovejoy (see Acknowledgements), this tipping point is where parts of the rainforest will convert into drier ecosystems due to disrupted precipitation patterns and more intense dry seasons, both exacerbated by deforestation.

The Amazon generates much of its own rainfall by recycling water as air passes from its major source in the Atlantic Ocean. Thus, high deforestation in the eastern Amazon may lead to downwind impacts in the central and western Amazon (see Background section below).

The scientific literature indicates this tipping point could be triggered at 25% Amazon forest loss, in conjunction with climate change impacts.

The literature, however, is less clear on the critical first part of the tipping point equation: how much of the Amazon has already been lost?

There are numerous estimates, including 14% forest loss cited in the recent Science Panel for the Amazon report, but we did not find any actual definitive studies specifically addressing this question.

Here, we directly tackle this key question of how much of the original Amazon has been lost to date.

First, we present the first known rigorous estimate of original Amazon biome forest prior to European colonization: over 647 million hectares (1.6 billion acres; see Image 1 below).

Second, we estimate the accumulated total Amazon forest loss, from the original estimate to the present: over 85 million hectares (211 million acres; see Base Map).

Combining these two results, we estimate that 13% of the original Amazon biome forest has been lost.

More importantly, however, focusing on just the eastern third of the Amazon biome (see Image 2 below), we estimate that 31% of the original forest has been lost, above the speculated tipping point threshold. This finding is critical because the tipping point will likely be triggered in the eastern Amazon, as it is closest to the oceanic source of the water that then flows to the central and western Amazon.

Original Amazon Forest

Image 1 shows the first known estimate of original Amazon forest prior to European colonization. Note that we use a broader biogeographical definition of the Amazon that covers nine countries (Amazon biome) rather than the strict Amazon watershed (see Methodology).
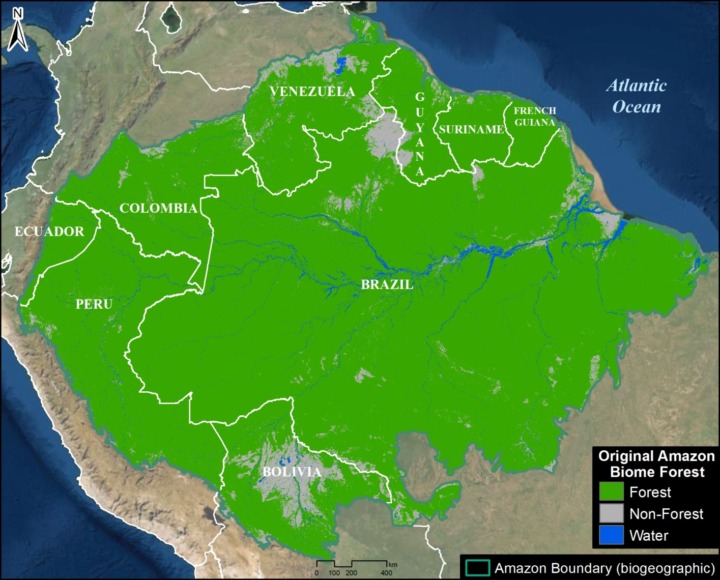
Image 1. Original Amazon biome forest. Data: ACA/MAAP.

This represents the most rigorous effort to date to recreate the original Amazon. For example, we attempted to recreate original forest lost to historic dam reservoirs.

The map has just three classes: Original Amazon forest, Original non-forest (such as natural savannah), and Water.

We found that the original Amazon forest covered over 647 million hectares (647,607,020 ha). This is equivalent to 1.6 billion acres.

Of this total, 61.4% occurred in Brazil, followed by Peru (12%), Colombia (7%), Venezuela (6%), and Bolivia (5%). The remaining four countries (Ecuador, Guyana, Suriname, and French Guiana) make up the final 8%.

Amazon Forest Loss

Image 2 shows the accumulated total Amazon forest loss, from the original estimate to the present (2022).
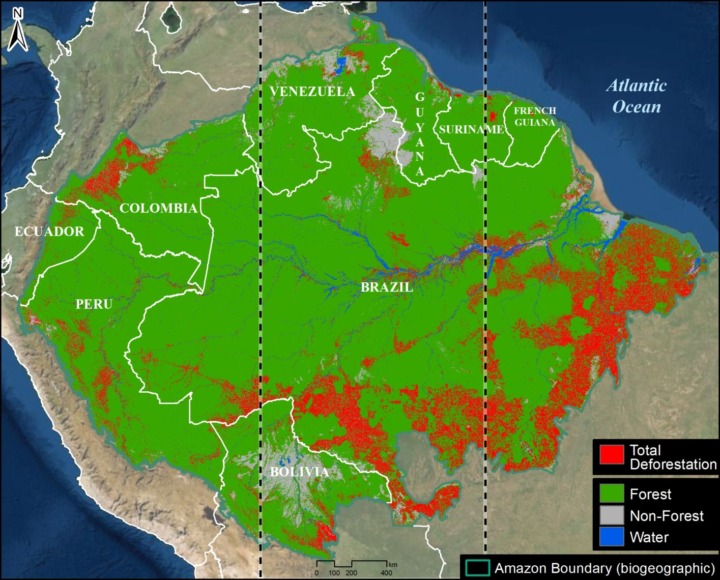
Image 2. Total Amazon forest loss. Vertical lines indicate the Amazon broken down into thirds. Data: ACA/MAAP.

Of the original forest noted above, we documented the historic loss of over 85 million hectares (85,499,157 ha). This is equivalent to 211 million acres.

The largest loss occurred in Brazil (69.5 million ha), followed by Peru (4.7 million ha), Colombia (4 million ha), Bolivia (3.8 million ha), and Venezuela (1.4 million ha). The remaining four countries (Ecuador, Guyana, Suriname, and French Guiana) make up the final 1.9 million ha.

By comparing the original Amazon biome, we calculated the historic loss of 13.2% of the original Amazon forest due to deforestation and other causes.

More importantly, however, we find that 30.8% of the original Amazon has been lost in the eastern third of the Amazon biome (see vertical dashed lines Image 2), above the speculated tipping point threshold. This finding is critical because as noted above, the tipping point will likely be triggered in the east as it is the source of the water flowing to the central and western Amazon.

In contrast, we find that 10.8% of the original Amazon has been lost in the central third of the Amazon biome and 6.3% has been lost in the western third, both of which are below the speculated tipping point threshold.

Background

The Amazon generates around half of its own rainfall by recycling moisture up to 6 times as air masses move from the Atlantic Ocean in the east across the basin to the west. Thus, the rainforest plays a major part in keeping itself alive, by recycling water through its trees to generate rainfall from east to west.

This unique hydrological cycle has historically supported rainforest ecosystems for vast areas far from the main ocean source.

But it also raises the question of how much deforestation would be required to cause the cycle to degrade to the point of being unable to support these forests, thus the Amazon tipping point hypothesis.

In this scenario, rainforests would transform into drier ecosystems, such as open canopy scrubland and savannah.

The tipping point concept originally referred to an abrupt ecosystem change, but it is now believed that the shift could happen gradually (30-50 years).

It is worth noting that the western Amazon near the Andes mountains would likely maintain its rainforests, as air currents flowing over the mountains would continue causing water vapor to condense and fall as rain.

Methodology

At the core of this work, we generated two major estimates: original Amazon forest and total historical Amazon forest loss.

For both of these estimates, we used the biogeographical boundary of the Amazon (as determined by RAISG 2020), which encompasses nine countries. Thus, we used a broader definition of the Amazon (Amazon biome) rather than the strict Amazon watershed, which omits part of the northeastern Amazon biome.

For original Amazon forest, we defined three major classes: Forest, Non-Forest, and Water. This analysis was based on data from MapBiomas Brazil (collection 2 from 1990) with some additional modifications. Original Forest was made up of these MapBiomas categories: Forest Formation, Mangrove, Flooded Forest, Mosaic of Agriculture and Pasture. Non-Forest was made up of these MapBiomas categories: Savanna Formation, Natural Non-Forest Flood Formation, Grassland, and Other non-Forest Formations. Water was made up of these MapBiomas categories: River, Lake, Ocean and Glacier.

We then made a number of modifications with manual edits based on data from the University of Maryland, INPE (Terrabrasilis), ArcGis satellite images, Planet mosaics, Google Earth Engine Landsat images from 1984-1990, and official government data for several countries (Ministry of the Environment of Ecuador (MAE) and Peru (GeoBosques/MINAM), Forest and Carbon Monitoring System/IDEAM of Colombia, National Institute for Space Research of Brazil (INPE/Terrabrasilis), General Directorate of Forest Management and Development of Bolivia (DGGDF), and the National Service of Protected Areas of Bolivia (SERNAP). As an example of a major modification, deforested areas and historic dam reservoirs were changed to Original Forest based on an analysis of the oldest available satellite image for the area (1984-1990). We also corrected some misclassifications, such as forest patches in clearly non-forest areas were changed to Non-Forest (and vice versa) and mountain forest areas found as water were changed to Forest. Also, agriculture and urban areas in likely savannah areas were changed to Non-Forest. Additional Water data from MapBiomas based on 1985 was incorporated. Overall, our focus was defining Original Forest as best as possible; data confusions between Non-Forest and Water categories were not worked on as thoroughly.

For total historical Amazon forest loss, we used data from the University of Maryland. Specifically, we first used their data layer ‘Tree Cover 2000″ (>30% canopy density) to estimate historical (pre-2000) forest loss. We then added annual forest loss data from 2001 to 2021.

Finally, we divided the original Amazon forest by the total historical loss to estimate how much of the original Amazon has been lost. In addition, we delimited the Amazon in thirds according to distance east to west at the widest point. We then estimated how much of the original Amazon has been lost in each of these three sections.

References

(in chronological order)

Sampaio, G., Nobre, C., Costa, M. H., Satyamurty, P., Soares‐Filho, B. S., & Cardoso, M. (2007). Regional climate change over eastern Amazonia caused by pasture and soybean cropland expansion. Geophysical Research Letters, 34(17).

Hansen, M. C. et. al. (2013) High-Resolution Global Maps of 21st-Century Forest Cover Change. Science 342.

Nobre et al. (2016) Land-use and climate change risks in the Amazon and the need of a novel sustainable development paradigm. PNAS, 113 (39).

Turubanova S., Potapov P., Tyukavina, A., and Hansen M. (2018) Ongoing primary forest loss in Brazil, Democratic Republic of the Congo, and Indonesia. Environmental Research Letters.

Lovejoy, T. E., & Nobre, C. (2018). Amazon Tipping Point. Science Advances, 4(2).

Lovejoy, T. E., & Nobre, C. (2019). Amazon tipping point: Last chance for action. Science Advances, 5 (12).

Bullock et. al. (2019) Satellite-based estimates reveal widespread forest degradation in the Amazon. Glob Change Biol., 26.

Amigo, I. (2020) The Amazon’s fragile future. Nature, 578.

MapBiomas. 2020. MapBiomas Amazonia v2.0. https://amazonia.mapbiomas.org/.

Killeen (2021) A Perfect Storm in the Amazon Wilderness

Berenguer E. et. al. (2021) Ch 19. Drivers and ecological impacts of deforestation and forest degradation. In: Nobre C, Encalada et al. (Eds). Amazon Assessment Report 2021. United Nations Sustainable Development Solutions Network, New York, USA. Available from https://www.theamazonwewant.org/spa-reports

Hirota M et. al (2021) Science Panel for the Amazon, Ch 24. Resilience of the Amazon Forest to Global Changes: Assessing the Risk of Tipping Points. In: Nobre C, Encalada et al. (Eds). Amazon Assessment Report 2021. United Nations Sustainable Development Solutions Network, New York, USA. Available from https://www.theamazonwewant.org/spa-reports/

Wunderling et al (2022) Recurrent droughts increase risk of cascading tipping events by outpacing adaptive capacities in the Amazon rainforest. PNAS 119 (32) e2120777119.

Acknowledgements

This report is in memory of Tom Lovejoy, who helped launch the critical concept of an Amazon tipping point. Starting in 2019, we collaborated with Tom on the need assessment and background research behind this report.

We thank Carmen Thorndike for helping with the initial literature review, and Carlos Nobre for review of the final report. We also thank J. Beavers (ACA), A. Folhadella (ACA), M.E. Gutierrez (ACCA), and C. Josse (EcoCiencia) for additional comments.

This work was supported by NORAD (Norwegian Agency for Development Cooperation) and ICFC (International Conservation Fund of Canada).

Citation

Finer M, Mamani N (2022) Amazon Tipping Point – Where Are We?. MAAP: 164.
MAAP #165: Confirming Deforestation by Mennonites in the Peruvian Amazon

Recent deforestation in the Padre Marquez Mennonite colony. Data: Planet/Skysat, MAAP.

In a series of previous reports, we have documented the extensive recent deforestation from new Mennonite colonies arriving in the Peruvian Amazon (see MAAP #149).

However, despite the extensive evidence provided by satellite images, the Mennonites have repeatedly denied this deforestation (see References).

Most recently, we detected that the Mennonites had resumed deforestation in the newest colony that we refer to as Padre Marquez (see Base Map in the Annex).

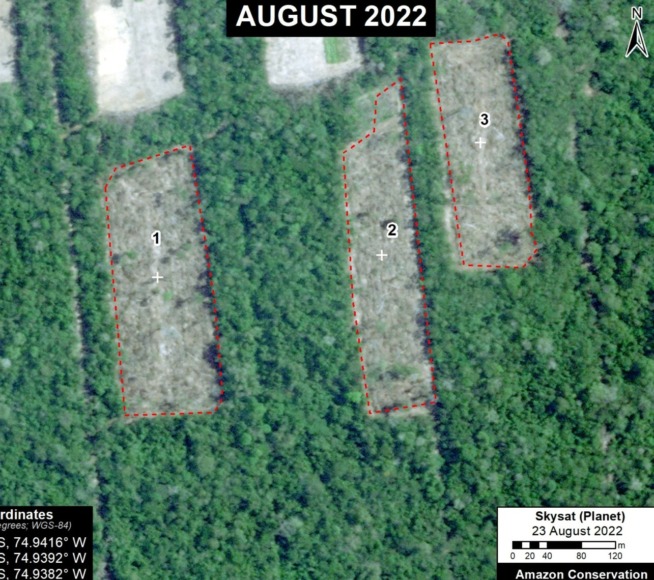
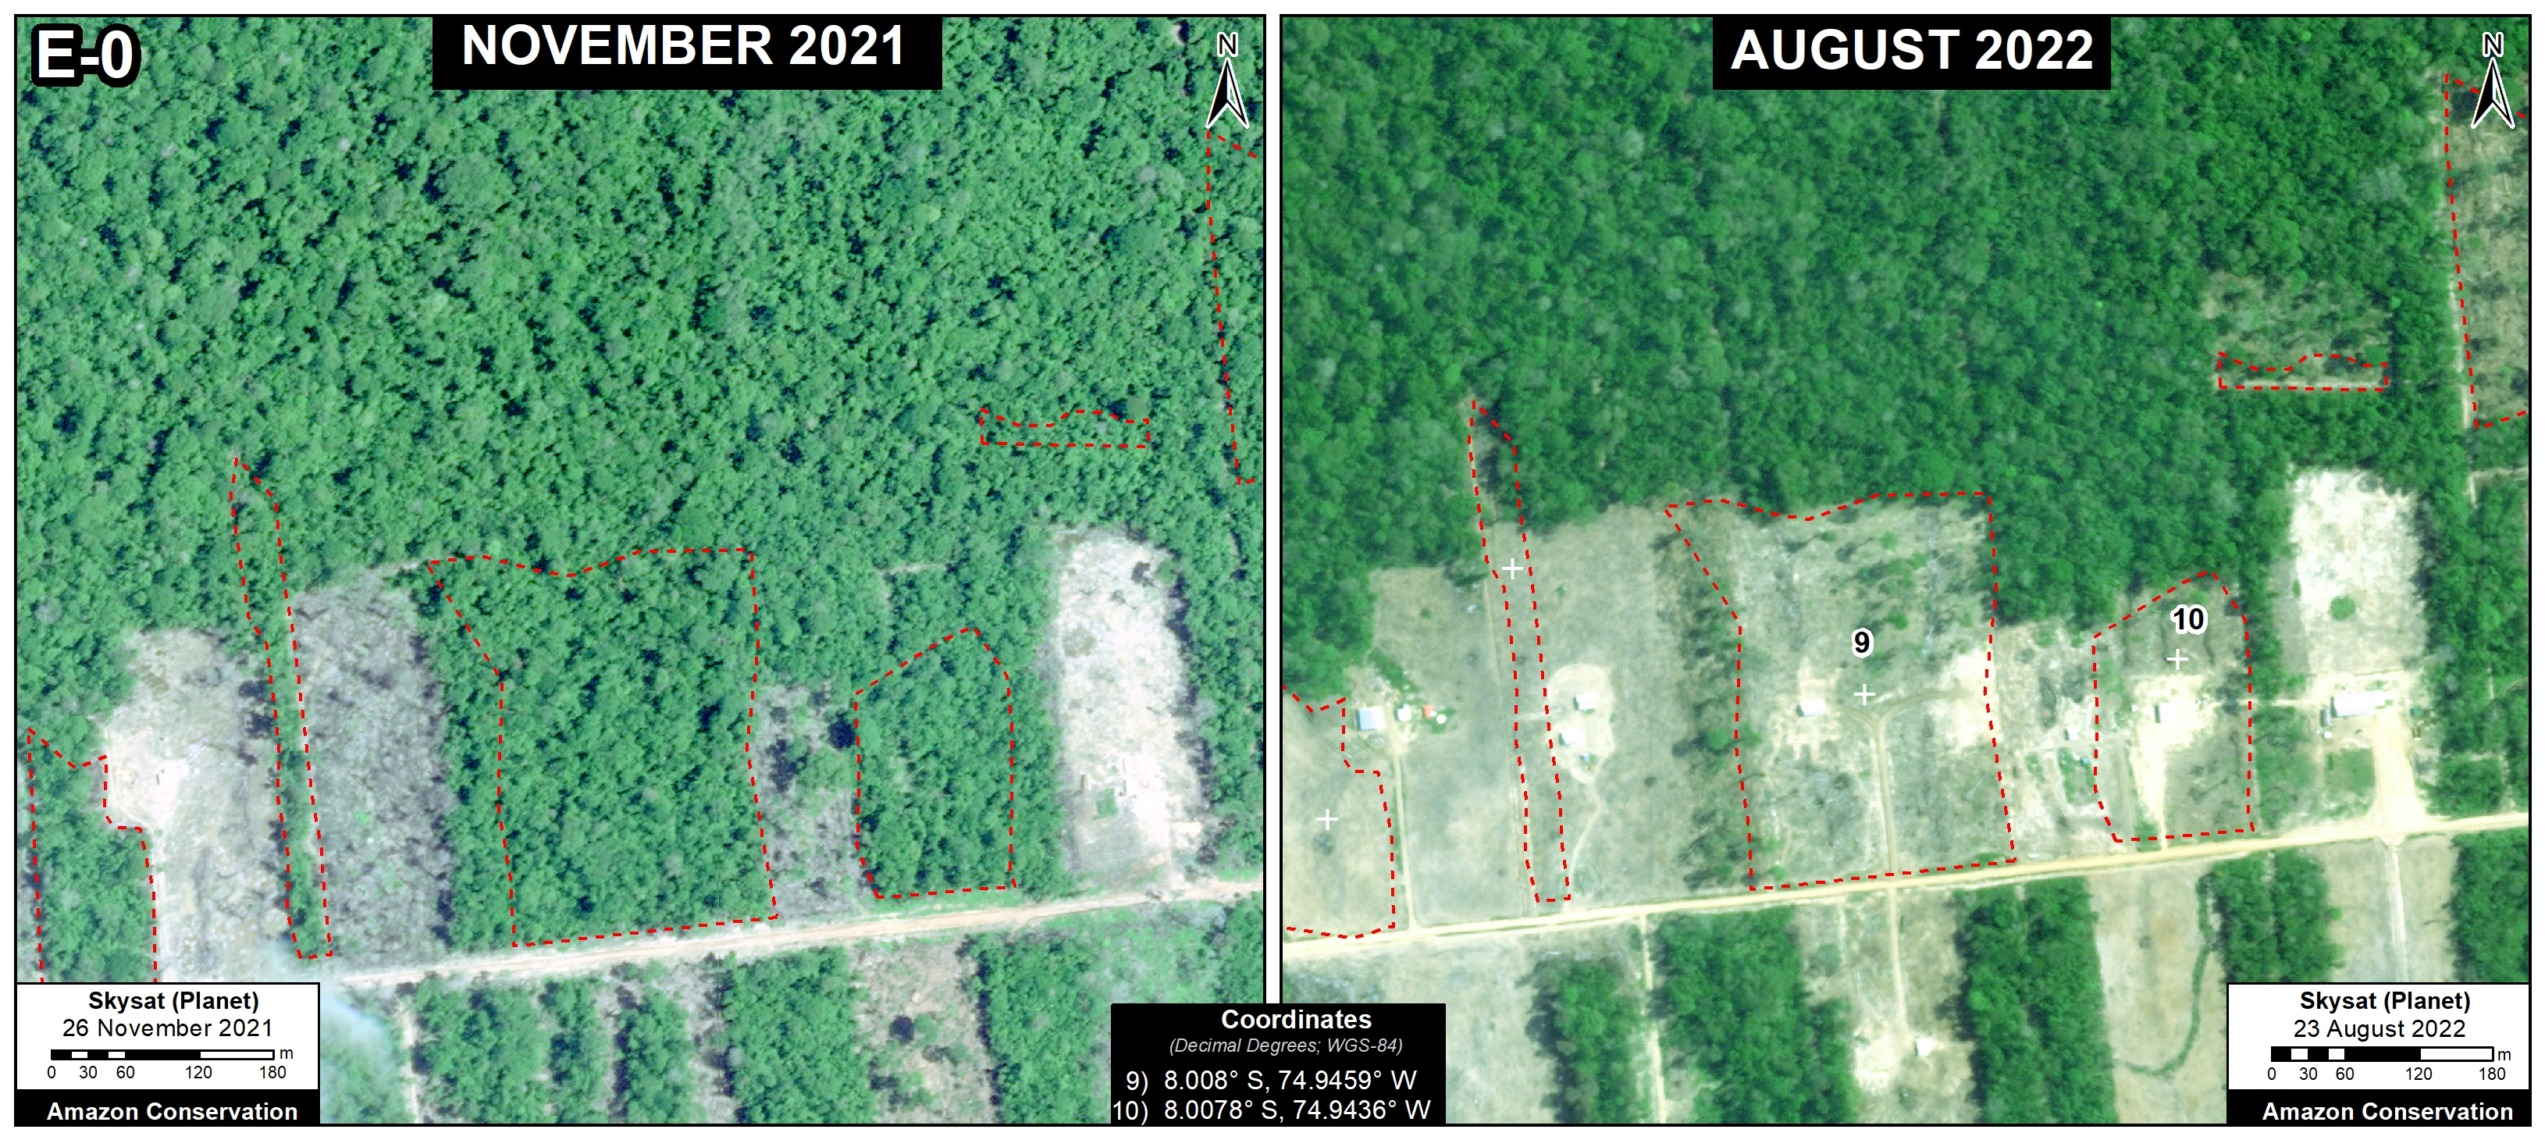
This new deforestation cleared over 90 hectares of primary forest between just August and early September 2022.

In response, we tasked very high-resolution satellite images (0.5 meters from Planet/Skysat) over the area.

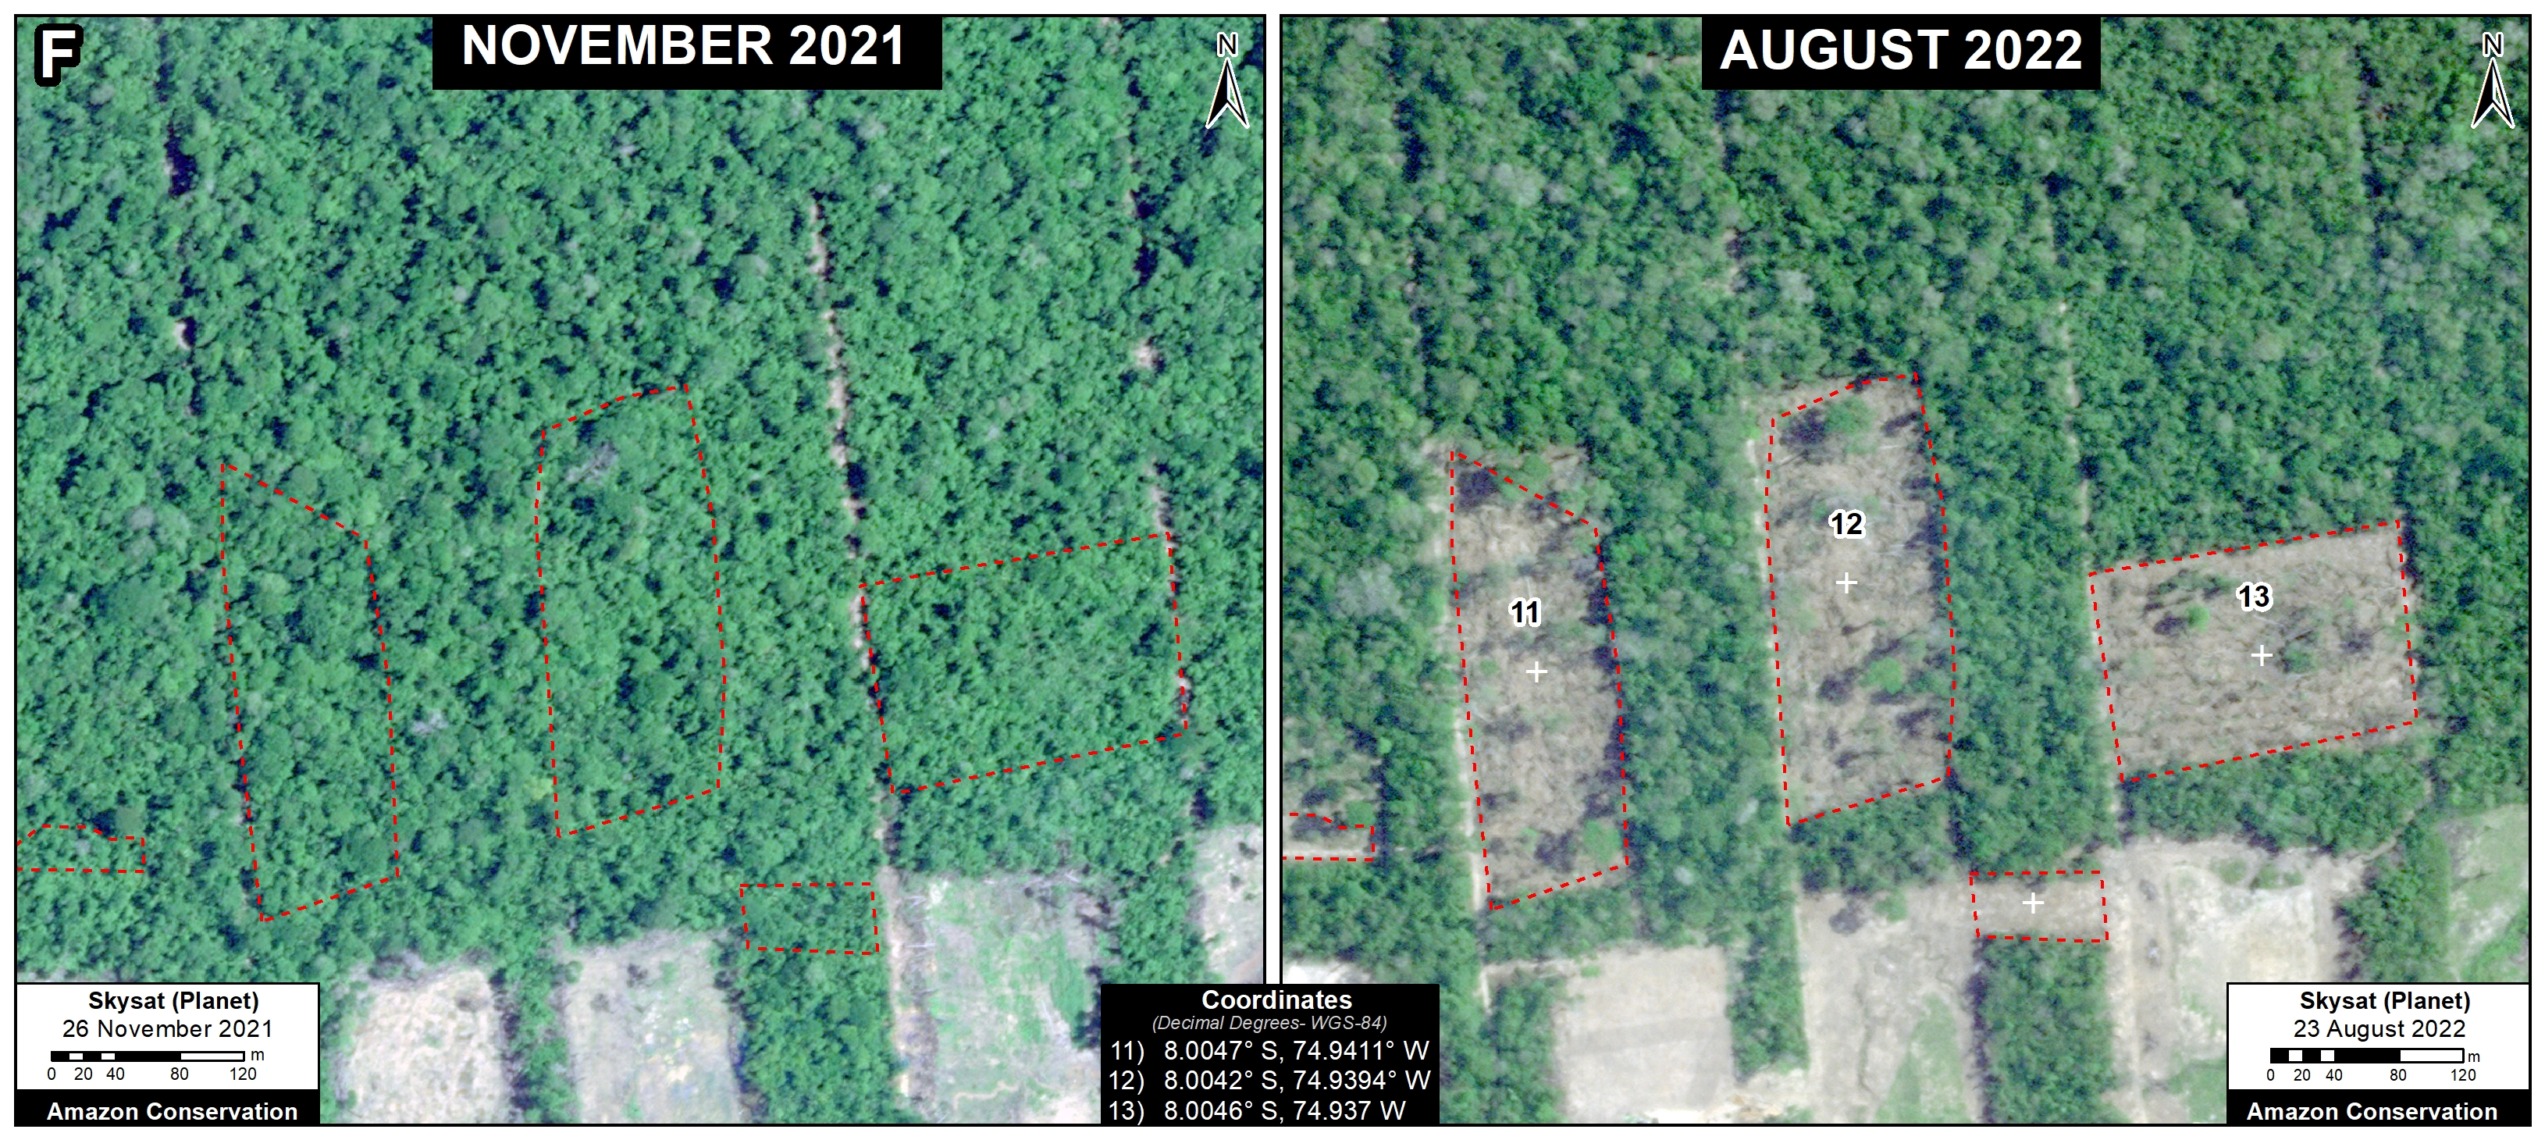
Here, we present these images in comparison to previous Skysats obtained last year, thus providing additional evidence that Mennonites are indeed clearing primary forest.


Recent Mennonite Deforestation
Documented with Very High-Resolution Imagery

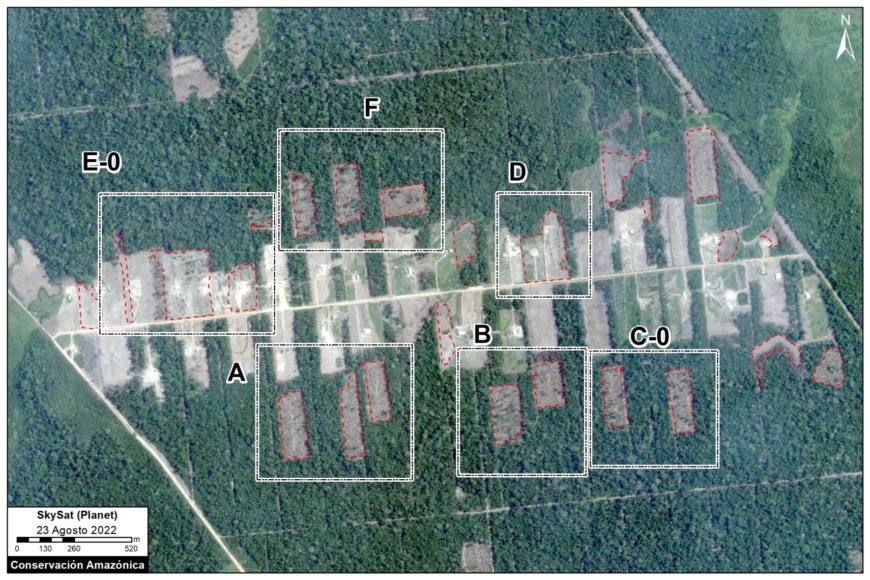
The following image serves as a base map of the recent deforestation in the Padre Marquez Mennonite colony. Insets A-F correspond to the zooms further below. In each of these zooms, we show very high-resolution images (0.5 meters) obtained in both November 2021 (left panels) and August 2022 (right panels). Thus, they serve as the latest evidence that the Mennonites are indeed clearing primary forest.

Base map of the recent deforestation in the Padre Marquez Mennonite colony. Insets A-F correspond to the zooms below. Data: Planet/Skysat, MAAP.


Annex – Base Map of Mennonite Colonies in Peruvian Amazon

Base Map. Mennonite Colonies in the Peruvian Amazon. Data: ACA/MAAP.

References

Collyns D (2022) The Mennonites being accused of deforestation in the Peruvian Amazon. Guardian. https://www.theguardian.com/world/2022/sep/11/mennonites-peru-deforestation-permits

Collyns D (2022) Meet the Mennonites in Peru. CGTN America

Sierra Y (2022) Menonitas en Perú: tres colonias investigadas por la deforestación de casi 4 mil hectáreas de bosque en la Amazonía. Mongabay

Citation

Finer M, Ariñez A (2022) Confirming Deforestation by Mennonites in the Peruvian Amazon. MAAP: 165.


MAAP #169: Mining on Top of Yapacana Tepui (Yapacana National Park, Venezuela)

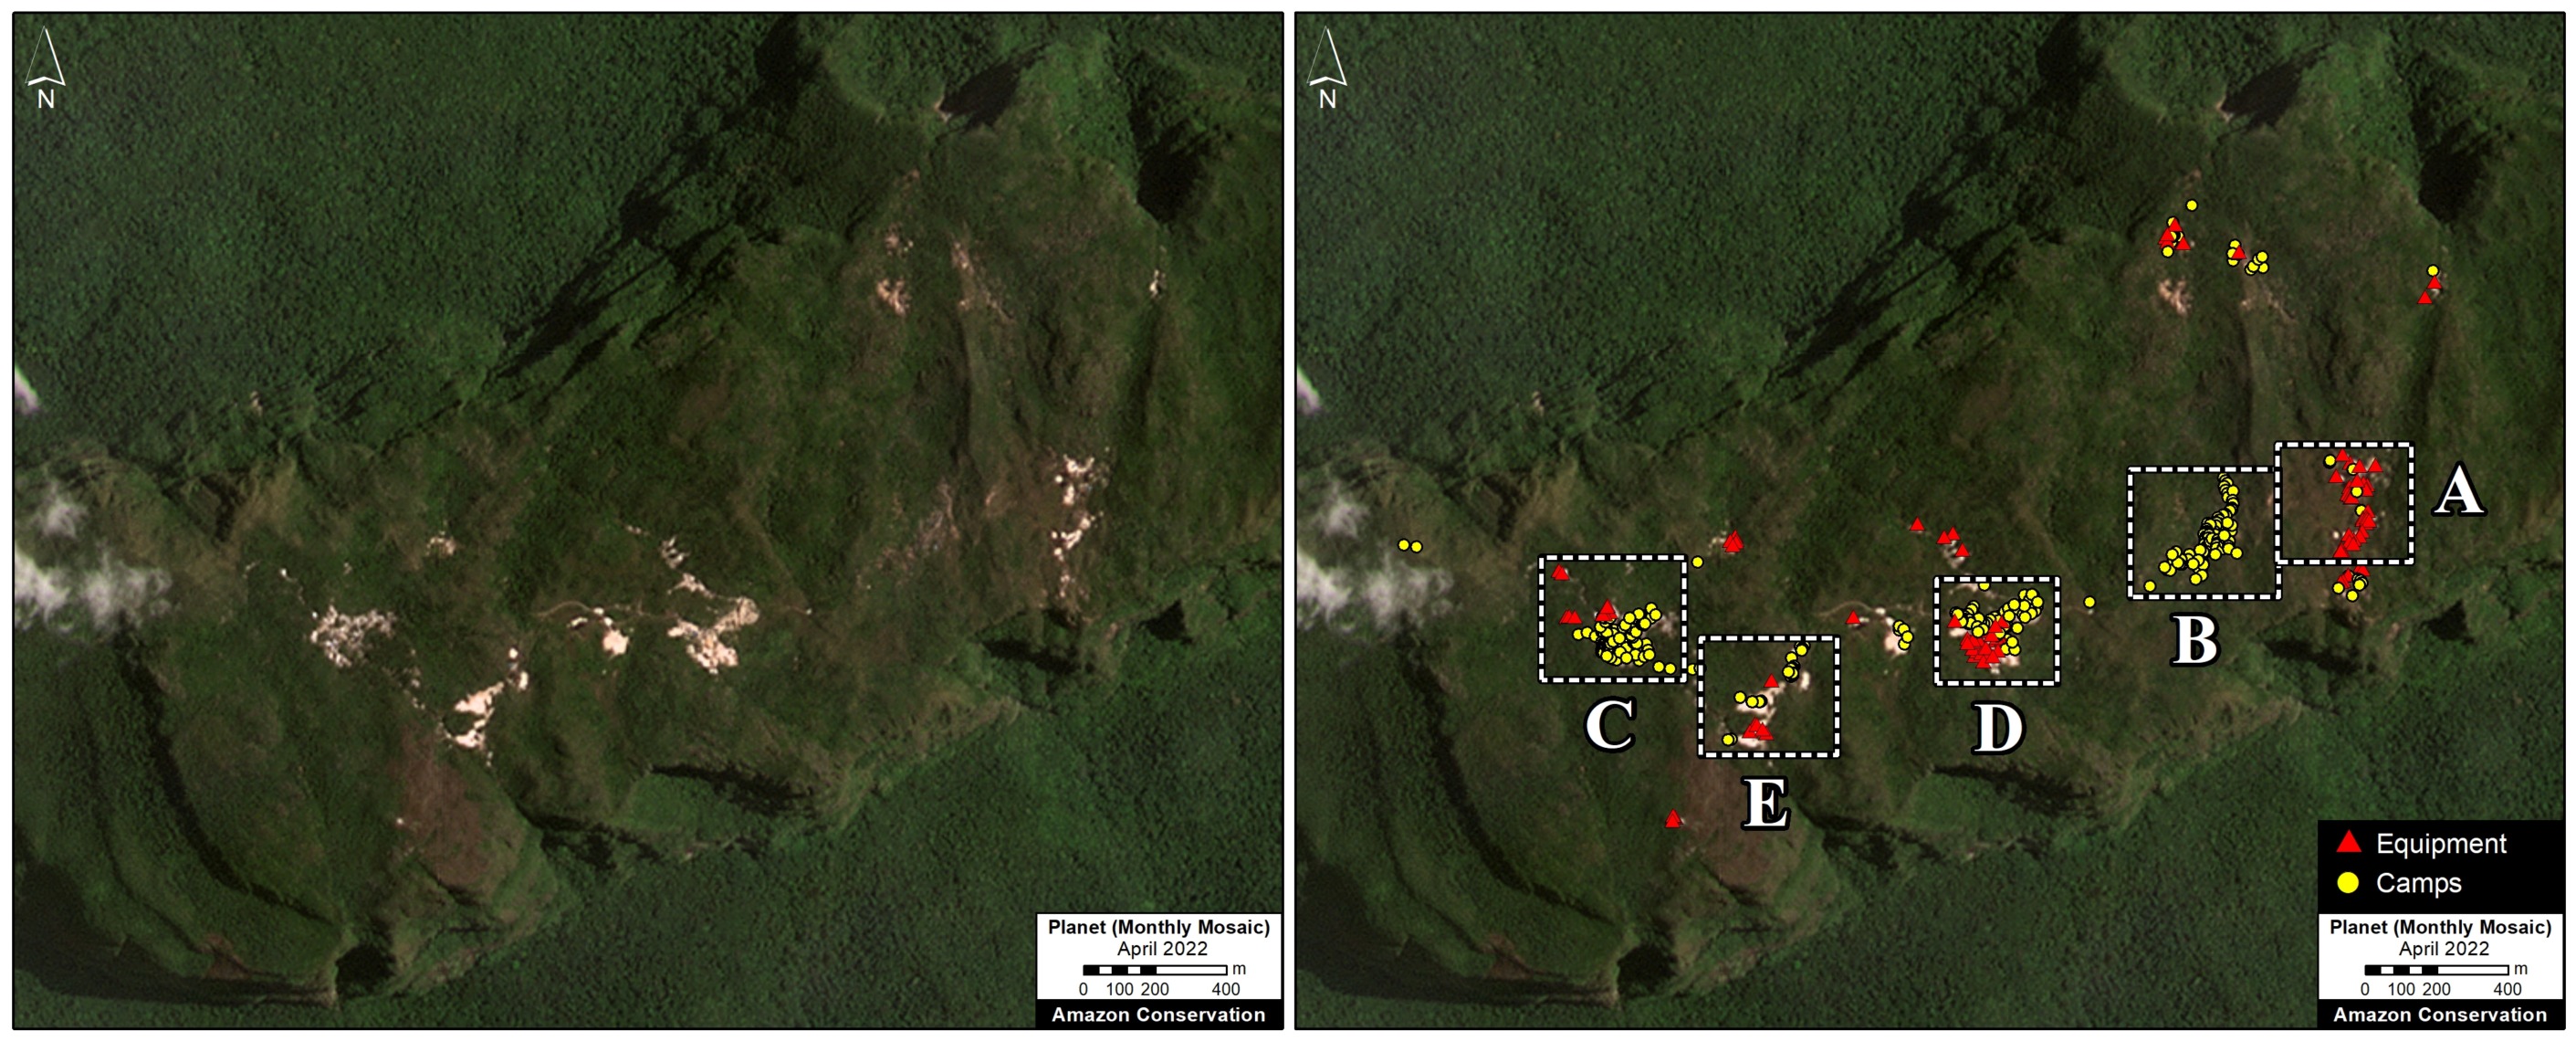
Figure 1. Active mining on top of Yapacacan tepui in the Venezuelan Amazon. Data: Planet/NICFI (level 2), ACA/MAAP,

Tepuis are stunning table-top mountains found in northern South America. They are considered sacred by indigenous groups of the region; in fact, the word tepui means “house of the gods” in a local indigenous language. Tepuis also have high levels of endemism since they are not connected to other ranges.

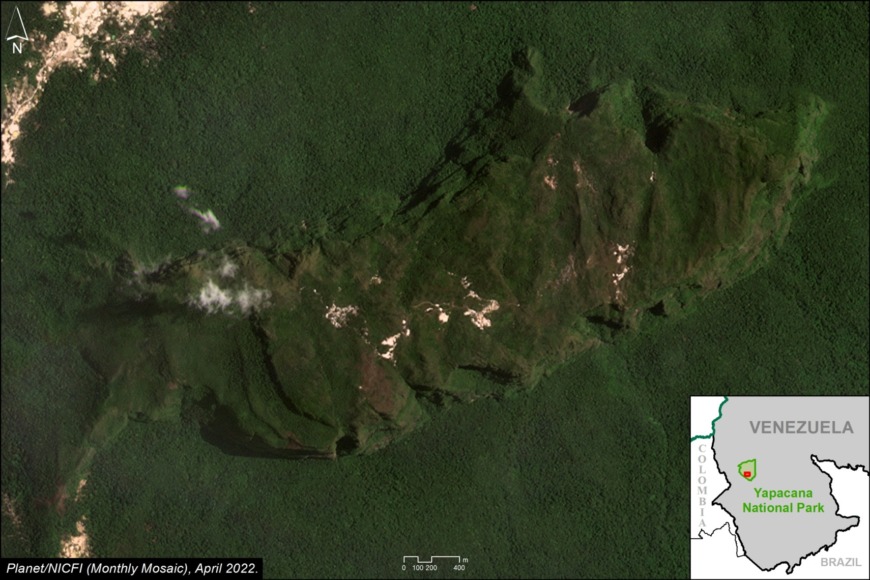
However, we have documented active mining operations on top of the Yapacana tepui, located within Yapacana National Park in the Venezuelan Amazon.

In Figure 1 (to the right), observe the Yapacana tepui surrounded by active gold mining operations in Yapacana National Park. Also, note the mining activities on top of the tepui.

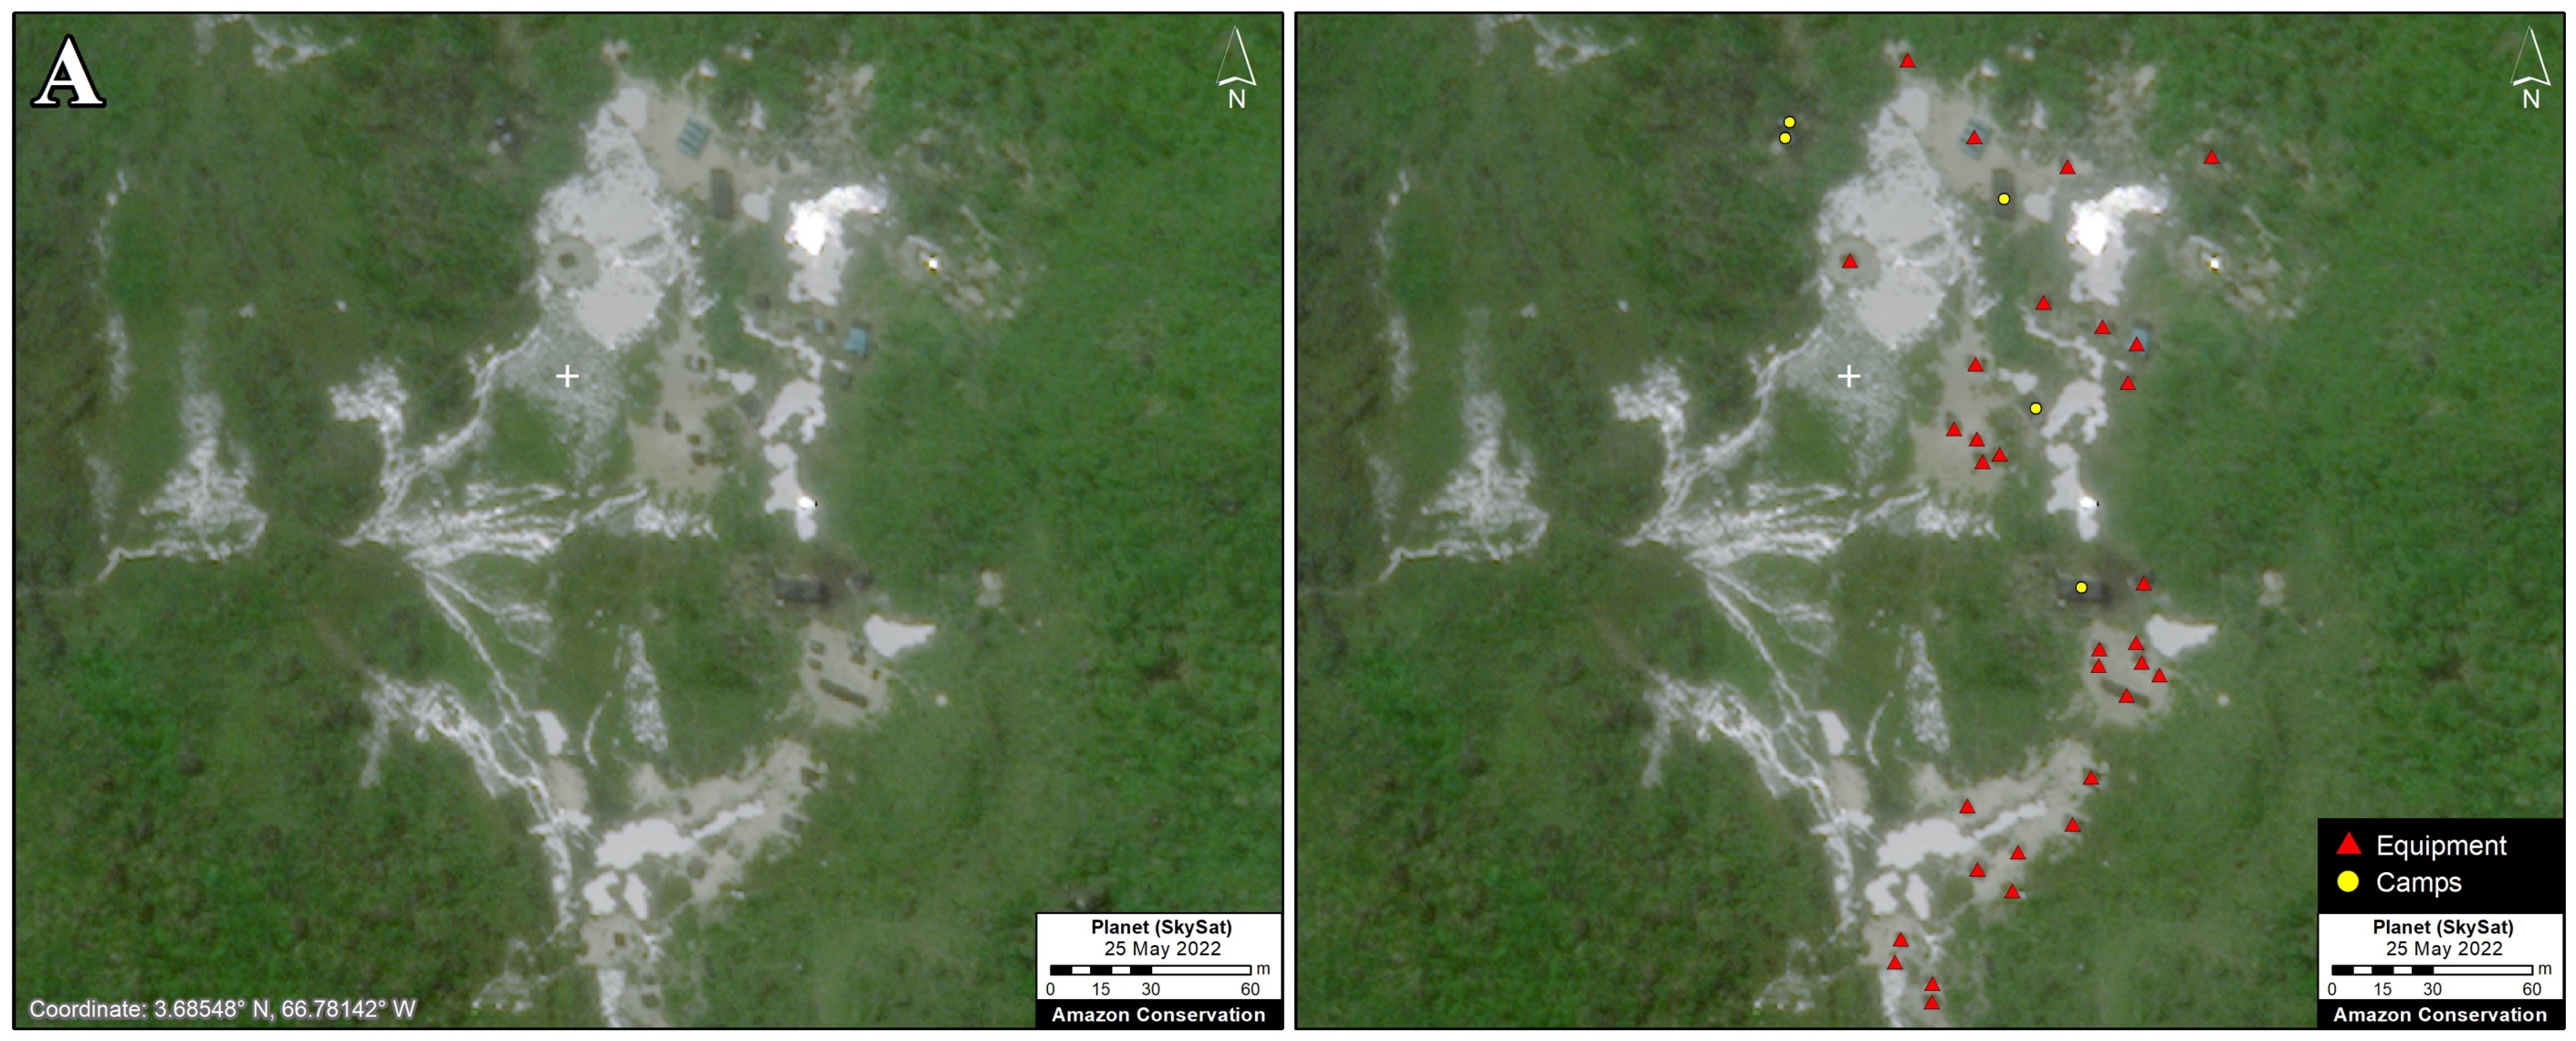
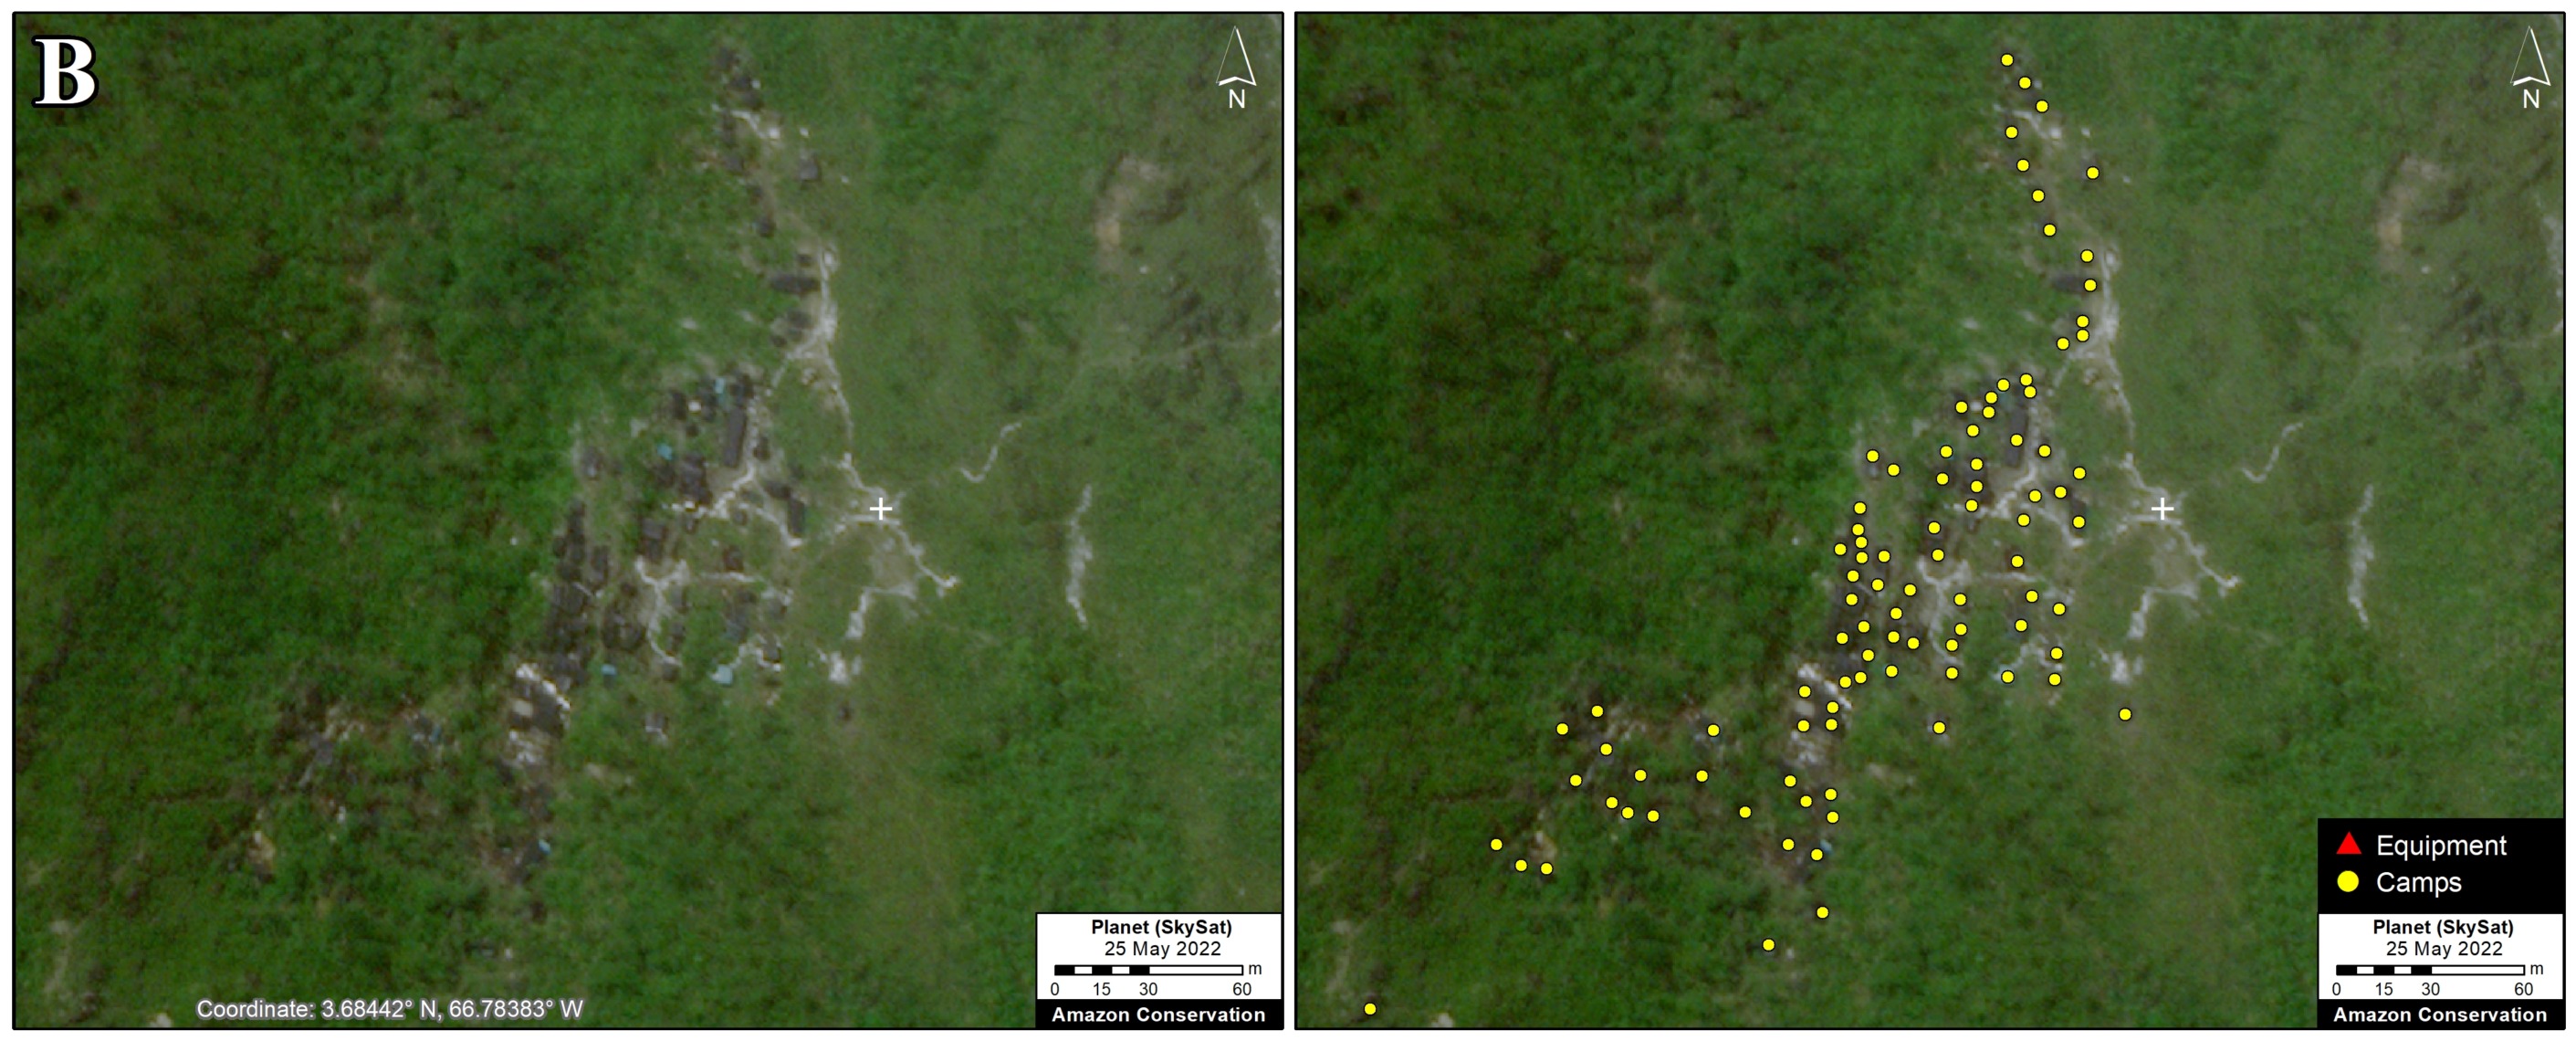
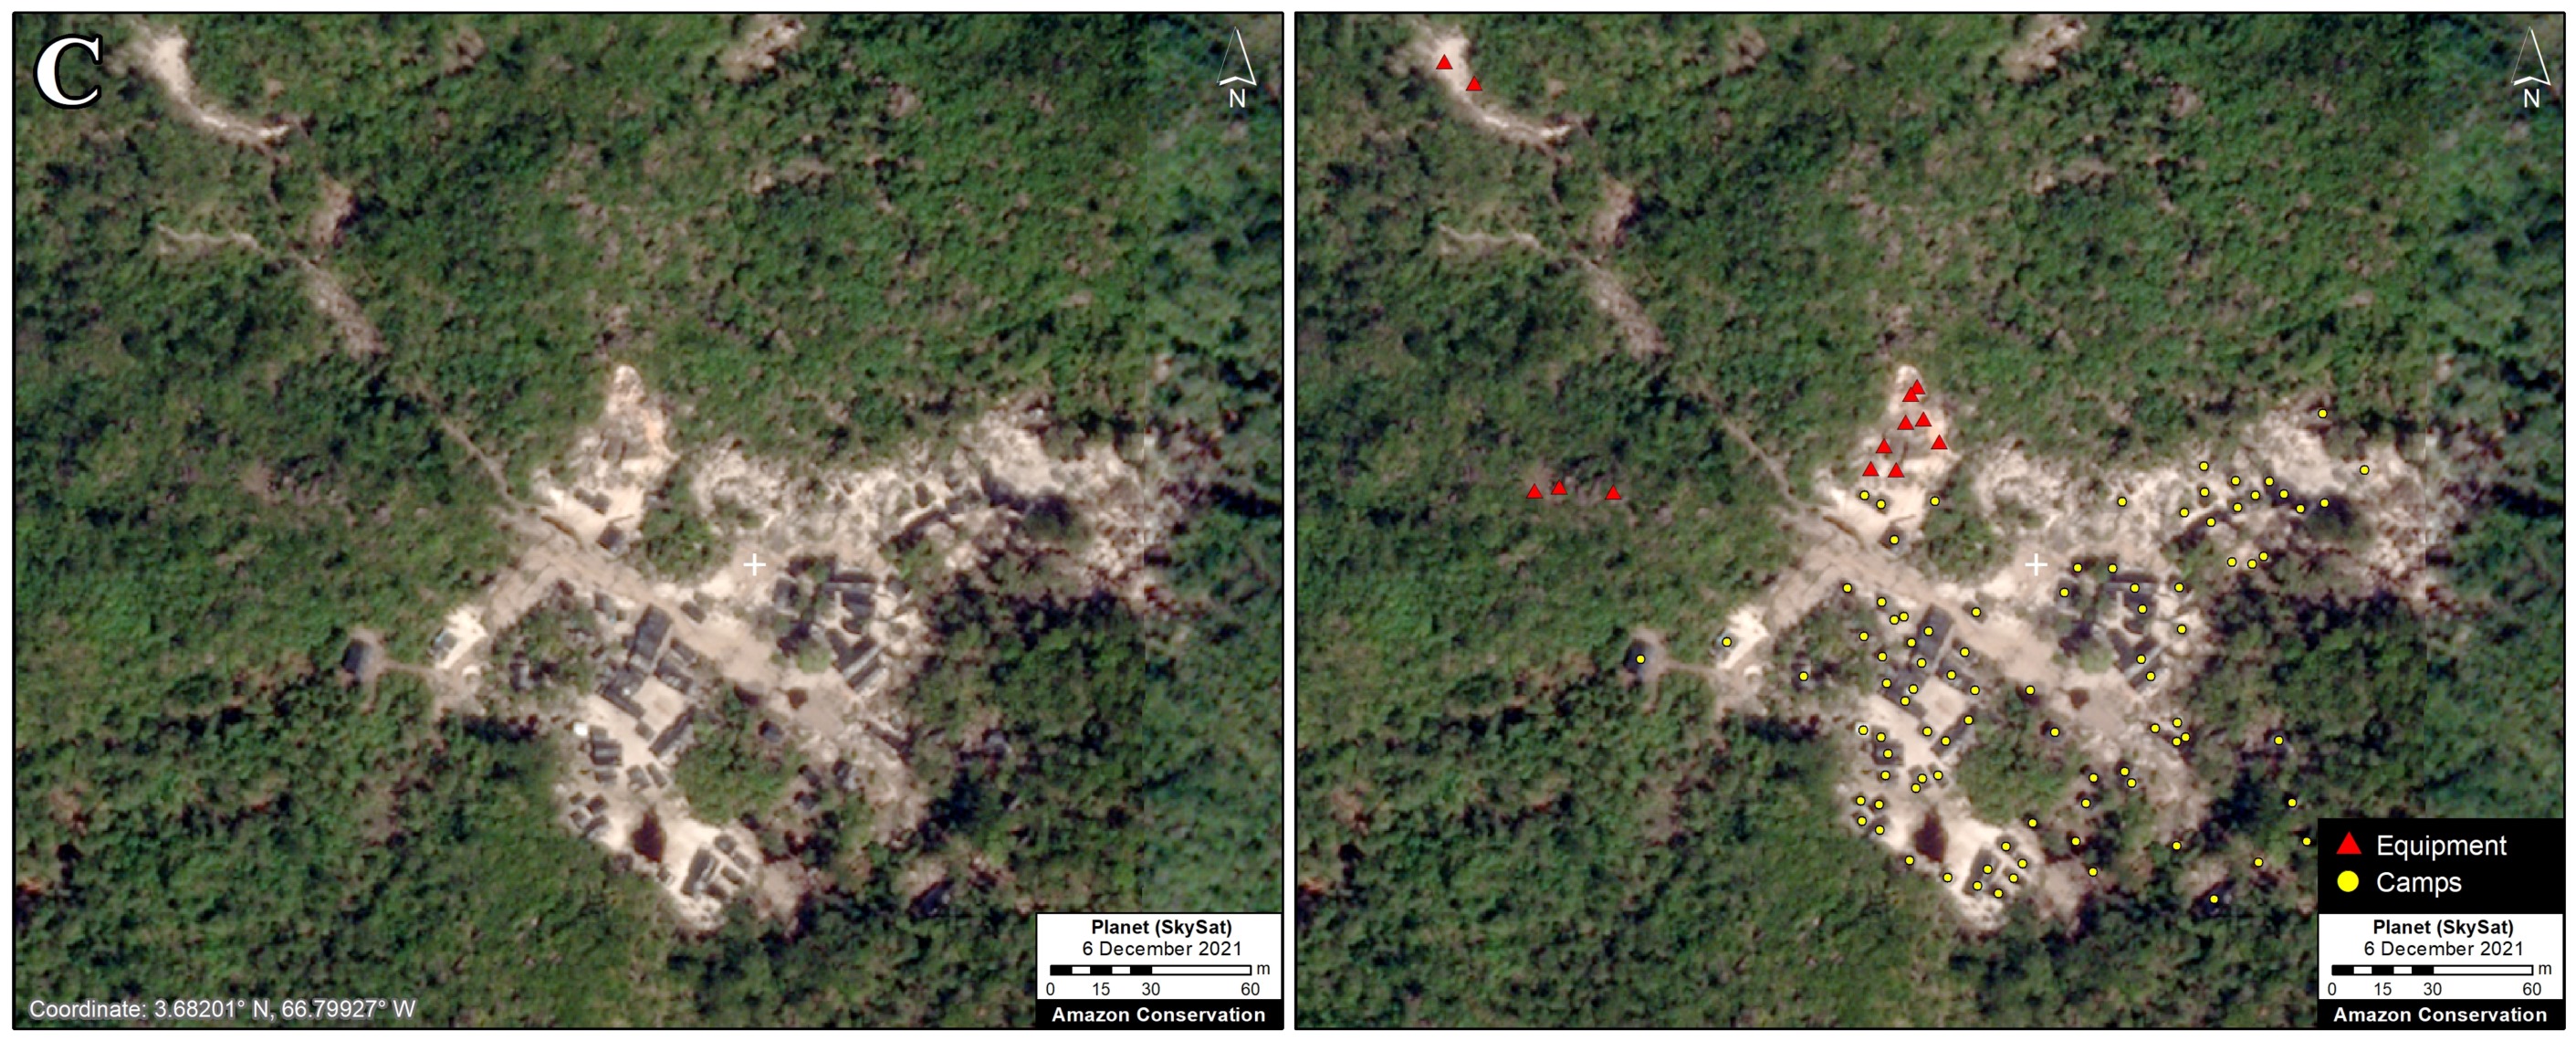
As detailed below, by analyzing very high-resolution satellite imagery (Skysat), we found 425 mining data points (including mining camps and machinery) on top of the tepui, indicating rampant mining on this important, and supposedly protected, biogeographical site.

Note that this is in addition to the 8,000 mining data points documented in the surrounding lowlands of Yapacana National Park  (see MAAP #156).

Mining on Top of Yapacana Tepui

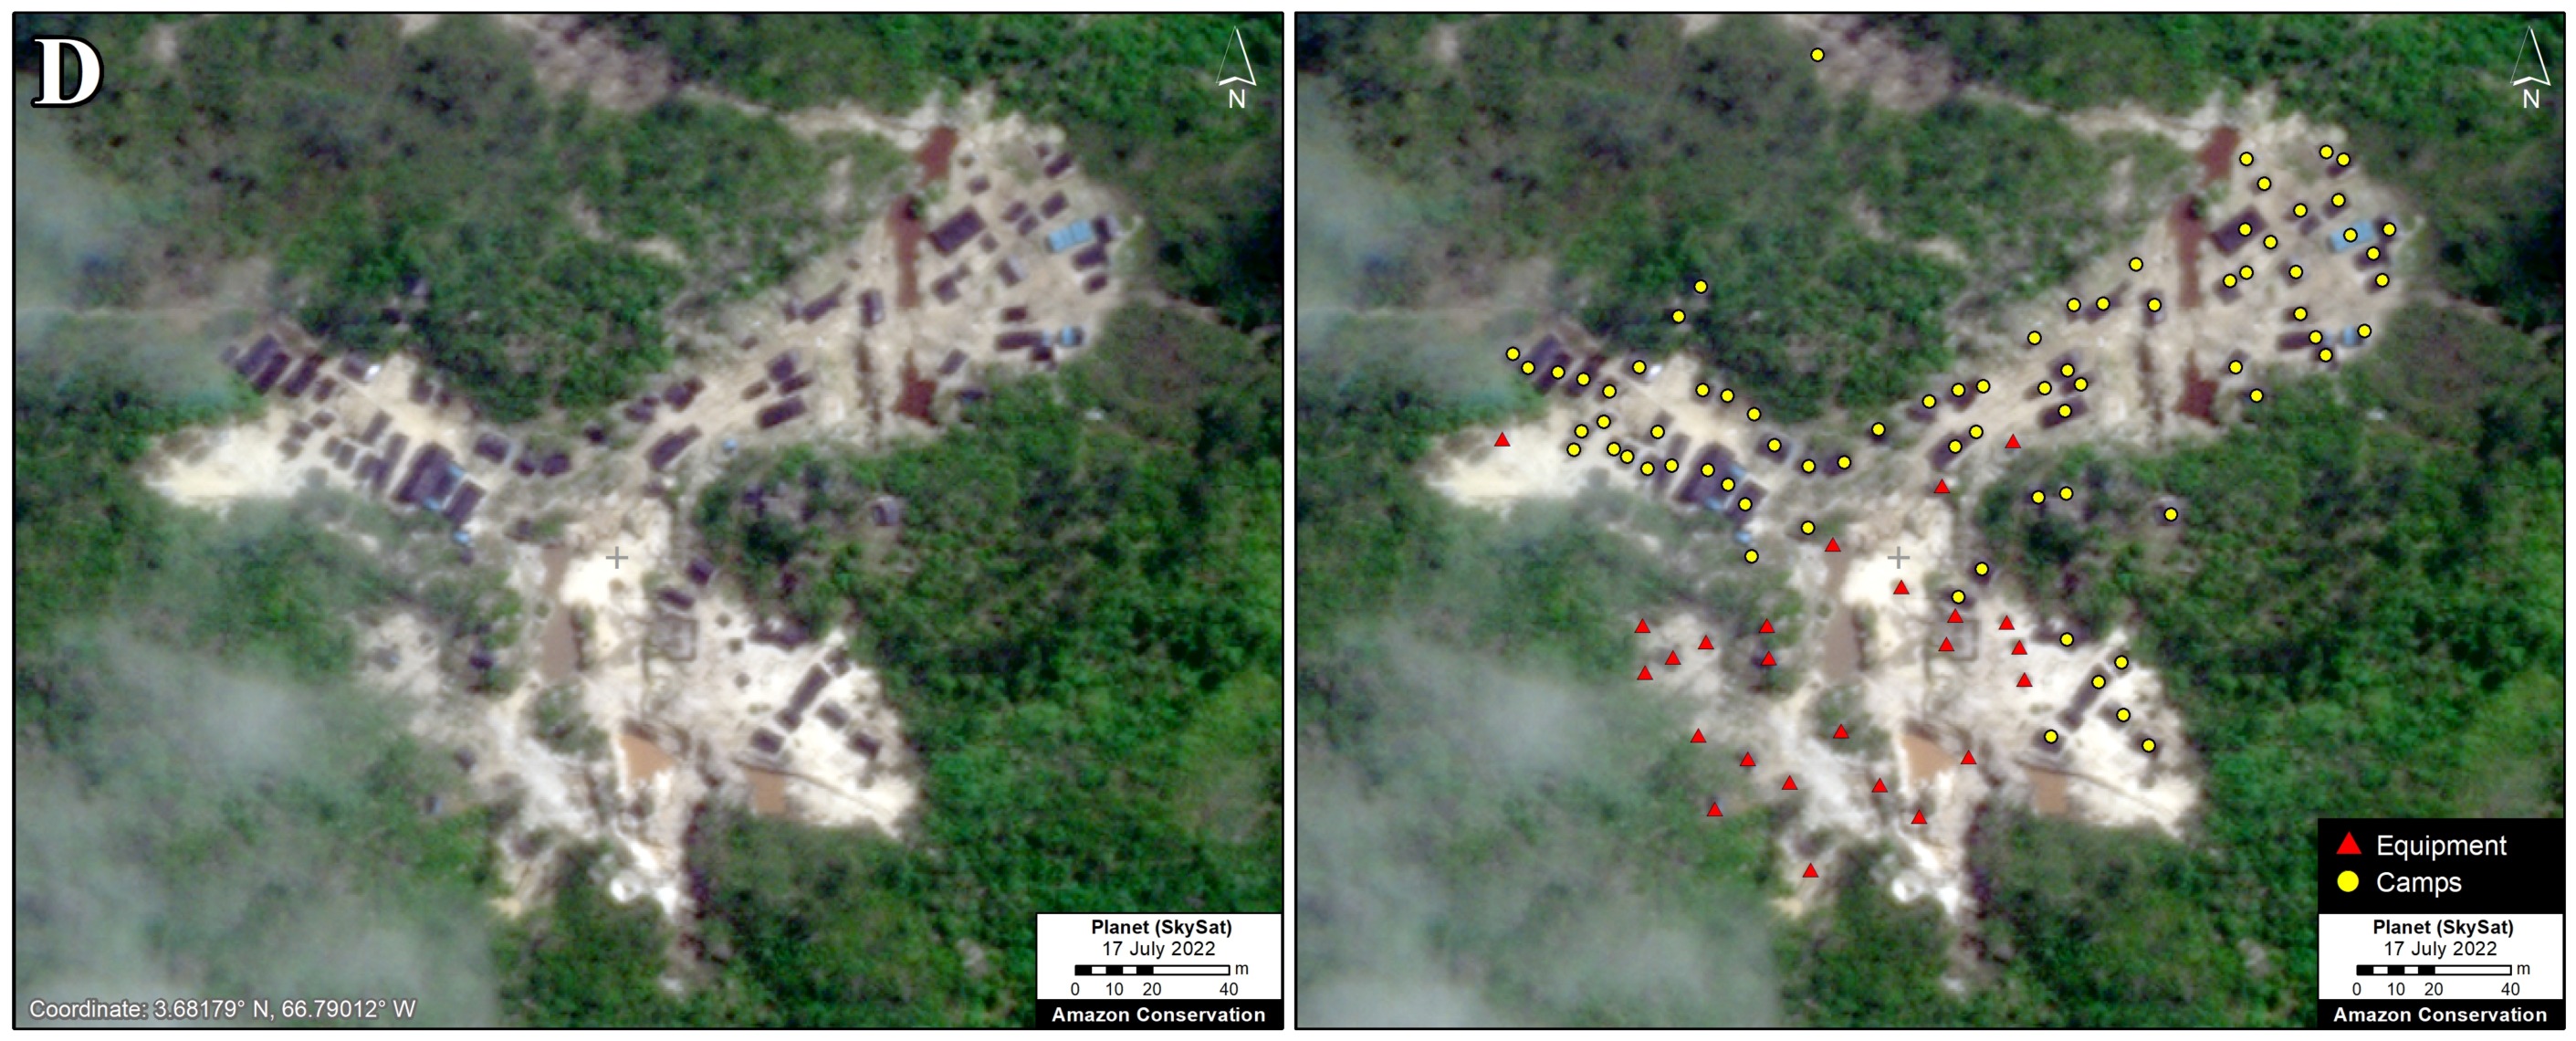
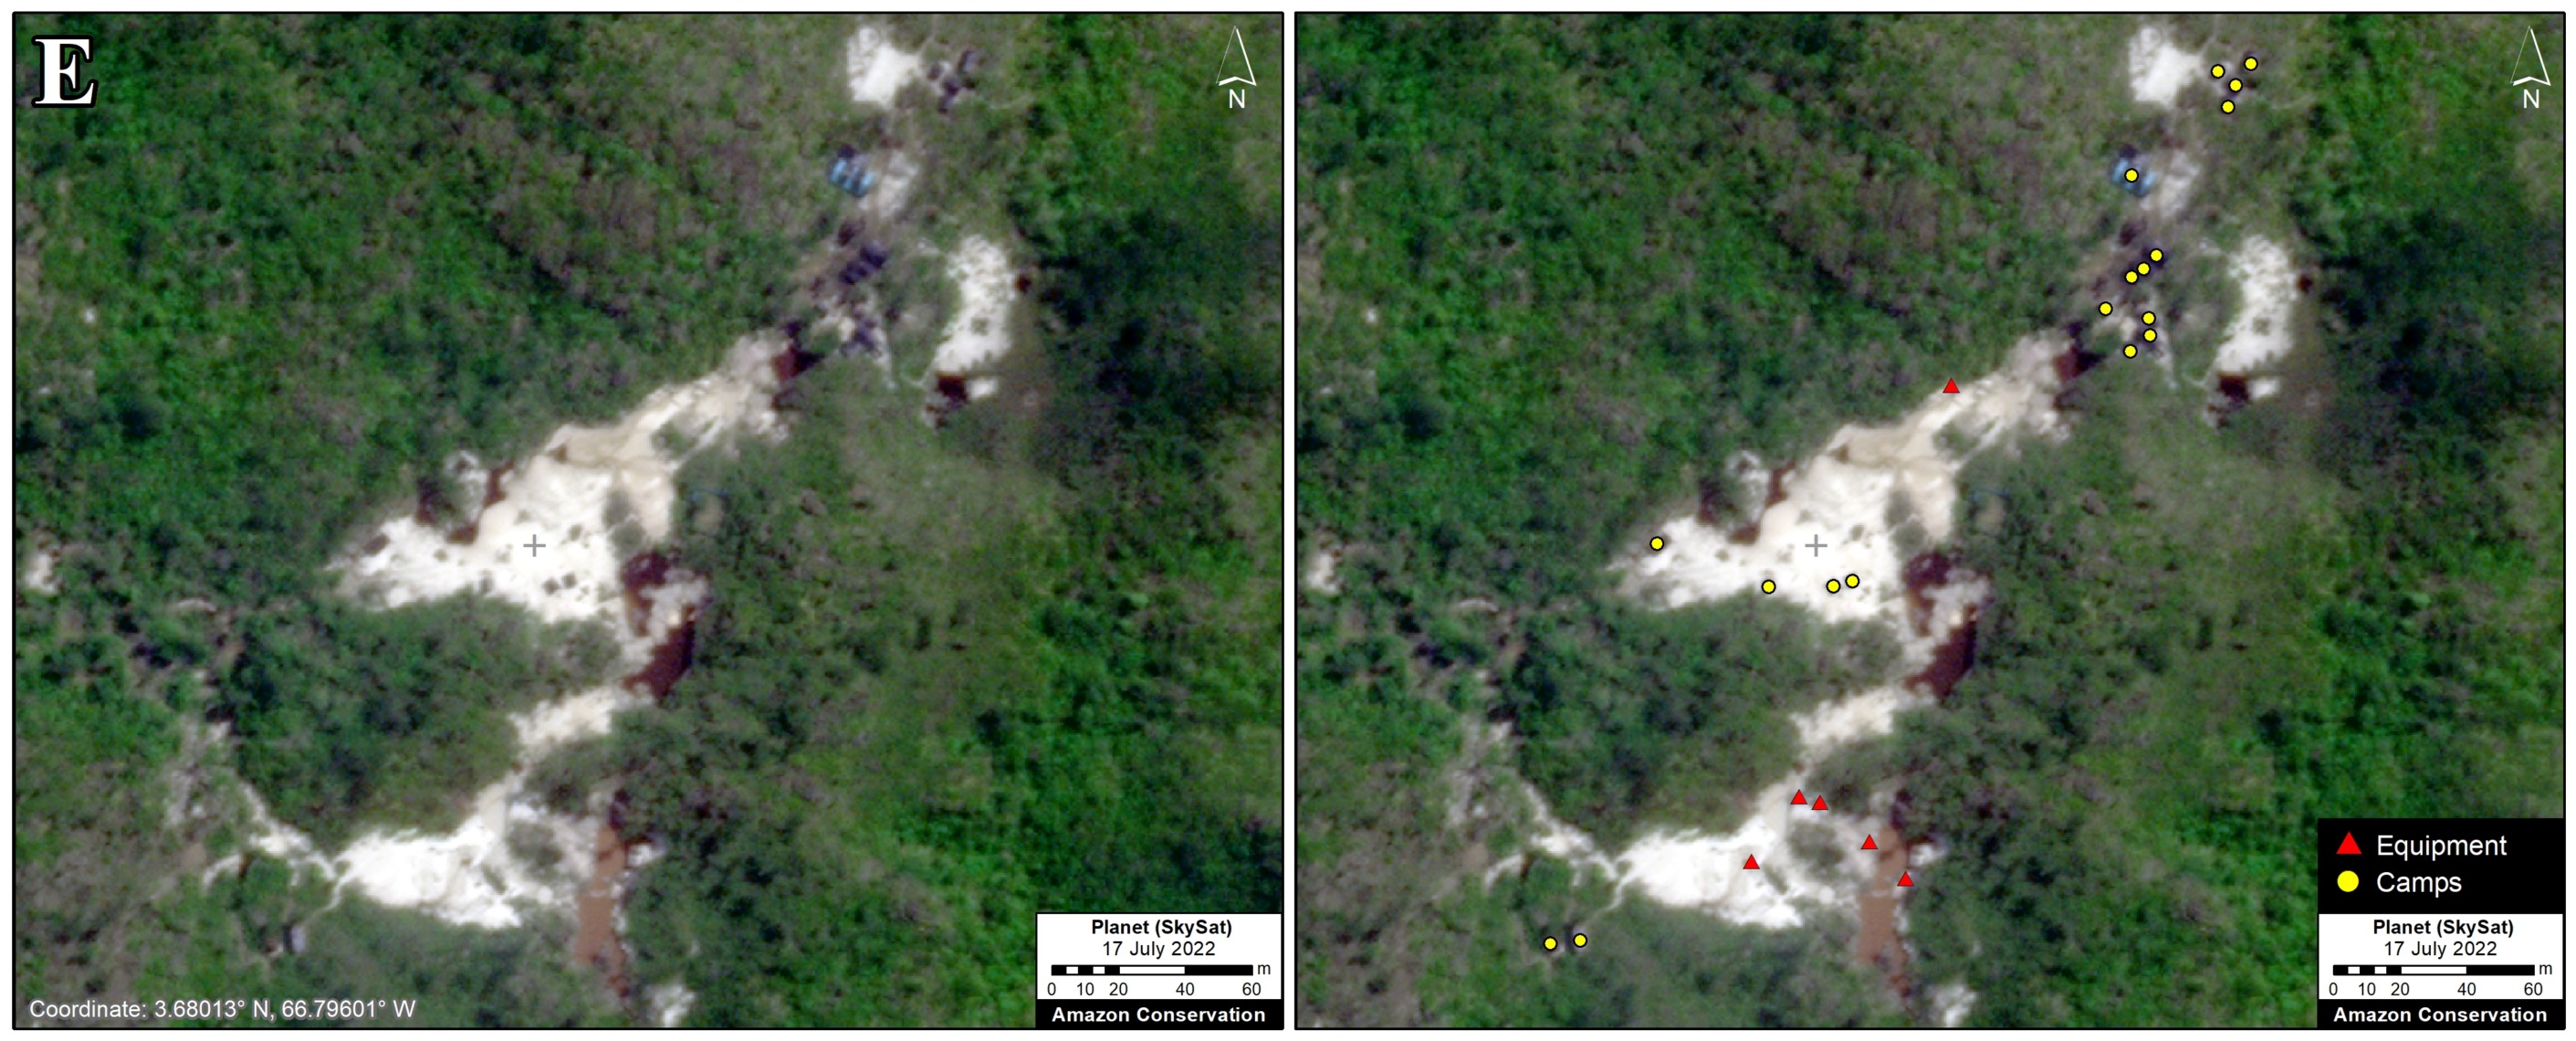
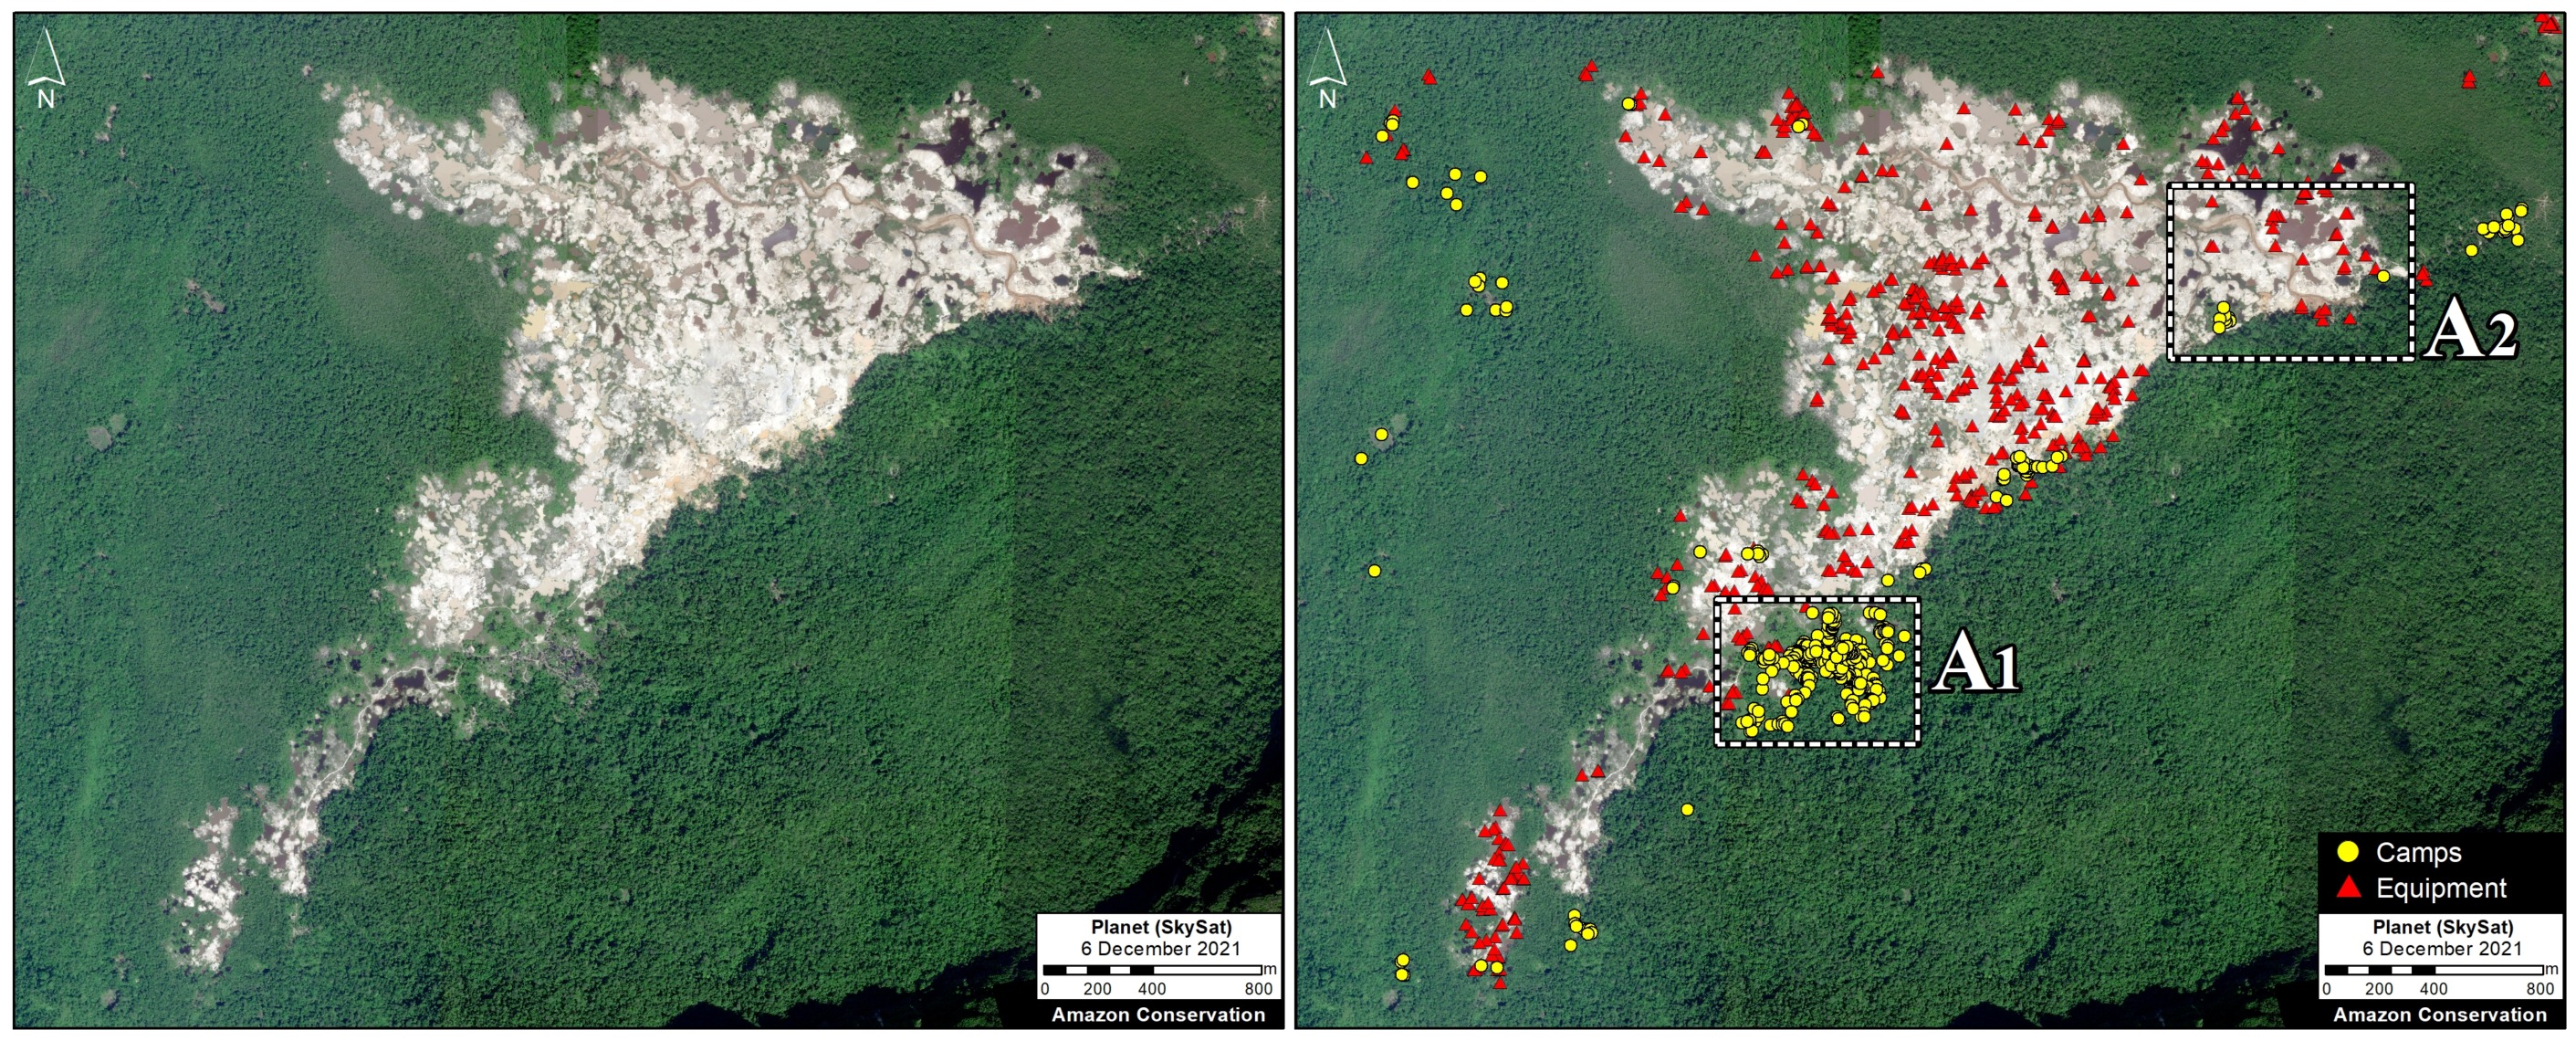
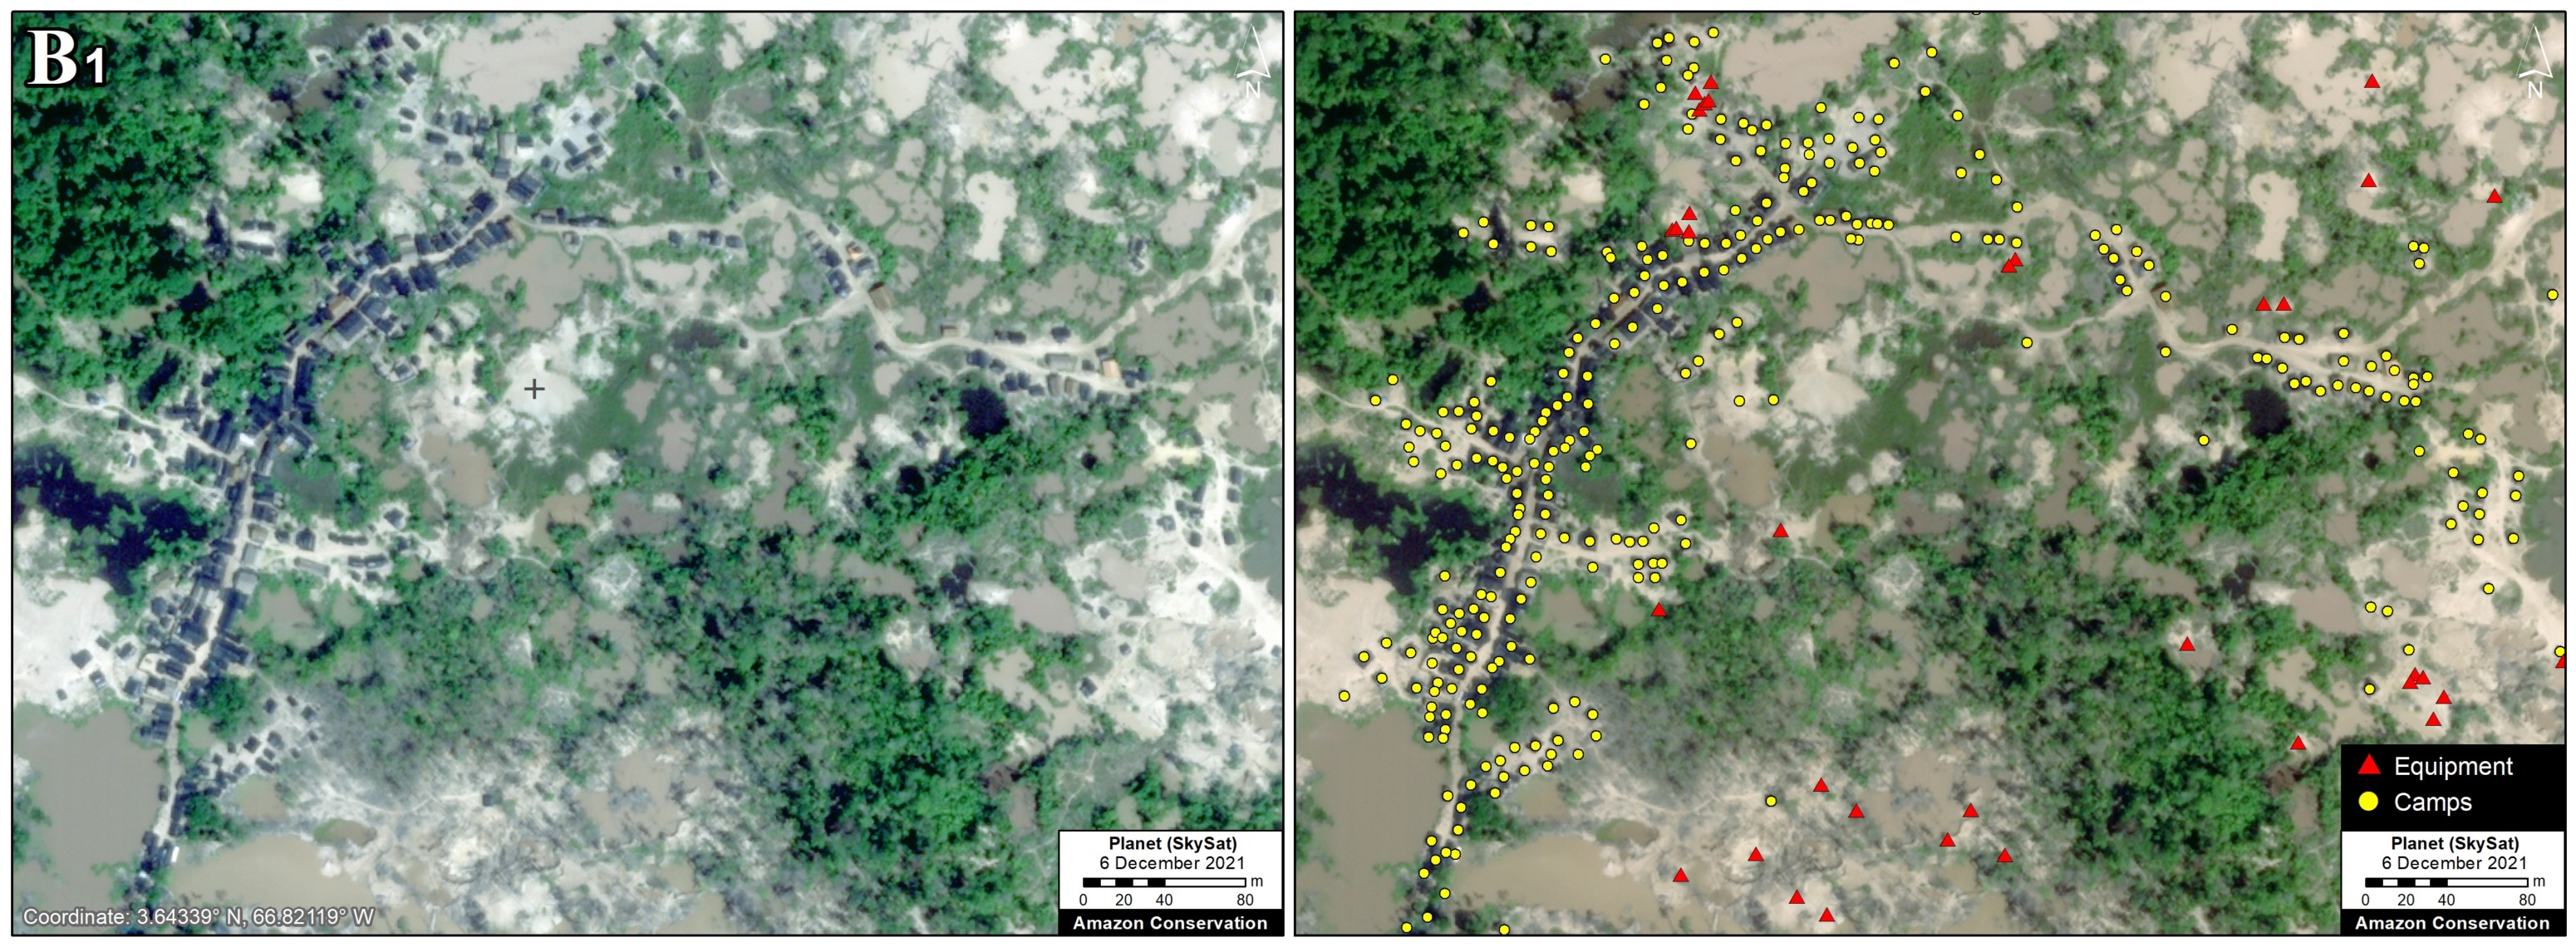
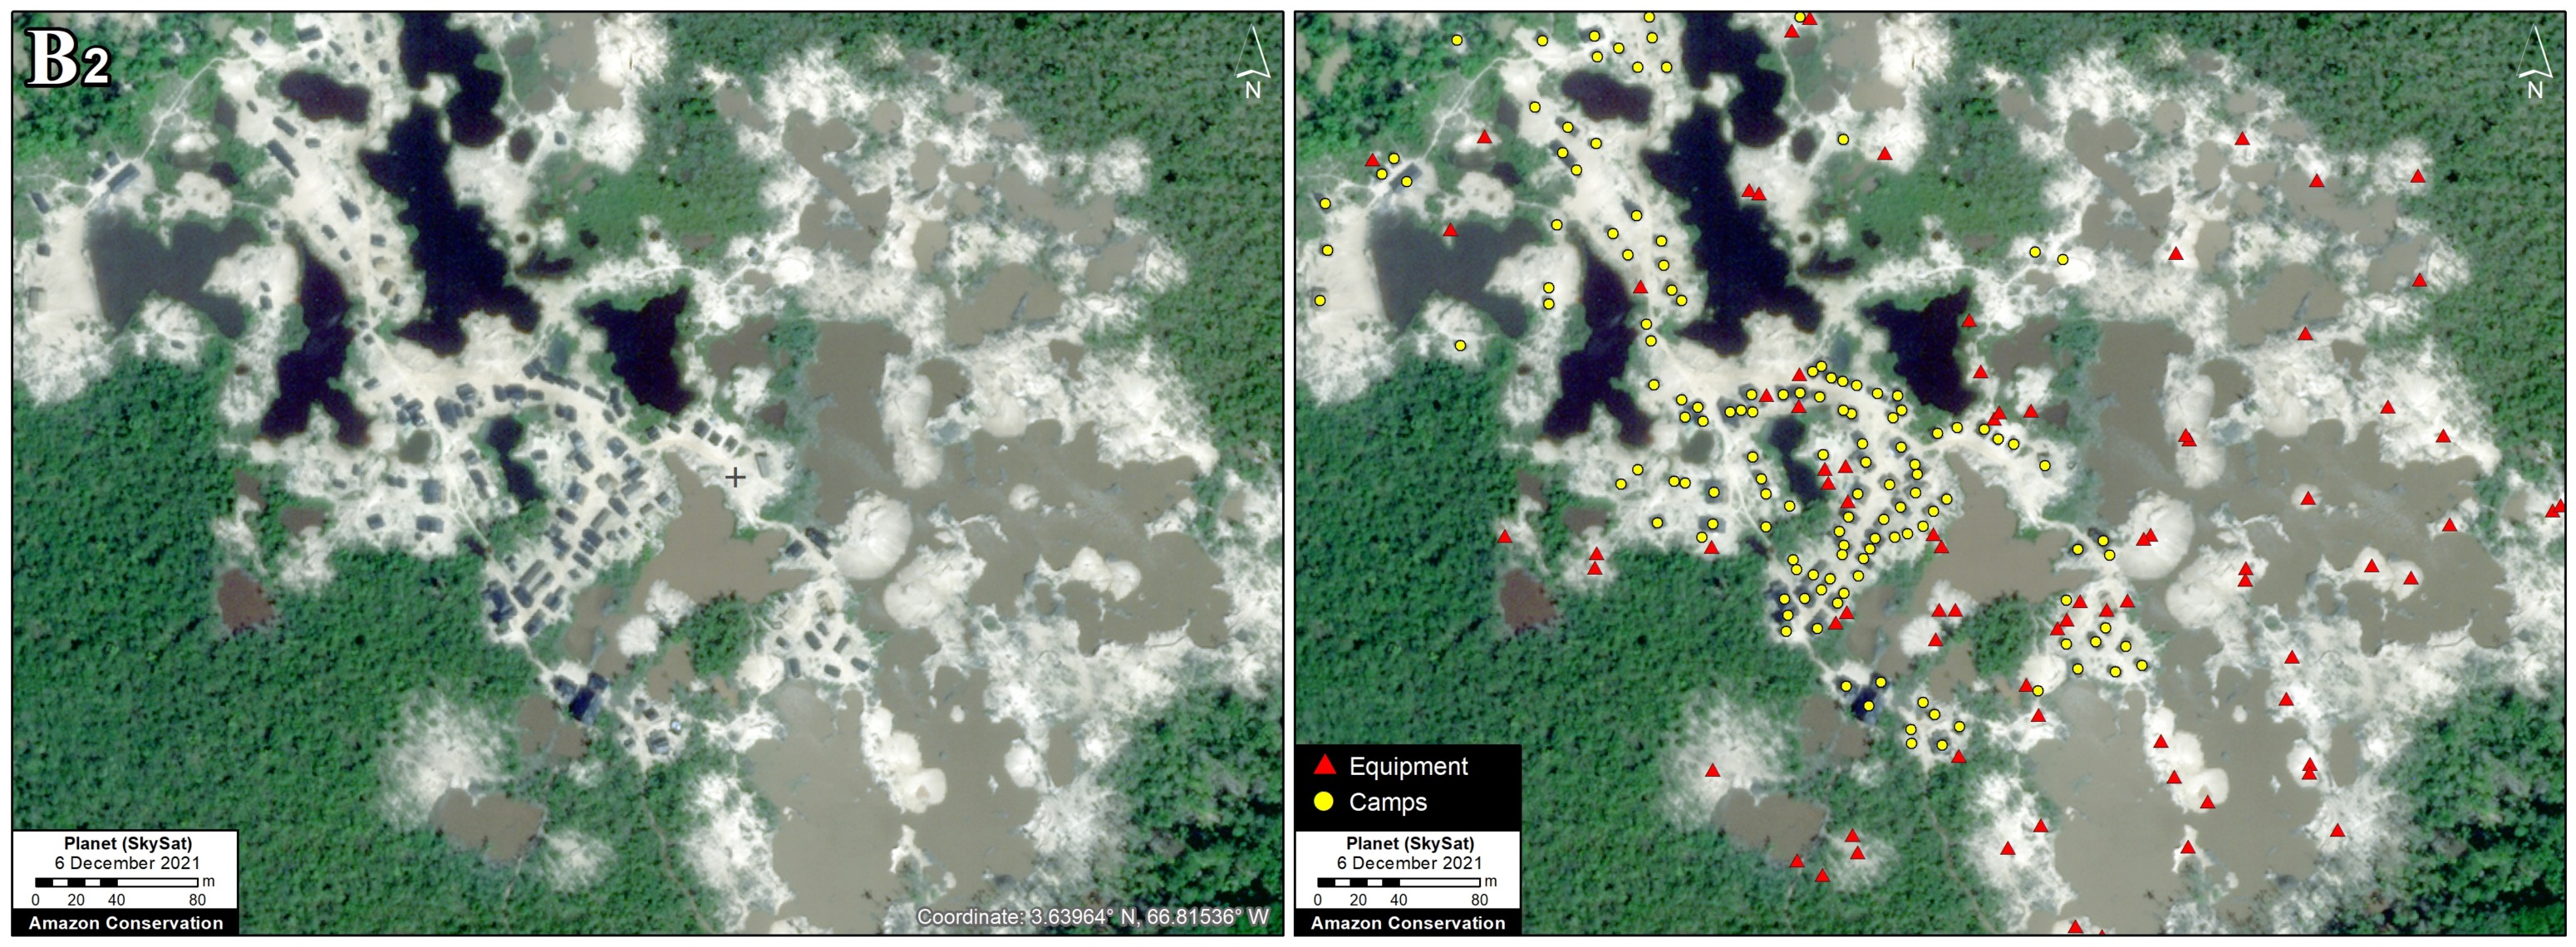
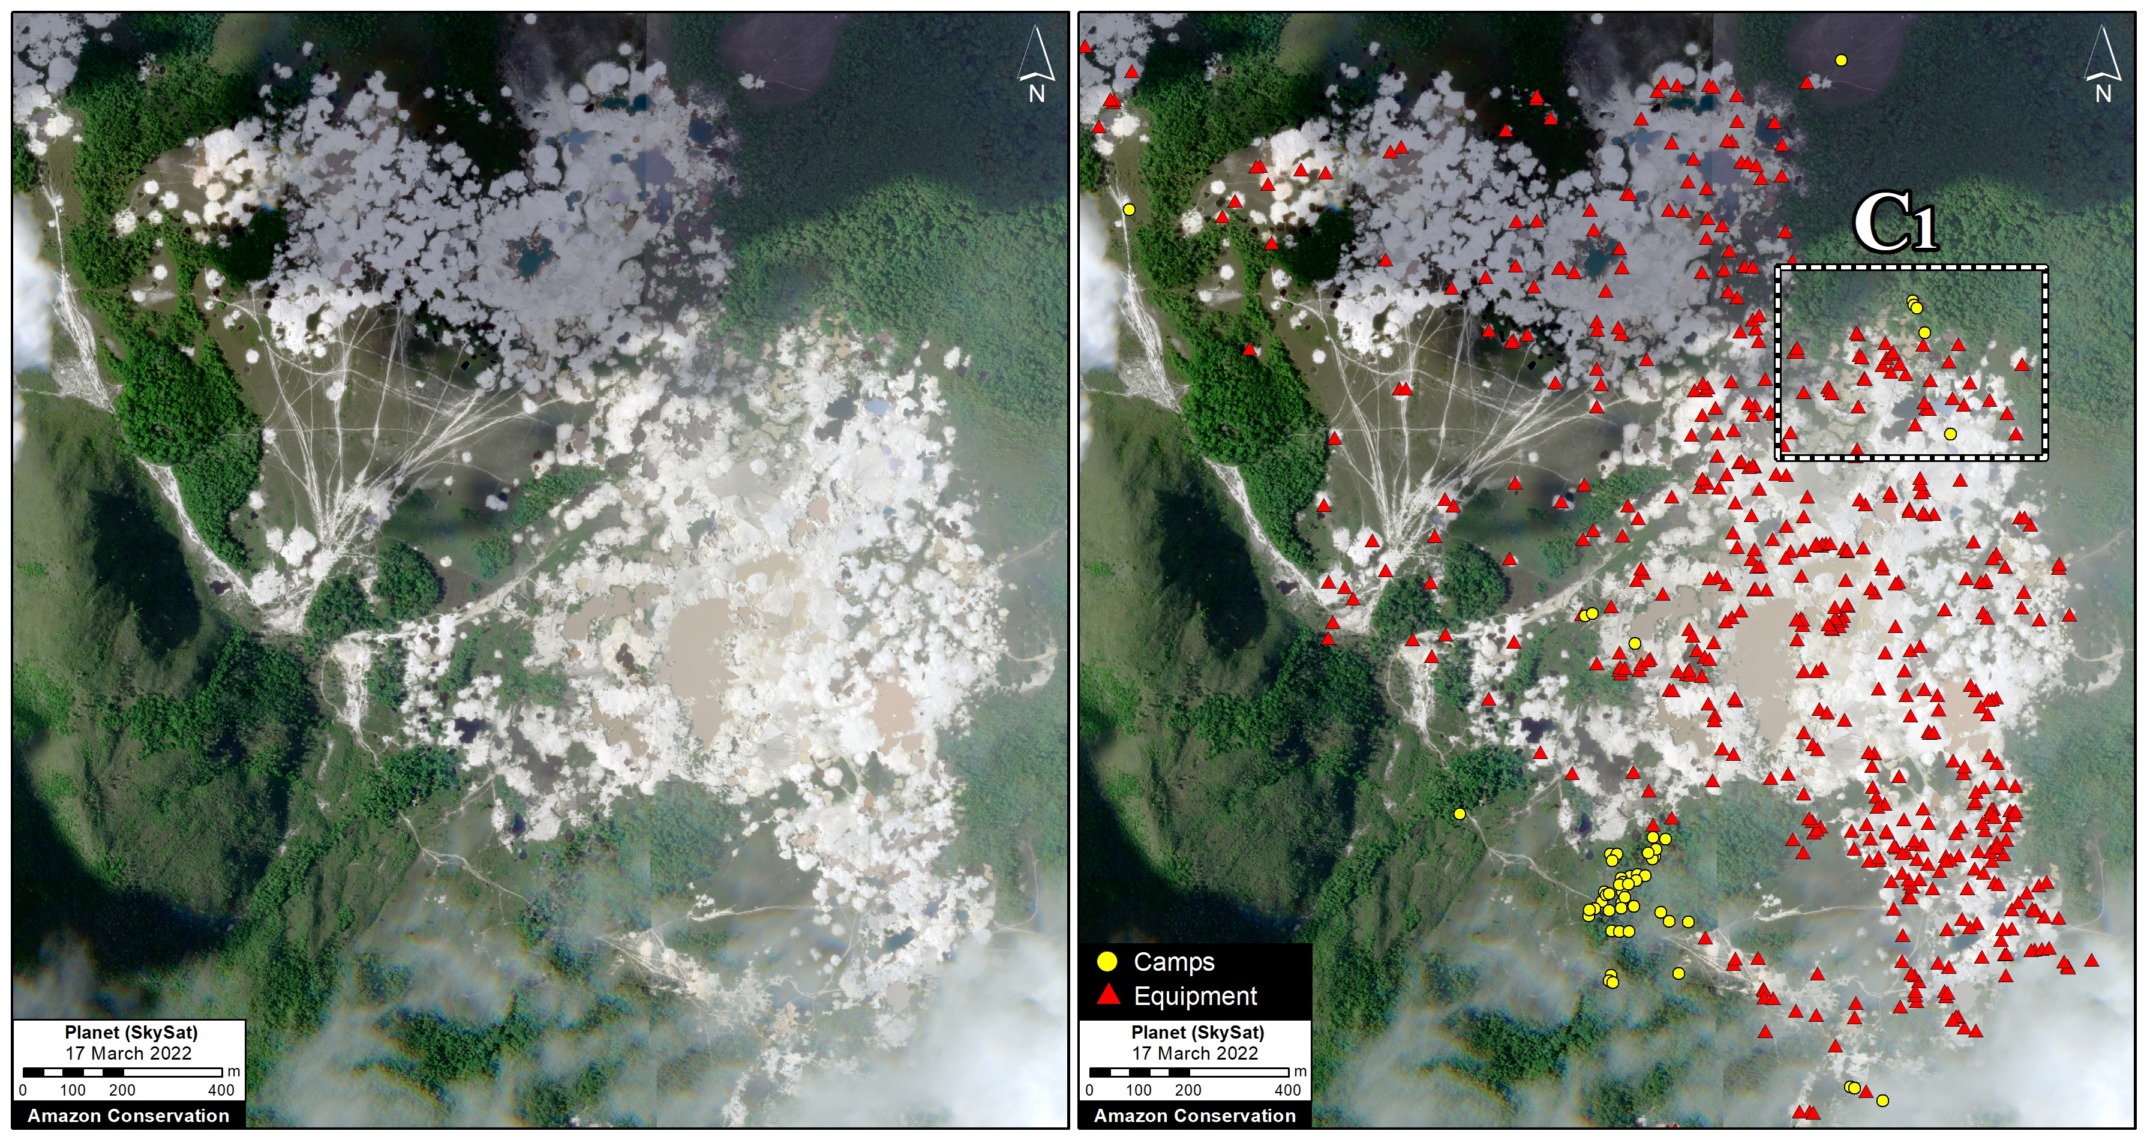
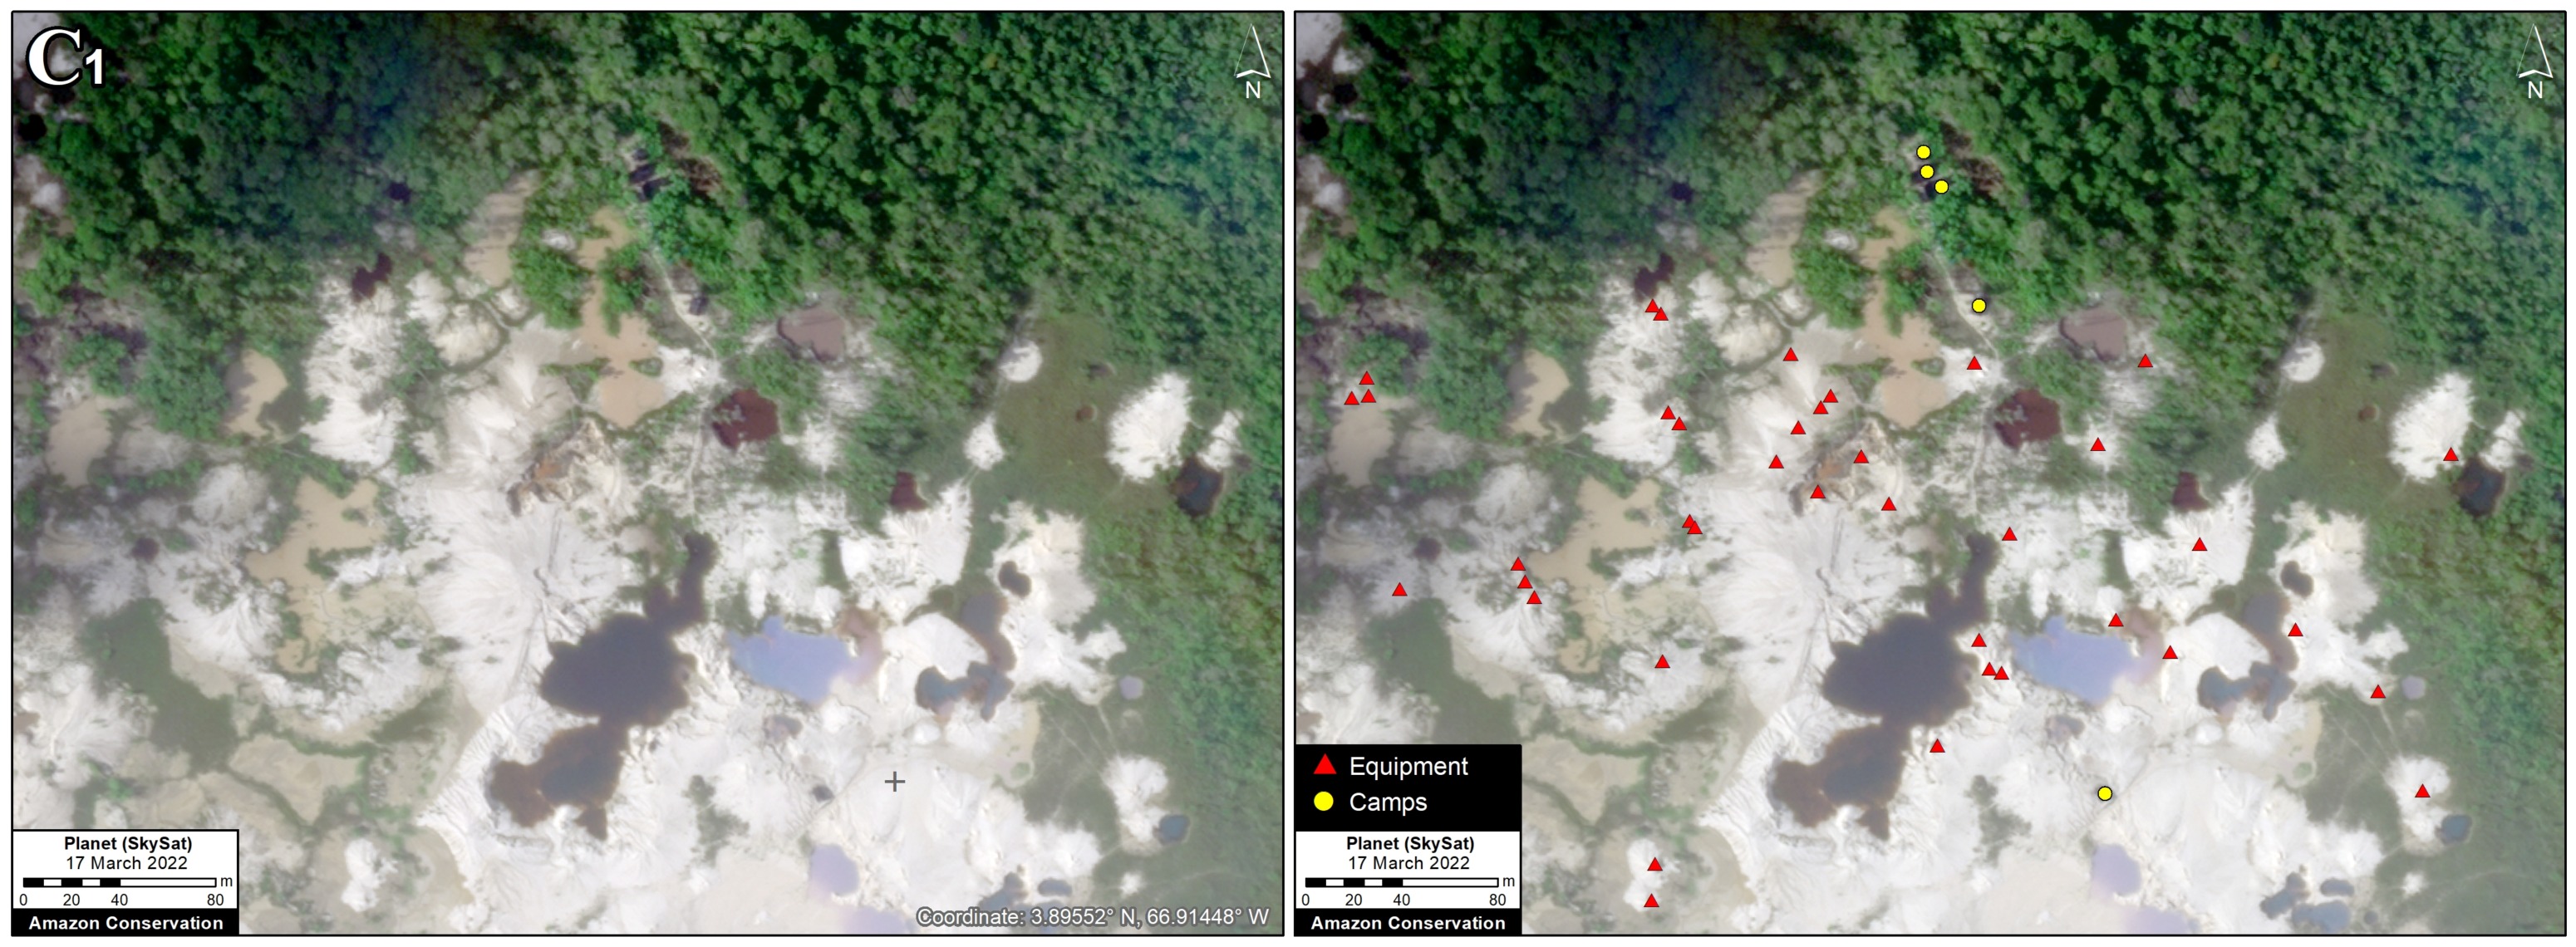
Figure 2 serves as our base map, zooming in and showing the top of the tepui without and with the mining data (left and right panel, respectively). Note how the second image brings out previously “invisible” elements within the overall mining area: 425 mining data points (322 camps and 103 pieces of equipment).  Further below are additional Zooms A-C to better visualize the mining camps and equipment with the actual Skyat imagery. Click twice to fully enlarge images below.

Figure 2. Yapacana tepui without (left panel) and with (right panel) the mining data. Data: Planet/NICFI (level 2), ACA/MAAP. Click twice to fully enlarge.

Zoom A

Zoom A. Mining equipment and camps on Yapacana tepui, without (left panel) and with (right panel) the mining data. Data: Planet, ACA/MAAP. Click twice to fully enlarge.

Zoom B

Zoom B. Mining equipment and camps on Yapacana tepui, without (left panel) and with (right panel) the mining data. Data: Planet, ACA/MAAP. Click twice to fully enlarge.

Zoom C

Zoom C. Mining equipment and camps on Yapacana tepui, without (left panel) and with (right panel) the mining data. Data: Planet, ACA/MAAP. Click twice to fully enlarge.

Zoom D

Zoom D. Mining equipment and camps on Yapacana tepui, without (left panel) and with (right panel) the mining data. Data: Planet, ACA/MAAP. Click twice to fully enlarge.

Zoom E

Zoom E. Mining equipment and camps on Yapacana tepui, without (left panel) and with (right panel) the mining data. Data: Planet, ACA/MAAP. Click twice to fully enlarge.

Methodology

We tasked very high-resolution Skysat satellite imagery (0.5 meters), using the host company Planet’s tasking dashboard, for the Yapacana tepui. We then closely and manually analyzed these images, documenting both mining camps and equipment. We researched aerial examples of mining areas in other countries to improve our identification abilities.

Acknowledgements

We thank the organization SOSOrinoco for important information and comments related to this report.

Citation

Finer M, Mamani N (2022) Mining on Top of Yapacana Tepui (Yapacana National Park, Venezuela). MAAP: 169.

MAAP #161: Soy Deforestation in the Brazilian Amazon

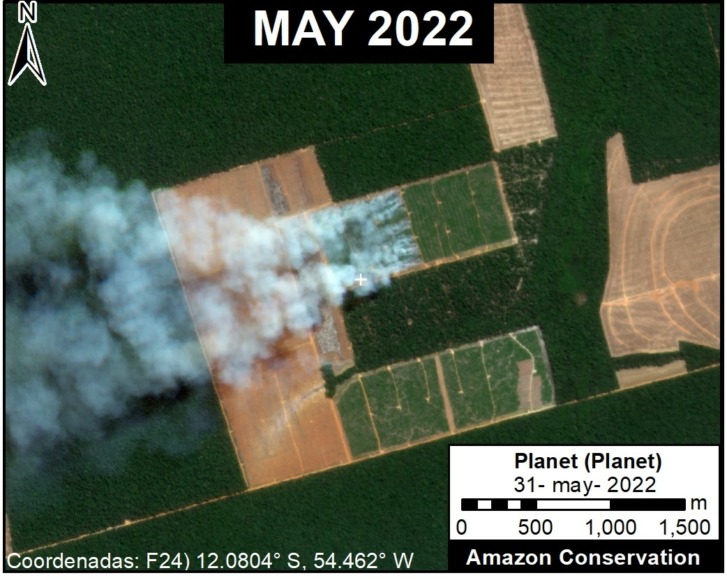
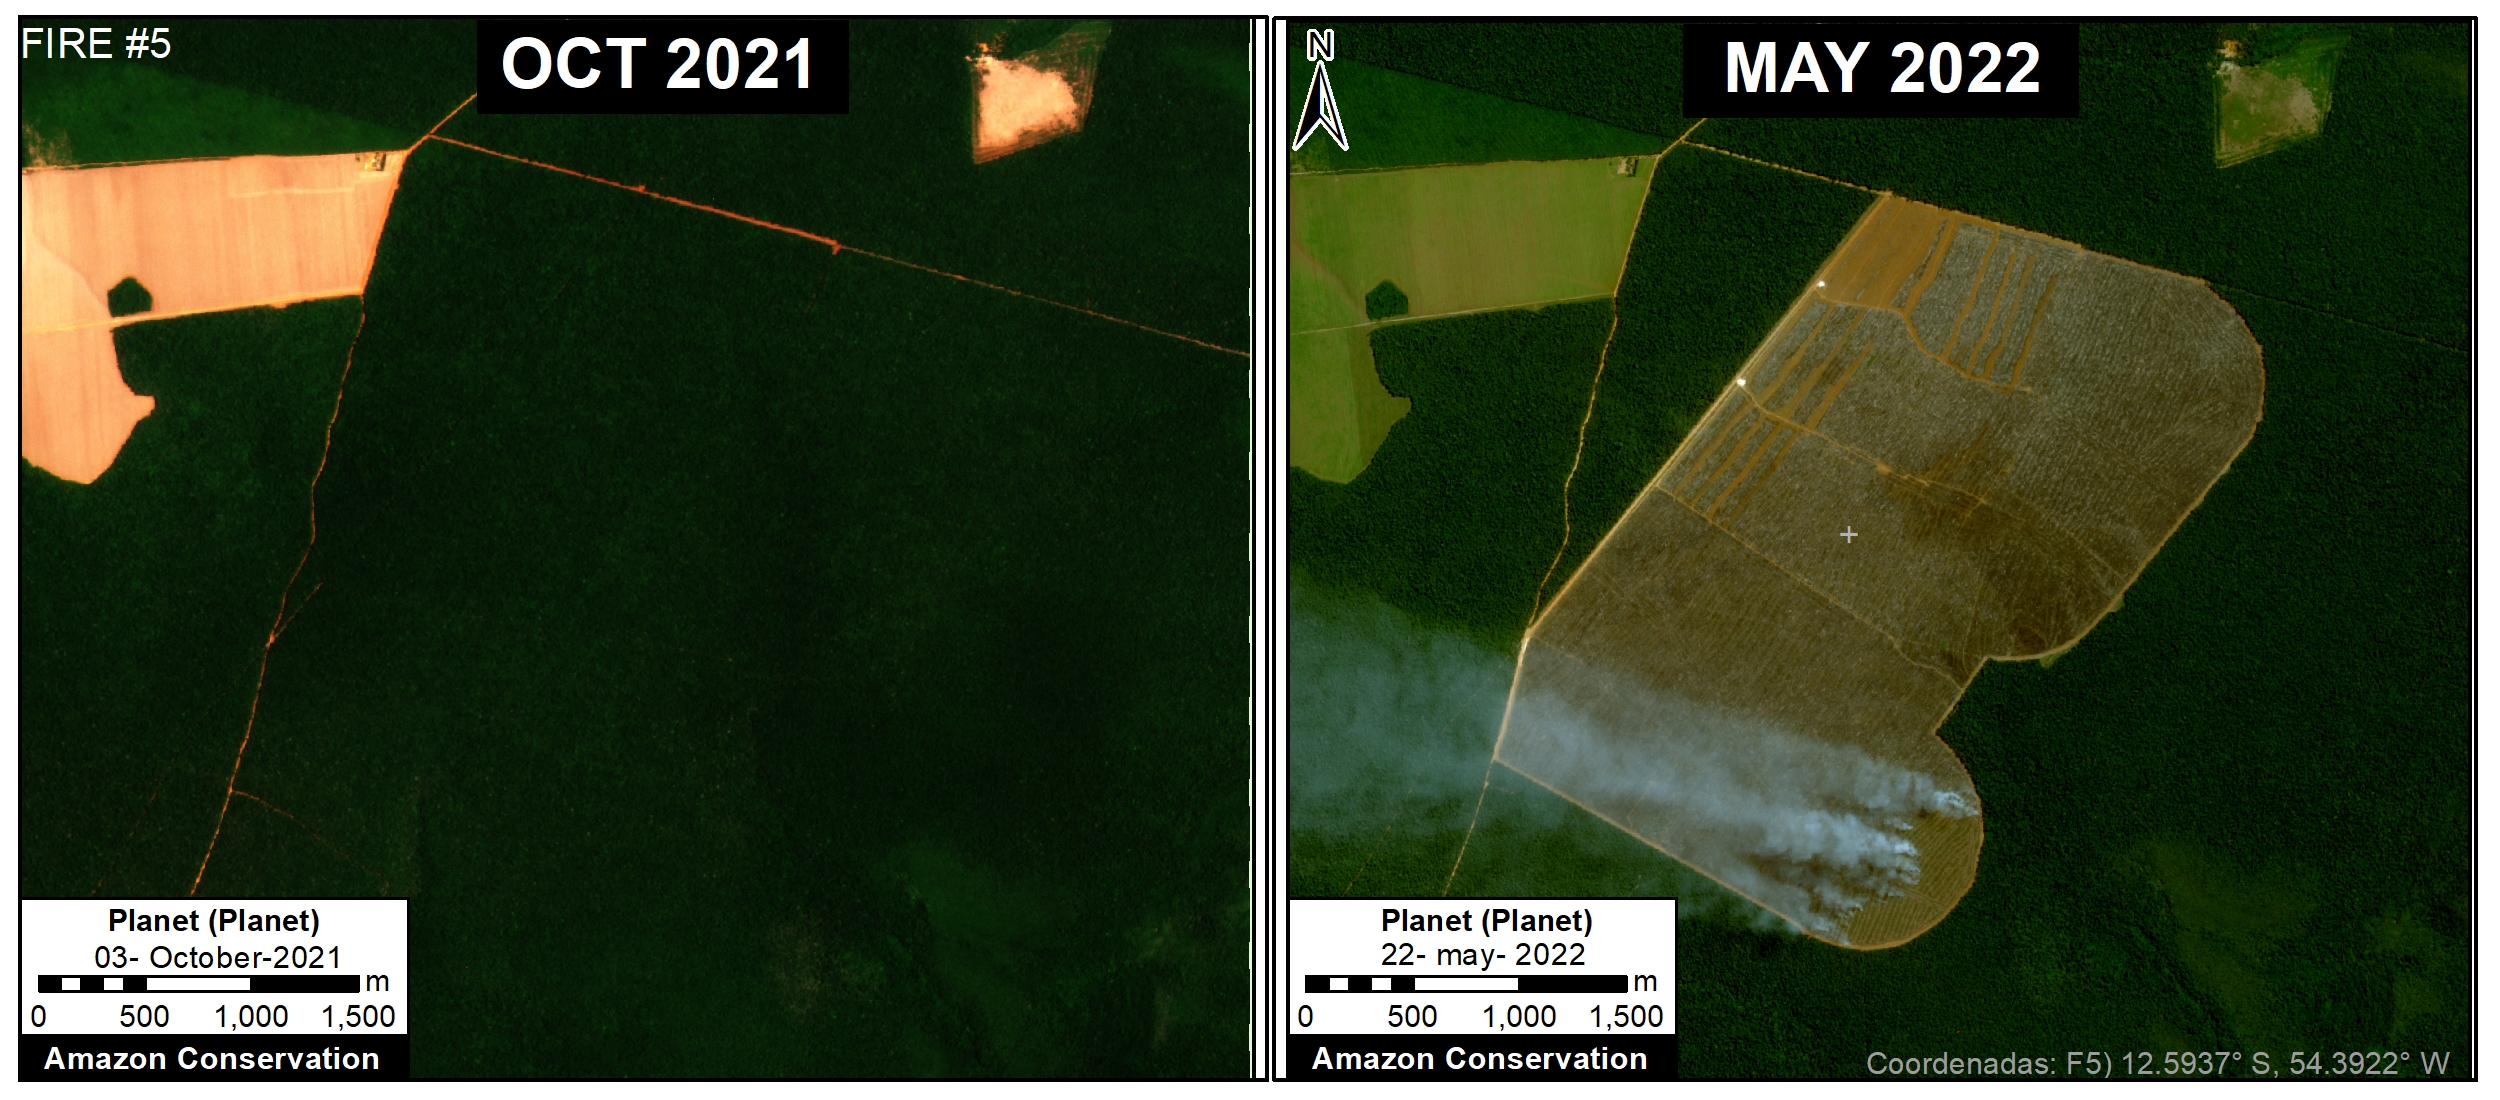
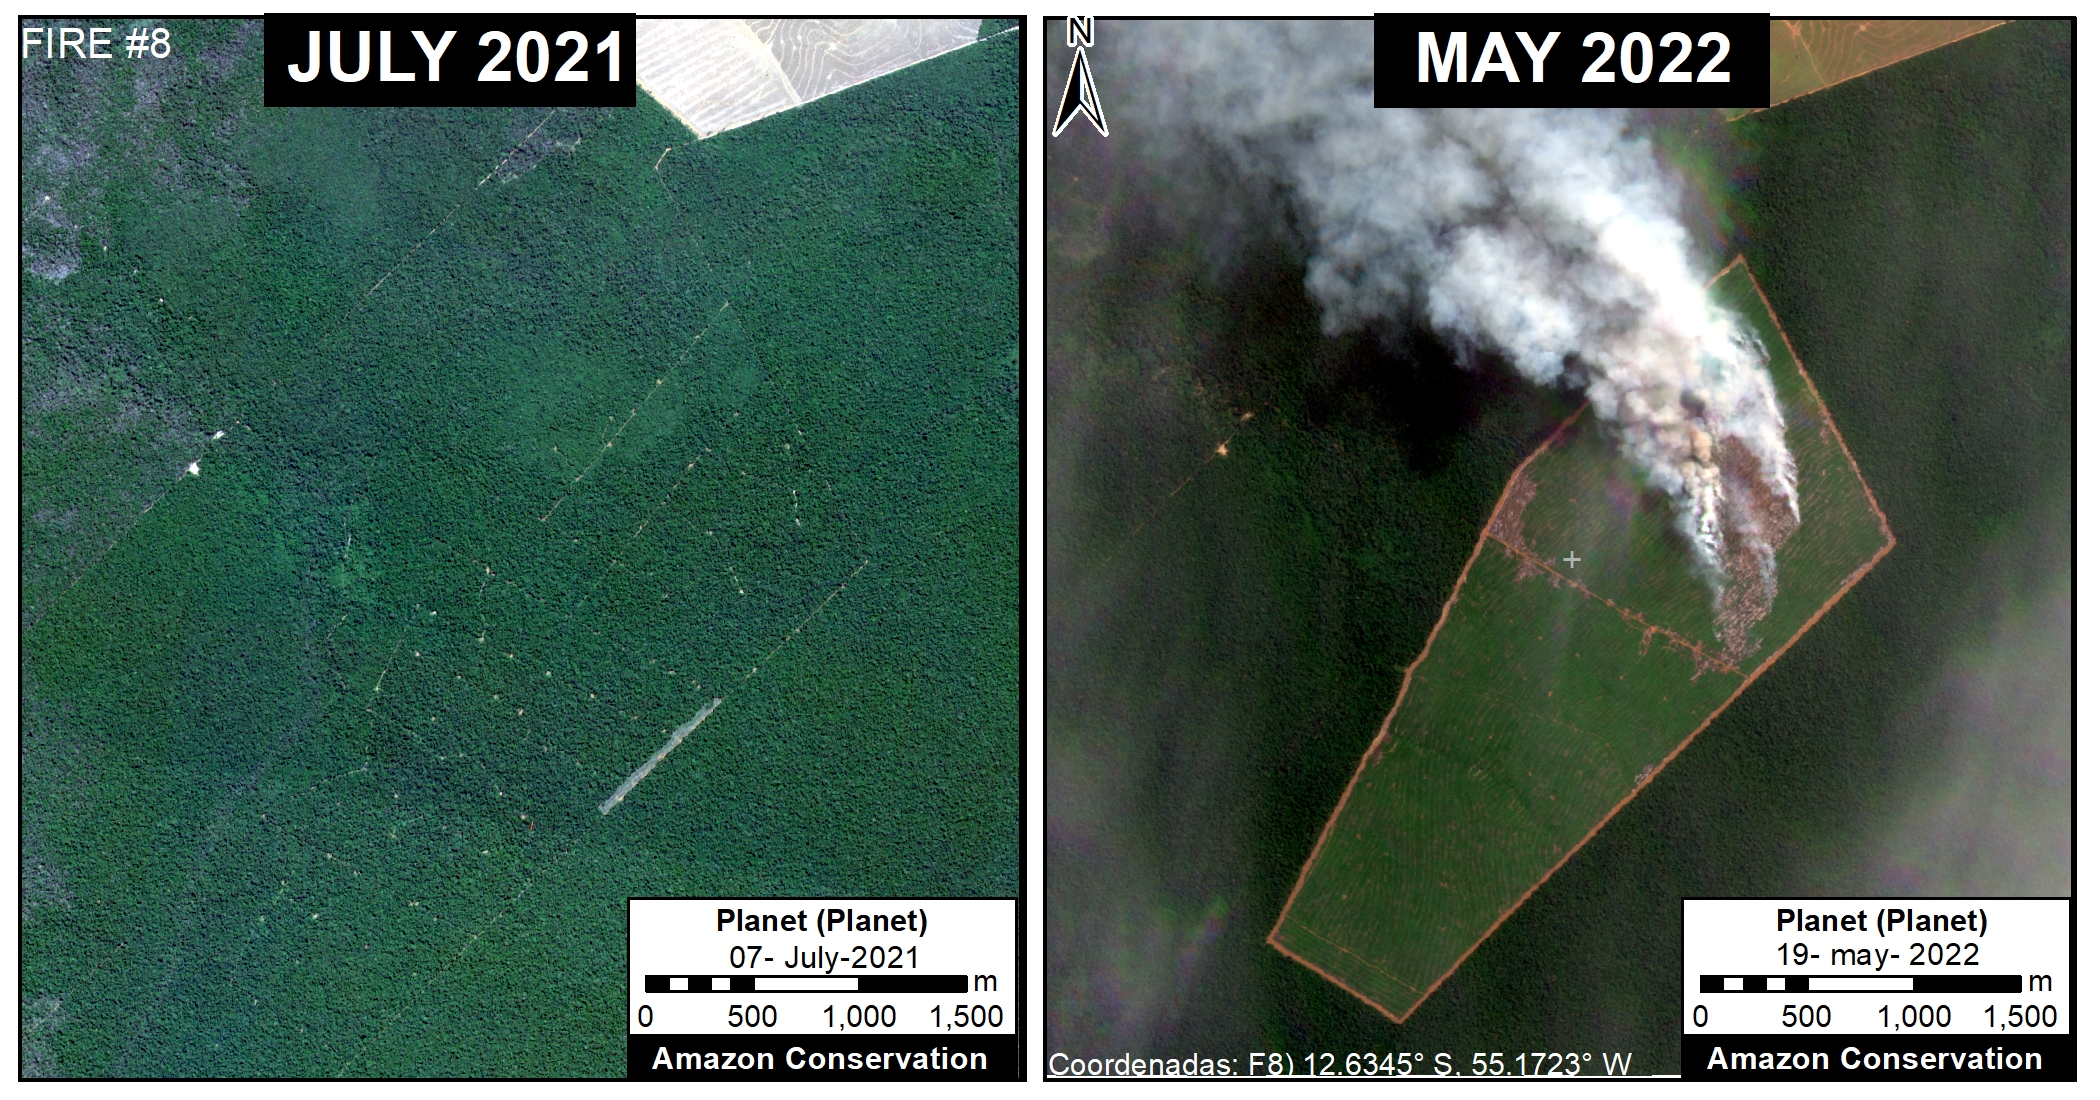
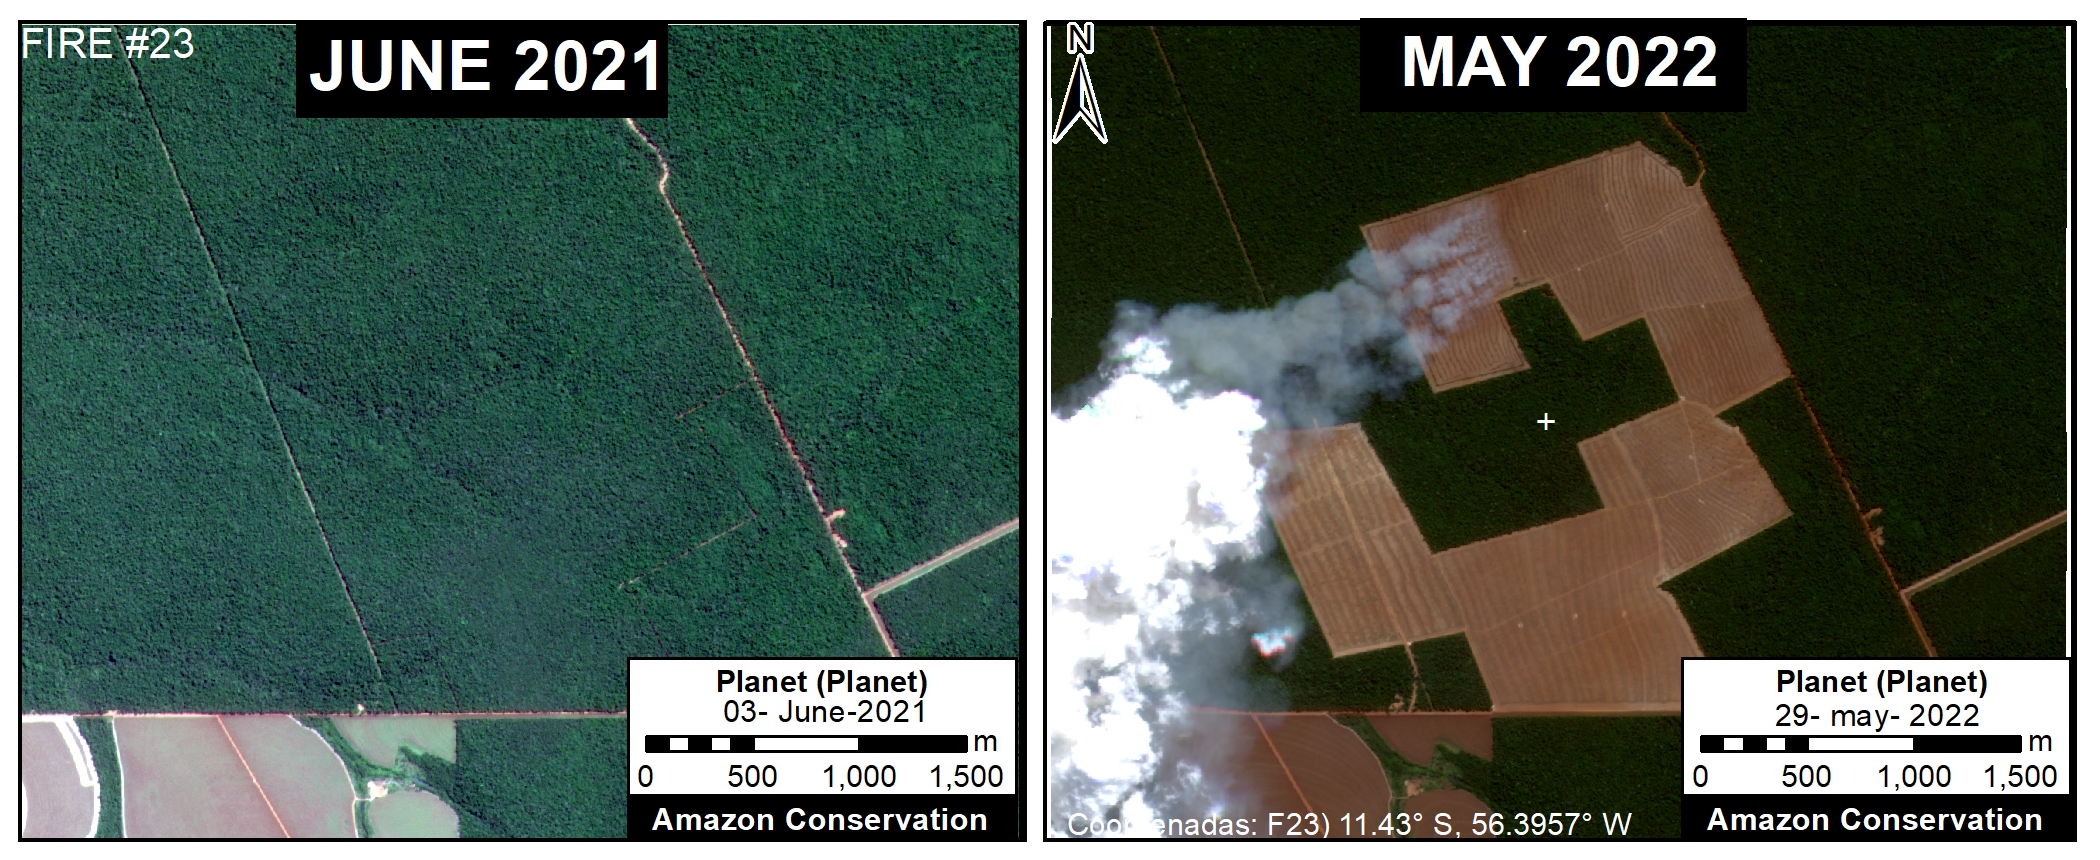
Example of fires burning an area recently deforested for a new soy plantation. Data: Planet.

The Amazon Soy Moratorium has often been credited with significantly reducing soy-related deforestation in the Amazon over the past 15 years.

The Moratorium is a voluntary zero-deforestation agreement in which traders agree not to purchase soy grown on land cleared after 2008.

However, increasing soybean prices may be driving a resurgence of the problem of direct soy deforestation. That is, direct conversion of primary deforestation to soy plantation without passing an initial period as cattle pasture.

A recent report by Global Forest Watch estimated the direct soy deforestation of 29,000 hectares in the Brazilian Amazon in 2019 (Schneider et al 2021).

Here, we report the additional direct soy deforestation of at least 42,000 hectares in the Brazilian Amazon since 2020. All of these areas occurred in the state of Mato Grosso, located on the southeast edge of the Amazon.

We detected all of these soy plantations based on recent major fire activity (84 major fires), in which the recently deforested area was burned in preparation for the upcoming planting season (see Methodology below for more details).

Below, we show a base map of these recently deforested and then burned areas in the Mato Grosso state of the Brazilian Amazon followed by a series of examples from the satellite imagery.

Base Map – Recent Soy Deforestation in Brazilian Amazon

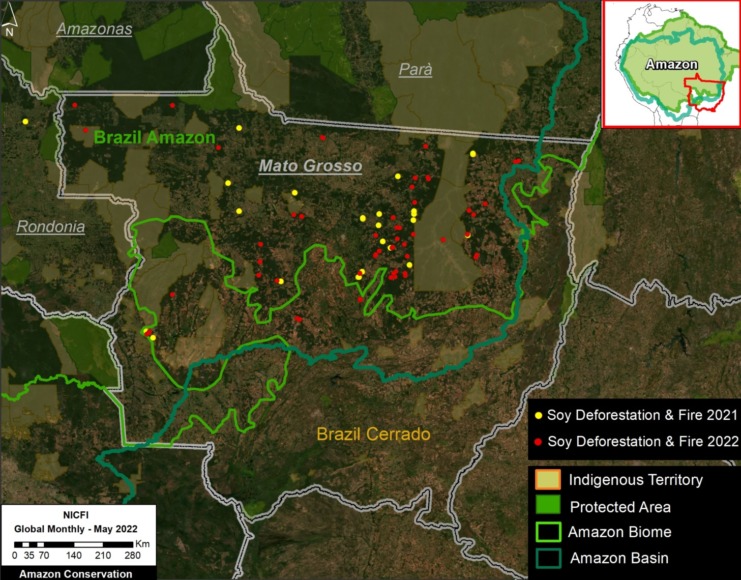
The Base Map below shows the areas, indicated by red dots, of recent direct deforestation for new soy plantations that we detected by monitoring major fire activity in 2022.

Between May 2021 and June 2022, we detected 84 major fires that corresponded to burning areas recently deforested for new soy plantations. These 84 areas, all of which occurred in the state of Mato Grosso, cover an area of 42,000 hectares.

Our geographic focus was the Brazilian Amazon biome in the state of Mato Grosso, as covered by the Amazon Soy Moratorium. For example, we also documented extensive direct soy deforestation and fire in the Bolivian Amazon (Santa Cruz department), but we did not include that information here.

Base Map. Recent Soy Deforestation in Brazilian Amazon. Data: ACA/MAAP, NICFI.

Examples of Deforestation & Fire for New Soy Plantations

As noted above, we detected the direct deforestation for new soy plantations by monitoring major fire activity in 2022. It is assumed that fires are preparing the recently deforested area for upcoming soy planting.

Methodology

We first tracked major fires in 2021 and 2022 using our novel real-time fire monitoring app. See MAAP #118 for more background information about the app and general methodology for detecting major fires based on aerosol emissions. The first major fires were detected in May of each year (2021 and 2022) and we continued collecting data on a daily basis through early July of each year. We monitored fires across the entire Amazon, but this report focuses on Brazil.

For all major fires detected with the app, we confirmed them with high-resolution satellite imagery from Planet. This confirmation was accomplished by visualizing either smoke plumes the day of the fire or burned areas in subsequent days after the fire.

All confirmed fires were assigned a category based on likely direct fire type or driver. These categories include 1) burning area recently deforested for new soy plantation, burning area recently deforested for new cattle pasture, and burning grasslands embedded in the larger rainforest matrix. On rarer occasions, one of these fire types may escape into the surrounding forest, making it an actual forest fire.

Specifically, the soy-related fires were defined as those burning recently deforested areas (that is, areas cleared since 2020) that had a distinctive linear pattern seemingly designed for organized crop agriculture. Most of the newly identified soy areas were also adjacent to existing soy plantations. In other words, the soy deforestation and fire pattern were visually quite distinct from cattle-related and grassland fires. Local experts have informed us that the fires are likely prepping the recently deforested area for the upcoming soy planting season. For all determined direct soy-related fires, we estimated the burned area using the spatial measurement tools in Planet Explorer and entered it into a database. We noted that in July of both years, the fires shifted away from soy and more towards cattle areas.

References

Martina Schneider, Liz Goldman, Mikaela Weisse, Luiz Amaral and Luiz Calado (2021) The Commodity Report: Soy Production’s Impact on Forests in South America. Link: https://www.globalforestwatch.org/blog/commodities/soy-production-forests-south-america/

X.-P. Song, M.C. Hansen, P. Potapov, et al (2021). Massive soybean expansion in South America since 2000 and implications for conservation. Nature Sustainability. Link: https://www.nature.com/articles/s41893-021-00729-z

Acknowledgements

We thank V. Silgueiro and R. Carvalho from the organization Instituto Centro de Vida (ICV) for helpful information and comments related to this report.

Citation

Finer M, Ariñez A (2022) Soy Deforestation in the Brazilian Amazon. MAAP: #161.

MAAP #160: Lasers Estimate Carbon in the Amazon – NASA’s GEDI Mission

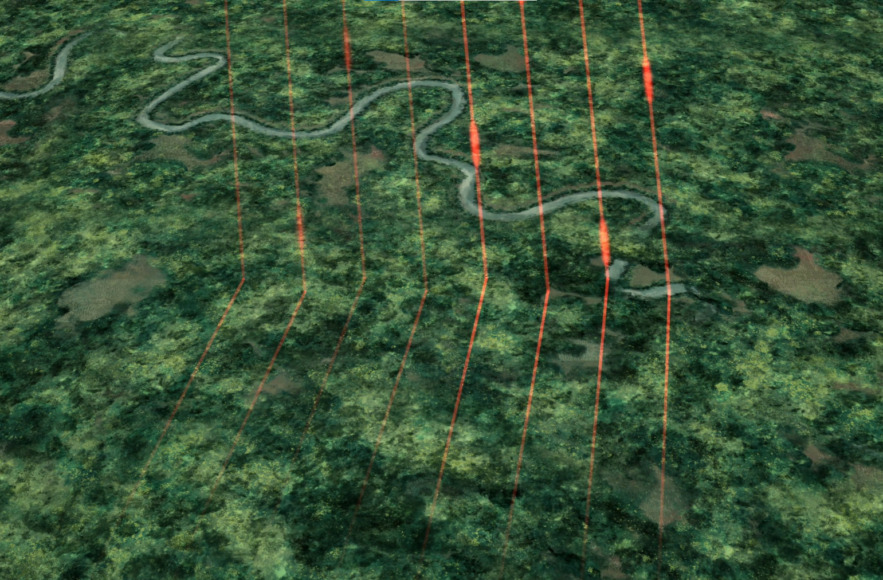
Simulation of GEDI lasers collecting data. Source: UMD.

NASA’s GEDI mission uses lasers to provide cutting-edge estimates of aboveground biomass and related carbon on a global scale.

Launched in late 2018 and installed on the International Space Station, GEDI’s lasers return an estimate of aboveground biomass density at greater accuracy and resolution than previously available.

Here, we zoom in on the Amazon and take a first look at the recently available Level 4B data: Gridded Aboveground Biomass Density measured in megagrams per hectare (Mg/ha) at a 1-kilometer resolution.

See the GEDI homepage for more background information on the mission, which extends until January 2023. Be sure to check out this illustrative video.


Base Map – Aboveground Biomass in the Amazon

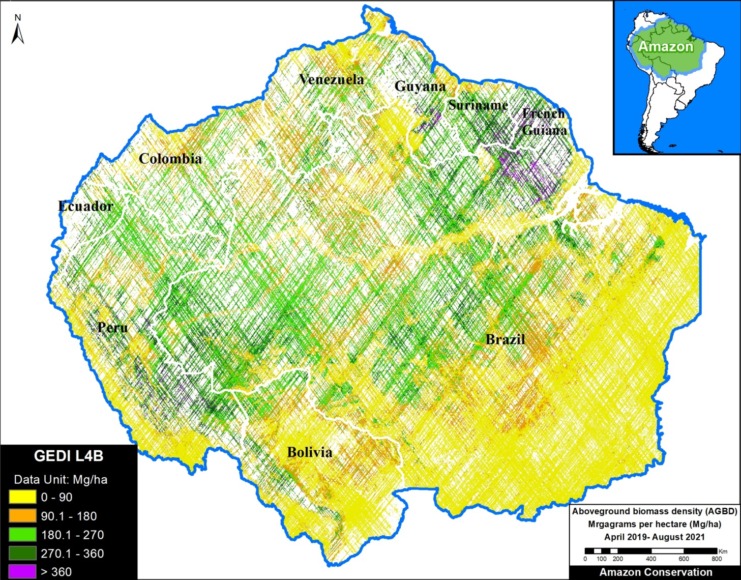
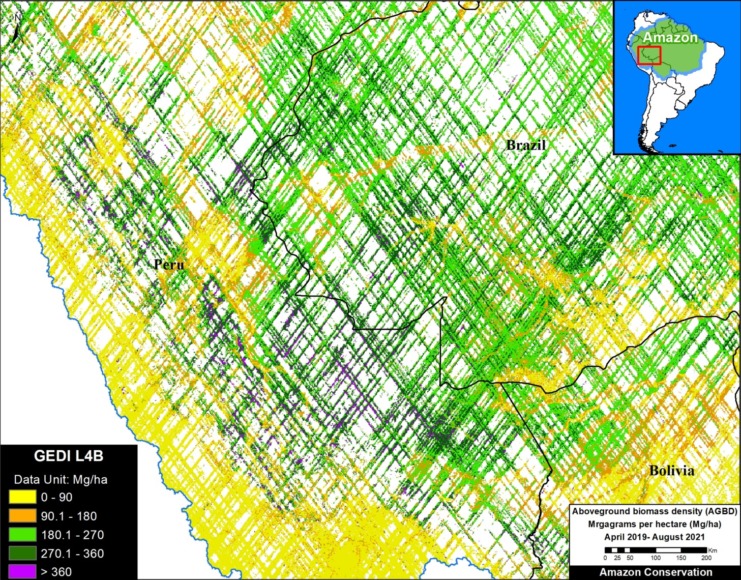
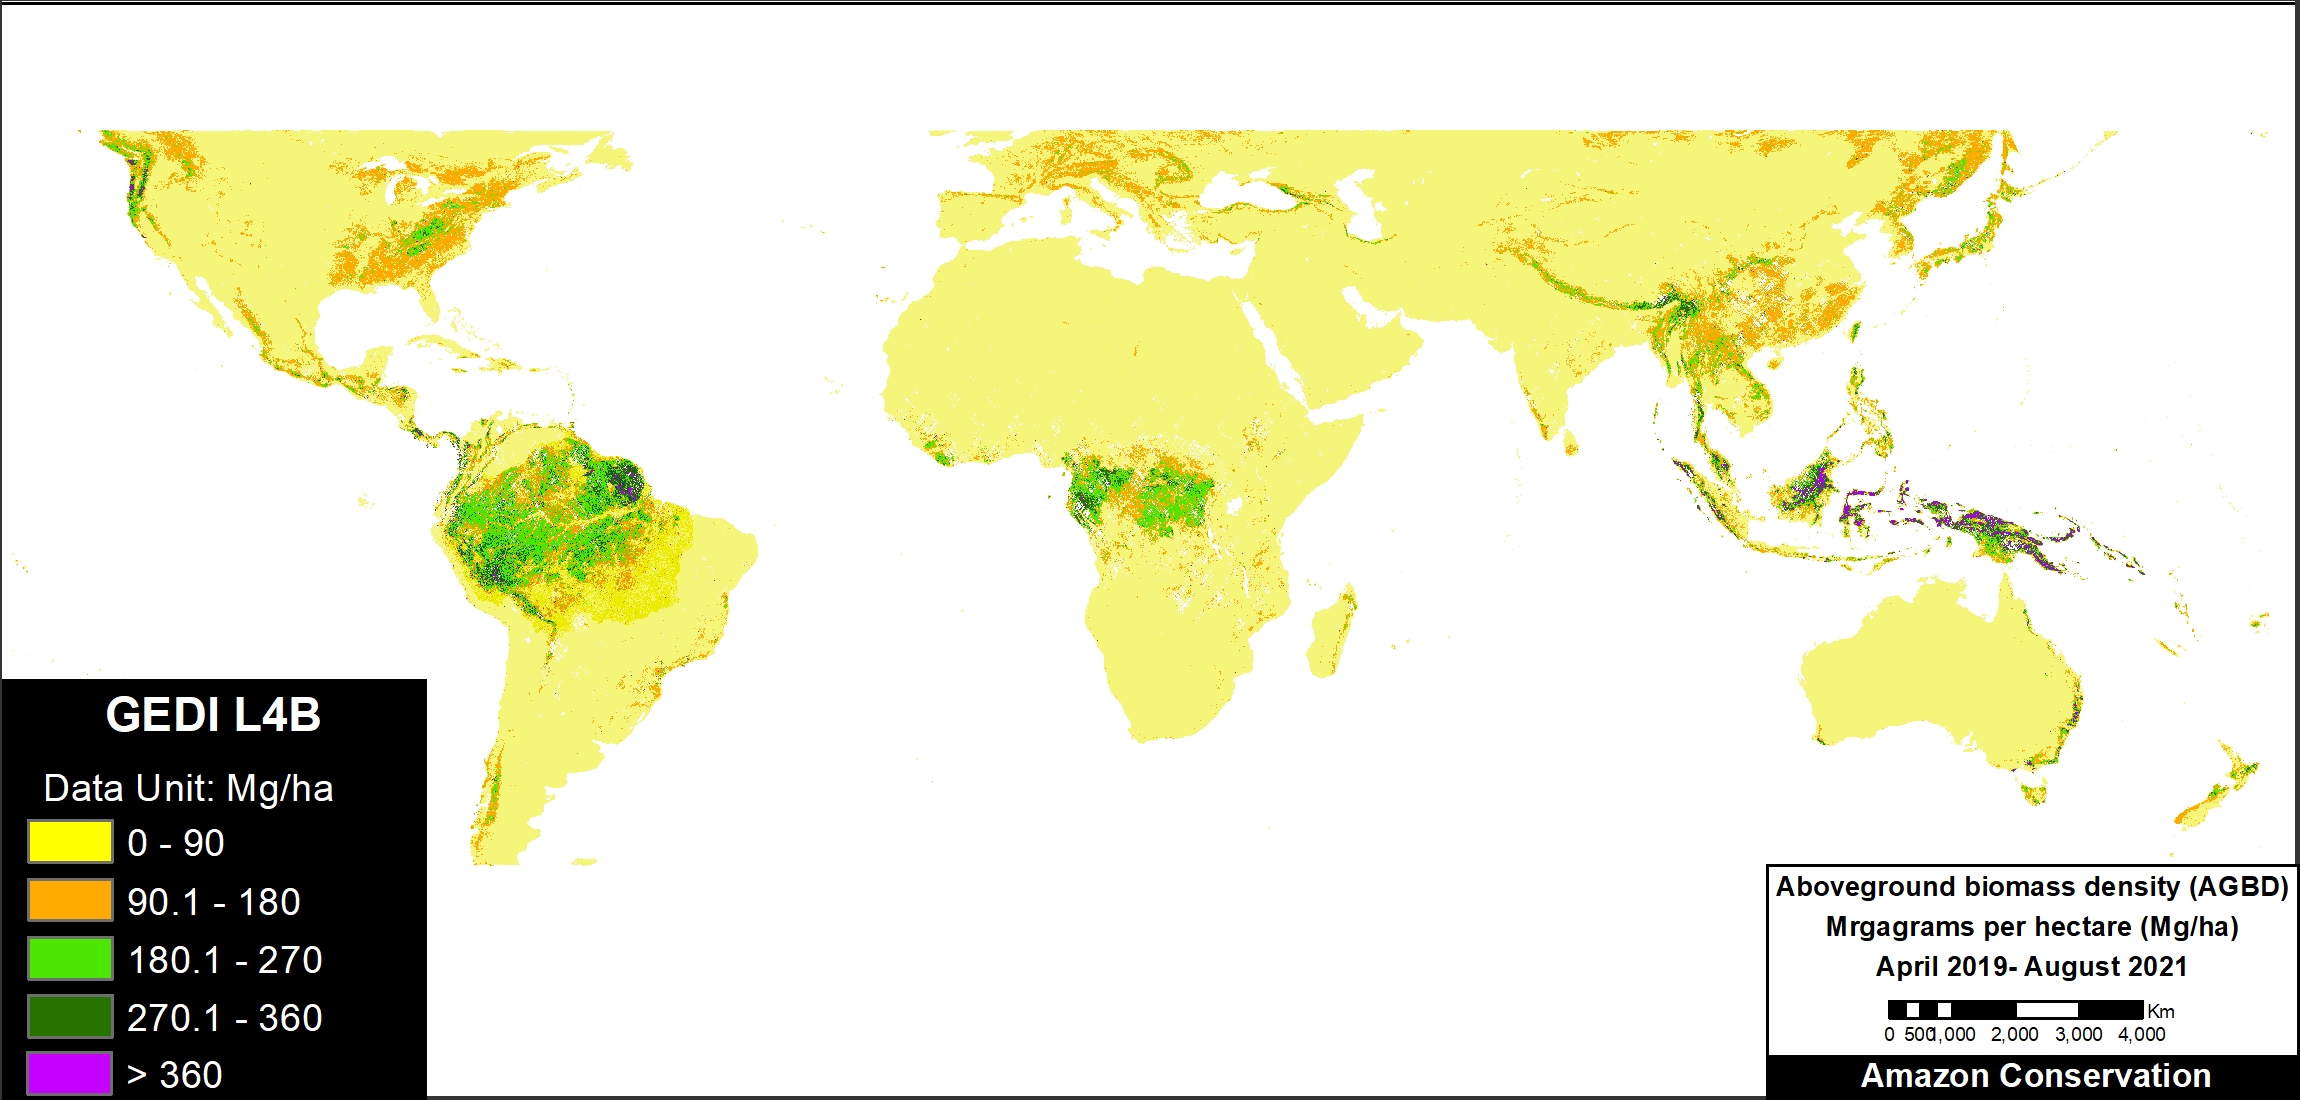
The Base Map displays the GEDI data for the nine countries of the Amazon biome, displaying aboveground biomass for the time period April 2019 to August 2021.

Base Map. Aboveground Biomass Density in the Amazon. Data: NASA/UMD GEDI L4B. Click twice to enlarge.


We highlight the following initial major findings:

  • The data is not yet comprehensive as there are some areas the lasers have not yet recorded data (indicated in white).
    h
  • The areas with the highest aboveground biomass and related carbon (indicated in dark green and purple) include:
    • Northeast Amazon: Corner of Brazil, Suriname, & French Guiana.
    • Southwest Amazon: Southwest Brazil and adjacent Peru (see zoom below).
    • Northwest Amazon: Northern Peru, Ecuador, and southeast Colombia.

Zoom In – Southwest Amazon

To better visualize the GEDI laser data, we also present a zoom of the Southwest Amazon. Although deforested areas (and natural savannahs) are illustrated in yellow and orange, note the surrounding presence of high carbon forest (green and purple).

Zoom In – Southwest Amazon. Aboveground Biomass Density. Data: NASA/UMD GEDI L4B. Click twice to enlarge.

Zoom Out – Global Scale

Note that tropical forests, including the Amazon, have the highest levels of aboveground biomass globally.

Zoom Out – Glocal scale. Aboveground Biomass Density. Data: NASA/UMD GEDI L4B. Click twice to enlarge.

Acknowledgements

This work was supported by NORAD (Norwegian Agency for Development Cooperation) and ICFC (International Conservation Fund of Canada).

Citation

Finer M, Ariñez A (2022) Lasers Estimate Carbon in the Amazon – NASA’s GEDI Mission. MAAP: 160.

MAAP #155: Deforestation Hotspots in the Venezuelan Amazon

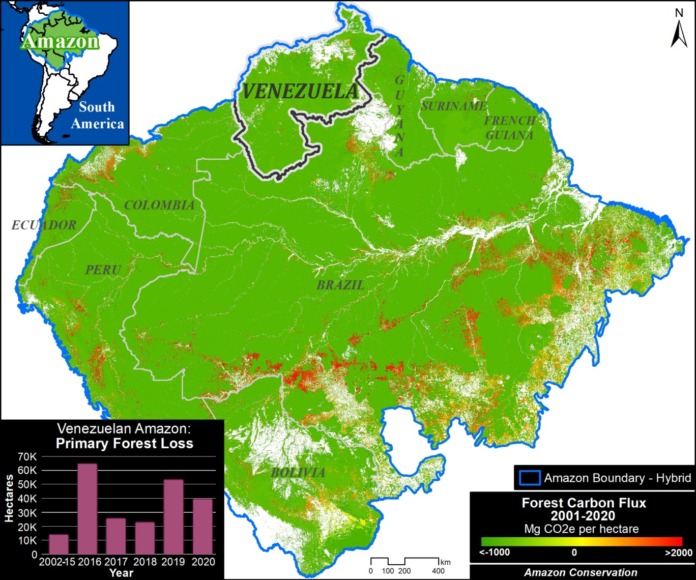
Amazon Base Map. Forest Carbon Flux across the Amazon, 2001-2020. Data: Harris et al 2021. Analysis: Amazon Conservation/MAAP.

We present here the first report of a series focused on the Venezuelan Amazon, which covers over 47 million hectares of the northern section of the Amazon biome (above western Brazil).

As the Amazon Base Map indicates, Venezuela is a key part to the remaining core Amazon that is still functioning as a critical carbon sink, making it an important piece to long-term conservation strategies.

However, deforestation has been increasing in recent years (see graph in Base Map), indicating escalating threats.

Specifically, there is a clear trend of increasing primary forest loss since 2015, including a recent spike in 2019.

We estimate the loss of over 140,000 hectares (345,000 acres) over the past four years, accounting for 1.6% of the total loss across the Amazon during that time period.

Below, we investigate the major hotspots and drivers of deforestation currently in the Venezuelan Amazon.


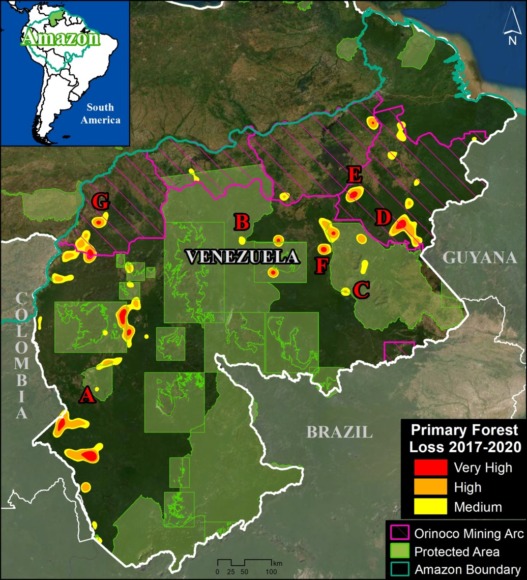
Venezuela Base Map. Hotspots of primary forest loss across the Venezuelan Amazon (2017-2020). UMD/GLAD, MAAP.

The Venezuela base map shows the major hotspots of primary forest loss across the Venezuelan Amazon over the past four years (2017-2020).

Note that most hotspots are within the Orinoco Mining Arc, a large area over 11 million hectares created by a controversial presidential decree in 2016 designed to promote mining (SOSOrinoco 2021), as well as within and around the extensive network of protected areas.

These protected areas cover 43% (20 million hectares) of the Venezuelan Amazon and accounted for around 30% of total forest loss. The most impacted areas in recent years are Caura, Canaima, and Yapacana National Parks (over 22,000 hectares combined).

We zoomed in on these hotspots and found that mining, fires, and agriculture (including cattle pasture) are the three primary deforestation drivers across the Venezuelan Amazon. There may be complex interactions between these drivers, such as mining centers leading to fires and agricultural expansion to support the new mining population.

It is worth noting that Venezuela joins Peru, Brazil, and Suriname as countries where mining is now documented to be actively driving major deforestation of primary forest.

We also note that, as in the rest of the Amazon, virtually all fires are caused by humans (that is, not natural events) and most are likely linked to preparing land for agricultural activities. During drier periods, these fires may escape, causing larger forest fires.

Below, we illustrate these drivers in a series of high-resolution (3 meters) and very high-resolution (0.5 meters) images.

High-resolution Zooms

Mining

Zoom A. Yapacana National Park

Yapacana National Park, which is a unique mosaic of natural savannas and forest, is currently experiencing deforestation impacts from active mining operations. We show two examples of recent mining in the Cerro Yapacana mining sector, featuring very-high resolution imagery from late 2021 (see Zooms A1 and A2). These two areas have lost over 550 hectares since the early 2000s.

Zoom A1. Mining deforestation in Yapacana National Park. Data: Planet/Skysat.
Zoom A2. Mining deforestation in Yapacana National Park. Data: Planet/Skysat.


Zoom B. Caura National Park

Caura National Park is also experiencing active mining activity. Below are two examples of recent mining activity, featuring very-high resolution imagery from early 2022 (see Zooms B1 and B2).


Zoom B1. Mining deforestation in Caura National Park. Data: Planet/Skysat.


Zoom B2. Mining deforestation in Caura National Park. Data: Planet/Skysat.

Zoom C. Canaima National Park

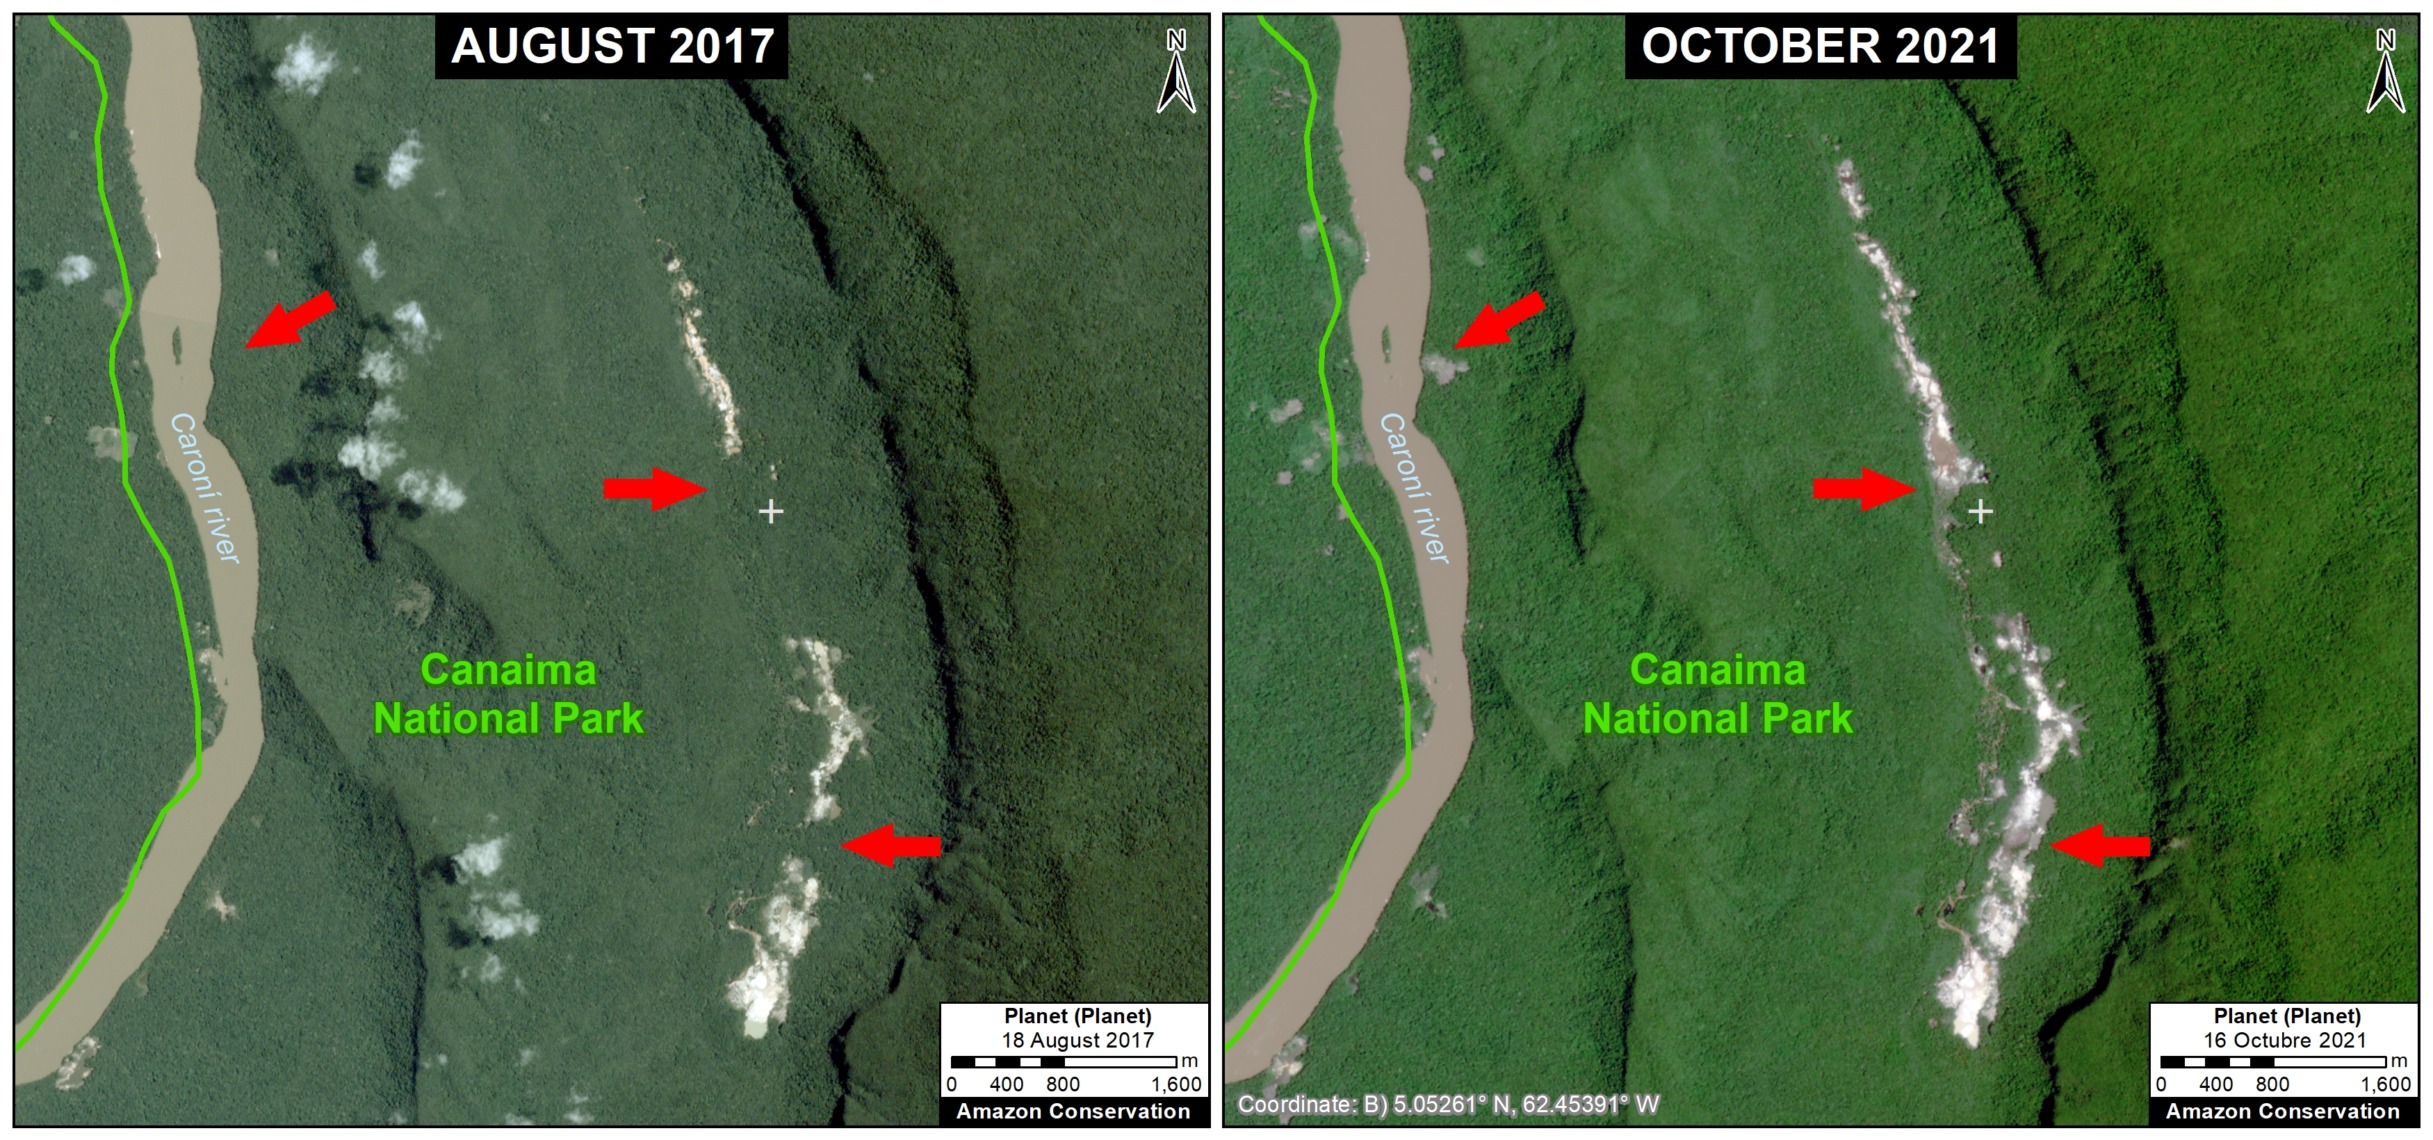
The following image shows the recent expansion of mining deforestation in Canaima National Park between 2017 (left panel) and 2020 (right panel).

Zoom C. Mining deforestation in Canaima National Park. Data: Planet/Skysat.

Zoom D: Orinoco Mining Arc

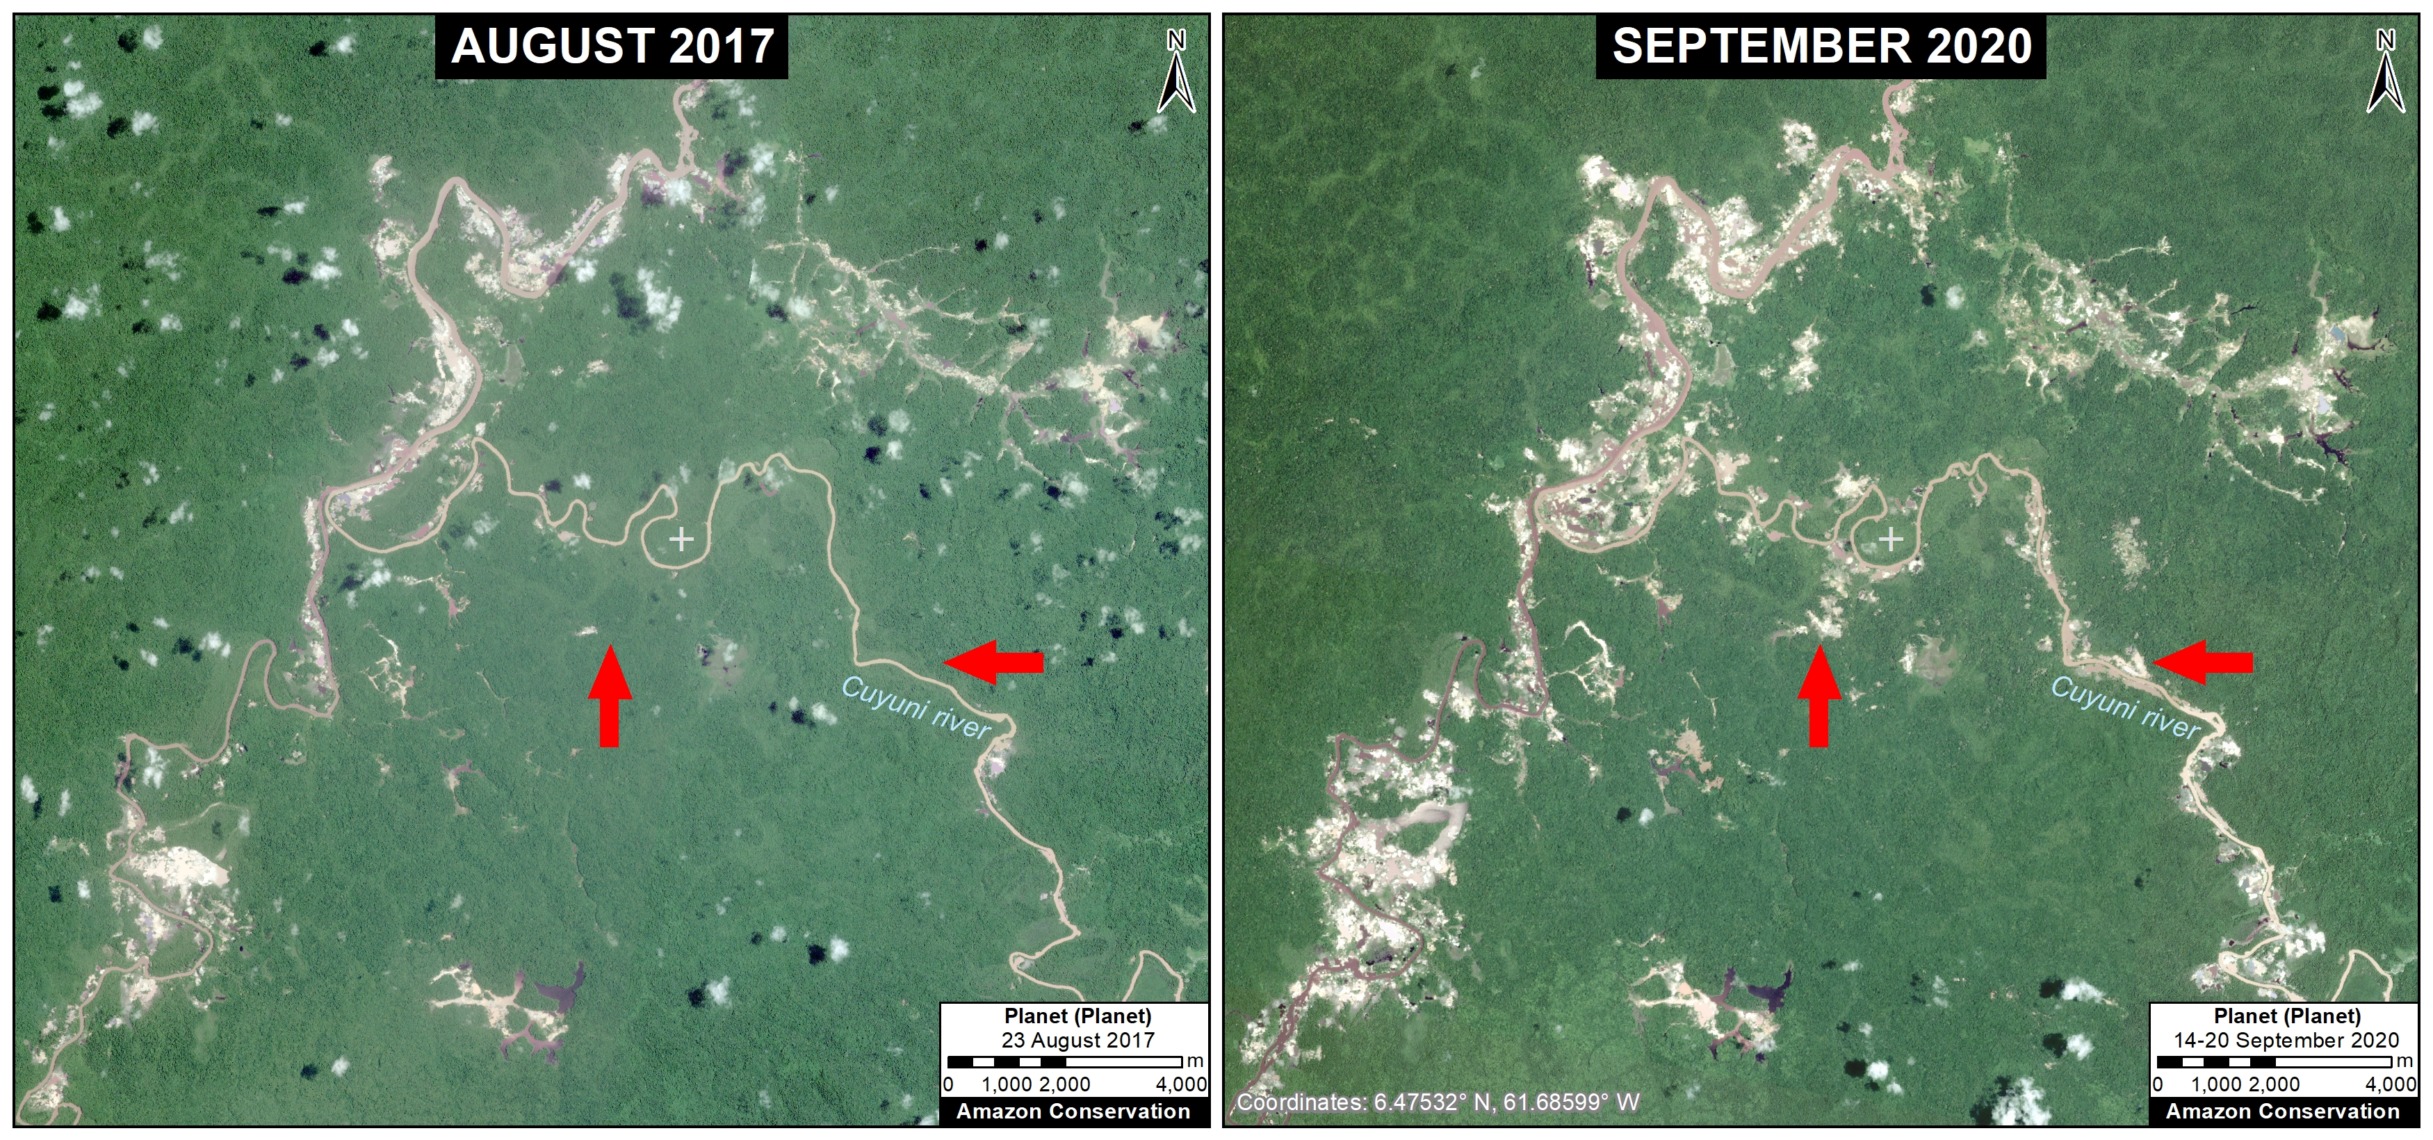
To the north of these protected areas, there is both industrial and river-based mining deforestation in the Orinoco Mining Arc. Zoom D shows an example of major river-based mining deforestation (over 1,800 hectares) between 2017 and 2020, plus a very-high resolution imagery from late 2021.

Zoom D. Mining deforestation in the Orinoco Mining Arc. Data: Planet.

Agriculture

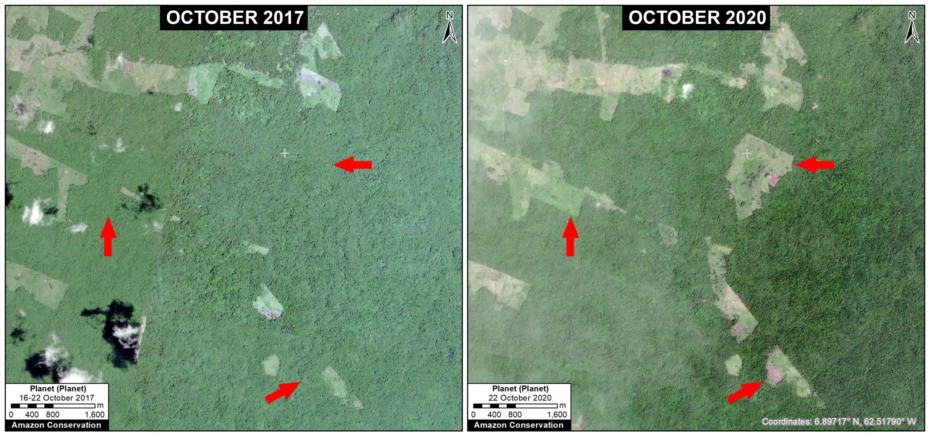
Zoom E shown an example of agricultural expansion (likely cattle ranching) in the northeastern section of the Orinoco Mining Arc. We estimate the forest loss shown in the panels between 2017 and 2020 is over 400 hectares.

Zoom E. Agricultuire deforestation in the Orinoco Mining Arc. Data: Planet.

Fire

Finally, Zooms F and G show recent examples of major fires impacts. Zoom F is an area that experienced major fires in 2019 within and around Canaima National Park. We estimate the forest loss shown in the panels between 2017 and 2020 is 1,175 hectares.

Zoom F. Major fires in 2019 within and around Canaima National Park. Data: Planet.

Zoom G is an area that experienced major fires in 2020 in the near mining sites in the western section of the Orinoco Mining Arc. We estimate the forest loss shown in the panels between 2017 and 2020 is 1,128 hectares.

Zoom G. Major fires in 2020 in the Orinoco Mining Arc. Data: Planet.

Methodology

For a study area with maximum inclusion, for the Venezuelan Amazon we used the wider biogeographic boundary (as defined by RAISG) rather than the strict Amazon watershed boundary (which actually only includes a small portion of Venezuela).

We obtained data for the Orinoco Mining Arc (Arco Minero del Orinoco) and protected areas from the organization SOSOrinoco. The latter dataset contains Areas Under Special Administration Regime (Áreas Bajo Régimen de Administración Especial – ABRAE), which meet the IUCN international definition of protected areas: national parks, natural monuments, wildlife refuges, reserves and sanctuaries.

We used “primary forest loss” data as our proxy for 2002-2020 annual deforestation. This 30-meter resolution (based on Landsat) data is produced by the University of Maryland and presented by Global Forest Watch. Note that it includes forest loss from fires and natural causes. 2021 early warning alert data is also from University of Maryland.

To identify primary forest loss hotspots, we conducted a kernel density estimate. This type of analysis calculates the magnitude per unit area of a particular phenomenon, in this case forest cover loss. We conducted this analysis using the Kernel Density tool from Spatial Analyst Tool Box of ArcGIS.

Finally, we investigated the major hotspots with both high resolution (3 meters) and very high resolution (0.5 meters) satellite imagery from the company Planet to identify causes (drivers).

References

SOSOrinoco. 2021. Deforestation & Changes in Vegetation &  Land Use Cover within the so-called Orinoco Mining Arc between 2000-2020.

Acknowledgements

We thank the organization SOSOrinoco for important information and comments related to this report.

Citation

Finer M, Mamani N (2022) Deforestation Hotspots in the Venezuelan Amazon. MAAP: 155.

MAAP #156: Intense Mining Activity in Yapacana National Park (Venezuelan Amazon)

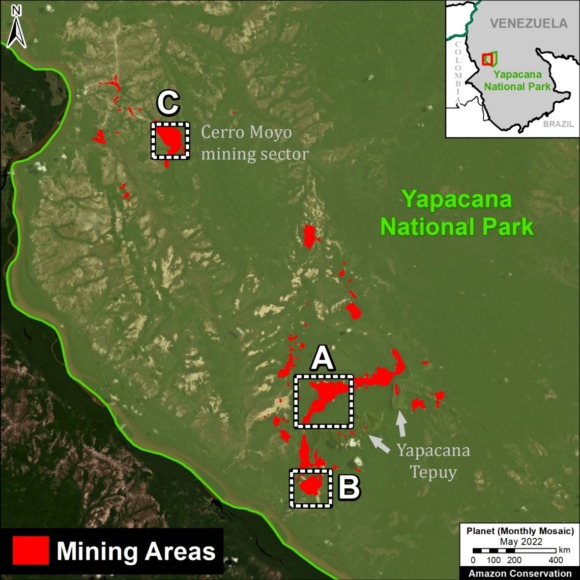
Base Map: Mining areas in Yapacana National Park. Data: SOS Orinoco, ACA/MAAP, Planet.

We present the second report in our series focused on the Venezuelan Amazon.

The first (MAAP #155) documented the loss of over 140,000 hectares (345,000 acres) of primary forest over the past four years. We also zoomed in on the major hotspots, showing that mining is one of the primary deforestation drivers, including in protected areas.

Here we focus on a key protected area, Yapacana National Park.

The park, created in 1978, is a key biogeographical site, with diverse ecosystems (including white sand savannahs), high endemism and biodiversity, and unique Guiana Shield outcrops. Illegal mining started in the park in the 1980s and started to surge in the 2000s (see SOS Orinoco 2020 for details on the complex socio-political issues).

We show Yapacana National Park is currently experiencing intense illegal mining activity.

Specifically, we carried out a detailed estimate of current mining camps and machinery, based on recent and very high-resolution Skysat satellite imagery from Planet (0.5 meters).

We found over 8,000 mining data points (over 4,100 camps and 3,800 pieces of machinery), indicating that Yapacana National Park may currently be the most impacted site in the Amazon (replacing the case La Pampa in the buffer zone of Tambopata National Reserve, in the southern Peruvian Amazon), based on density of mining-related activity.

The goal of this report is to precisely inform the international community about the magnitude of the crisis in Yapacana National Park in hopes of an eventual solution.

Intense Mining in Yapacana National Park

The Base Map (see above) shows the major mining sectors in Yapacana National Park and our Skysat coverage over the recent time period of December 2021 to March 2022 (vertical dark green polygons). In this area, we recorded an astounding 8,214 mining data points (4,167 camps and 3,884 pieces of machinery). This finding is consistent with previous estimates that there are over 2,000 illegal miners operating in the park (and even indicates that this is an underestimate).

The Letters A-C correspond to the zoom images below.


Zoom A: Cerro Yapacana (north)

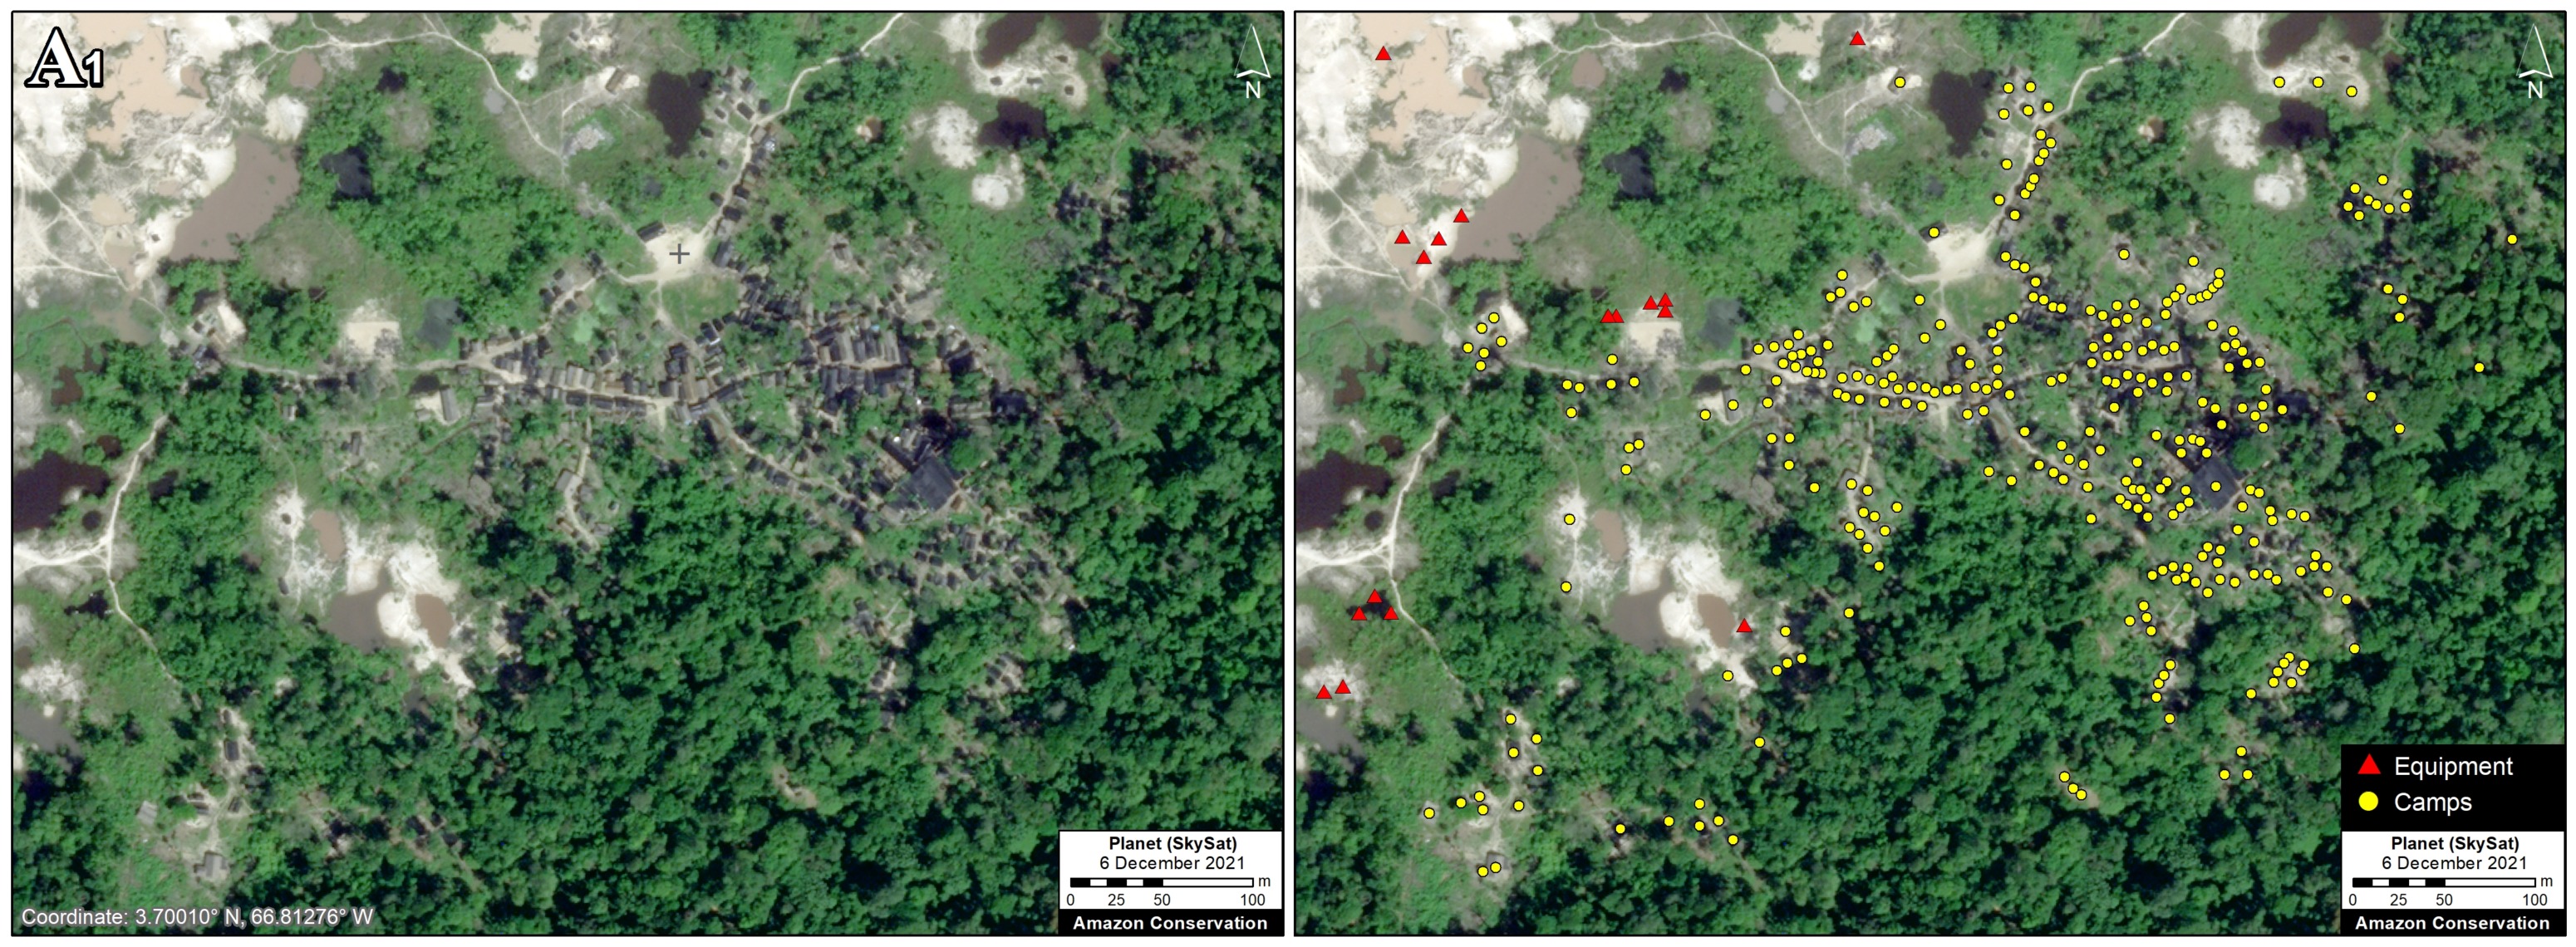
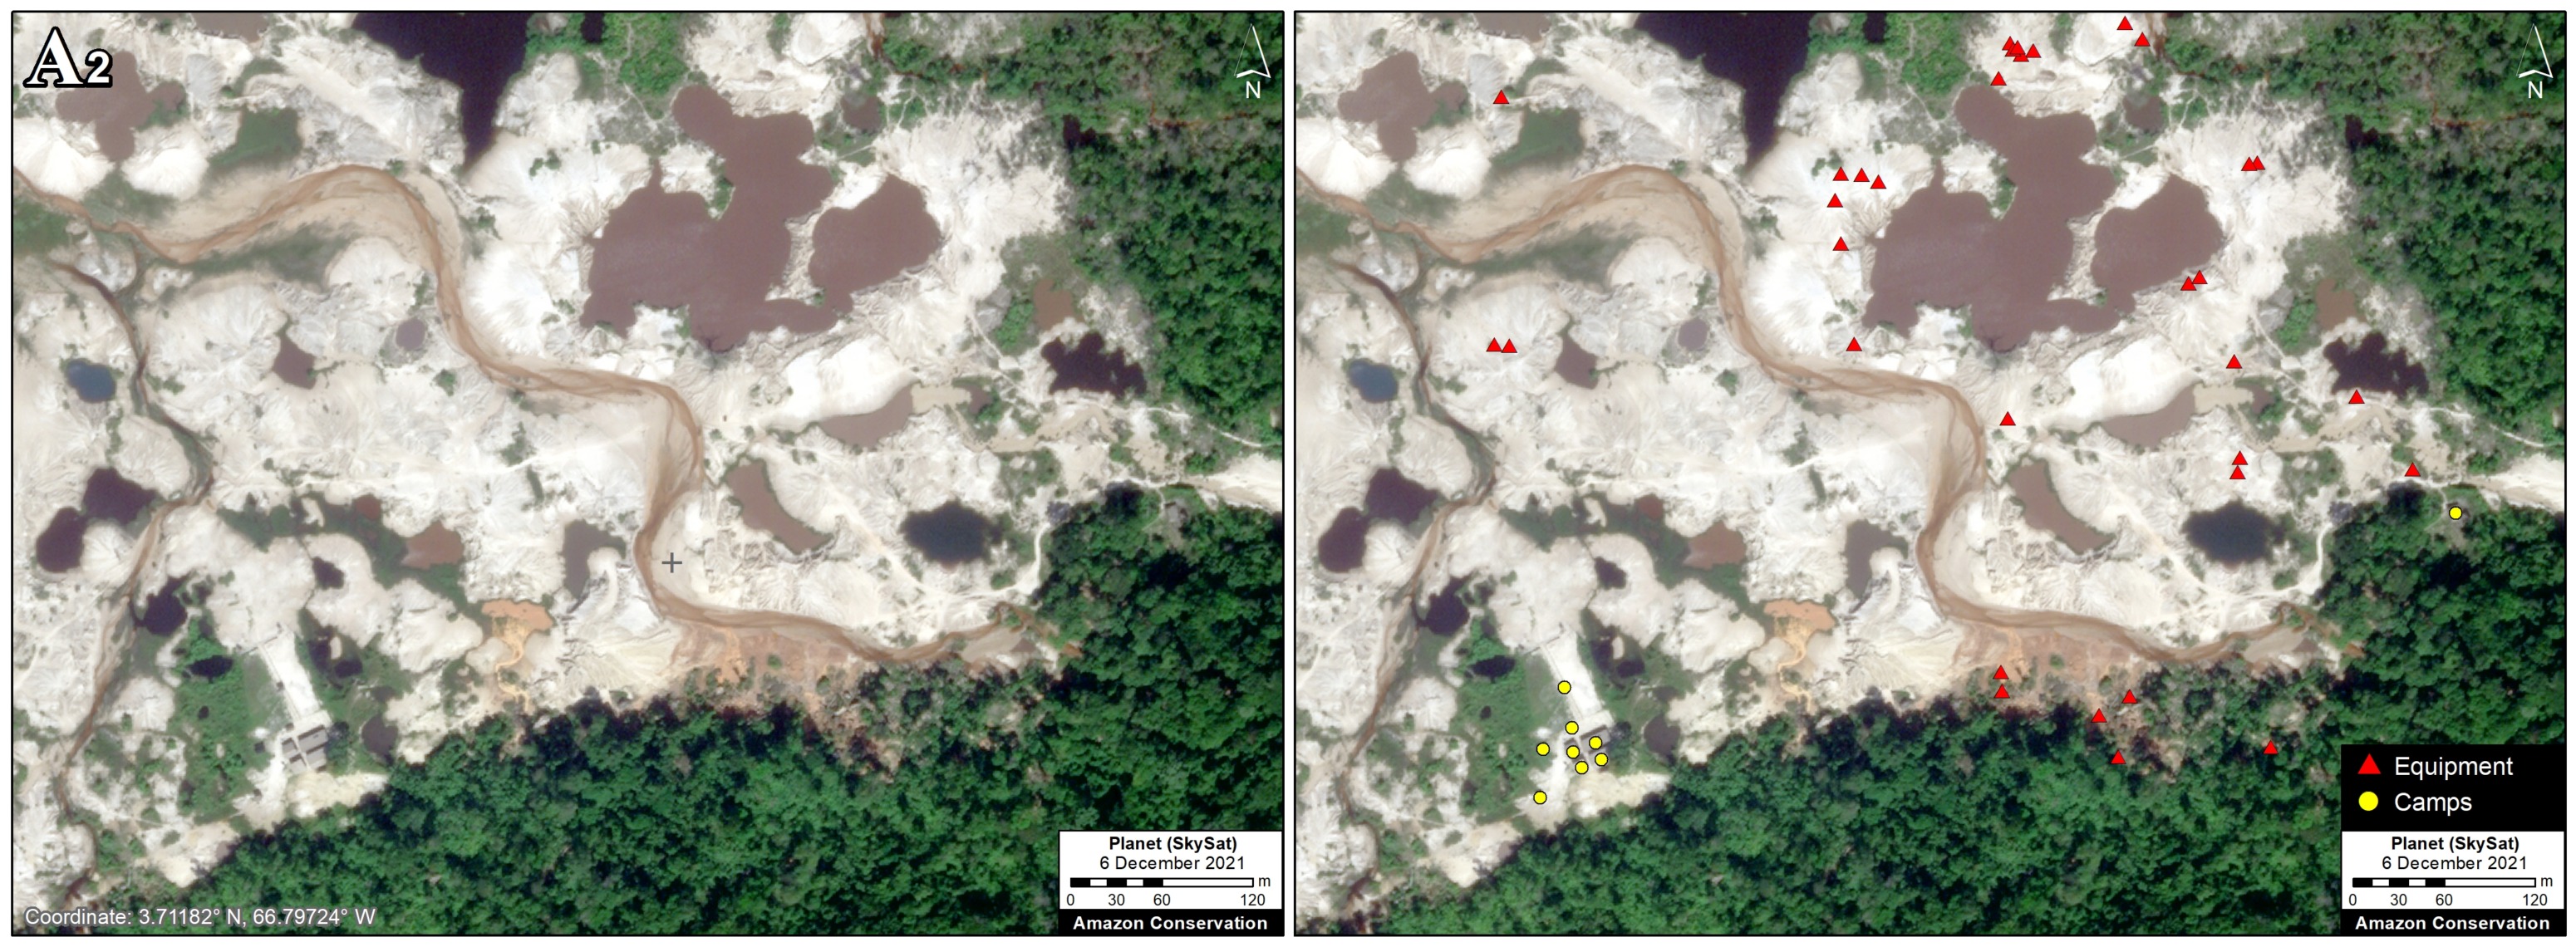
Zoom A centers on a major mining area in the Cerro Yapacana sector that experienced the deforestation of 360 hectares since the early 2000s, including a spike starting in 2016. It shows a very high-resolution Skysat image from early December 2021, with and without the mining data (left and right panel, respectively). Note how the second image brings out previously “invisible” elements within the overall mining area: 945 mining data points (413 camps and 532 equipment).  Further below, Zooms A1 and A2 further illustrate this point.

Zoom A. Mining activity in the Cerro Yapacana northern sector without (left panel) and with (right panel) the mining data. Data: ACA/MAAP, Planet (Skysat).
Zoom A1. Mining activity in the Cerro Yapacana sector without (left panel) and with (right panel) the mining data. Data: ACA/MAAP, Planet (Skysat).
Zoom A2. Mining activity in the Cerro Yapacana sector without (left panel) and with (right panel) the mining data. Data: ACA/MAAP, Planet (Skysat).

Zoom B: Cerro Yapacana (south)

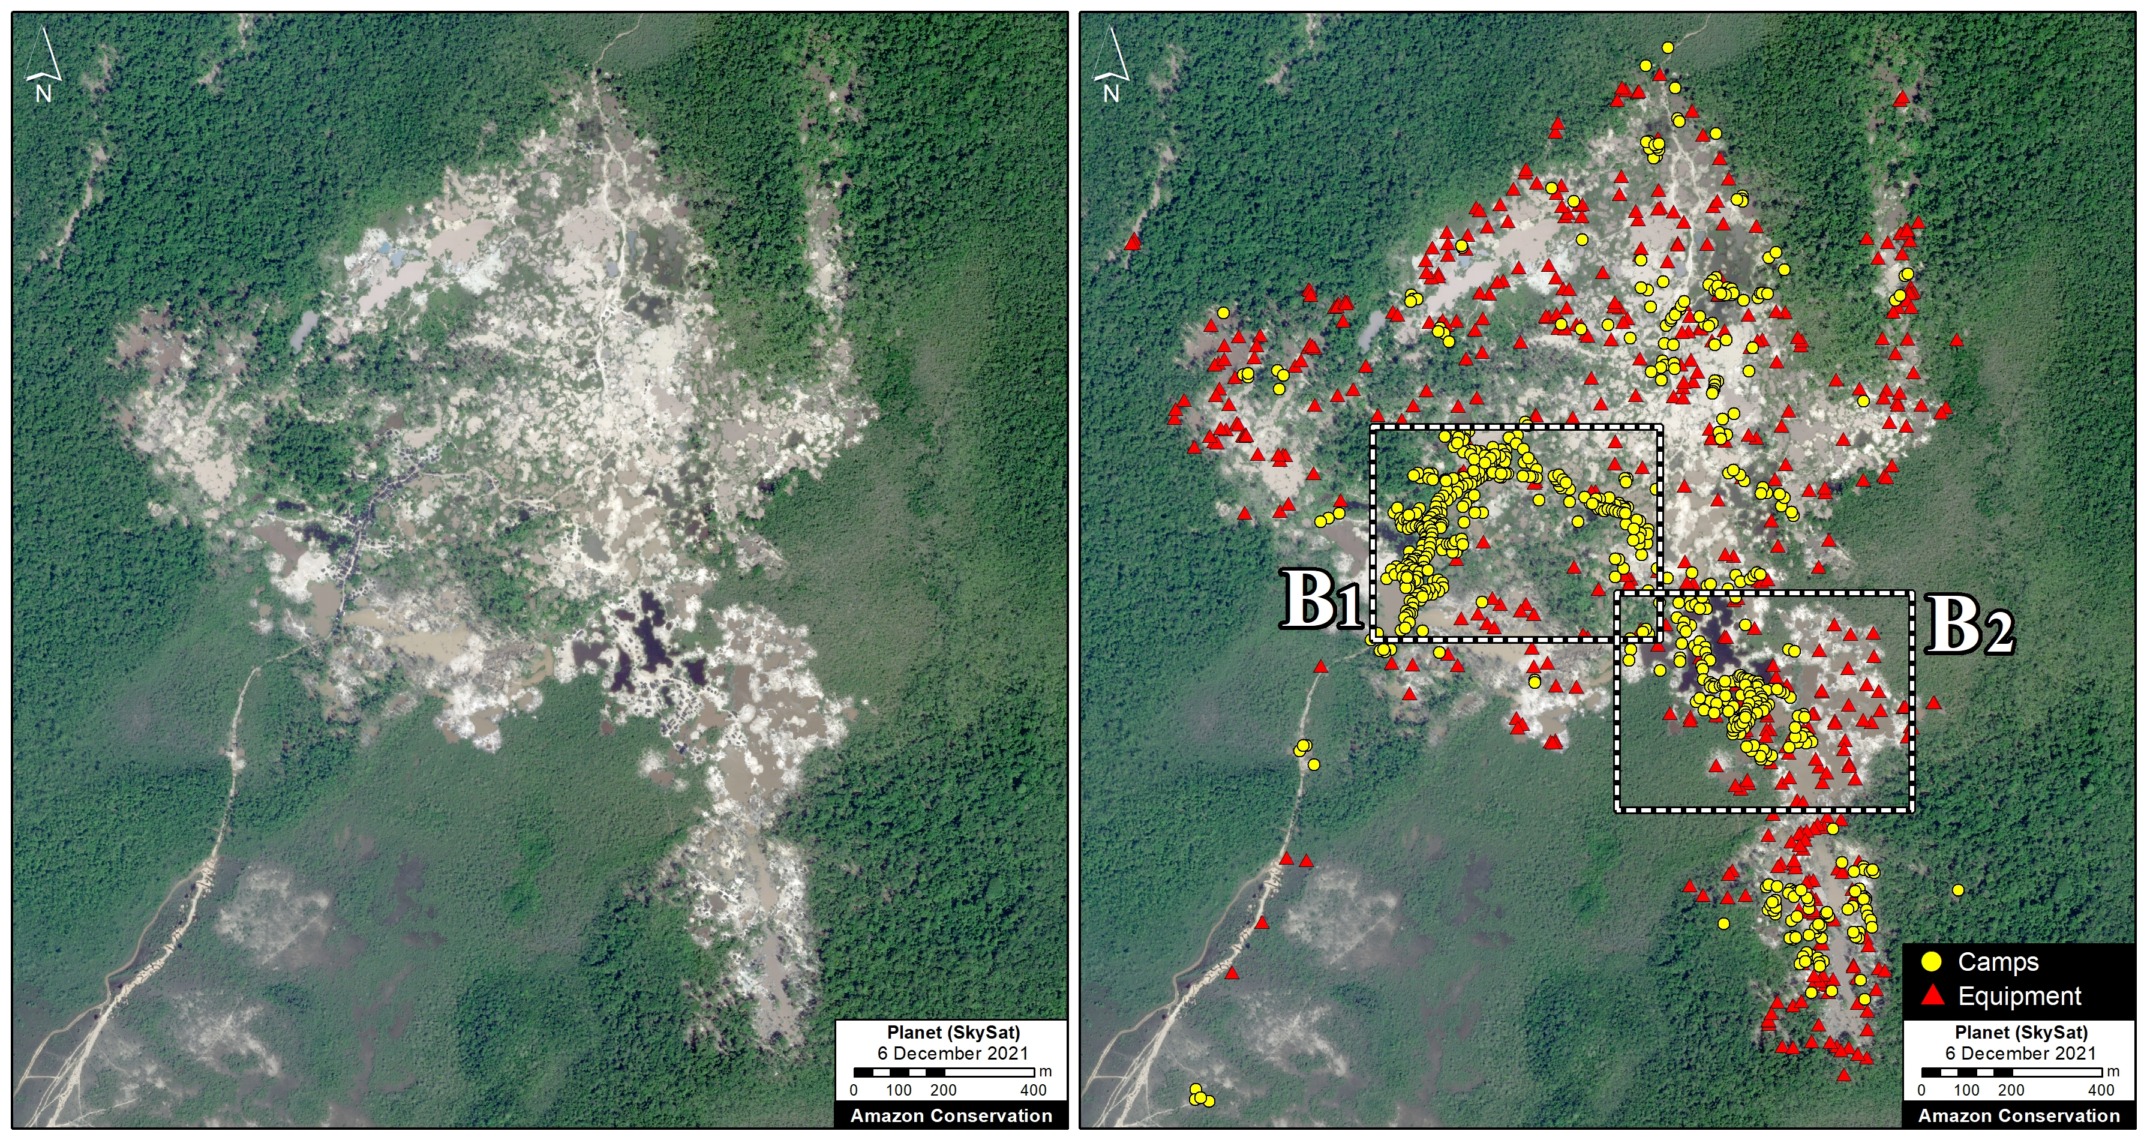
Zoom B centers on a major mining area in the Cerro Yapacana sector that experienced the deforestation of 175 hectares since the early 2000s, including a spike starting in 2014. It shows a very high-resolution Skysat image from early December 2021, with and without the mining data (left and right panel, respectively). Note how the second image brings out previously “invisible” elements within the overall mining area: 1,175 mining data points (667 camps and 508 equipment). Again, note how the second image brings out previously “invisible” elements within the overall mining area. Zooms B1 and B2 further illustrate this point.
Zoom B. Mining activity in the Cerro Yapacana southern sector without (left panel) and with (right panel) the mining data. Data: ACA/MAAP, Planet (Skysat).
Zoom B1. Mining activity in the Cerro Yapacana southern sector without (left panel) and with (right panel) the mining data. Data: ACA/MAAP, Planet (Skysat).
Zoom B2. Mining activity in the Cerro Yapacana southern sector without (left panel) and with (right panel) the mining data. Data: ACA/MAAP, Planet (Skysat).

Zoom C: Cerro Moyo

Lastly, Zoom C centers on a major mining area in the Cerro Moyo sector that experienced the deforestation of 240 hectares since the early 2000s, including a spike starting in 2011. It shows a very high-resolution Skysat image from March 2022, with and without the mining data (left and right panel, respectively). Again, note how the second image brings out previously “invisible” elements within the overall mining area: 579 data points (55 camps and 524 equipment). Zoom C1 further illustrates this point.

Zoom C. Mining activity in the Cerro Moyo sector without (left panel) and with (right panel) the mining data. Data: ACA/MAAP, Planet (Skysat).
Zoom C1. Mining activity in the Cerro Moyo sector without (left panel) and with (right panel) the mining data. Data: ACA/MAAP, Planet (Skysat).

Methodology

We tasked very high-resolution Skysat satellite imagery (0.5 meters), using the host company Planet’s tasking dashboard, of known mining locations in Yapacana National Park. We then closely and manually analyzed these images, documenting both mining camps and equipment. We researched aerial examples of mining areas in other countries to improve our identification abilities.

As a guide to locate key mining zones in these areas, we used mining area data produced by the organization SOS Orinoco, which used manual visual interpretation methods to identify these areas.

References

BirdLife International. Yapacana National Park (Parque Nacional Yapacana IBA). http://datazone.birdlife.org/site/factsheet/14941

Castillo R. y V. Salas. 2007. Estado de Conservación del Parque Nacional Yapacana. Reporte Especial. En: BioParques: Programa Observadores de Parques

SOS Orinoco. 2019. La Minería Aurífera en el Parque Nacional Yapacana Amazonas Venezolano: Un caso de extrema urgencia ambiental y geopolítica, nacional e internacional.

SOS Orinoco. 2020. La Minería Aurífera en el Parque Nacional Yapacana, Amazonas Venezolano | Un caso de extrema urgencia ambiental y geopolítica, nacional e internacional – Actualización al 2020.

Acknowledgements

We thank the organization SOSOrinoco for important information and comments related to this report.

Citation

Finer M, Mamani N (2022) Intense Mining Activity in Yapacana National Park (Venezuelan Amazon). MAAP: 156.

MAAP #158: Amazon Deforestation & Fire Hotspots 2021

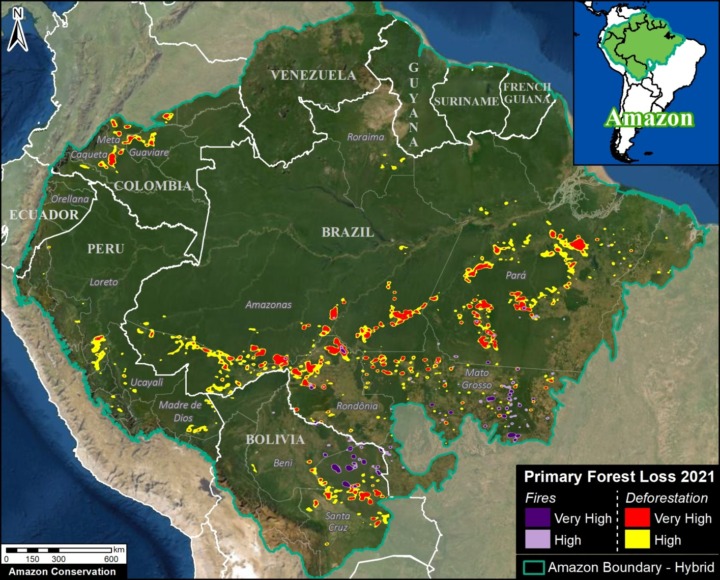
2021 Amazon Forest Loss Base Map. Deforestation and fire hotspots across the full Amazon biome. Data: UMD/GLAD, ACA/MAAP.

We present a detailed look at the major 2021 Amazon forest loss hotspots, based on the final annual data produced by the University of Maryland.

This dataset is unique in that distinguishes forest loss from fire, leaving the rest as a close proxy for deforestation.

Thus, for the first time, the results include both deforestation and fire hotspots across the Amazon.

The Base Map (see right) and Results Graph (see below) reveal several key findings:p

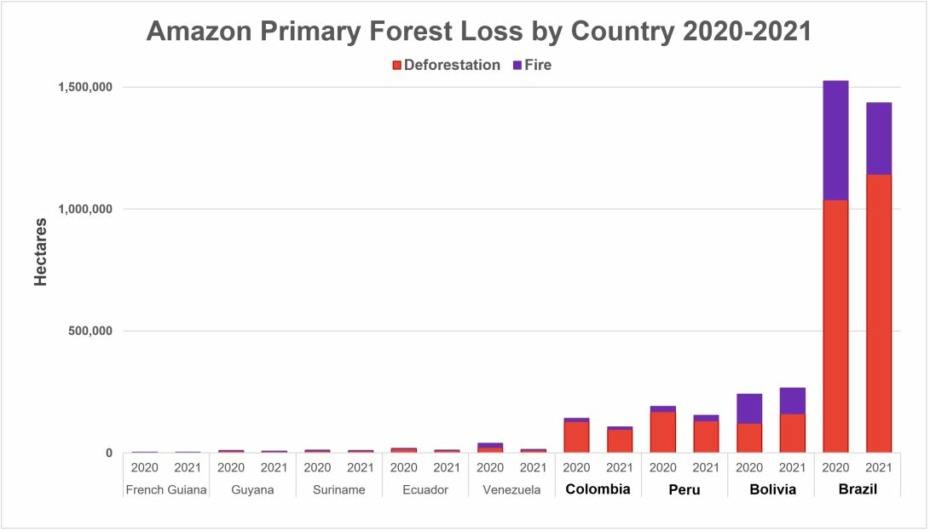
  • In 2021, we estimate the loss of 2 million hectares (4.9 million acres) of primary forest loss across the nine countries of the Amazon biome. This total represents a slight decrease from 2020, but the 6th highest on record.
    l
  • The vast majority of this loss was deforestation (78%), accounting for 1.57 million hectares. This total represents a slight increase from 2020, and the 5th highest on record. This deforestation impacted the entire stretch of the southern Amazon (southern Brazil, Bolivia, and Peru) plus further north in Colombia.
    l
  • This deforestation was concentrated in Brazil (73%), Bolivia (10%), Peru (8%), and Colombia (6%). In Brazil and Bolivia, deforestation was the highest since 2017. In Peru and Colombia, deforestation dropped from 2020 but was still historically high. See below for maps and graphs for each country. See Annex for 2020-21 details.
    k
  • Fires directly caused the remaining primary forest loss (22%), accounting for 436,000 hectares. This total represents a decrease from the severe fire season of 2020, but was the 4th highest on record. Moreover, each of the six most intense fire seasons has occurred in the past six years. Over 90% of the fire impact occurred in just two countries: Brazil and Bolivia. Note that fire impacts were concentrated in the southeast of each country (Mato Grosso and Santa Cruz states, respectively).
    k
  • Since 2002, we estimate the deforestation of over 27 million hectares (67 million acres) of primary forest, greater than the size of the United Kingdom or the U.S. state of Colorado. On top of this, we estimate an additional impact of 6.7 million hectares due to fires.

Below, we zoom in on the four countries with the highest deforestation (Brazil, Bolivia, Peru, and Colombia), with additional maps and analysis.

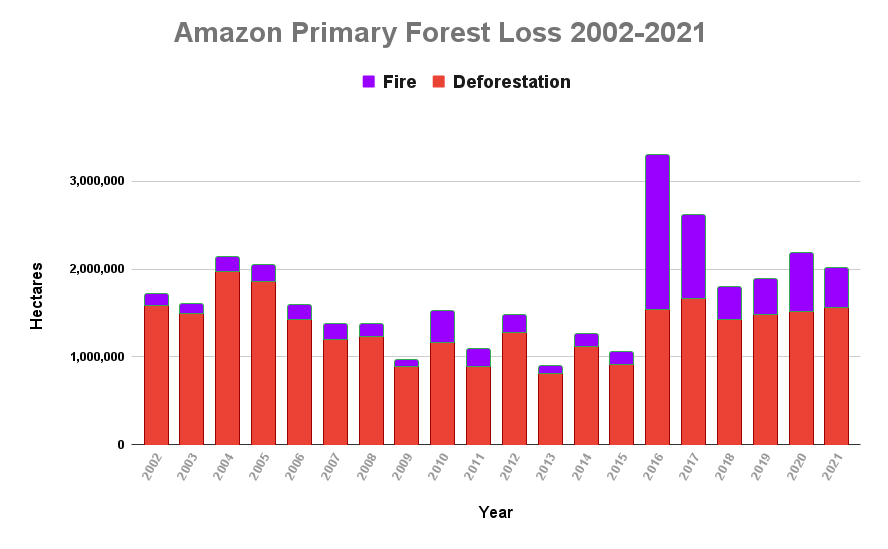
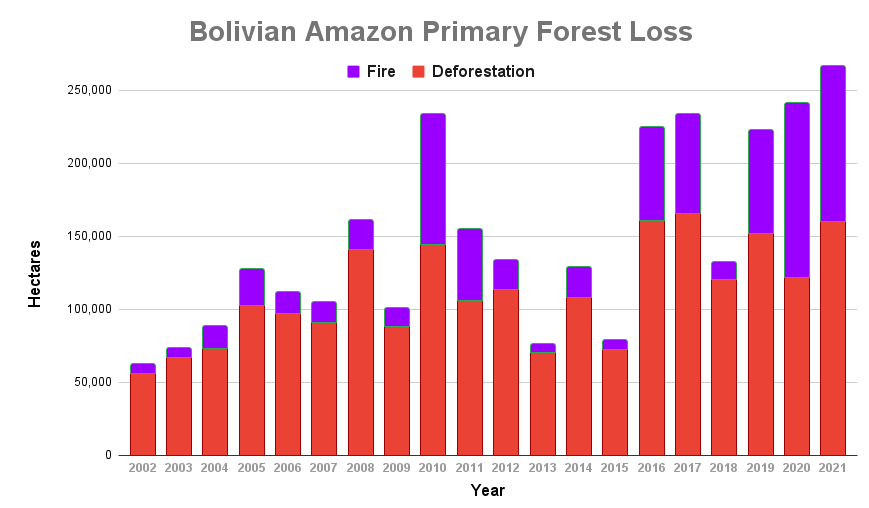
Amazon Forest Loss Results Graph, 2002-21. Data: UMD/GLAD, ACA/MAAP.

For deforestation, note that in 2021 there was a slight increase across the Amazon, continuing a gradual four-year trend. 2021 had the 5th highest deforestation on record (behind just 2002, 2004, 2005, and 2017).

For fire, in 2021 there was a decrease from the severe fire season of 2020, but was the 4th highest on record (behind just 2016, 2017, and 2020). Moreover, each of the last six years is in the top six worst fire seasons across the Amazon.

For total forest loss (deforestation and fire combined), in 2021 there was slight decrease from 2020, but the 6th highest on record.

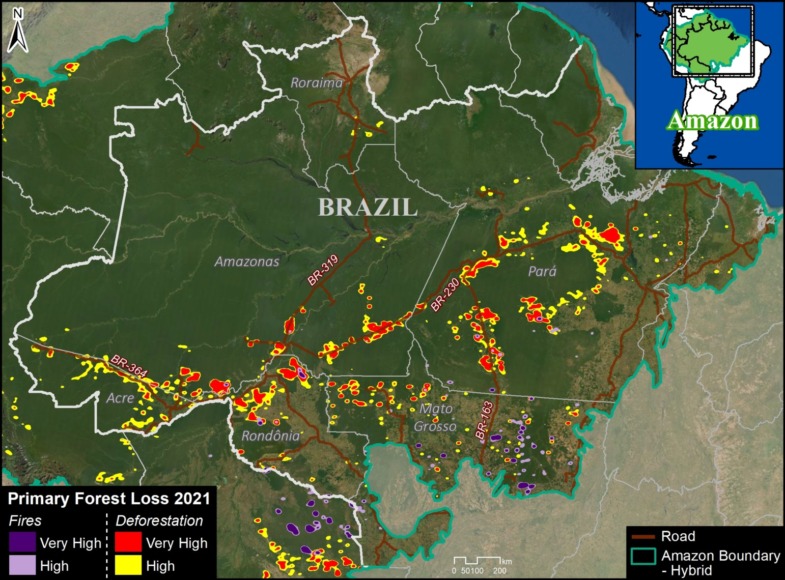
Brazil Base Map, 2021. Deforestation and fire hotspots in the Brazilian Amazon. Data: UMD/GLAD, ACA/MAAP.

Brazilian Amazon

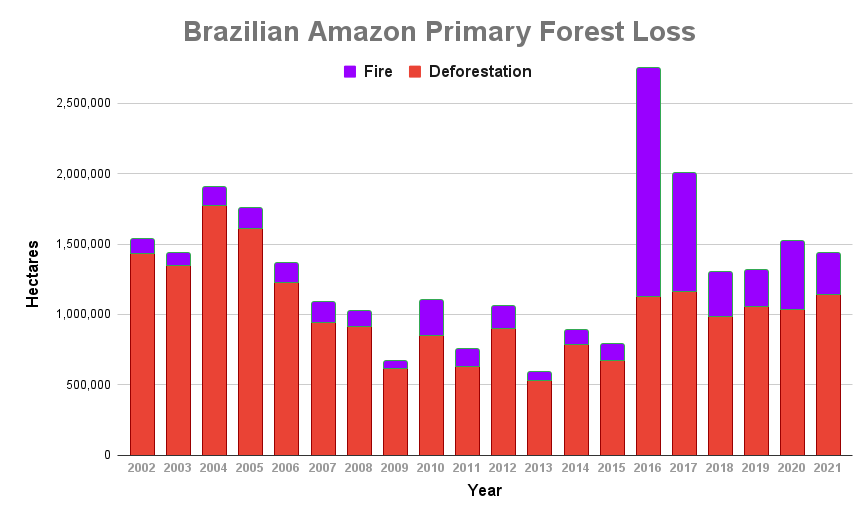
In 2021, the Brazilian Amazon lost 1.1 million hectares of primary forest to deforestation. Fires directly impacted an additional 293,000 hectares.

The deforestation was the highest since 2017 and also the peak of the early 2000s (6th highest on record). The fire impact was relatively high (5th highest on record), but less than the peak years of 2016, 2017, and 2020.

The deforestation was concentrated along the major road networks, especially roads 163, 230, 319, and 364 in the states of Acre, Amazonas, Pará, and Rondônia (see Brazil Base Map).

The direct fire impacts were concentrated in the southeastern state of Mato Grosso.

It is also important to note that many areas experienced the one-two combination of initial deforestation followed by fire to prepare the area for agriculture or cattle.


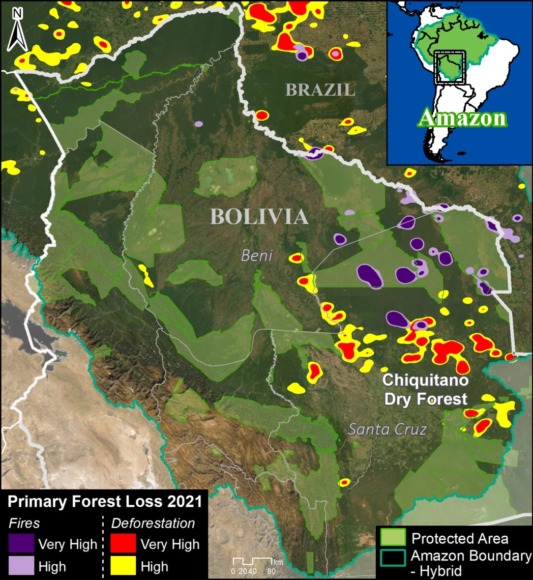
Bolivia Base Map. Deforestation hotspots in Bolivian Amazon. Data: UMD/GLAD, ACA/MAAP.

Bolivian Amazon

In 2021, the Bolivian Amazon lost 161,000 hectares of primary forest to deforestation. Fires directly impacted an additional 106,000 hectares.

Deforestation was the third-highest on record, just behind the peak in 2016 and 2017. The fire impact was the second-highest on record, behind just the intense year of 2020 (thus, the last two years are the two highest on record).

Both the deforestation and fires were concentrated in the southeastern department of Santa Cruz (see Bolivia Base Map).

Much of the deforestation was associated with large-scale agriculture, while the fires once again impacted important natural ecosystems, most notably the Chiquitano dry forests.


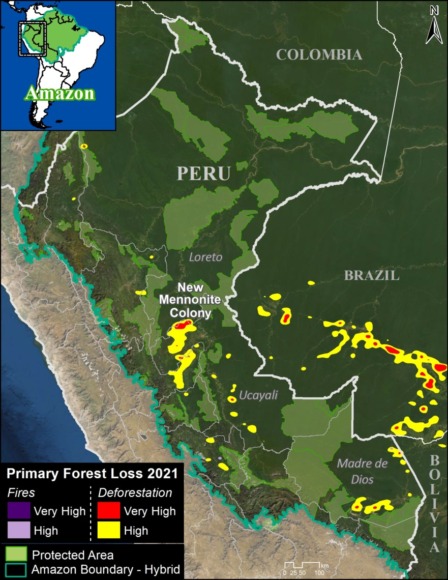
Peru Base Map. Deforestation hotspots in the Peruvian Amazon. Data: UMD/GLAD, ACA/MAAP.

Peruvian Amazon

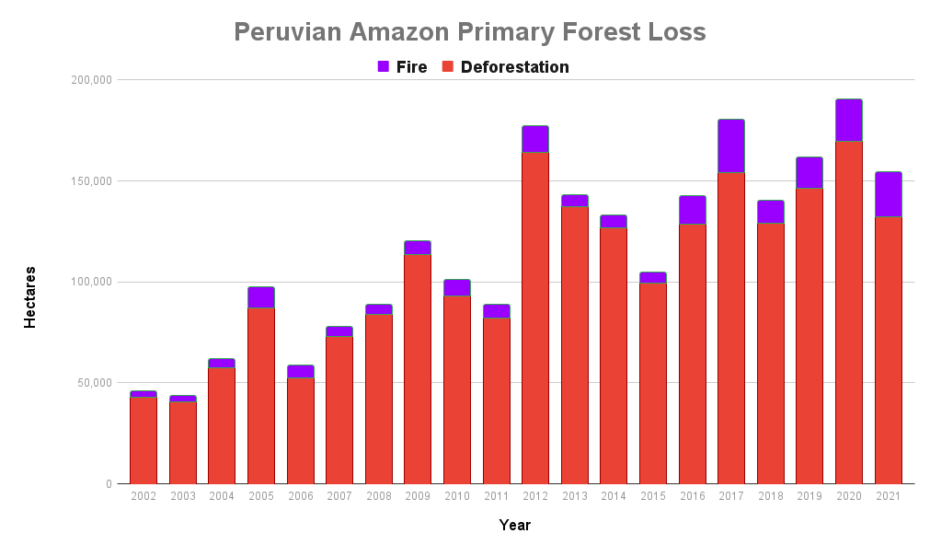
In 2021, the Peruvian Amazon lost 132,400 hectares of primary forest to deforestation. Fires directly impacted an additional 21,800 hectares.

Deforestation dropped from a record high in 2020, but was 6th highest on record. Thre fire impact was the second-highest on record (behind just 2017).

The deforestation was concentrated in the central and southern Amazon (Ucayali and Madre de Dios regions, respectively) (see Peru Base Map).

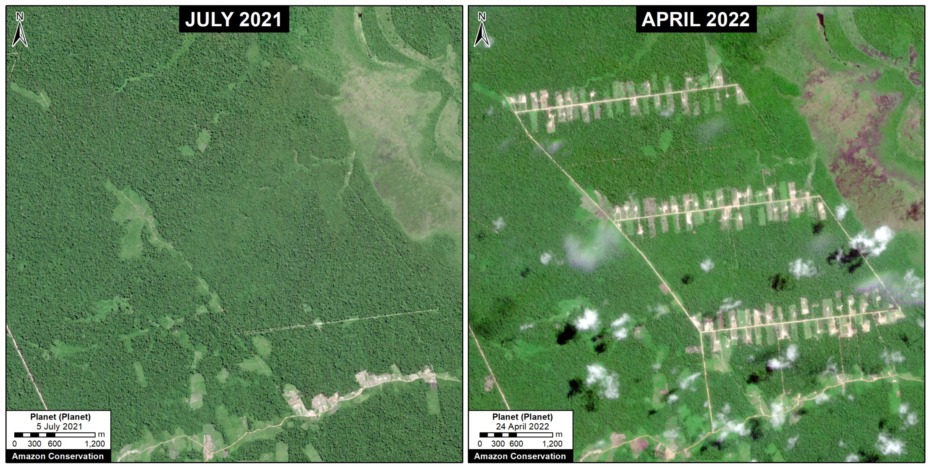
We highlight the rapid deforestation (365 hectares) for a new Mennonite colony in 2021, near the town of Padre Marquez (see MAAP #149).

Also, note some additional hotspots in the south (Madre de Dios region), but these are largely from expanding agriculture instead of the historical driver of gold mining.

Indeed, gold mining deforestation has been greatly reduced due to government actions, but this illegal activity still threatens several key areas and indigenous territories (MAAP #154).


Rapid deforestation (365 hectares) for a new Mennonite colony in 2021, near the town of Padre Marquez. Data: Planet.

Colombia Base Map. Deforestation hotspots in northwest Colombian Amazon. Data: UMD/GLAD, ACA/MAAP, FCDS.

Colombian Amazon

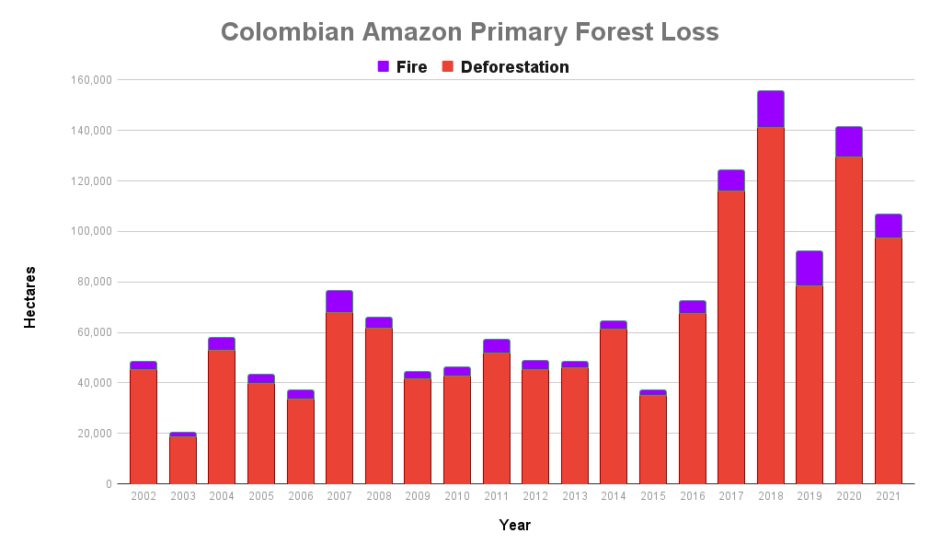
In 2021, the Colombian Amazon lost 98,000 hectares of primary forest to deforestation. Fires directly impacted an additional 9,000 hectares.

Deforestation and fire dropped from last year, but both were the fourth highest on record, following the trend of elevated forest loss and associated fires since the peace agreement in 2016.

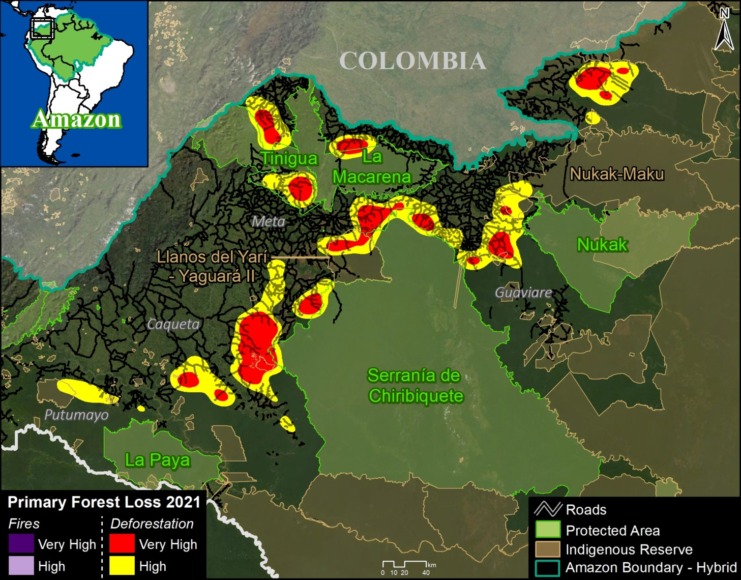
As described in previous reports (see MAAP #120), the Colombia Base Map shows there continues to be an “arc of deforestation” in the northwest Colombian Amazon (Caqueta, Meta, and Guaviare departments).

This arc impacts numerous Protected Areas (particularly Tinigua and Chiribiquete National Parks) and Indigenous Reserves (particularly Yari-Yaguara II and Nukak Maku).

The main drivers of deforestation in the Colombian Amazon are land grabbing, expansion of road networks, and cattle ranching.


Annex

Notes and Methodology

The analysis was based on 30-meter resolution annual forest loss data produced by the University of Maryland and also presented by Global Forest Watch. For the first time, this data set distinguished forest loss caused directly by fire (note that virtually all Amazon fires are human-caused). The remaining forest loss serves as a likely close proxy for deforestation, with the only remaining exception being natural events such as landslides, wind storms, and meandering rivers.

Importantly, we applied a filter to calculate only primary forest loss by intersecting the forest cover loss data with the additional dataset “primary humid tropical forests” as of 2001 (Turubanova et al 2018). For more details on this part of the methodology, see the Technical Blog from Global Forest Watch (Goldman and Weisse 2019).

Our geographic range for the Amazon is a hybrid designed for maximum inclusion: biogeographic boundary (as defined by RAISG) for all countries, except for Bolivia where we use the watershed boundary.

To identify the deforestation hotspots, we conducted a kernel density estimate. This type of analysis calculates the magnitude per unit area of a particular phenomenon, in this case, forest cover loss. We conducted this analysis using the Kernel Density tool from the Spatial Analyst Tool Box of ArcGIS. We used the following parameters:

Search Radius: 15000 layer units (meters)
Kernel Density Function: Quartic kernel function
Cell Size in the map: 200 x 200 meters (4 hectares)
Everything else was left to the default setting.

For the Base Map, we used the following concentration percentages: Medium: >5%; High: >7%; Very High: >14%.

Acknowledgements

We thank A. Gómez (FCDS), R. Botero (FCDS)… for helpful comments on earlier drafts of the text and images.

This work was supported by NORAD (Norwegian Agency for Development Cooperation) and ICFC (International Conservation Fund of Canada).

Citation

Finer M, Mamani N (2022) Amazon Deforestation Hotspots 2021. MAAP: 153.