MAAP #189: Amazon Fire Season Heats Up

Image 1. Example of 2023 (June 29) major fire in Brazilian Amazon.

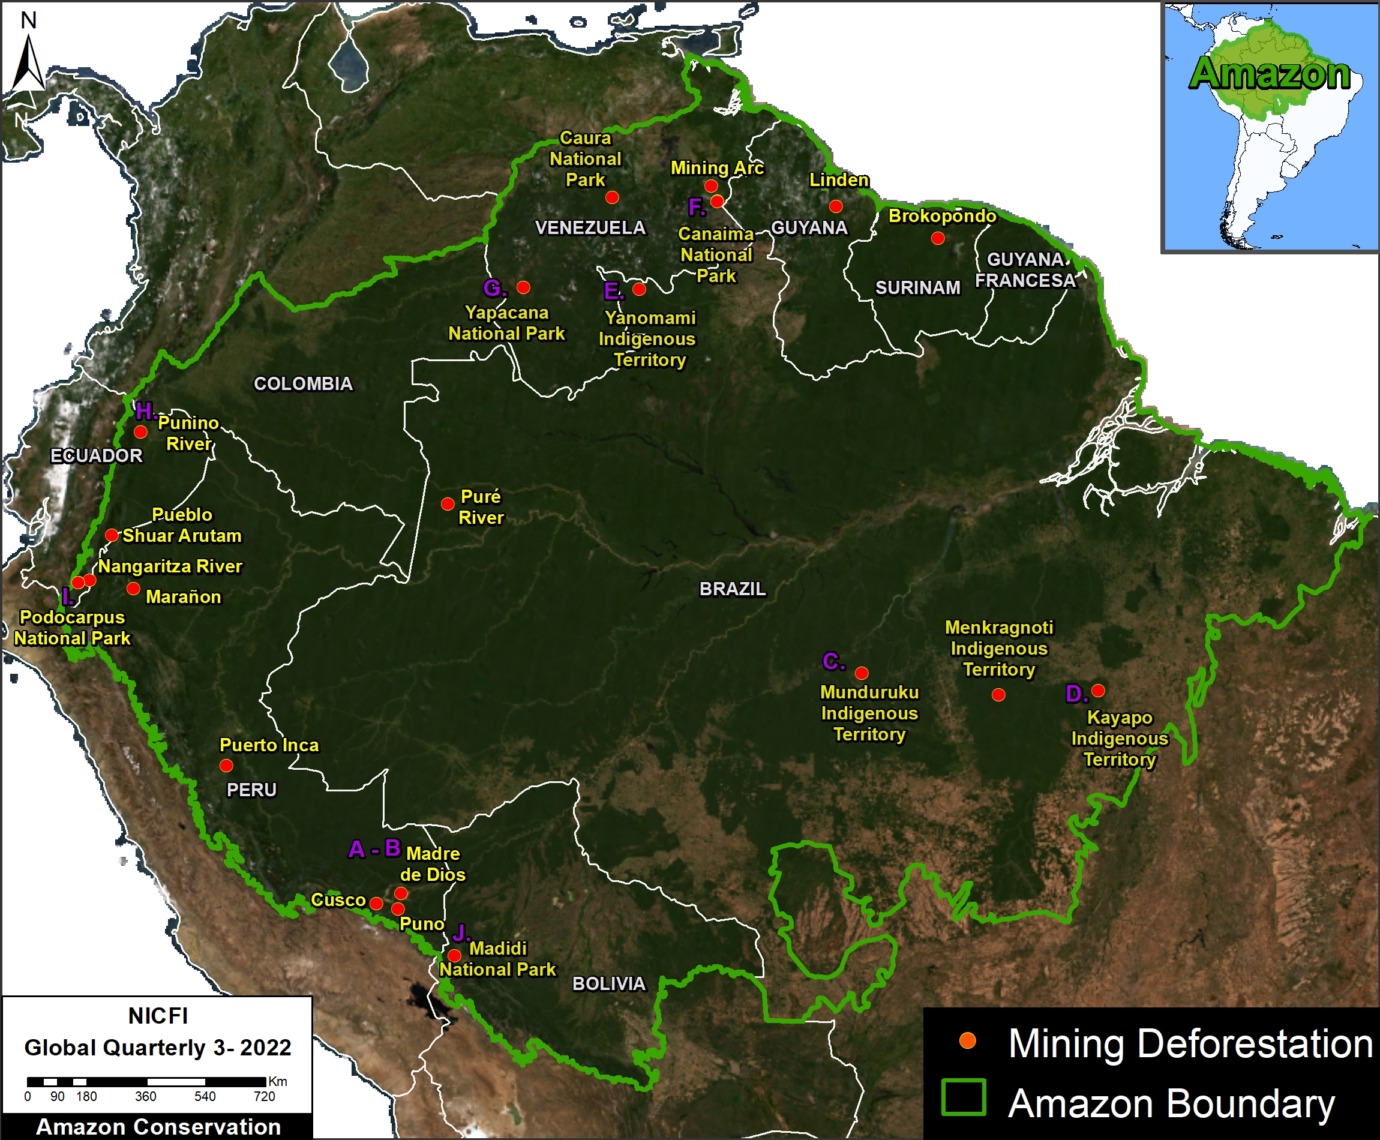
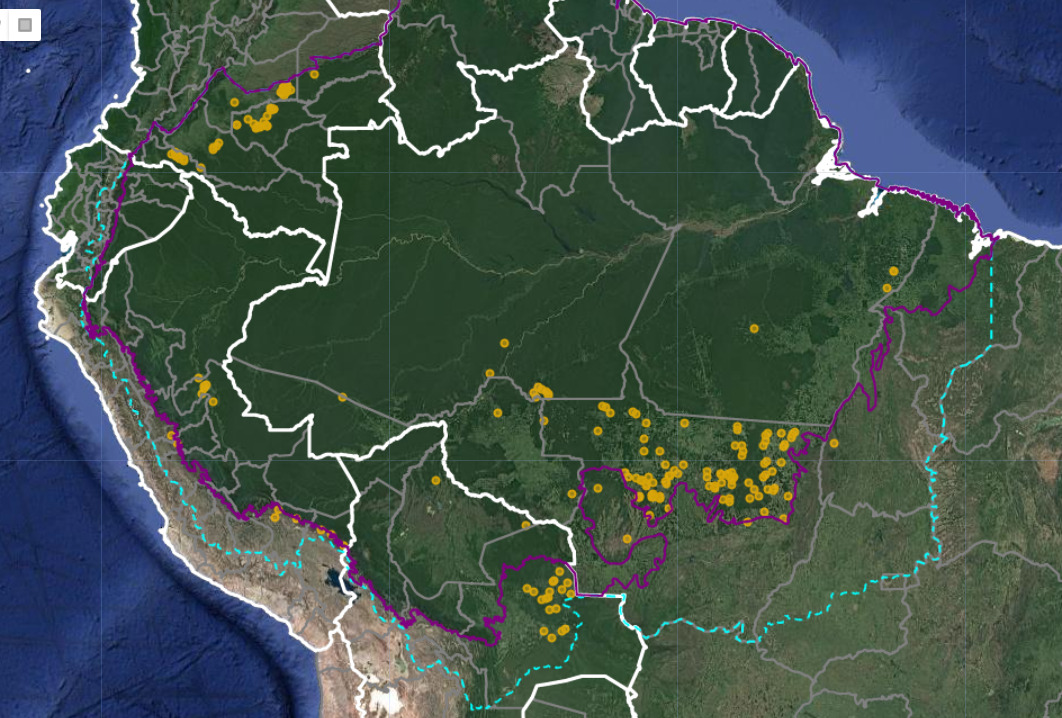
The Amazon fire season is well under way: to date, we have detected over 260 major fires thus far in 2023 (see Base Map below).

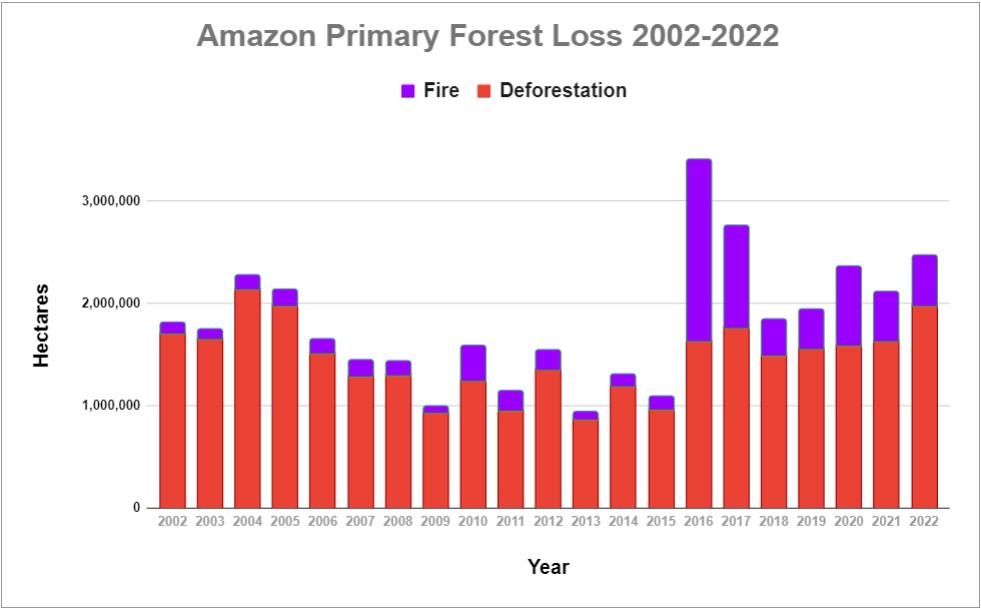
This year is of special concern because scientists indicate we have entered a new El Niño episode. The most intense Amazon fire seasons on record, 2016 and 2017, immediately followed the last major El Niño event.

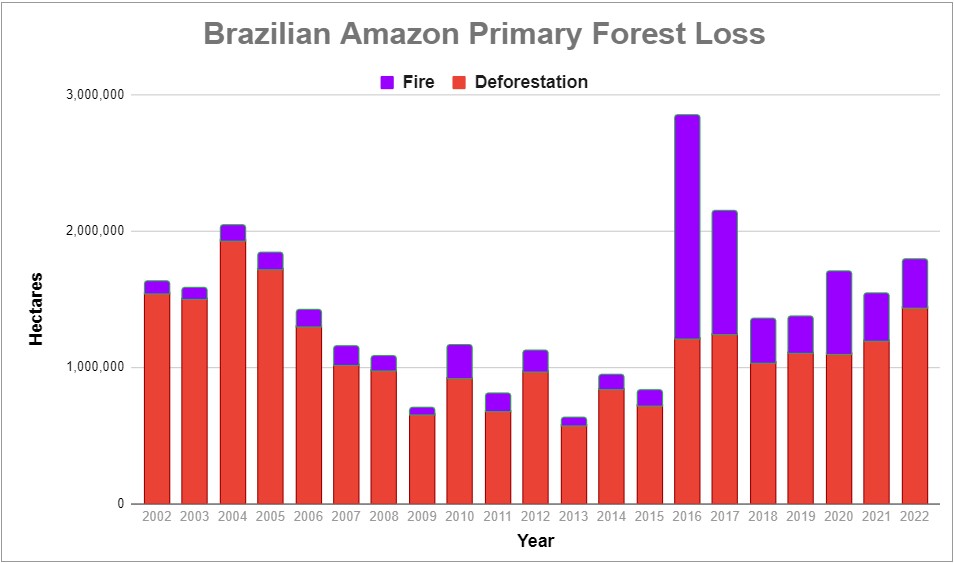
Most of the fires (54%) this year have occurred in the Brazilian Amazon.

Of these, the vast majority (73%) have burned r­­­­ecently deforested areas. This high number is consistent with previous years (see MAAP #168) and once again highlights the critical link between deforestation and fires in the Brazilian Amazon. That is, most major fires are burning the remnants of a recent deforestation event.

It is also worth noting that many of the fires in the Brazilian Amazon (42%) were burning areas recently deforested specifically for new soy plantations.

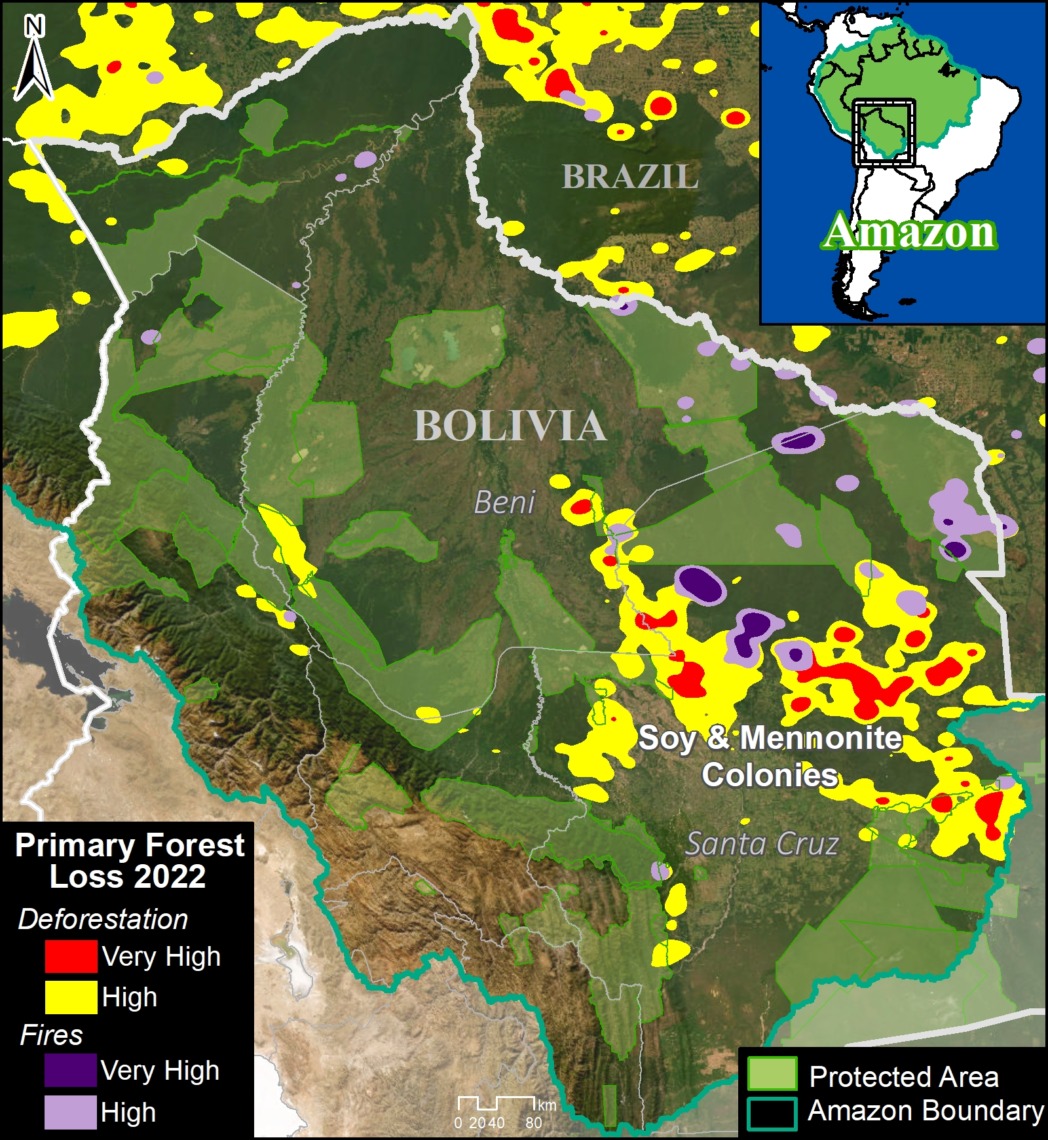
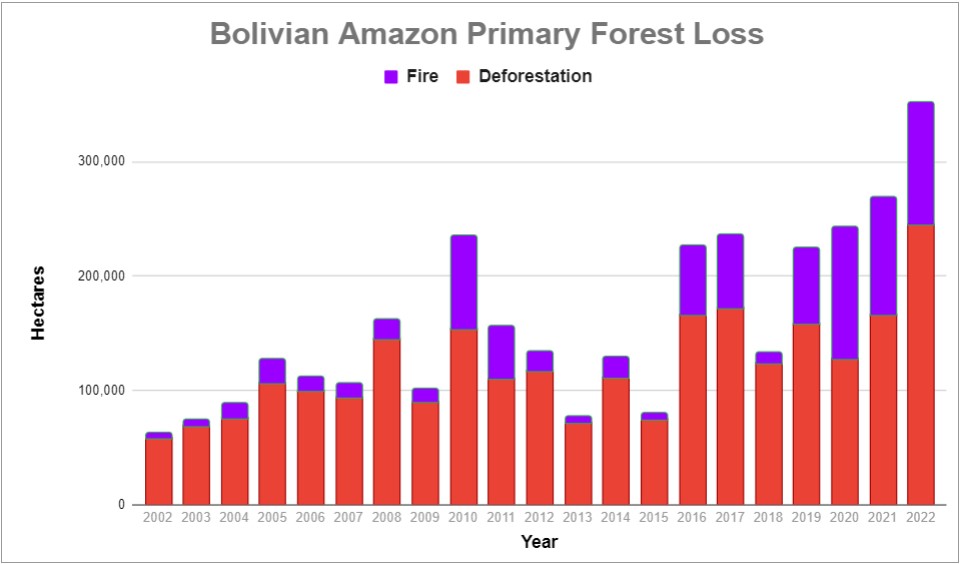
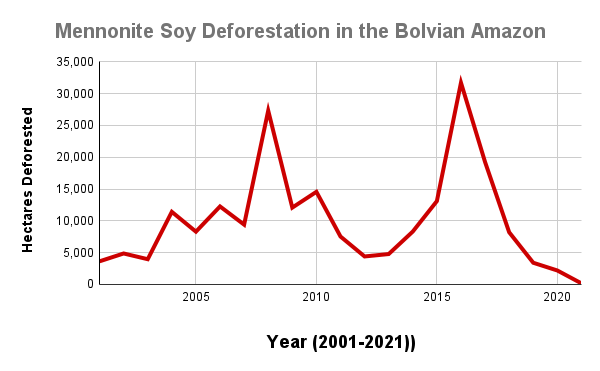
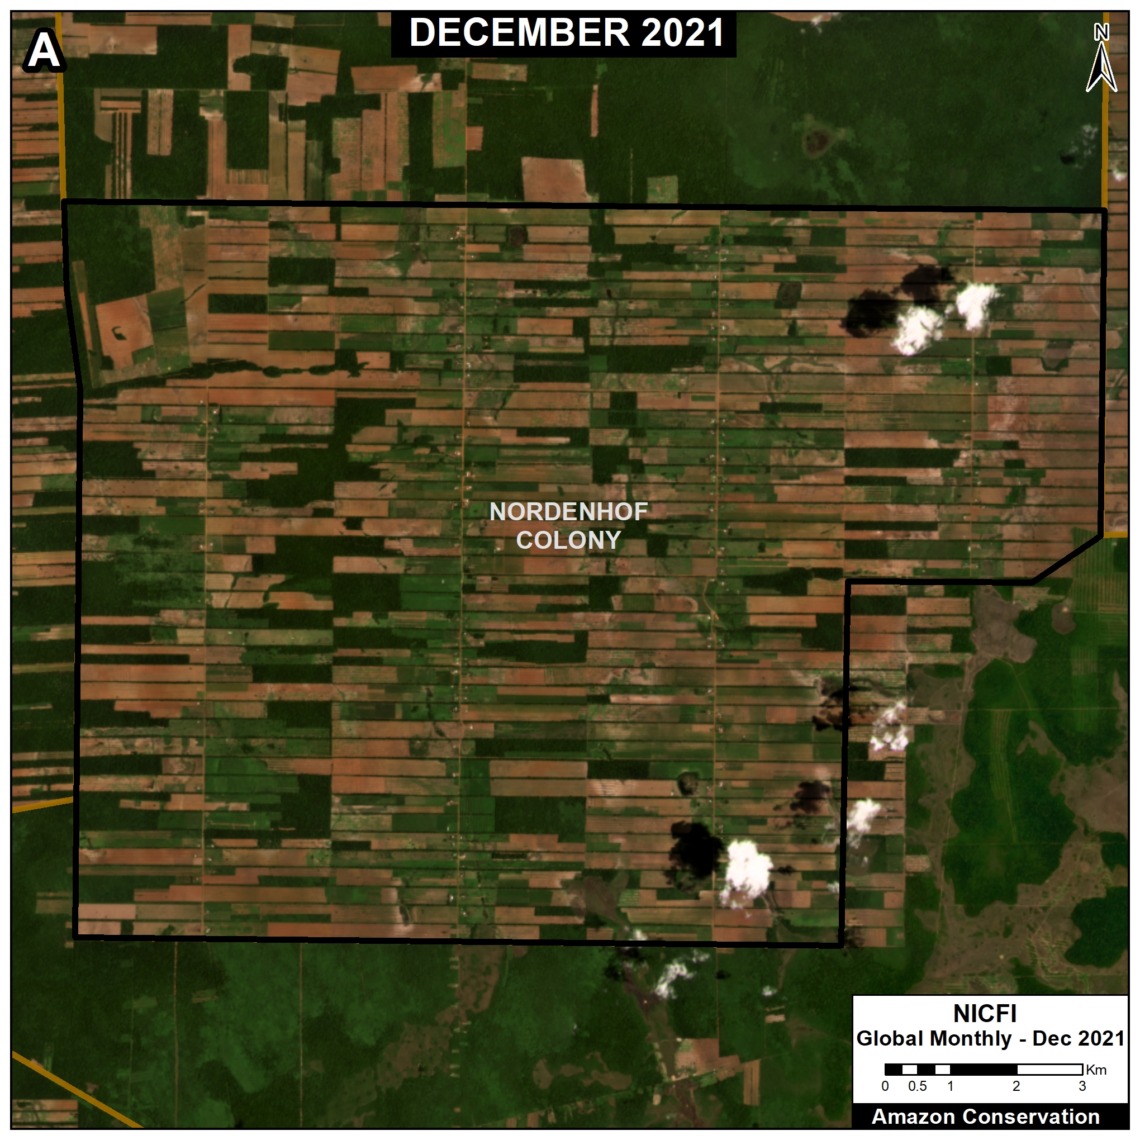
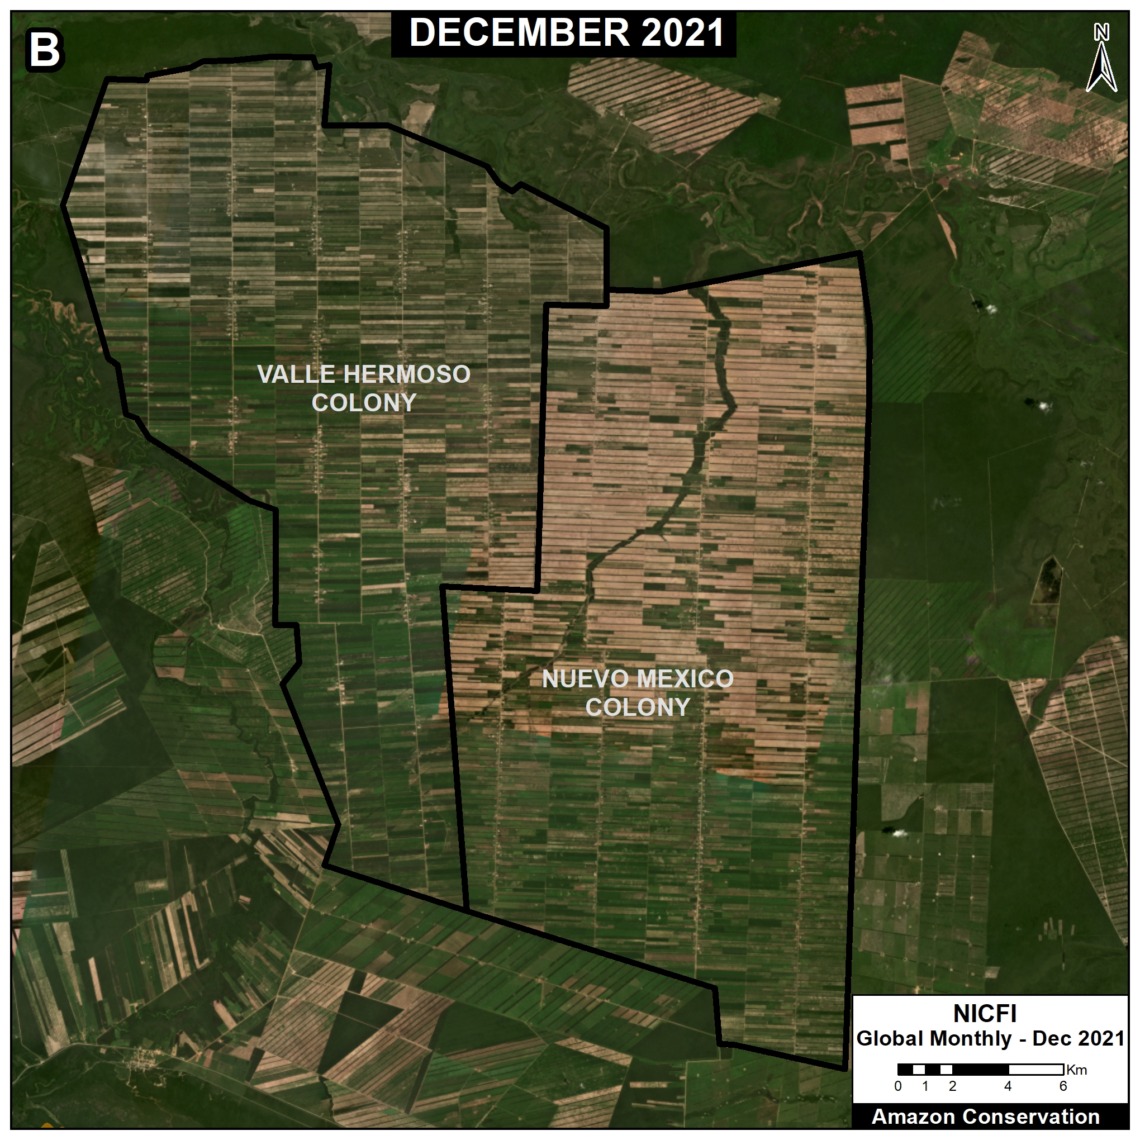
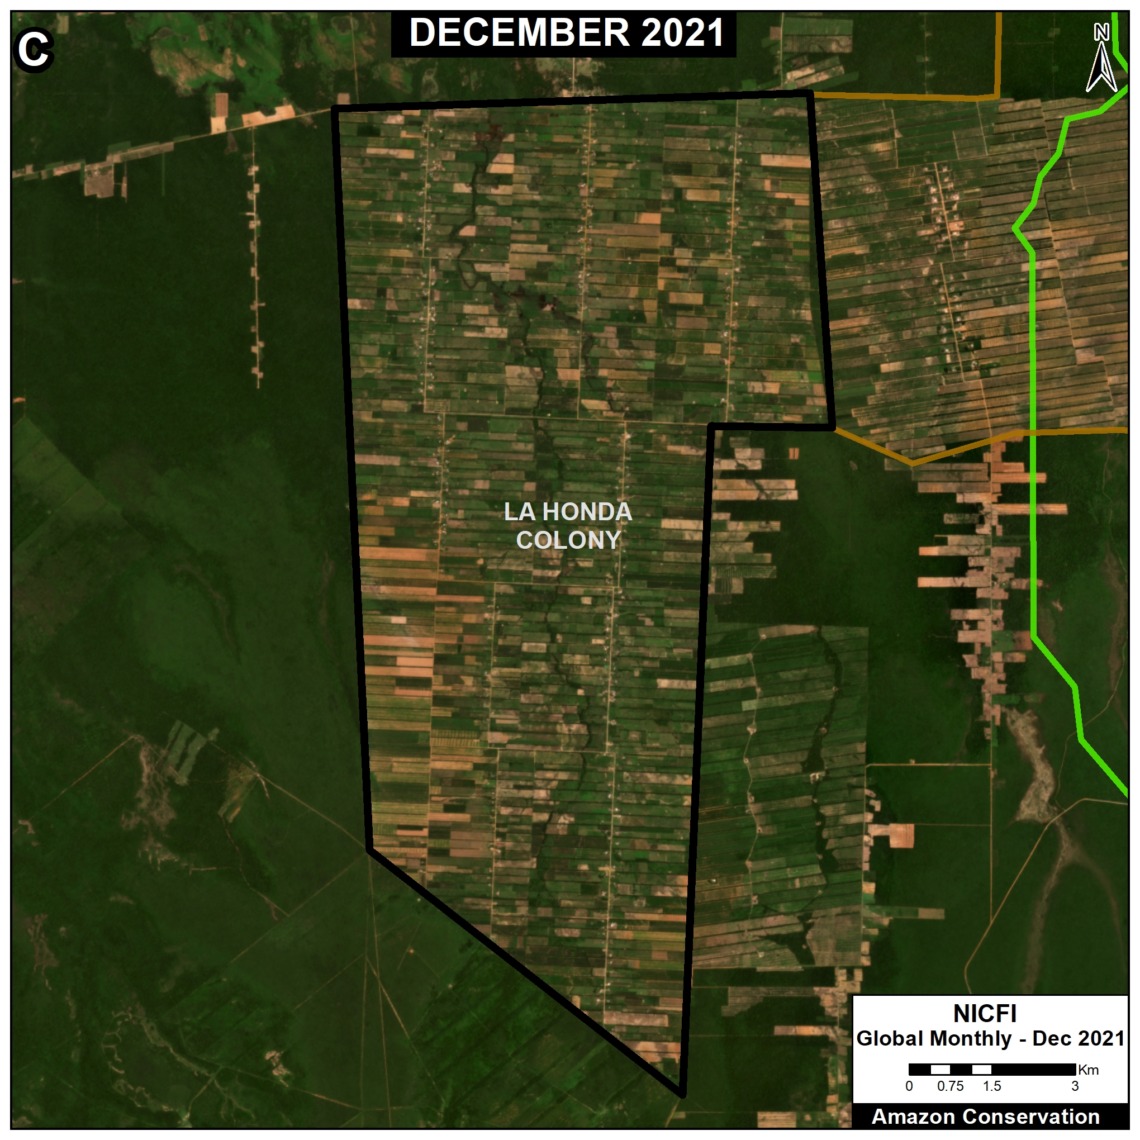
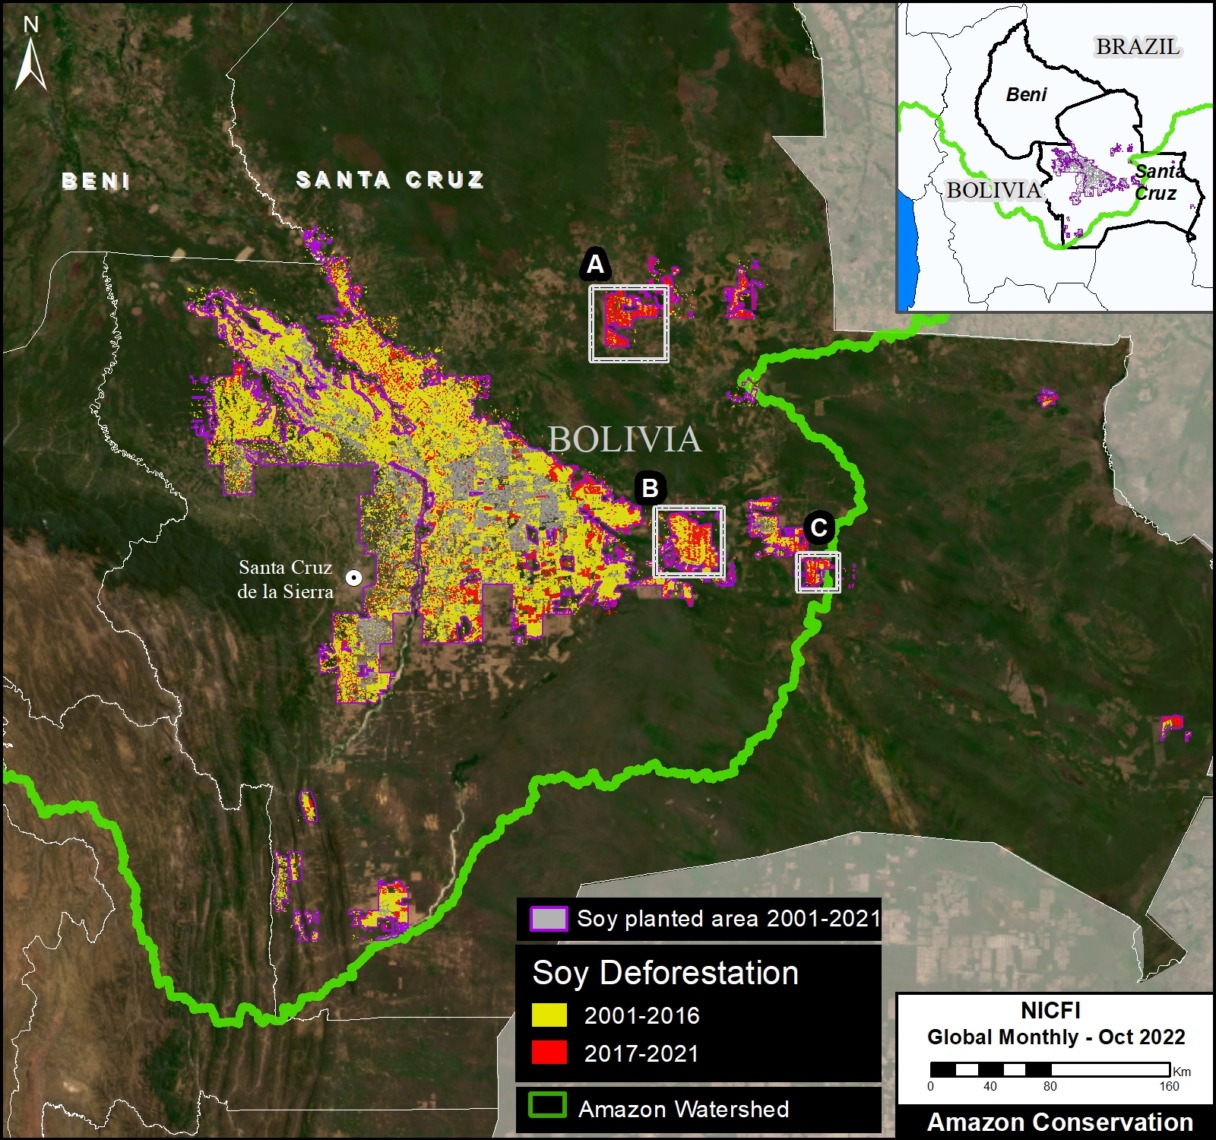
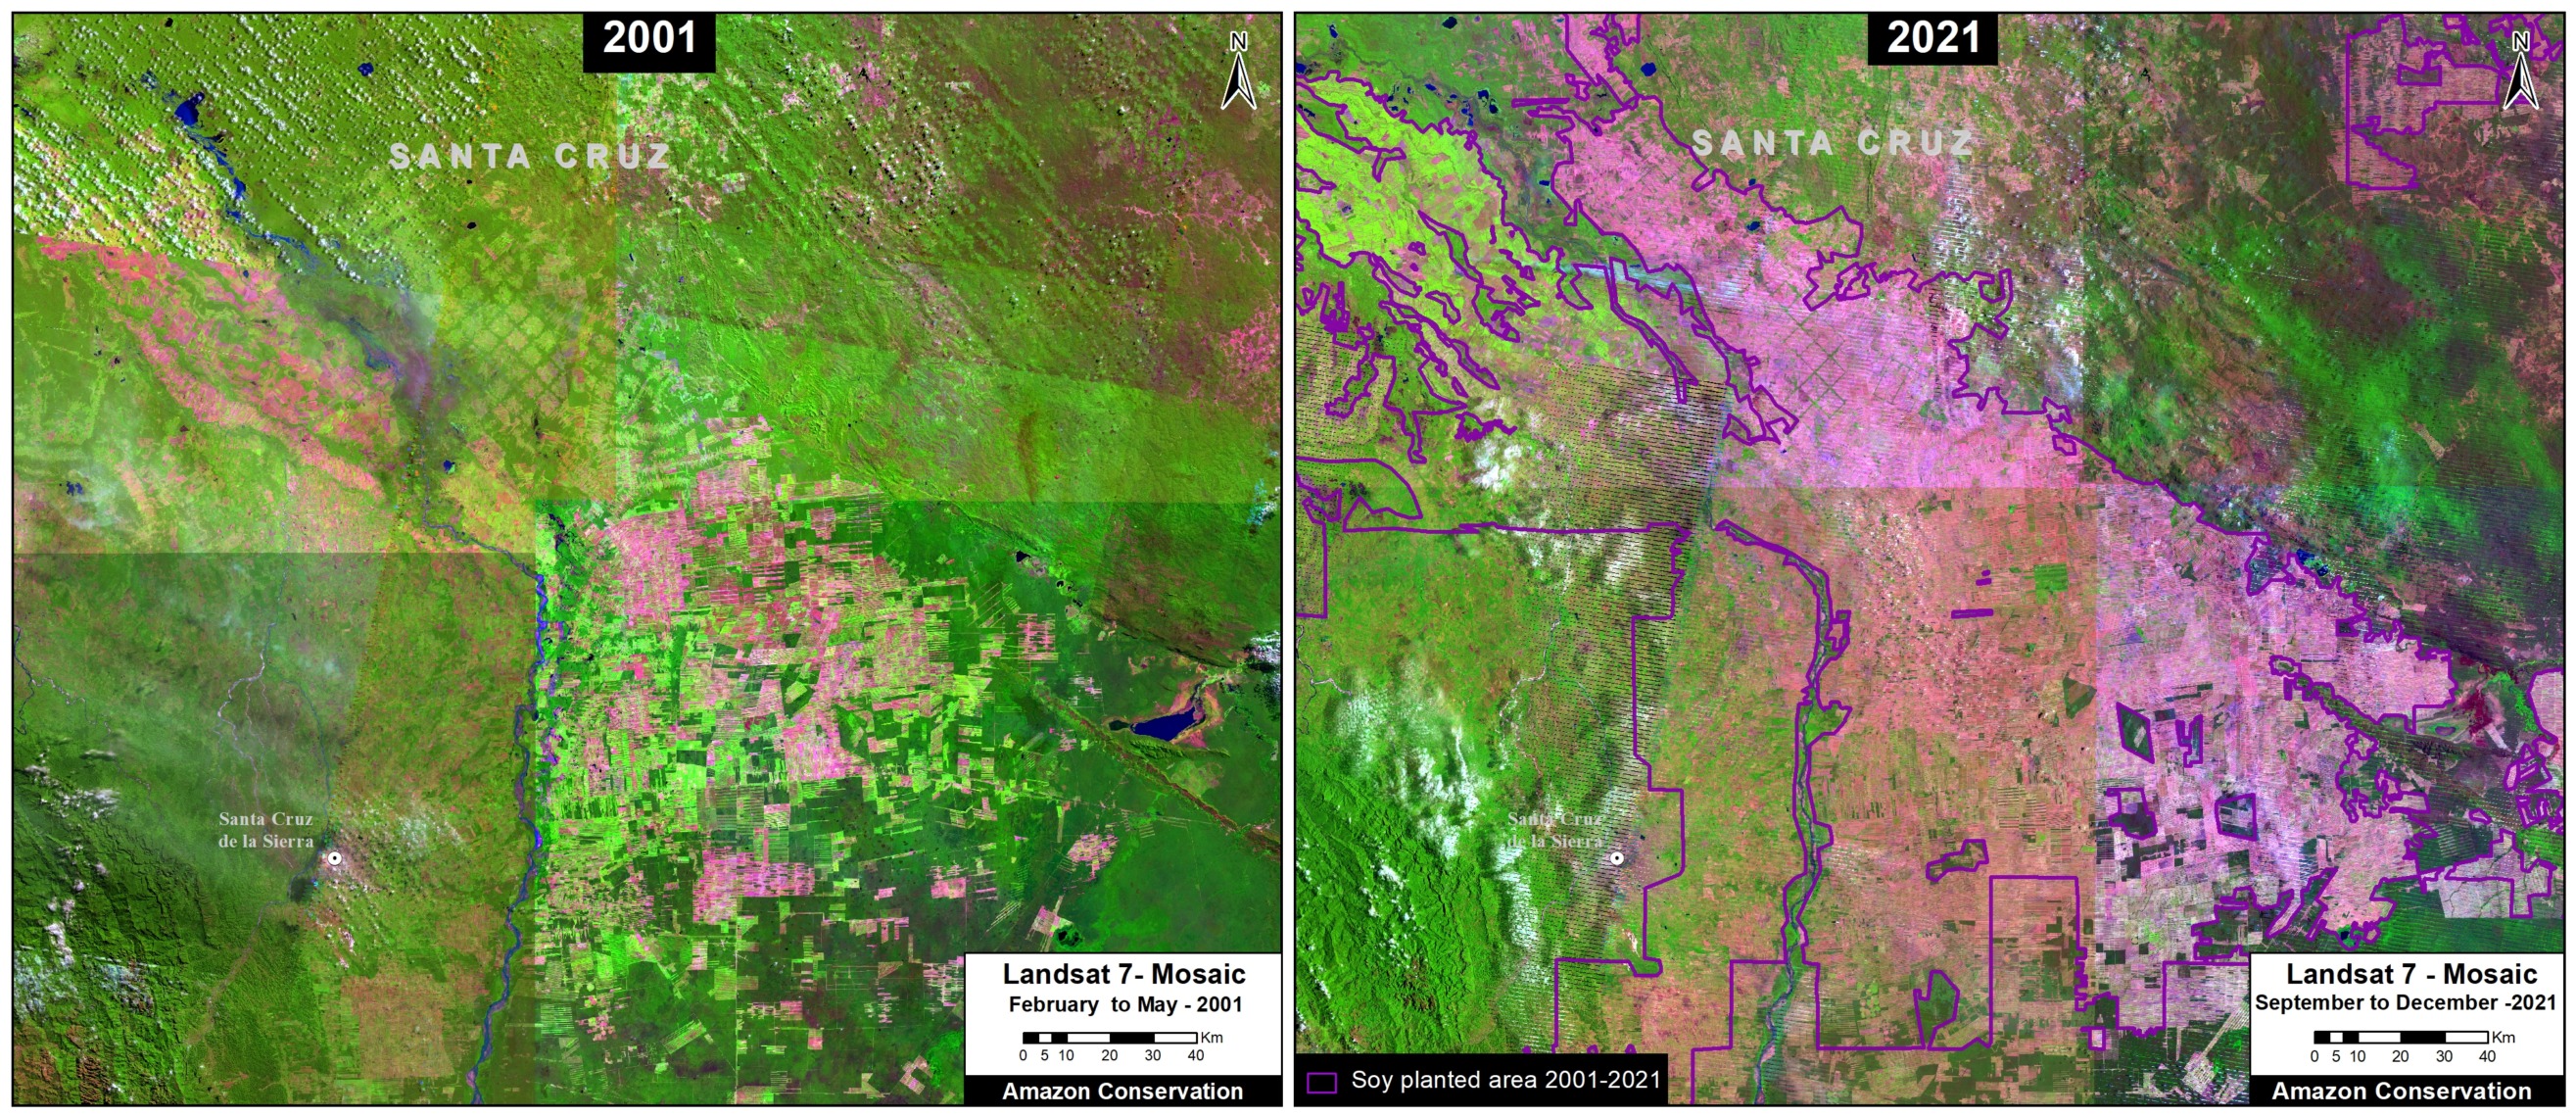
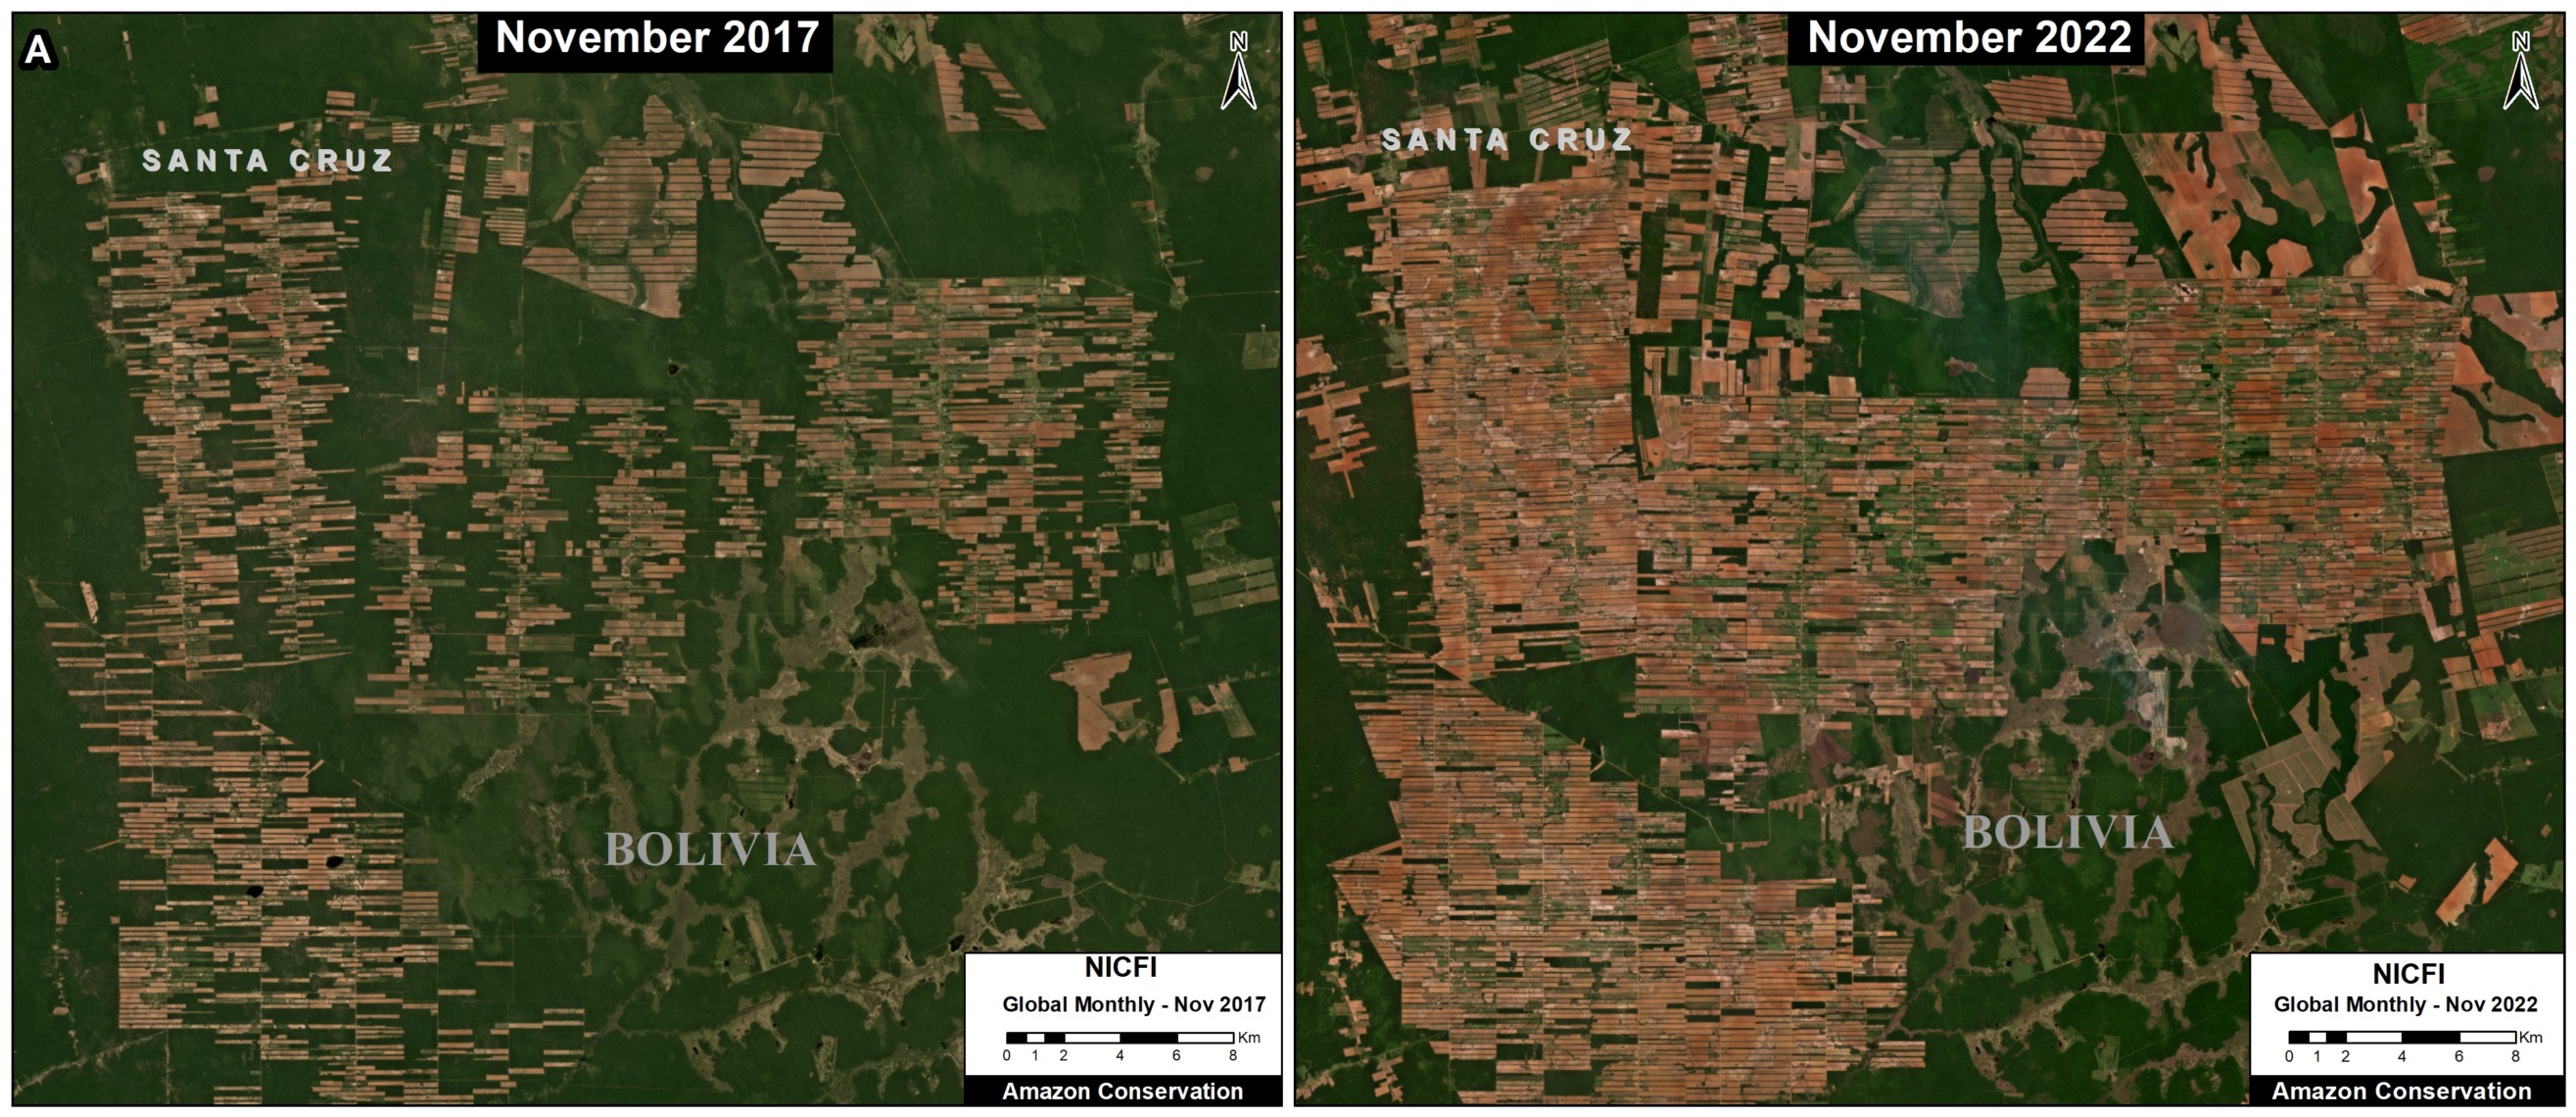
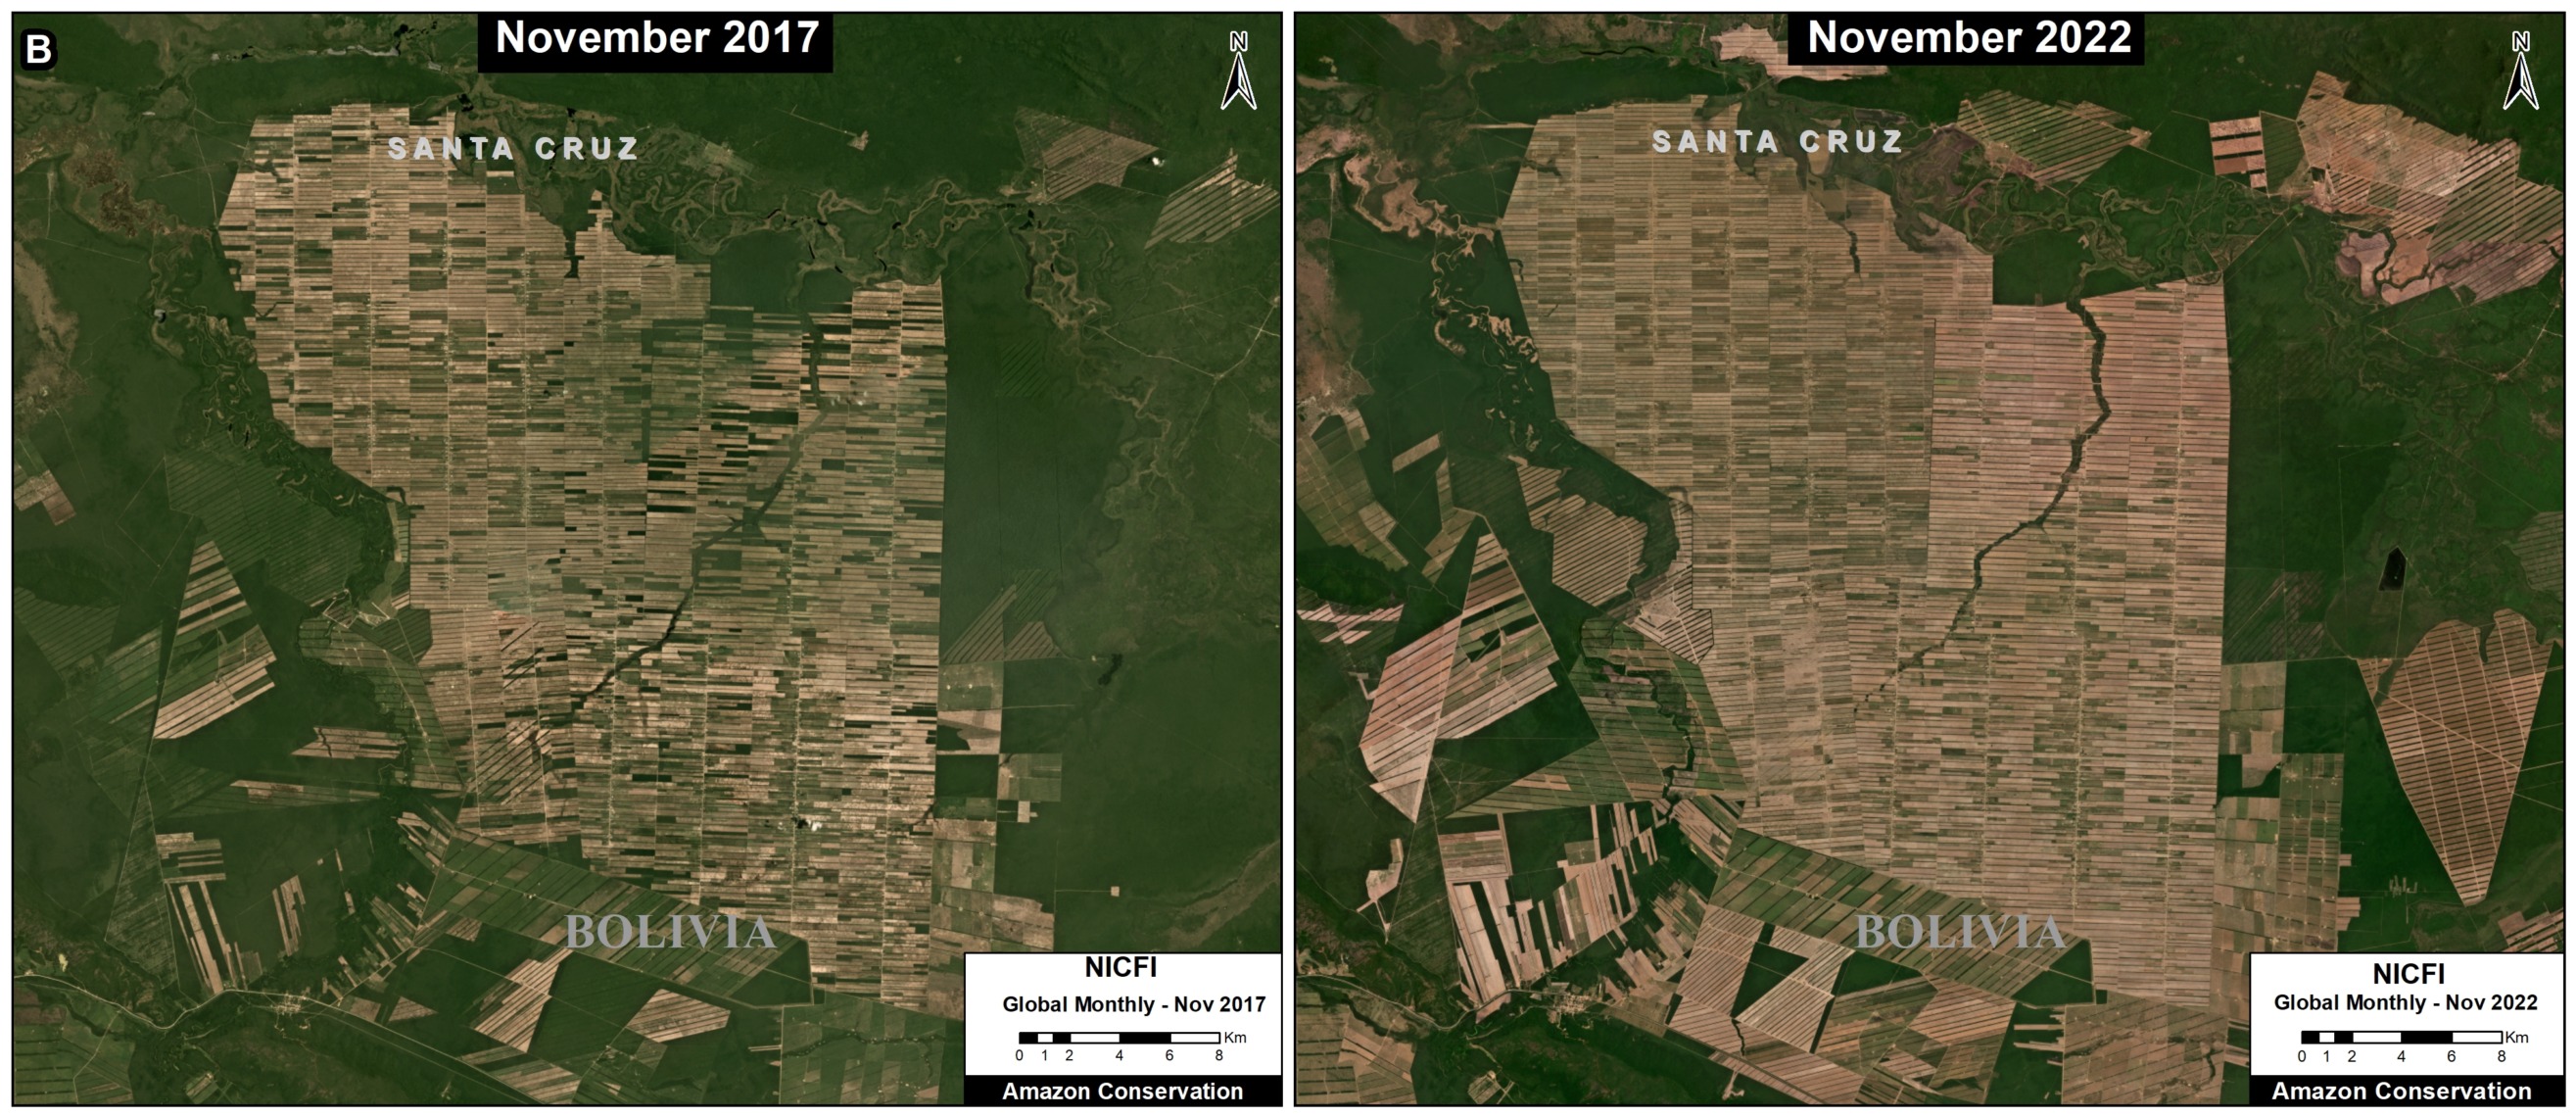
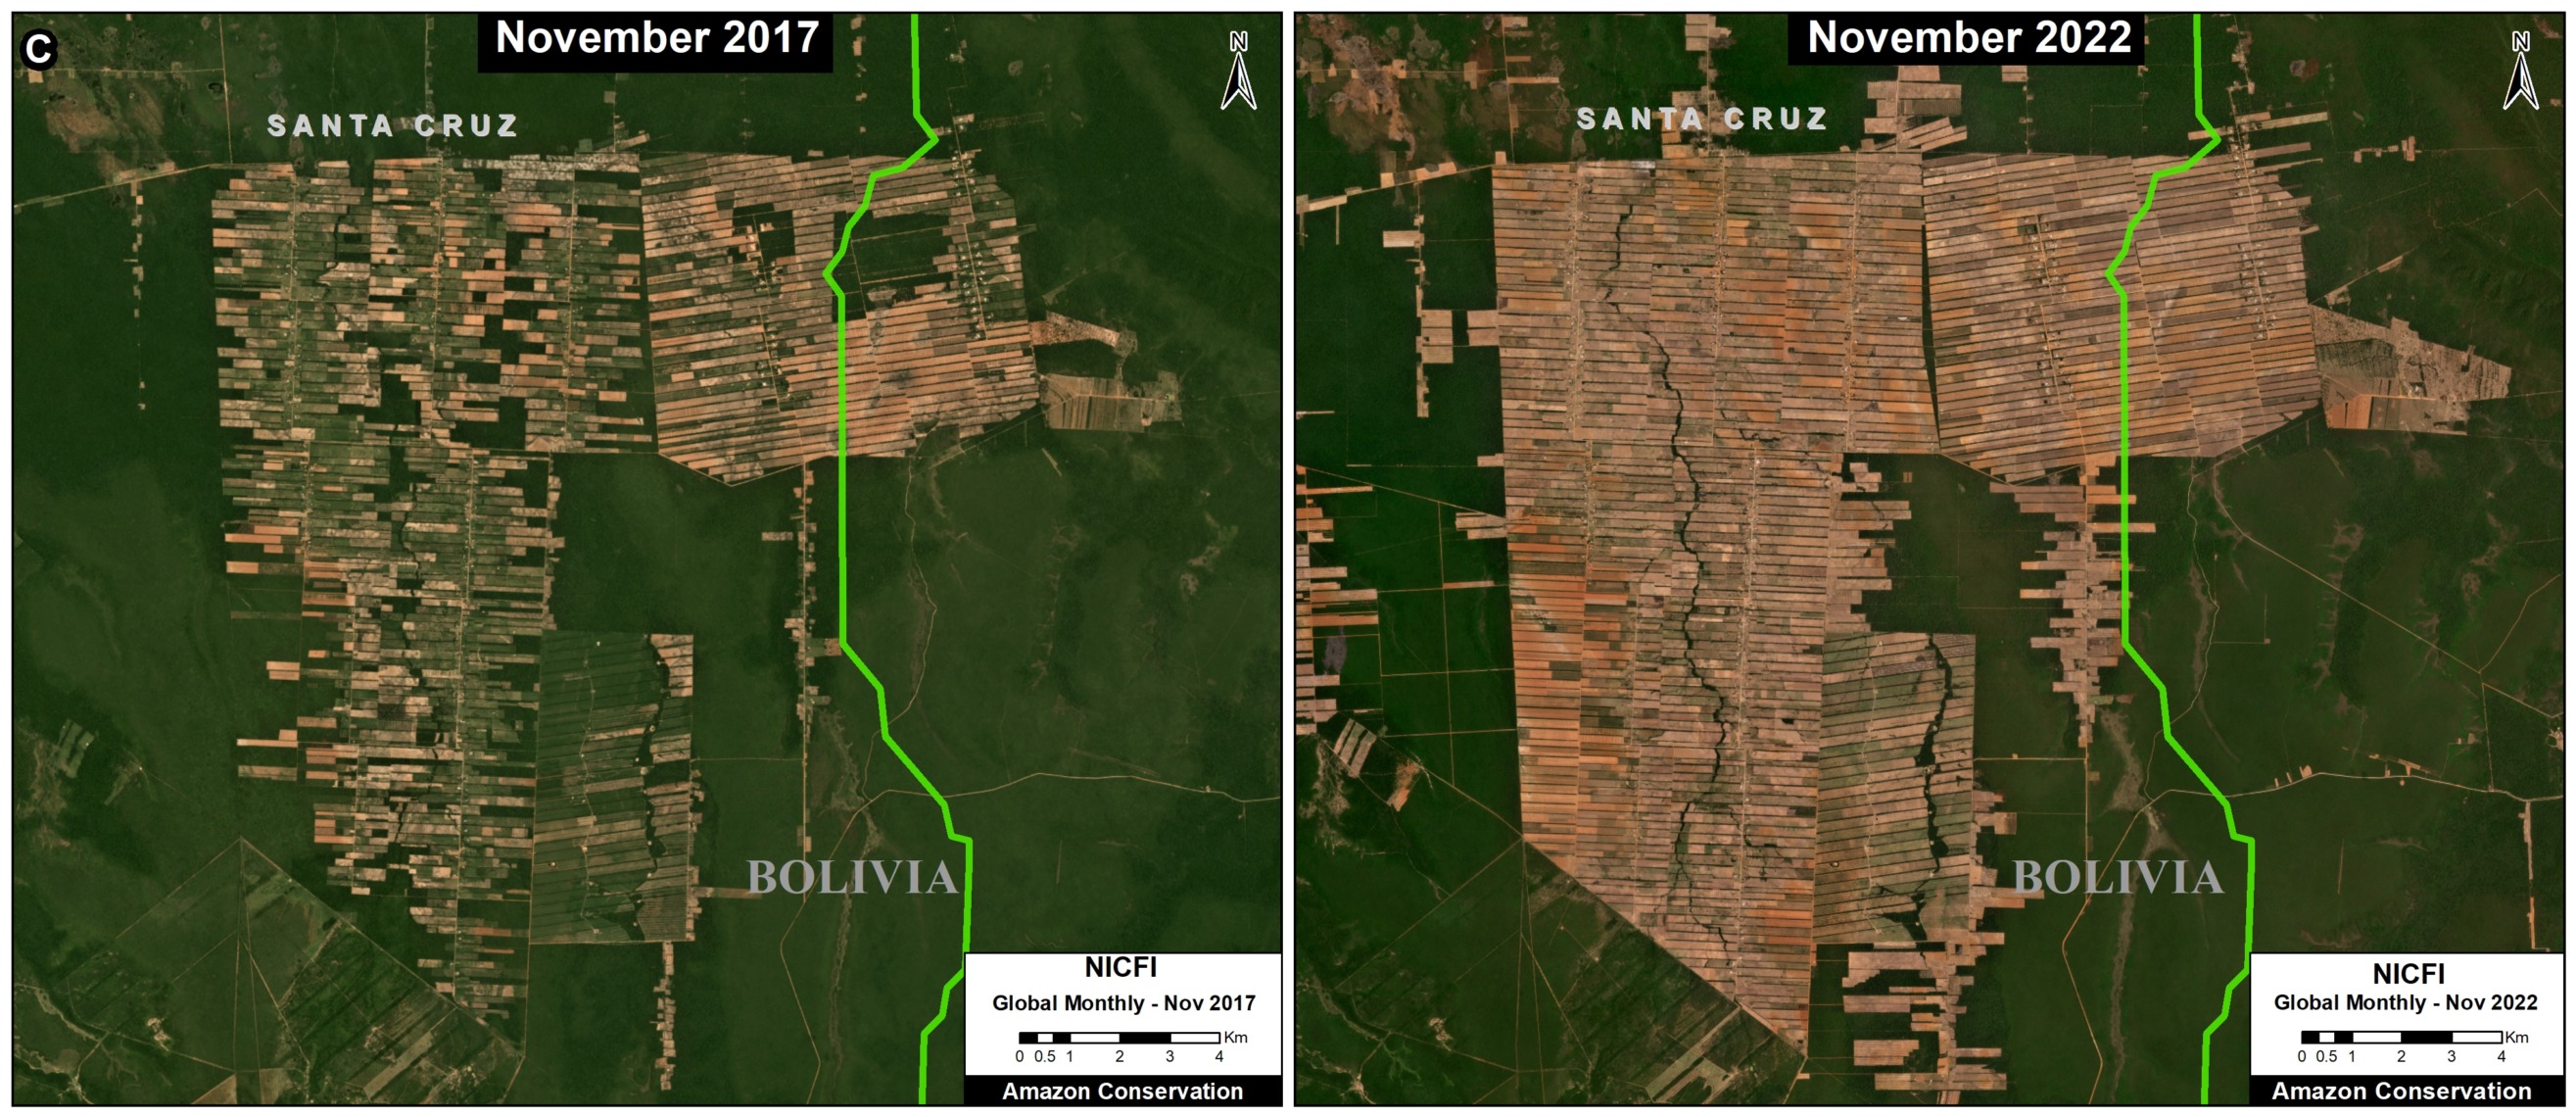
We have thus far detected 40 major fires in the Bolivian Amazon. The vast majority (88%) have been burning areas recently deforested specifically for new soy plantations.

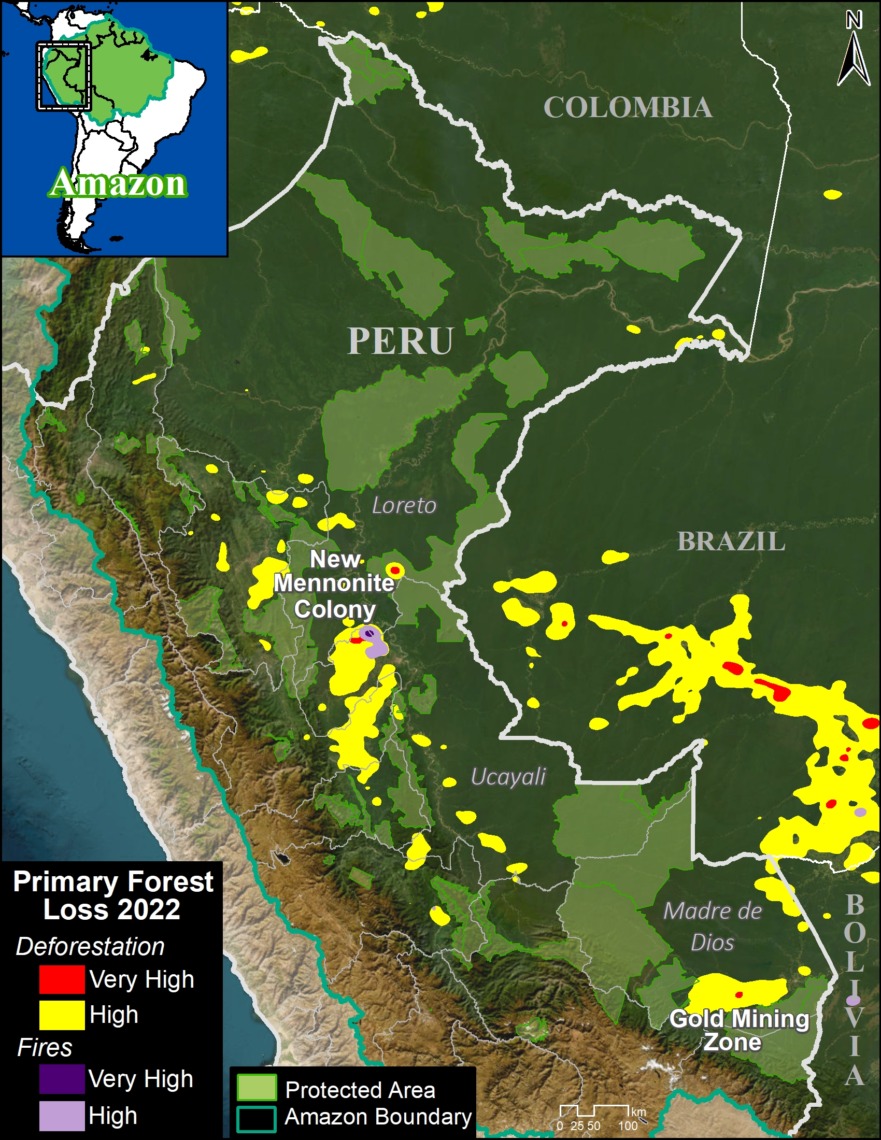
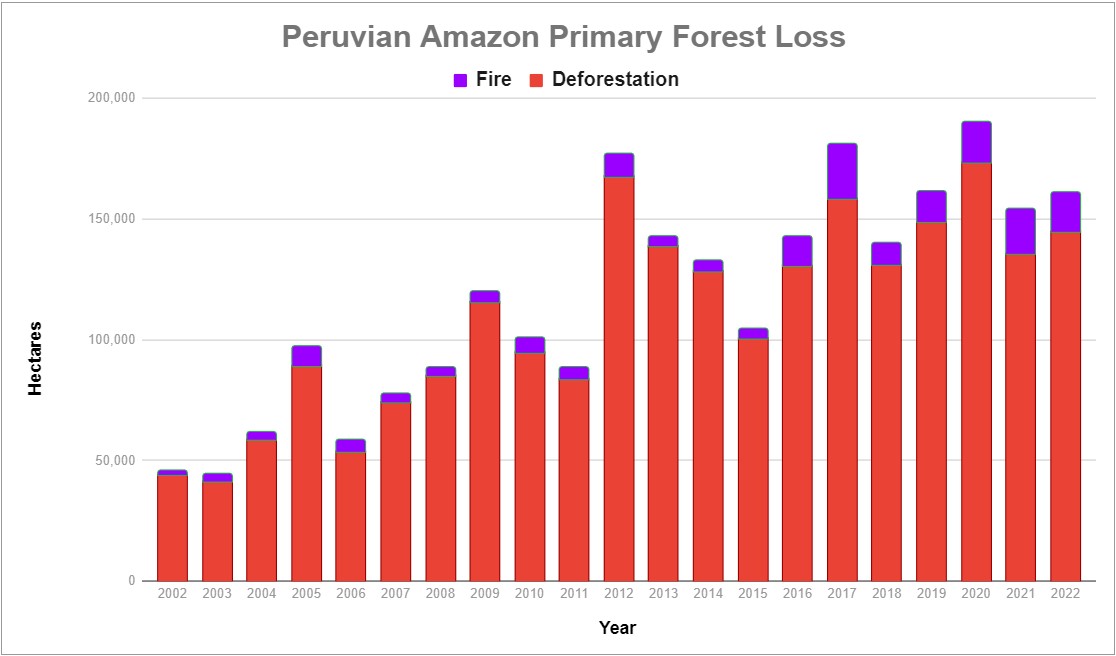
We have detected an additional 30 major fires in the Peruvian Amazon, mostly burning high elevation grasslands.

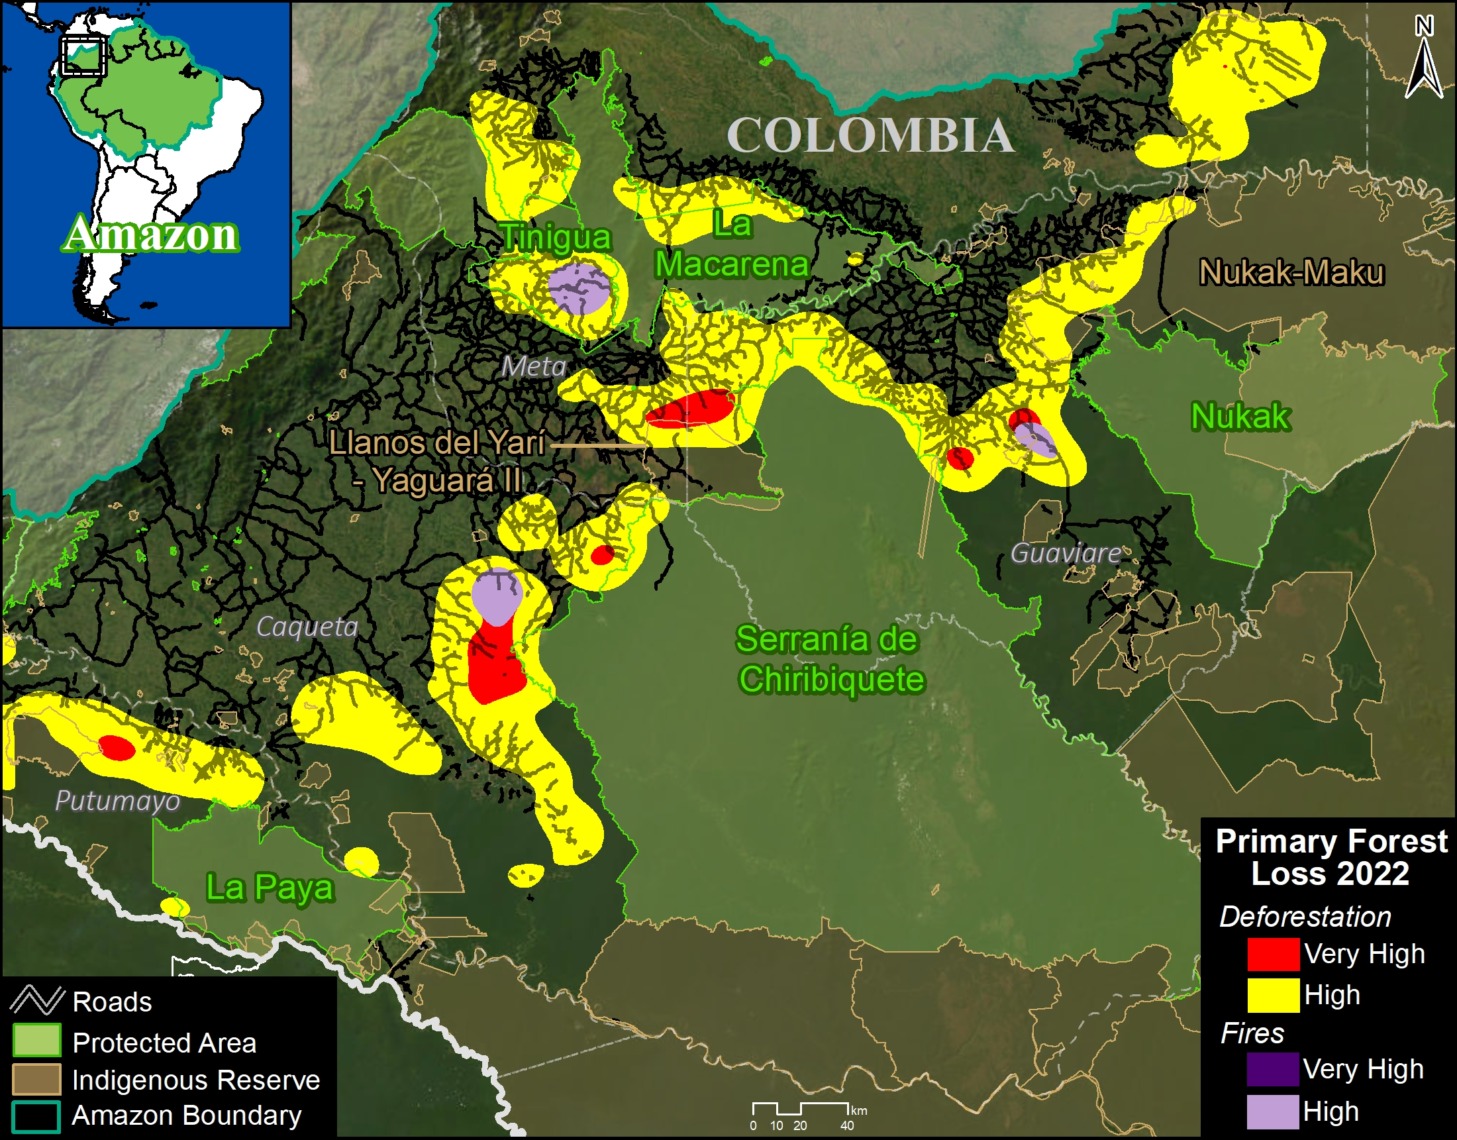
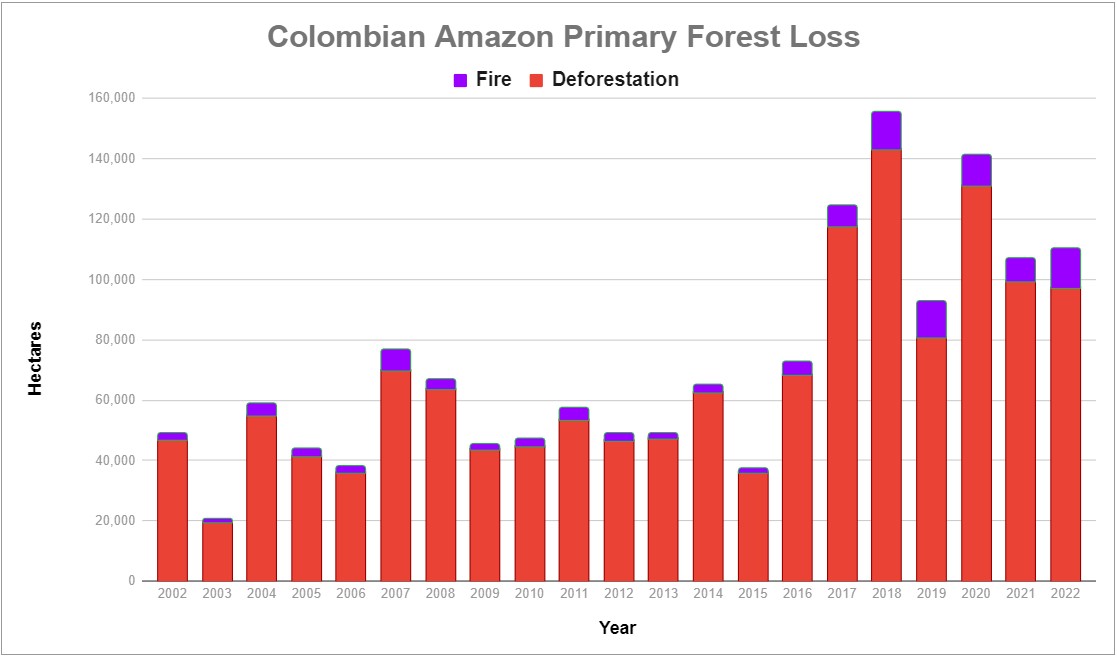
Earlier in the year, between January and March, we detected 50 major fires in the Colombian Amazon. Notably, 100% of them were in burning recently deforested areas.

These findings are based on the unique data from the real-time Amazon Fires Monitoring app developed by our partner organization in Peru, Conservación Amazónica ACCA. In a novel approach, the app combines data from the atmosphere (aerosol emissions in smoke) and the ground (heat anomaly alerts) to quickly and precisely detect major fires, defined as fires burning abundant biomass. In short, the app filters out smaller fires (such as routine burning an old field) and highlights major fires (such as burning recently deforested areas, standing forest, or natural grasslands).

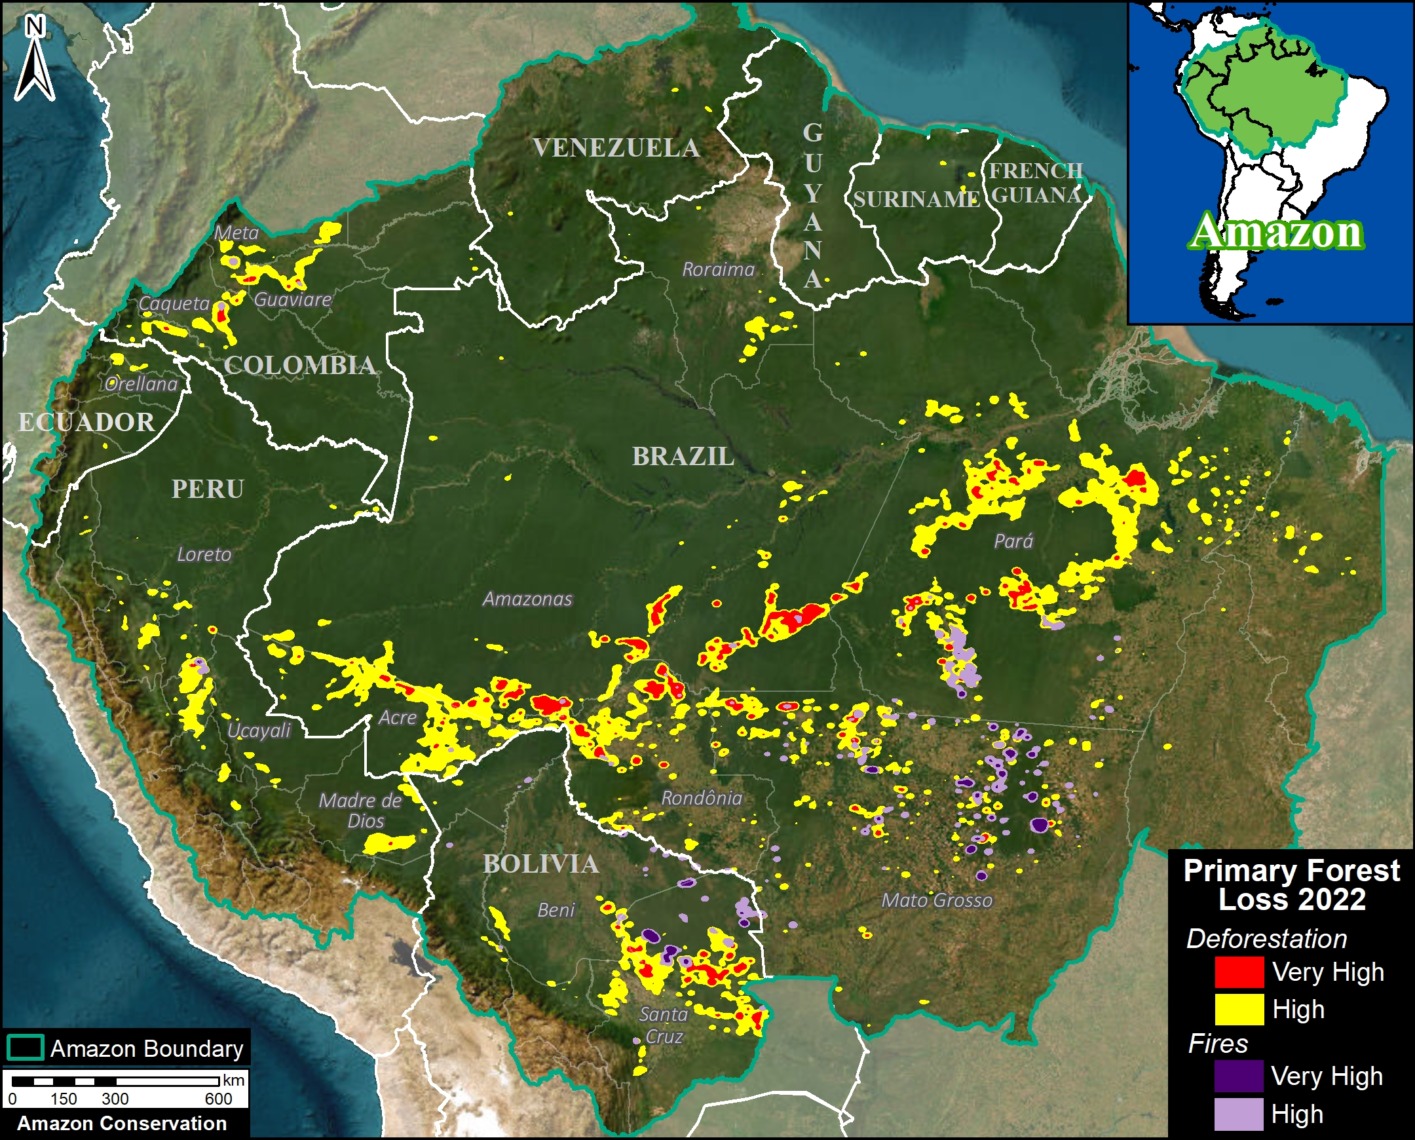
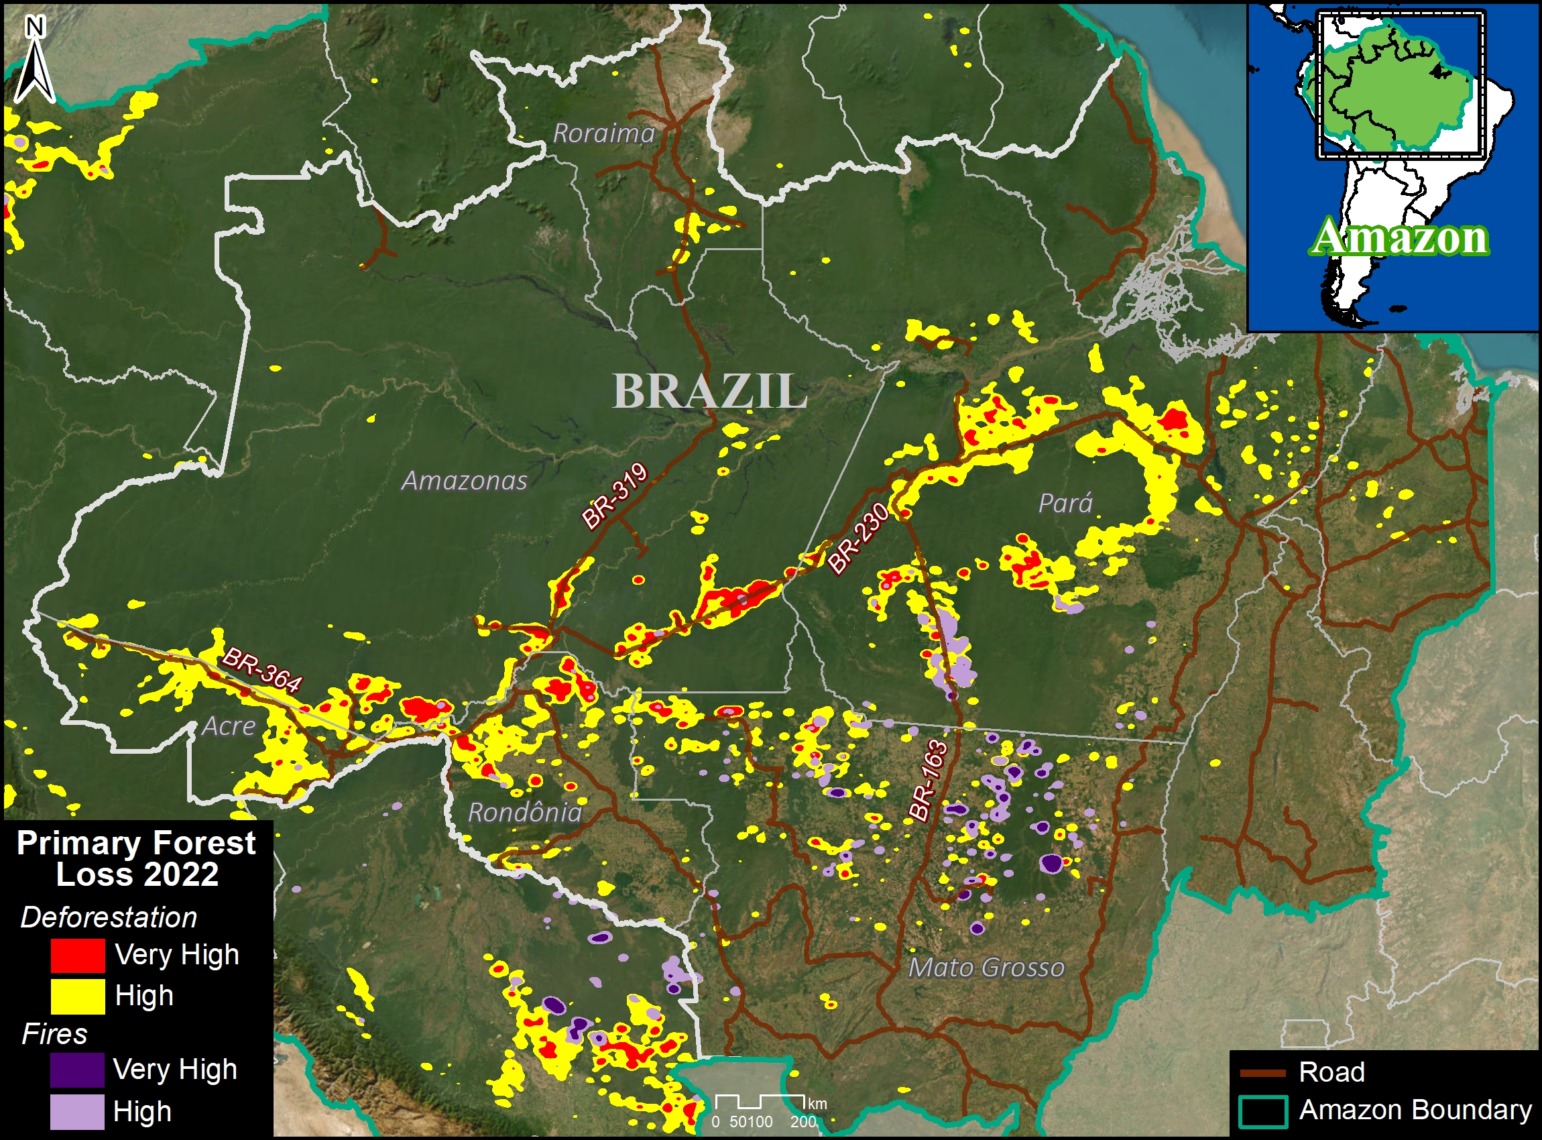
2023 Major Amazon Fires Base Map

Base Map. 2023 major Amazon fires (through July 2023). Data: ACCA, ACA/MAAP.

Amazon Fires Dashboard

We also present our new Amazon fires dashboard, which currently shows results for the 2022 fire season. The dashboard highlights a number of the key findings from last year:

  • We detected 983 major fires.
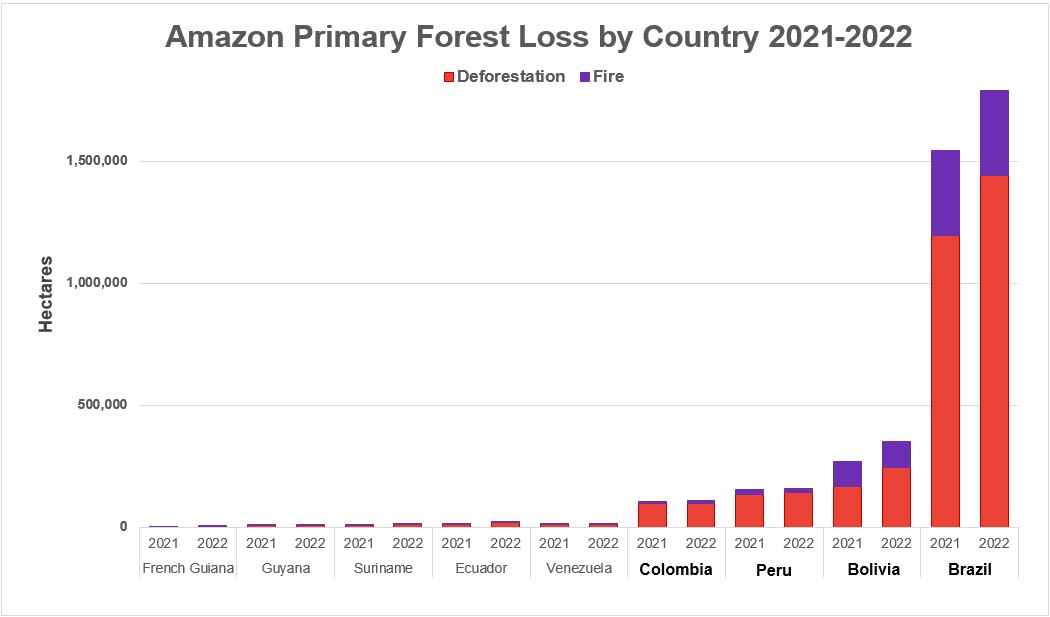
  • The vast majority (72%) were in Brazil, followed by Bolivia, Peru, and Colombia.
  • Importantly, 73% of the major fires burned recently deforested areas, followed by grasslands, forest fires, and pasture.

The dashboard was developed by the SAS Institute’s Data for Good Program.

Methodology

The reported results are based on an analysis of data generated by a unique real-time Amazon Fires Monitoring app during the year 2023, through July 13.

The app, hosted by Google Earth Engine, was developed and updated daily by the Peru-based organization Conservación Amazónica (ACCA). The resulting data was analyzed and recorded daily by the US-based organization Amazon Conservation. The app was created in 2019 and upgraded in 2020, with the current version launching in May 2021.

When fires burn, they emit gases and aerosols (aerosol definition: Suspension of fine solid particles or liquid droplets in air or another gas) as part of the outgoing smoke. A relatively new satellite (Sentinel-5P from the European Space Agency) detects these aerosol emissions.

The aerosol data, which has a spatial resolution of 7.5 sq km, is not impacted by cloud cover, thus enabling near real-time monitoring during all weather conditions. The app is typically updated each day in the late afternoon/early evening with data for that same day. Thus, there is a high potential for authorities and civil society to also use this app to respond to major fires in the field.

Importantly, the app distinguishes small fires (such as from clearing old fields and thus burning little biomass) from larger fires (such as burning recently deforested areas or standing forests and thus burning high amounts of biomass).

We define a “major fire” as one showing elevated aerosol emission levels on the app, thus indicating the burning of elevated levels of biomass. This typically translates to an aerosol index (AI) of >1 (or cyan-green to red on the app).

In a novel approach, the app combines this aerosol data from the atmosphere with heat anomaly data from the ground.

For all detected major fires, we cross-referenced the aerosol emissions pattern with the ground heat-based data to pinpoint the exact location of the fire source. Typically for major fires, there is a large cluster of heat-anomaly alerts aiding the process.

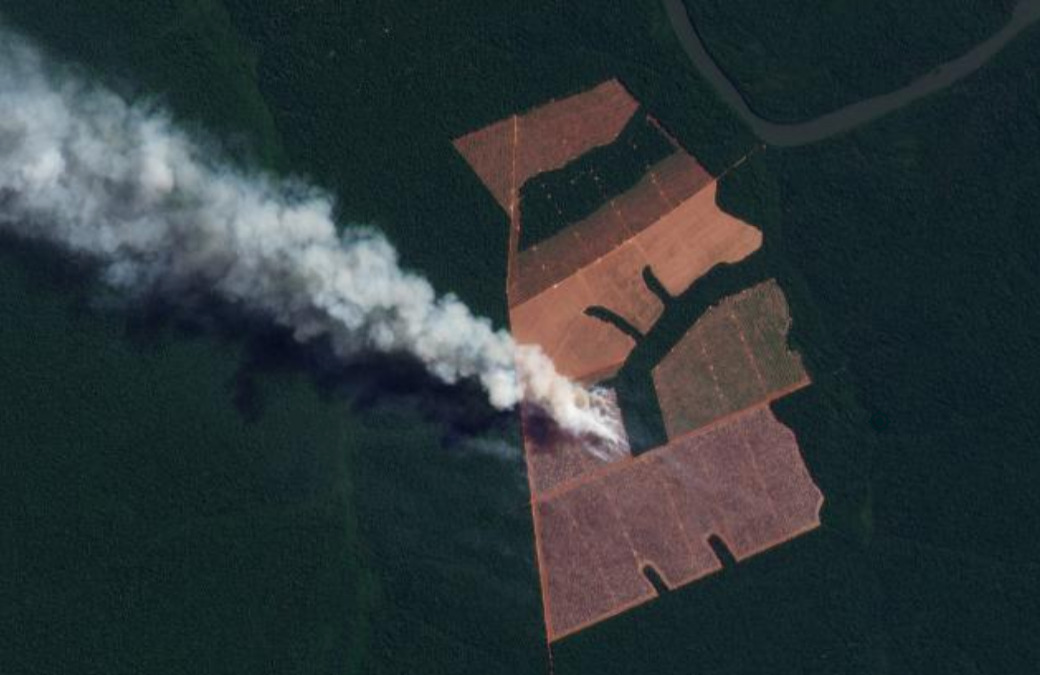
In a final step, the detected major fires are then analyzed with high-resolution optical satellite imagery from Planet Explorer. With this imagery, we can confirm the major fire (by observing smoke on the day of the fire or a burned area scar in the days following the fire) and estimate its size.

Moreover, with Planet’s extensive satellite imagery archive, we can determine the fire type. That is, by comparing imagery from the fire date to previous dates, we can determine whether the fire was burning a) a recently deforested area (defined as fires in areas recently deforested during the past three years), b) an older deforested area (typically long-standing pasture areas), c) standing forest (that is, a forest fire), or natural savannah.

In the app, we can also cross-reference if a major fire has occurred within a protected area or titled indigenous territory.

Note that the high values in the aerosol indices may also be due to other reasons such as emissions of volcanic ash or desert dust so it is important to cross-reference elevated emissions with heat data and optical imagery.

Acknowledgements

This work was supported by Norad (Norwegian Agency for Development Cooperation) and ICFC (International Conservation Fund of Canada).

Citation

Finer M, Costa H, Villa L (2023) Amazon Fire Season Heats Up. MAAP: 189.

MAAP #187: Amazon Deforestation & Fire Hotspots 2022

2022 Amazon Forest Loss Base Map. Deforestation and fire hotspots across the full Amazon biome. Data: UMD/GLAD, ACA/MAAP.

We present a detailed look at the major 2022 Amazon forest loss hotspots, based on the final annual data recently released by the University of Maryland (and featured on Global Forest Watch).

This dataset is unique in that it is consistent across all nine countries of the Amazon, and distinguishes forest loss from fire, leaving the rest as a proxy for deforestation (but also includes natural loss).

Thus, we are able to present both deforestation and fire hotspots across the Amazon.

The Base Map (see right) and Results Graph (see below) reveal several key findings:

  • In 2022, we estimate the deforestation of 1.98 million hectares (4.89 million acres). This represents a major 21% increase from 2021, and is the second highest on record, behind only the peak in 2004.
    k
  • Deforestation hotspots were especially concentrated along roads in the Brazilian Amazon, the soy frontier in the southeast Bolivian Amazon, and near protected areas in northwest Colombian Amazon.
    k
  • The vast majority of the deforestation occurred in Brazil (72.8%), followed by Bolivia (12.4%)Peru (7.3%), and Colombia (4.9%). Note that deforestation in Bolivia was the highest on record, and in Brazil the highest since the early 2000s.
    k
  • Fires impacted an additional 491,223 hectares (1.2 million acres) of primary forest. This total represents a 1.6% increase from 2021, and the 4th highest on record (behind only intense fire seasons of 2016, 2017, and 2020). Moreover, each of the seven most intense fire seasons has occurred in the past seven years. Nearly 93% of the fire impact occurred in just two countries: Brazil and Bolivia.
    k
  • In total, 2.47 million hectares (6.1 million acres) of primary forest were impacted by deforestation and fire. This total represents the third highest on record, only behind the post-El Niño years of 2016 and 2017.
    k
  • Since 2002, we estimate the deforestation of 30.7 million hectares (75.9 million acres) of primary forest, greater than the size of Italy or the U.S. state of Arizona.

Below, we zoom in on the six countries with the highest deforestation (Brazil, Bolivia, Peru, Colombia, Ecuador, and Venezuela) with additional maps and analysis.

Amazon Primary Forest Loss (Combined), 2002-2022

Amazon Forest Loss Results Graph, 2002-22. Data: UMD/GLAD, ACA/MAAP.

Amazon Primary Forest Loss (By Country), 2002-2022

Brazilian Amazon

Brazil Base Map, 2022. Deforestation and fire hotspots in the Brazilian Amazon in relation to major roads. Data: UMD/GLAD, ACA/MAAP.

In 2022, the Brazilian Amazon lost 1.4 million hectares (3.56 million acres) of primary forest to deforestation. Fires directly impacted an additional 348,824 hectares.

The deforestation rose 20.5% from 2021, and was the highest on record since the peak years of 2002 – 2005.

The fire impact was the 4th highest on record, only behind the intense fire years of 2016, 2017, and 2020.

The deforestation was concentrated along the major road networks, especially roads 230 (Trans-Amazonian Highway), 364, 319, and 163 in the states of Amazonas, Pará, Rondônia, and Acre (see Brazil Base Map).

The direct fire impacts were concentrated in the soy frontier, located in southeastern state of Mato Grosso


Bolivian Amazon

Bolivia Base Map, 2022. Deforestation and fire hotspots in Bolivian Amazon. Data: UMD/GLAD, ACA/MAAP.

In 2022, the Bolivian Amazon lost 245,177 hectares of primary forest to deforestation. Fires directly impacted an additional 106,922 hectares.

We highlight that this deforestation was 47% higher than 2021, and the highest on record (by far).

The fire impact was also up from last year, and the second-highest on record behind just the intense year of 2020.

Both the deforestation and fires were concentrated in the soy frontier located in southeastern department of Santa Cruz (see Bolivia Base Map).


Peruvian Amazon

Peru Base Map, 2022. Deforestation and fire hotspots in the Peruvian Amazon. Data: UMD/GLAD, ACA/MAAP.

In 2022, the Peruvian Amazon lost 144,682 hectares of primary forest to deforestation. Fires directly impacted an additional 16,408 hectares.

Deforestation increased 6.7% from 2021, and was the 5th highest on record. Fire impact decreased from last year, but was still relatively high.

The deforestation was concentrated in the central and southern Amazon (Ucayali and Madre de Dios regions, respectively) (see Peru Base Map).

In the central Amazon, we highlight the rapid deforestation for a new Mennonite colony (see MAAP #166).

In the southern Amazon, gold mining deforestation continues to be an issue in indigenous communities and within the official Mining Corridor.


Colombian Amazon

Colombia Base Map, 2022. Deforestation and fire hotspots in northwest Colombian Amazon. Data: UMD/GLAD, ACA/MAAP, FCDS.

In 2022, the Colombian Amazon lost 97,417 hectares of primary forest to deforestation. Fires directly impacted an additional 12,880 hectares.

Deforestation decreased 2% from 2021, but it was still relatively high (5th highest on record), continuing the trend of elevated forest loss since the FARC peace agreement in 2016.

Fire impact increased from last year and was actually the highest on record, edging out 2018 and 2019.

As described in previous reports (see MAAP #120), the Colombia Base Map shows there continues to be an “arc of deforestation” in the northwest Colombian Amazon (Caqueta, Meta, and Guaviare departments).

This arc impacts numerous Protected Areas (particularly Tinigua and Chiribiquete National Parks) and Indigenous Reserves (particularly Yari-Yaguara II and Nukak Maku).


Ecuadorian Amazon

Ecuador Base Map, 2022. Deforestation and fire hotspots in the Ecuadorian Amazon. Data: UMD/GLAD, ACA/MAAP.

Although accounting for just 1% of total loss across the Amazon, deforestation in the Ecuadorian Amazon was the highest on record in 2022 (18,902 hectares), up a striking 80% since 2021.

There are several deforestation hotspots caused by gold mining (see MAAP #182), oil palm plantation expansion, and small-scale agriculture.


Venezuelan Amazon

In the Venezuelan Amazon, deforestation was on par with last year (12,584 hectares).

There is a deforestation hotspot caused by gold mining in Yapacana National Park (see MAAP #173, MAAP #156, MAAP #169).

There are also hotspots in the Orinoco Mining Arc caused by mining and agriculture.


Methodology

The analysis was based on 30-meter resolution annual forest loss data produced by the University of Maryland and also presented by Global Forest Watch.

This data was complemented with the Global Forest Loss due to fire dataset that is unique in terms of being consistent across the Amazon (in contrast to country specific estimates) and distinguishes forest loss caused directly by fire (note that virtually all Amazon fires are human-caused). The values included were ‘medium’ and ‘high’ confidence levels (code 3-4).

The remaining forest loss serves as a likely close proxy for deforestation, with the only remaining exception being natural events such as landslides, wind storms, and meandering rivers. The values used to estimate this category was ‘low’ certainty of forest loss due to fire (code 2), and forest loss due to other ‘non-fire’ drivers (code 1).

For the baseline, it was defined to establish areas with >30% tree canopy density in 2000. Importantly, we applied a filter to calculate only primary forest loss by intersecting the forest cover loss data with the additional dataset “primary humid tropical forests” as of 2001 (Turubanova et al 2018). For more details on this part of the methodology, see the Technical Blog from Global Forest Watch (Goldman and Weisse 2019).

Our geographic range for the Amazon is a hybrid designed for maximum inclusion: biogeographic boundary (as defined by RAISG) for all countries, except for Bolivia and Peru, where we use the watershed boundary, and Brazil, where we use the Legal Amazon boundary.

To identify the deforestation hotspots, we conducted a kernel density estimate. This type of analysis calculates the magnitude per unit area of a particular phenomenon, in this case, forest cover loss. We conducted this analysis using the Kernel Density tool from the Spatial Analyst Tool Box of ArcGIS. We used the following parameters:

Search Radius: 15000 layer units (meters)
Kernel Density Function: Quartic kernel function
Cell Size in the map: 200 x 200 meters (4 hectares)
Everything else was left to the default setting.

For the Base Map, we used the following concentration percentages: High: 3-14%; Very High: >14%.

Acknowledgements

We thank colleagues at Global Forest Watch (GFW), an initiative of the World Resources Institute (WRI) for comments and access to data.

This work was supported by Norad (Norwegian Agency for Development Cooperation) and ICFC (International Conservation Fund of Canada).

Citation

Finer M, Mamani N (2023) Amazon Deforestation & Fire Hotspots 2022. MAAP: 187

MAAP #185: Gold Mining Deforestation in the Southern Peruvian Amazon: 2021-2022 Update

Base Map. Gold Mining Deforestation in the Southern Peruvian Amazon, 2021-2022 update. Zooms indicated by insets A-F. Click on image to enlarge. Data: ACA/MAAP, CINCIA.

Gold mining continues to be one of the main causes of deforestation in the southern Peruvian Amazon, especially in the Madre de Dios region.

Here, we provide a comprehensive look at the most recent (2021-2022) gold mining-related deforestation in the area, combining two important types of data for the first time:

  1. Deforestation within the Mining Corridor, a large area delimited by the Peruvian government to organize and promote mining. Mining activity in this corridor, officially known as the “Small-scale and Artisanal Mining Zone in the department of Madre de Dios,” can be formal, informal, or illegal.1
    j
  2. Deforestation outside the Mining Corridor, which represents our estimate of illegal mining. According to current regulations (Legislative Decree No. 1336), illegal mining occurs in one or more territorial categories such as protected natural areas, indigenous reserves, and natural bodies of water (such as lakes or rivers). Therefore, for this report, the presence of mining-related deforestation in protected natural areas and their buffer zones, as well as indigenous communities, is considered an indicator of illegality. However, it is important to recognize the possibility that some of these findings may be covered by current regulations regarding mining formalization.2 Therefore, it is recommended to consider the findings of illegal deforestation as referential.

These two study areas cover a total of 1.38 million hectares and include all detected mining areas in the southern Peruvian Amazon.

We highlight several important findings (see Base Map and Table 1):

  • Table 1. Data: ACA/MAAP.

    We estimate a total deforestation of 18,421 hectares (45,520 acres) due to gold mining in the southern Peruvian Amazon in the last two years (2021-2022).
    l

  • Of this total, the majority of mining-related deforestation (76.6%, or 14,117 hectares) occurred within the Mining Corridor.
    l
  • The remaining deforestation (23.4%, or 4,304 hectares) took place outside the Mining Corridor. Breaking down this percentage, 15% is found in indigenous communities, 4.8% in buffer zones of protected natural areas, 0.8% in forest concessions, and 2.8% in non-zoned areas.
    j
  • Furthermore, we found that mining within protected natural areas, such as the Tambopata National Reserve and the Amarakaeri Communal Reserve, has been effectively controlled by the Peruvian government through the National Service of Protected Natural Areas (SERNANP).
    j
  • It is important to highlight that mining has stopped in the core of La Pampa (the most critical zone during the years 2014-2018) following Operation Mercury in early 2019 and the subsequent Restoration Plan in 2021.
    j
  • Compared to the years prior to Operation Mercury (2017-2018), there has been an approximate decrease of 4.5% (866 hectares) in mining-related deforestation. Most notably, there has been a major reduction in mining outside the corridor (from 47.7% to 23.4%), and a greater concentration within the corridor (from 52.3 to 76.6%).That is, an apparent major reduction in illegal mining.

Mining Corridor

Our main finding is that the vast majority (76.6%) of gold mining-related deforestation in the southern Peruvian Amazon occurred within the Mining Corridor.

We estimate that the deforestation due to mining is 14,117 hectares within the Mining Corridor in the last two years (2021-2022). Below, we present a series of zooms of some emblematic examples of recent mining-related deforestation in the corridor (Images A-C).

Image A: Mining Corridor

Image B: Mining Corridor

Image C: Mining Corridor

Outside of the Mining Corridor

The remaining deforestation due to mining (23.4%) is located outside the Mining Corridor. Breaking this down, 15% (2,769 hectares) occurred within indigenous territories, 4.8% (876 hectares) in buffer zones of protected areas, 0.8% (141 hectares) in forest concessions (for Brazil nuts), and 2.8% (517 hectares) in non-zoned areas during the last two years.

Regarding indigenous communities, the most affected were Barranco Chico (816 hectares) and San José de Karene (602 hectares), followed by Tres Islas (482 hectares), San Jacinto (177 hectares), Kotsimba (174 hectares), Puerto Luz (171 hectares), Boca Inambari (140 hectares), Shiringayoc (126 hectares), Arazaire (57 hectares), and El Pilar (23 hectares).

Regarding the buffer zones of protected areas, the most affected were the buffer zones of the Tambopata National Reserve, the Bahuaja Sonene National Park, and the Amarakaeri Communal Reserve. On the other hand, it has been found that mining within the actual protected areas, such as the Tambopata National Reserve and the Amarakaeri Communal Reserve, has been effectively controlled by the Peruvian government through the National Service of Natural Protected Areas (SERNANP).

Regarding forest concessions, deforestation due to mining was identified in 141 hectares within Brazil nut concessions in the Pariamanu and Pariamarca river basins.

Next, we continue with a series of zooms showing some emblematic examples of recent deforestation due to mining in the following prohibited areas: indigenous communities (Barranco Chico, Image D), buffer zone of the Bahuaja Sonene National Park (Chaspa, Image E), and Brazil nut concessions (Pariamanu, Image F).

We also present an important area in the buffer zone of the Tambopata National Reserve known as La Pampa (Image G). La Pampa was the epicenter of destructive deforestation due to gold mining between 2014 and 2018. We show that after Operation Mercury, which began in early 2019, the expansion of gold mining in La Pampa was essentially halted.

Image D: Barranco Chico (Indigenous Community)

Image E: Chaspa (Buffer Zone of Bahuaja Sonene National Park)

Image F: Pariamanu (Brazil Nut Concession)

Image G: La Pampa (Buffer Zone of Tambopata National Reserve)

Annex

We show a version of the Basemap without the zoom insets.

Base Map (without insets). Deforestation by Gold Mining in the Southern Peruvian Amazon, with Update 2021-22. Click image to enlarge. Data: ACA/MAAP, CINCIA.

Notes

1The Mining Corridor, designated by Legislative Decree No. 1100 as the “Zone for small-scale and artisanal mining in the department of Madre de Dios,” categorizes mining activities as follows:

  • Formal: Completed formalization process with approved environmental and operational permits.
  • Informal: In the process of formalization; Operates only in authorized extraction areas, uses permitted machinery, and is considered an administrative offense, not a crime.
  • Illegal: Operates in prohibited areas such as bodies of water (e.g., rivers or lakes), uses prohibited machinery, is considered a criminal offense, and is punishable by imprisonment.

2 Due to the possibility that these activities could be existing operations prior to the declaration of Natural Protected Areas and their buffer zones.

3 The data for 2017-2018 were obtained from the Amazonian Scientific Innovation Center – CINCIA.

Methodology

Mining Corridor

We used LandTrendR, a temporal segmentation algorithm that identifies changes in pixel values over time, to detect forest loss within the Mining Corridor in 2021 and 2022 using the Google Earth Engine platform. It is important to note that this method was originally designed for Landsat images with moderate resolution (30 meters)1, but we adapted it for higher spatial resolution NICFI-Planet monthly mosaics (4.7 meters).2

Additionally, we created a baseline for the period 2016-2020 to eliminate old deforested areas (prior to 2021) due to rapid changes in the natural regrowth process.

Finally, we manually separated forest loss due to mining and other causes in 2021 and 2022 to specifically report on direct impacts related to mining. For this part of the analysis, we used various resources to aid the manual process, such as radar image alerts (RAMI) from the SERVIR Amazonia program, historical data from CINCIA from 1985 to 2020, forest loss data from the Peruvian government (National Forest Conservation Program for Climate Change Mitigation), and the University of Maryland.

  1. Kennedy, R.E., Yang, Z., Gorelick, N., Braaten, J., Cavalcante, L., Cohen, W.B., Healey, S. (2018). Implementation of the LandTrendr Algorithm on Google Earth Engine. Remote Sensing. 10, 691.
  2.  Erik Lindquist, FAO, 2021

Outside the Mining Corridor

These places were identified as the main active fronts of deforestation due to gold mining, based on historical data from the Amazon Scientific Innovation Center – CINCIA and automatic alerts of forest loss generated by both the University of Maryland (GLAD alerts) and the Peruvian government platform (PNCBMCC-Geobosques).

The analysis combines the LandTrendr method (described earlier) with a photo interpretation based on high-resolution satellite images from Planet (3 meters). In each of the sites, we have detected, identified, and analyzed deforestation due to gold mining between 2021 and 2022. For areas with overlap between native communities and buffer zones, priority was given to the areas of the native communities.

Acknowledgements

We thank S. Novoa, C. Zavala, O. Liao, K. Nielsen, S. Otoya, and C. Ipenza for their valuable contributions and comments to this report, and R. McMullen for translation. We also thank C. Ascorra and M. Pillaca from the Amazon Scientific Innovation Center – CINCIA for providing us with historical mining data from 1985 to 2021.

This report was prepared with the technical support of USAID through the Prevent Project. Prevent (Proyecto Prevenir in Spanish) works with the Government of Peru, civil society, and the private sector to prevent and combat environmental crimes for the conservation of the Peruvian Amazon, particularly in the regions of Loreto, Madre de Dios, and Ucayali.

Disclaimer: This publication is made possible by the generous support of the American people through USAID. The contents are the sole responsibility of the authors and do not necessarily reflect the views of USAID or the United States Government.


Citation

Finer M, Mamani N (2023) Gold Mining Deforestation in the Southern Peruvian Amazon: 2021-2022 Update. MAAP: 185.

MAAP #183: Protected Areas & Indigenous Territories Effective Against Deforestation Across Amazon

Base Map. Primary forest loss (2017-21) across the Amazon, in relation to protected areas and indigenous territories.

As deforestation continues to threaten primary forest across the Amazon, key land use designations are one of the best hopes for the long-term conservation of critical remaining intact forests.

Here, we evaluate the impact of two of the most important: protected areas & indigenous territories.

Our study looked across all nine countries of the Amazon biome, a vast area of 883.7 million hectares (see Base Map).

We calculated primary forest loss over the past 5 years (2017-2021).

For the first time, we were able to distinguish fire vs non-fire forest loss. For non-fire, while this does include natural events (such as landslides and wind storms), we consider this our best proxy for human-caused deforestation.

We analyzed the results across three major land use categories:

1) Protected Areas (national and state/department levels), which cover 197 million hectares (23.6% of Amazon).

2) Indigenous Territories (official), which cover 163.8 million hectares (19.6% of Amazon).

3) Other (all remaining areas outside protected areas and indigenous territories), which cover 473 million hectares (56.7% of Amazon).

In summary, we found that deforestation was the primary driver of forest loss, with fire always being a smaller subset. Averaged across all 5 years, protected areas and indigenous territories had similar levels of effectiveness, reducing primary forest loss rate by 3x compared to areas outside of these designations.

Below, we show the key results across the Amazon in greater detail, including a breakdown for the western Amazon (Bolivia, Colombia, Ecuador, and Peru) and the Brazilian Amazon.

Key Findings

Amazon Biome

We documented the loss of 11 million hectares of primary forests across all nine countries of the Amazon biome between 2017 and 2021. Of this total, 71% was non-fire (deforestation and natural) and 29% was fire.

For the major land use categories, 11% of the forest loss occurred in both protected areas and indigenous territories, respectively, while the remaining 78% occurred outside these designations.

To standardize these results for the varying area coverages, we calculated annual primary forest loss rates (loss/total area of each category). Figure 1 displays the results for these rates across all nine countries of the Amazon biome.

Figure 1. Primary forest loss rates across the Amazon, 2017-21.

Broken down by year, 2017 had the highest forest loss rates, with both a severe deforestation and fire season. In addition, 2021 had the second highest deforestation rate, while 2020 had the second highest fire loss rate.

Averaged across all five years, protected areas (green) had the lowest overall primary forest loss rate (0.12%), closely followed by indigenous territories (0.14%).

Interestingly, indigenous territories (orange) actually had a slightly lower deforestation rate compared to protected areas (0.7 vs 0.8%), but higher fire loss rate (o.7 vs .04%), resulting in the overall higher forest loss rate noted above.

Outside of these designations (red), the primary forest loss rate was triple (.36%), especially due to much higher deforestation.

Western Amazon

Breaking the results down specifically for the western Amazon (Bolivia, Colombia, Ecuador, and Peru), we documented the loss of 2.6 million hectares of primary forests between 2017 and 2021. Of this total, 80% was non-fire (deforestation and natural) and 20% was fire.

For the major land use categories, 9.6% occurred in protected areas, 15.6% in indigenous territories, and the remaining 74.8% occurred outside these designations.

Figure 2 displays the standardized primary forest loss rates across the western Amazon.

Figure 2. Primary forest loss rates across the Western Amazon, 2017-21.

Broken down by year, 2017 had the highest deforestation rate and overall forest loss rates. But 2020 had the highest fire loss rate, mainly due to extensive fires in Bolivia. 2021 also had a relatively high deforestation rate. Also, note the high level of fires in protected areas in 2020 and 2021, and indigenous territories in 2019.

Averaged across all five years, protected areas had the lowest overall primary forest loss rate (0.11%), followed by indigenous territories (0.16%).

Outside of these designations, the primary forest loss rate was .30%. That is, triple the protected areas rate and double the indigenous territories rate.

Brazilian Amazon

Breaking the results down specifically for the Brazilian Amazon, we documented the loss of 8.1 million hectares of primary forests between 2017 and 2021. Of this total, 68% was non-fire (deforestation and natural) and 32% was fire.

For the major land use categories, 9.4% occurred in indigenous territories, 11.2% occurred in protected areas, and the remaining 79.4% occurred outside these designations.

Figure 3 displays the standardized primary forest loss rates across the Brazilian Amazon.

Figure 3. Primary forest loss rates in the Brazilian Amazon, 2017-21.

Broken down by year, 2017 had the highest forest loss rate recorded in the entire study (.58%), due to both elevated deforestation and fire. Note that indigenous territories were particularly impacted by fire in 2017.

2020 had the next highest forest loss rate, also driven by an intense fire season. Fires were not as severe the following year in 2021, but deforestation increased.

Averaged across all five years, indigenous territories had the lowest overall primary forest loss rate (0.14%), closely followed by protected areas (0.15%).

Interestingly, indigenous territories had a lower deforestation rate compared to protected areas (0.5 vs 0.11%), but higher fire impact (0.09 vs 0.04%).

Outside of these designations (red), the primary forest loss rate was triple (.45%).

Methodology

To estimate deforestation across all three categories (protected areas, indigenous territories, and other), we used annual forest loss data (2017-21) from the University of Maryland (Global Land Analysis and Discovery GLAD laboratory) to have a consistent source across all countries (Hansen et al 2013).

We obtained this data, which has a 30-meter spatial resolution, from the “Global Forest Loss due to Fires 2000–2021” data download page. It is also possible to visualize and interact with the data on the main Global Forest Change portal.

The annual data is disaggregated into forest loss due to fire vs. non-fire (other disturbance drivers). It is important to note that the non-fire drivers include both human-caused deforestation and forest loss caused by natural forces (landslides, wind storms, etc.).

We also filtered this data for only primary forest loss, following the established methodology of Global Forest Watch. Primary forest is generally defined as intact forest that has not been previously cleared (as opposed to previously cleared secondary forest, for example). We applied this filter by intersecting the forest cover loss data with the additional dataset “primary humid tropical forests” as of 2001 (Turubanova et al 2018). Thus, we often use the term “primary forest loss” to describe this filtered data.

Data presented as primary forest loss rate is standardized per the total area covered of each respective category per year (annual). For example, to properly compare raw forest loss data in areas that are 100 hectares vs 1,000 hectares total size respectively, we divide by the area to standardize the result.

Our geographic range extends from the Andes to the Amazon plain and reaching the transitions with the Cerrado and the Pantanal. This range includes nine countries of the Amazon (or Pan-Amazon region as defined by RAISG) and consists of a combination of the Amazon watershed limit, the Amazon biogeographic limit and the Legal Amazon limit in Brazil. See Base Map above for delineation of this hybrid Amazon limit, designed for maximum inclusion.

Additional data sources include:

  • National and state/department level protected areas: RUNAP 2020 (Colombia), SNAP 2022 (Ecuador), SERNAP & ACEAA 2020 (Bolivia), SERNANP 2022 (Peru), INPE/Terrabrasilis 2022 (Brazil), SOS Orinoco 2021 (Venezuela), and RAISG 2020 (Guyana, Suriname, and French Guiana.)
  • Indigenous Territories: RAISG & Ecociencia 2022 (Ecuador), INPE/Terrabrasilis 2022 (Brazil), RAISG 2020 (Colombia, Bolivia, Venezuela, Guyana, Suriname, and French Guiana), and MINCU & ACCA 2021 (Peru). For Peru, this includes titled native communities and Indigenous/Territorial Reserves for indigenous groups in voluntary isolation.

For analysis, we categorized Protected Areas first, then Indigenous Territories to avoid overlapping areas. Each category was disaggregated by year created/recognized to match the annual report of forest loss, for example. If a Protected area was created in December 2018, it would be considered within the analysis for the year 2019.

Acknowledgements

This work was supported by the Andes Amazon Fund (AAF), Norwegian Agency for Development Cooperation (NORAD), and International Conservation Fund of Canada (ICFC).

We thank M. MacDowell and M. Cohen for helpful comments on this report.

Citation

Finer M, Mamani N (2023) Protected Areas & Indigenous Territories Effective Against Deforestation Across Amazon. MAAP: 176.

MAAP #178: Gold Mining Deforestation Across the Amazon

Base Map. Mining deforestation hotspots across the Amazon. Letters A-J indicate locations of case studies below. Click image to enlarge.

Gold Mining is one of the major deforestation drivers across the Amazon.

Although not typically at the scale of agricultural deforestation, gold mining has the potential to severely impact critical areas such as protected areas & indigenous territories.

Relatedly, gold mining often targets remote areas, thus impacting largely intact and carbon-rich primary forests.

Here, for the first time, we present a large-scale overview of the major gold mining deforestation hotspots across the entire Amazon biome.

We found that gold mining is actively causing deforestation in nearly all nine countries of the Amazon (see Base Map).

In  this report, we focus on five countries: Peru, Brazil, Venezuela, Ecuador, and Bolivia, featuring case studies of the most severe active gold mining fronts.

In most cases, this mining is likely illegal given that it is occurring in protected areas and indigenous territories.

Note that we focus on mining activity that is causing deforestation of primary forests. There are additional critical gold mining areas that are occurring in rivers, such as in northern Peru and southern Colombia, that are not included in this report.

Below, we show a series high-resolution satellite images of the Amazon case studies. Each example highlights recent gold mining deforestation; that is comparing 2020 (left panel) with 2022 (right panel).

Case Studies, in High-resolution

Peruvian Amazon

Southern Peru (specifically, the region of Madre de Dios) is one of the most severe and emblematic examples of gold mining deforestation in the Amazon, clearing thousands of hectares of primary forest (see MAAP #154). The active mining fronts have evolved substantially over the past 20+ years. Most recently, gold mining has impacted areas such as Mangote and Pariamanu.

A. Mangote

B. Pariamanu

Brazilian Amazon

In the vast Brazilian Amazon, illegal gold mining deforestation is most severe across a number of indigenous territories, most notably: Munduruku (Pará state), Kayapó (Pará), and Yanomami (Roraima).

C. Munduruku Indigenous Territory


D. Kayapó Indigenous Territory


E. Yanomami Indigenous Territory

Venezuelan Amazon

Mining is one of the major deforestation drivers in the Venezuelan Amazon (MAAP #155). This mining impact is occurring in the designated Orinoco Mining Arc, but also key protected areas such as Caura, Canaima, and Yapacana National Parks.

F. Canaima National Park


G. Yapacana National Park

Ecuadorian Amazon

We have been documenting the numerous mining deforestation hotspots in the Ecuadorian Amazon that appear to be intensifying in recent years. Two key examples are along the Punino River (Napo and Orellana provinces) and further south in Podocarpus National Park.

H. Punino River

I. Podocarpus National Park

Bolivian Amazon

One of the newest gold mining deforestation hotspots is along the Tuichi River in Madidi National Park.

J. Madidi National Park

Methodology

Mining deforestation hotspots were identified based on MAAP’s ongoing monitoring efforts, and assisted by Amazon Mining Watch.

Acknowledgements

We thank A. Folhadella, S. Novoa, D. Larrea, C. De Ugarte, and M. Teran for helpful comments on this report, and Conservación Amazónica – ACCA for data on mining sites in northern Peru.

This work was supported by Norad (Norwegian Agency for Development Cooperation) and ICFC (International Conservation Fund of Canada).

Citation

Finer M, Ariñez A, Mamani N (2023) Mining Deforestation Across the Amazon. MAAP: 178.

MAAP #182: Gold Mining Deforestation in the Ecuadorian Amazon

Base Map. Major cases of recent gold mining deforestation in Ecuadorian Amazon.

Gold mining is one of the major deforestation drivers across the Amazon, with well-known cases in Peru, Brazil, and Venezuela.

In a recent series of technical articles*, in collaboration with the Ecuadorian organization Foundation EcoCiencia, we have also shown that gold mining is escalating in the Ecuadorian Amazon.

Here, we summarize the results from the series and present 5 major cases of recent gold mining deforestation in Ecuador (see Base Map).

These cases, which include gold mining expansion in protected areas, indigenous territories, and primary forests, are:

  • Punino River, located between Napo and Orellana provinces, has experienced the rapid mining deforestation expansion of 217 hectares since 2019.
    l
  • Yutzupino, located in Napo province, has experienced mining deforestation of 125 hectares since 2021. Surrounding sites in Napo have added 490 hectares since 2017.
    l
  • Shuar Arutam Indigenous Territory, located in Morona Santiago province, has experienced 257 hectares of mining deforestation since 2021.
    l
  • Podocarpus National Park, located in Zamora Chinchipe province, has experienced 25 hectares of mining deforestation within the park since 2019.
    k
  • Upper Nangaritza River Protected Forest, also located in Zamora Chinchipe has experienced 545 hectares of mining deforestation since 2018.

In total, we have documented the recent gold mining deforestation of 1,660 hectares (4,102 acres) in the Ecuadorian Amazon. This is equivalent to 2,325 soccer fields.

For each case, we show high-resolution satellite images of the recent gold mining deforestation.

Case Studies – Recent Gold Mining Deforestation in the Ecuadorian Amazon

For each of the five cases presented below, we show both a high-resolution (3 meters) example of the recent mining deforestation (left panel) and very-high resolution (0.5 meters) zoom of the mining activity (right panel).

Punino River

Along the Punino River, located between Napo and Orellana provinces, we have documented the rapid mining deforestation expansion of 217 hectares since November 2019. Alarmingly, much of this activity (85%) occurred most recently in 2022. See MAAP #176 for more details.

Case 1. Punino River.

Yutzupino/Napo

In this area, located in Napo province, we have documented the mining deforestation of 125 hectares since October 2021, including major impacts along the Jatunyacu River. Surrounding sites in Napo have added 490 hectares since 2017. See MAAP #151 and MAAP #162 for more details.

Case 2. Yutzupino/Napo.

Upper Nangaritza River Protected Forest

In Upper Nangaritza River Protected Forest, also located in Zamora Chinchipe province, we have documented the mining deforestation of 545 hectares since 2018 along the Nangaritza River. See MAAP #167 for more details.

Case 3. Upper Nangaritza River Protected Forest.

Shuar Arutam Indigenous Territory

In the Shuar Arutam Indigenous Territory, located in Morona Santiago province, we have documented the mining deforestation of 257 hectares since 2021. See MAAP #170 for more details.

Case 4. Shuar Arutam Indigenous Territory.

Podocarpus National Park

In Podocarpus National Park, located in Zamora Chinchipe province, we have documented the mining deforestation of 25 hectares since 2019 within the park, including the presence of over 200 mining camps. See MAAP #172 for more details.

Case 5. Podocarpus National Park.

*MAAP Technical Reports

MAAP #176: Expansión Alarmante de Minería en la Amazonía Ecuatoriana (Caso Punino)
https://www.maapprogram.org/2023/mineria-ecuador-punino/

MAAP #172: Minería ilegal de oro en el Parque Nacional Podocarpus, Ecuador
https://www.maapprogram.org/2023/mineria-podocarpus-ecuador/

MAAP #170: Actividad Minera en Territorio Shuar Arutam (Amazonia Ecuatoriana)
https://www.maapprogram.org/2022/mineria-shuar-arutam-ecuador/

MAAP #167: Actividad Minera en el Bosque Protector Cuenca Alta del Río Nangaritza (Ecuador)
https://www.maapprogram.org/2022/minera-nangaritza-ecuador/

MAAP #162: Dinámica de la actividad minera en la  provincia de Napo (Ecuador)
https://www.maapprogram.org/2022/mineria-napo-ecuador/

MAAP #151: Minería Ilegal en la Amazonía Ecuatoriana
https://www.maapprogram.org/2022/mineria-ecuador/

Acknowledgments

This report is part of a series focused on the Ecuadorian Amazon through a strategic collaboration between the organizations Fundación EcoCiencia and Amazon Conservation, with the support of the Norwegian Agency for Development Cooperation (Norad).

MAAP #181: Illegal Gold Mining in Yanomami Indigenous Territory (Brazil)

Base Map. Illegal mining deforestation alerts in Yanomami Indigenous Territory (northern Brazilian Amazon).

The Brazilian government recently launched a series of raids against illegal gold mining in Yanomami Indigenous Territory, located in the northern Brazilian Amazon (see inset of Base Map).

These raids highlight the severe consequences brought by illegal mining activity, particularly deforestation, contamination, malnutrition, and disease.

Here we present the results of a new machine learning algorithm that analyzes satellite imagery archives across large areas to quickly and precisely detect new gold mining deforestation fronts.

The resolution of these mining deforestation alerts is 10 meters, based on the European Space Agency’s freely available Sentinel-2 satellite imagery data.

These alerts reveal the extent of the gold mining deforestation in Yanomami Indigenous Territory is much greater than realized (see Base Map).

In the Base Map, the red dots indicate the most recent gold mining deforestation alerts, occurring in 2022.

Note that while the raids appear to be concentrated along the Uraricoera River, active gold mining deforestation is actually occurring all throughout the vast northern section of the territory, including the Parima and Mucajai Rivers as well.

We estimate the new gold mining deforestation of over 2,000 hectares since 2019. Much of this deforestation (67%, or 1,350 hectares) occurred most recently in 2022.

Below, we show five examples of this recent gold mining deforestation with high-resolution satellite imagery (3 meters) that confirm the alert detections.

Zooms of Illegal Gold Mining Deforestation, 2020 – 2022

Below, we show five examples of this recent gold mining deforestation with high-resolution (3 meter) satellite imagery that confirm the alert detections (see insets A-E in the Base Map). Note that two of the examples are on the the Uraricoera River, while the other three examples are from other parts of the territory.

Zoom A

Zoom B

Zoom C

Zoom D

Zoom E

Methodology

Gold mining deforestation alerts were generated by Amazon Mining Watch’s updated machine learning algorithim based on Sentinel-2 satellite imagery data.

The Amazon Mining Watch is a partnership between the Pulitzer Center´s Rainforest Investigations Network and Earthrise Media. These two nonprofit organizations have joined forces to bring together the power of machine learning and investigative journalism to shed light on large-scale environmental problems in the Amazon.


MAAP #180: Mennonites & Soy Deforestation in the Bolivian Amazon

Base Map. Soy deforestation by Mennonite colonies in the Bolivian Amazon.

We continue with the second part in our series on soy deforestation in the Bolivian Amazon.

In the first part, see MAAP #179, we documented the massive soy-driven deforestation of 904,518 hectares (2.2 million acres) between 2001 and 2021 in the Bolivian Amazon.

During this time period, a large number of farming-based Mennonite colonies have been established in the southern Bolivian Amazon, helping drive the increase in soybean expansion in the region.1,2

Here, we incorporate colony location data to estimate the role of Mennonite colonies in this soy deforestation.

In summary, we find that Mennonites have caused a third (33%) of the soy deforestation in the Bolivian Amazon over the past 5 years (see Base Map).

Overall, Mennonites caused nearly a quarter (23%) of the total soy deforestation over the past 20 years (210,980 hectares, or 521,344 acres).


Mennonites & Soy Deforestation in the Bolivian Amazon

We estimate that Mennonite colonies have caused the deforestation of 210,980 hectares (521,344 acres) for soy expansion in the Bolivian Amazon between 2001 and 2021 (see Base Map). This accounts for 23% of the total soybean deforestation in Bolivia over the past 20 years.

This Mennonite-driven soy deforestation peaked in 2016 (31,728 hectares), following a previous peak in 2008 (see Graph 1). In general, note that Mennonite soy deforestation has been relatively high (>2,000 hectares) every year from 2001 to 2020.

Focusing on just the past five years (2017-21), Mennonites have cleared 33,234 hectares (82,123 acres). This represents an increase to 33% of the total soybean deforestation during this time period.

Graph 1. Soy deforestation caused by Mennonites in the Bolivian Amazon, 2001-2021.

Satellite Images of Mennonite Colonies in the Bolivian Amazon

We present a series of recent satellite images showing examples of Mennonite colonies in the Bolivian Amazon. See the Base Map above for the location of the three zooms (A-C). Note that they are made up of highly-organized and connected agricultural plots that have been created following deforestation events over the past 20 years.

Methodology

For this series of reports, we employed a three-part methodology.

First, we mapped out “soy planted area” for 2001 to 2021 based on the data from Song et al 2021. This data is available on the University of Maryland’s GLAD site “Commodity Crop Mapping and Monitoring in South America.”3

Second, on top of the soy planted area noted above, we mapped out forest loss for 2001 to 2021, also based on data from the University of Maryland.4 This served as our estimate of soy-driven deforestation.

Third, on top of the soy planted area noted above, we incorporated an additional dataset from a recent study on the expansion of Mennonite colonies in Latin America.1 Spatial data from this study available here. We then estimated forest loss for these select Mennonite soy areas.

References

1Yann le Polain de Waroux, Janice Neumann, Anna O’Driscoll & Kerstin Schreiber (2021) Pious pioneers: the expansion of Mennonite colonies in Latin America, Journal of Land Use Science, 16:1, 1-17, DOI: 10.1080/1747423X.2020.1855266

2Nobbs-Thiessen, B. (2020). Landscape of Migration. The University of North Carolina Press.

3Song, X.P., M.C. Hansen, P. Potopov, B. Adusei, J. Pickering, M. Adami, A. Lima, V. Zalles, S.V. Stehman, D.M. Di Bella, C.M. Cecilia, E.J. Copati, L.B. Fernandes, A. Hernandez-Serna, S.M. Jantz, A.H. Pickens, S. Turubanova, and A. Tyukavina. 2021. Massive soybean expansion in South America since 2000 and implications for conservation.

4Hansen, M. C., P. V. Potapov, R. Moore, M. Hancher, S. A. Turubanova, A. Tyukavina, D. Thau, S. V. Stehman, S. J. Goetz, T. R. Loveland, A. Kommareddy, A. Egorov, L. Chini, C. O. Justice, and J. R. G. Townshend. 2013. “High-Resolution Global Maps of 21st-Century Forest Cover Change.” Science 342 (15 November): 850–53. Data available from: earthenginepartners.appspot.com/science-2013-global-forest.

Acknowledgements

These reports are part of a series focused on the Bolivian Amazon through a strategic collaboration between the sister organizations Amazon Conservation in Bolivia (ACEAA) and Amazon Conservation in the U.S.

Citation 

Finer M, Ariñez A (2023) Mennonites & Soy Deforestation in the Bolivian Amazon. MAAP #179.

MAAP #179: Soy Deforestation in the Bolivian Amazon

Base Map. Soy-driven deforestation in the Bolivian Amazon, 2001-2021. Click on map to enlarge.

It is generally known that commodities such as oil palm, soy, and cattle are major tropical deforestation drivers, but concise estimates are often difficult.

New satellite-based datasets are improving this situation. Notably, researchers recently published the first overview of soybean plantations for South America.1

Here, we use this data to estimate recent soy-driven deforestation in the Bolivian Amazon.

In the second part of this series, see MAAP #180, we incorporate additional data to estimate the role of Mennonite colonies in this soy deforestation.

In summary, we document the massive soy-driven deforestation of 904,518 hectares (2.2 million acres) between 2001 and 2021 in the Bolivian Amazon (see Base Map).

Of this total, Mennonites have caused 23% (210,980 hectares, or 521,344 acres).


Soy Deforestation in the Bolivian Amazon, 2001 – 2021

Soy has covered 2.1 million hectares of the southern Bolivian Amazon over the past 20 years, with current coverage around 1.2 million hectares.

We documented an extremely high level of soy-driven deforestation in the Bolivian Amazon: 904,518 hectares (2.2 million acres) between 2001 and 2021 (see Base Map above). This is a massive area, similar to the size of the U.S. state of Vermont.

This soy deforestation peaked in 2008 (92,000 hectares), but has been high (>18,000 hectares) every year between 2001 and 2019, meaning this is a long-running and persistent issue.

The vast majority of the total deforestation occurred in the Santa Cruz department, plus a small corner of adjacent Beni department.

Below, Figure 1 shows the overall massive soy deforestation over the past 20 years in the Bolivian Amazon, comparing 2001 (left panel) with 2021 (right panel).

Figure 1. Soy deforestation in the Bolivian Amazon, 2001 vs 2021.

Soy Deforestation in the Bolivian Amazon, 2017 – 2021

Of the total soy deforestation noted above, 11% (101,188 hectares, or 250,000 acres) occurred in just the past 5 years (2017-21).

Below, Figures 2-4 show examples of this recent soy deforestation, comparing 2017 (left panel) with 2021 (right panel). See the Base Map above for locations of insets A-C.

Figure 2. Soy deforestation in the Bolivian Amazon, 2017 vs 2021.
Figure 3. Soy deforestation in the Bolivian Amazon, 2017 vs 2021.
Figure 4. Soy deforestation in the Bolivian Amazon, 2017 vs 2021.

Methodology

For this series of reports, we employed a three-part methodology.

First, we mapped out “soy planted area” for 2001 to 2021 based on the data from Song et al 2021.1 This data is available on the University of Maryland’s GLAD site “Commodity Crop Mapping and Monitoring in South America.”

Second, on top of the soy planted area noted above, we mapped out forest loss for 2001 to 2021, also based on data from the University of Maryland.2 This served as our estimate of soy-driven deforestation.

Third, on top of the soy planted area noted above, we incorporated an additional dataset from a recent study on the expansion of Mennonite colonies in Latin America. 3 Spatial data from this study available here. We then estimated forest loss for these select Mennonite soy areas. See MAAP #180.

References

1Song, X.P., M.C. Hansen, P. Potopov, B. Adusei, J. Pickering, M. Adami, A. Lima, V. Zalles, S.V. Stehman, D.M. Di Bella, C.M. Cecilia, E.J. Copati, L.B. Fernandes, A. Hernandez-Serna, S.M. Jantz, A.H. Pickens, S. Turubanova, and A. Tyukavina. 2021. Massive soybean expansion in South America since 2000 and implications for conservation.

2Hansen, M. C., P. V. Potapov, R. Moore, M. Hancher, S. A. Turubanova, A. Tyukavina, D. Thau, S. V. Stehman, S. J. Goetz, T. R. Loveland, A. Kommareddy, A. Egorov, L. Chini, C. O. Justice, and J. R. G. Townshend. 2013. “High-Resolution Global Maps of 21st-Century Forest Cover Change.” Science 342 (15 November): 850–53. Data available from: earthenginepartners.appspot.com/science-2013-global-forest.

3Yann le Polain de Waroux, Janice Neumann, Anna O’Driscoll & Kerstin Schreiber (2021) Pious pioneers: the expansion of Mennonite colonies in Latin America, Journal of Land Use Science, 16:1, 1-17, DOI: 10.1080/1747423X.2020.1855266

Acknowledgements

These reports are part of a series focused on the Bolivian Amazon through a strategic collaboration between the sister organizations Amazon Conservation in Bolivia (ACEAA) and Amazon Conservation in the U.S.

Citation

Finer M, Ariñez A (2023) Soy Deforestation in the Bolivian Amazon. MAAP #179.

MAAP #173: Rapid Increase of Mining Deforestation in Yapacana National Park (Venezuelan Amazon)

Base Map. Recent (2021-22) mining deforestation in Yapacana National Park, Venezuelan Amazon. Data: ACA/MAAP, Planet, NICFI.

We continue our series on the Venezuelan Amazon (see MAAP #155), with a special focus on the key protected area of Yapacana National Park.

In recent reports, we showed that Yapacana is currently experiencing intense illegal mining activity with likely thousands of miners (see MAAP #156), including on top of the sacred Yapacana Tepui (see MAAP #169).

Here, we focus on the most active mining zone, located in the southwestern part of the park surrounding the tepui, where mining deforestation has escalated rapidly over the past two years.

We found the new deforestation of over 750 hectares (1,870 acres) within this sector of Yapacana National Park between 2021 and 2022.

The Base Map illustrates this result, with red and yellow showing 2022 and 2021 deforestation, respectively.

Note that some of the recent deforestation (6 hectares) has occurred on top of the tepui.

Below, we zoom in and show this recent deforestation with high-resolution satellite imagery.


Deforestation 2021-22 in Yapacana National Park

Figure 1 shows the deforestation of 757 hectares between December 2020 (left panel) and October 2022 (right panel) in the southern part of Yapacana National Park surrounding Yapacana Tepui. The arrows point to the major zones before (green) and after (orange) deforestation. The Letters A-D correspond the four zooms below.

Figure 1. Recent deforestation in Yapacana National Park. The arrows point to the major zones before (green) and after (orange) deforestation. The Letters A-D correspond the four zooms below. Data: ACA/MAAP, Planet, NICFI.

Zoom A

Zoom A. Data: ACA/MAAP, Planet, NICFI

Zoom B

Zoom B. Data: ACA/MAAP, Planet, NICFI

Zoom C

Zoom C. Data: ACA/MAAP, Planet, NICFI

Zoom D

Zoom D shows the deforestation of 4 hectares between December 2020 (left panel) and October 2022 (right panel) on top of Yapacana Tepui within the national park.

Zoom D. Data: ACA/MAAP, Planet, NICFI


Accumulated Deforestation

We estimate the accumulated mining deforestation of 1,537 hectares within this southwestern sector of Yapacana National Park. Thus, nearly half (49%) has occurred most recently in 2021-22.

Of the total accumulated deforestation, 17 hectares has occurred on top of the sacred tepui. Over a third (35%) has has occurred most recently in 2021-22.

Acknowledgements

We thank SOS Orinoco for helpful comments on this report.

Citation

Finer M, Ariñez A (2023) Rapid Increase of Mining Deforestation in Yapacana National Park (Venezuelan Amazon). MAAP: 173.