Gold Mining is one of the major deforestation drivers across the Amazon.*
It often targets remote areas, thus impacting carbon-rich primary forests. Moreover, in most cases, this mining is illegal, given that it is occurring in protected areas and indigenous territories.
Given the vastness of the Amazon, however, it has been a challenge to accurately monitor mining deforestation across the entire biome in a timely manner.
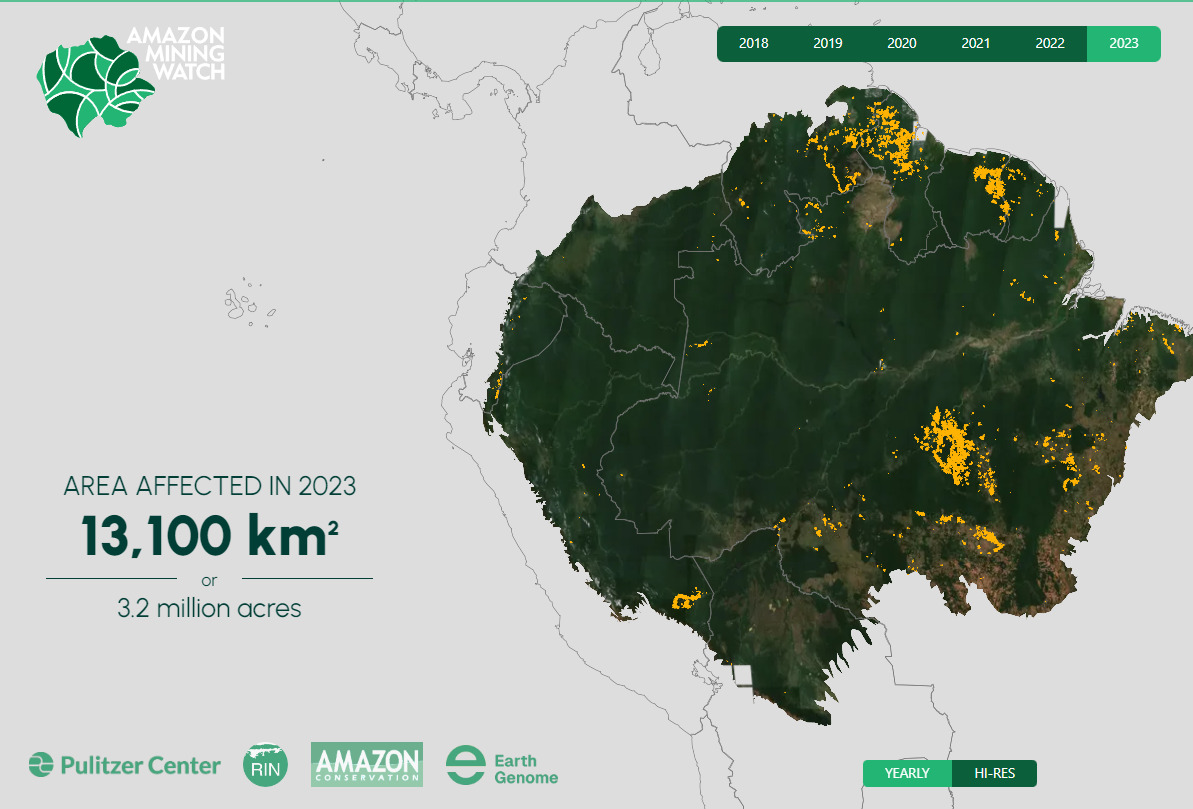
Here we present, for the first time, the results of a new machine learning based tool (known as Amazon Mining Watch) that analyzes satellite imagery archives to detect mining deforestation across the entire Amazon.
Specifically, the tool produces 10-meter resolution mining deforestation alerts based on the European Space Agency’s Sentinel-2 satellite imagery. The alerts currently cover each year annually from 2018 to 2023.
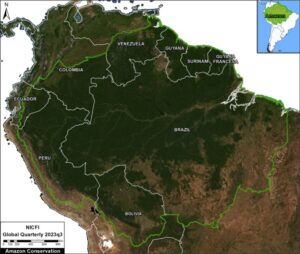
This data reveals that gold mining is actively causing deforestation in all nine countries of the Amazon Biome (see Base Map below). The countries with the most overall mining deforestation are 1) Brazil, 2) Guyana, 3) Suriname, 4) Venezuela, and 5) Peru.
*Note that in this report we focus on mining activity that is causing deforestation. Additional critical gold mining areas in rivers (such as in northern Peru, southeast Colombia, and northwest Brazil; see MAAP #197), are not included in this report or detected/displayed in Amazon Mining Watch.
Major Findings
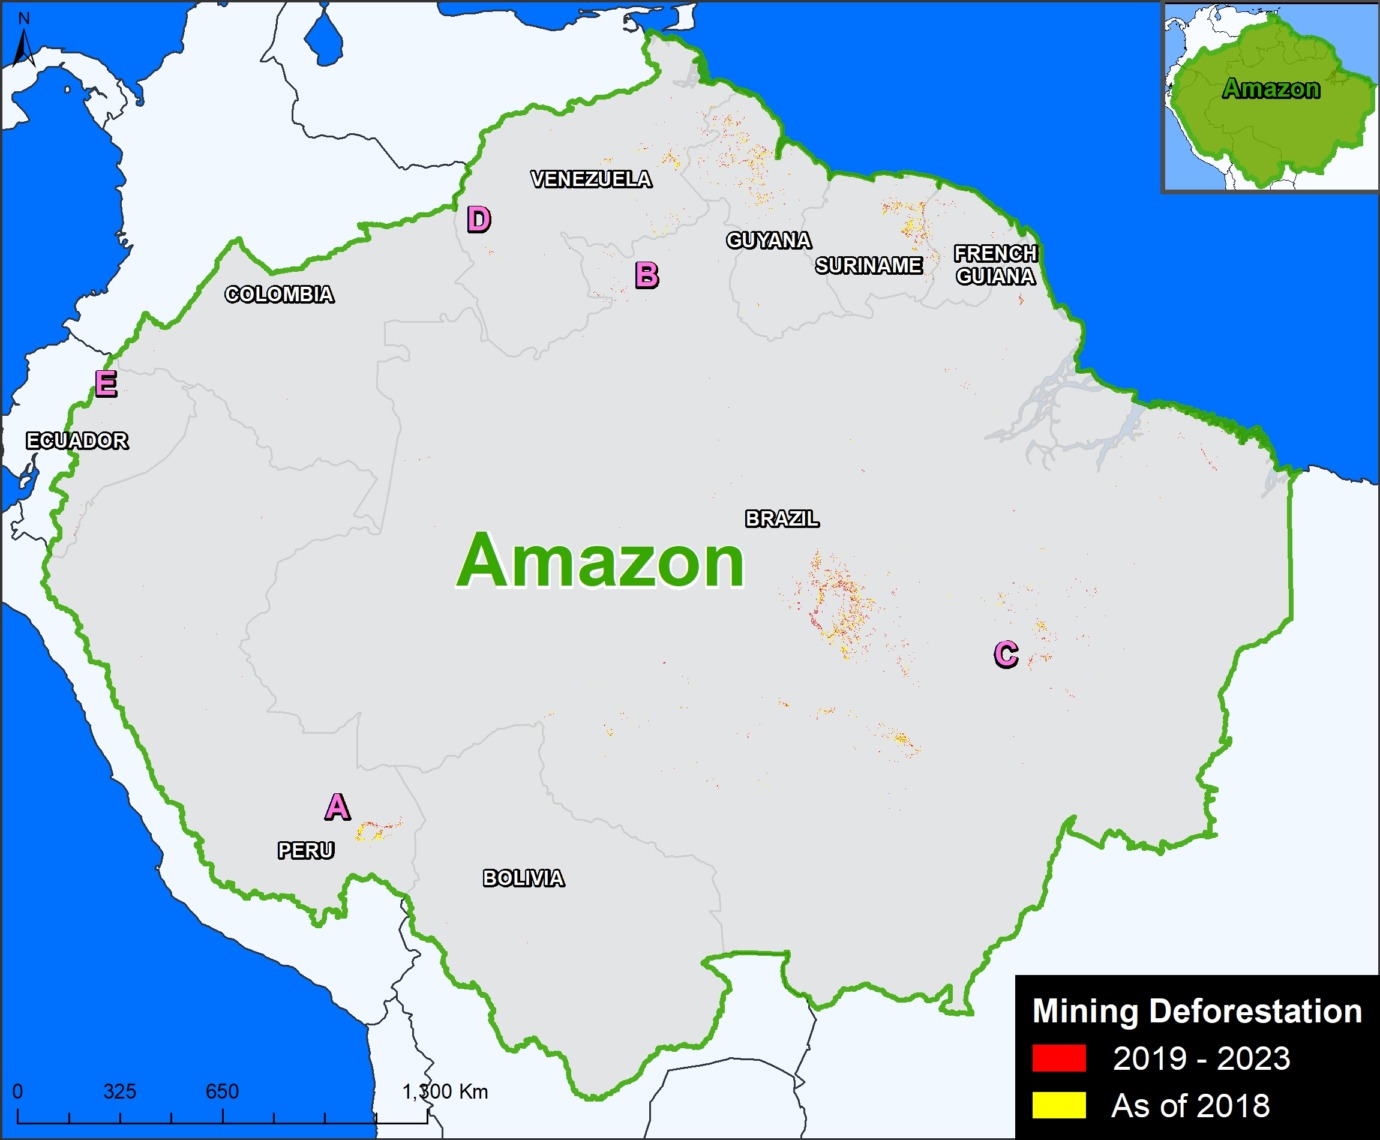
The Base Map below presents the mining deforestation data across the entire Amazon. Note that yellow indicates the historical mining footprint as of 2018, while red indicates the more recent mining deforestation between 2019 and 2023.
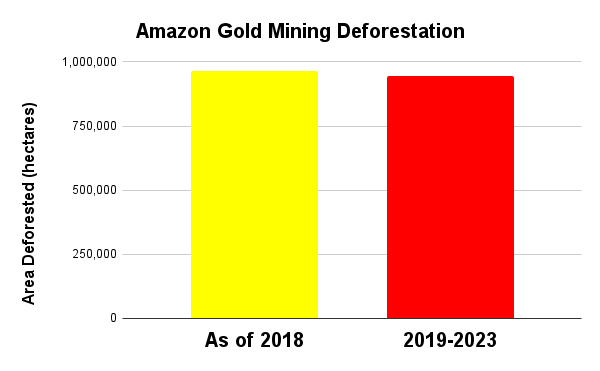
Although the alerts are pixels and not designed for precise area measurements, they can be used to give general estimates. For example, we estimate that as of 2018, there was a historical mining deforestation footprint of over 963,000 hectares across the entire Amazon. Between 2019 and 2023, we estimate that the mining deforestation footprint grew by over 944,000 hectares (2.3 million acres).
Thus, of the total accumulated mining deforestation footprint of over 1.9 million hectares (4.7 million acres), about half has occurred in just the past five years (see Annex).
In addition, we estimate that 38% (725,498 hectares) of the total mining deforestation occurred within protected areas and Indigenous territories.
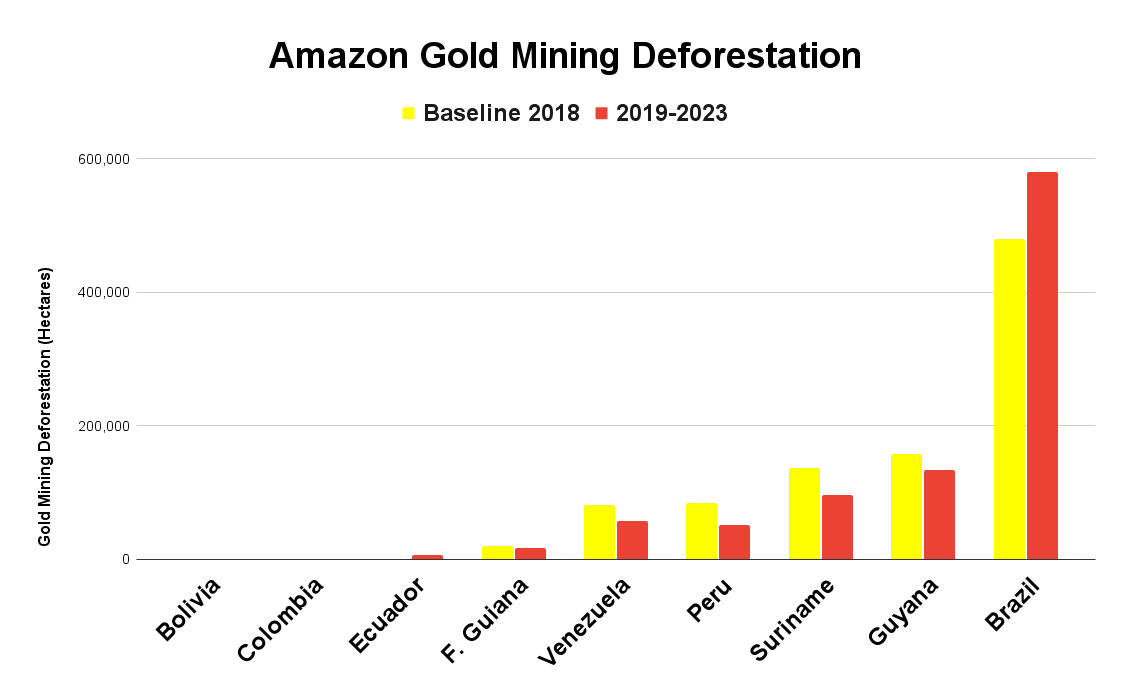
Graph 1 shows, of the total accumulated mining, over half has occurred in Brazil (55%, covering over 1 million hectares), followed by Guyana (15%), Suriname (12%), Venezuela (7%), and Peru (7%, covering 135,625 hectares).
Insets A-E on the Base Map correspond to the case studies described below, which highlight the power of this data to see the evolution of mining deforestation in critical areas, such as Peru, Brazil, Venezuela, and Ecuador.
Case Studies
In this section, we show a number of case studies highlighting the power of this data to see the evolution of mining deforestation in the following critical areas (see Insets A-E on Base Map). In these examples, note that yellow indicates the historical mining footprint as of 2018, purple indicates the expansion from 2019-2021, and red indicates the more recent mining deforestation between 2022 and 2023.
A. Southern Peruvian Amazon
B. Brazilian Amazon – Yanomami Indigenous Territory
C. Brazilian Amazon – Kayapó Indigenous Territory
D. Venezuelan Amazon – Yapacana National Park
E. Ecuadorian Amazon – Punino zone
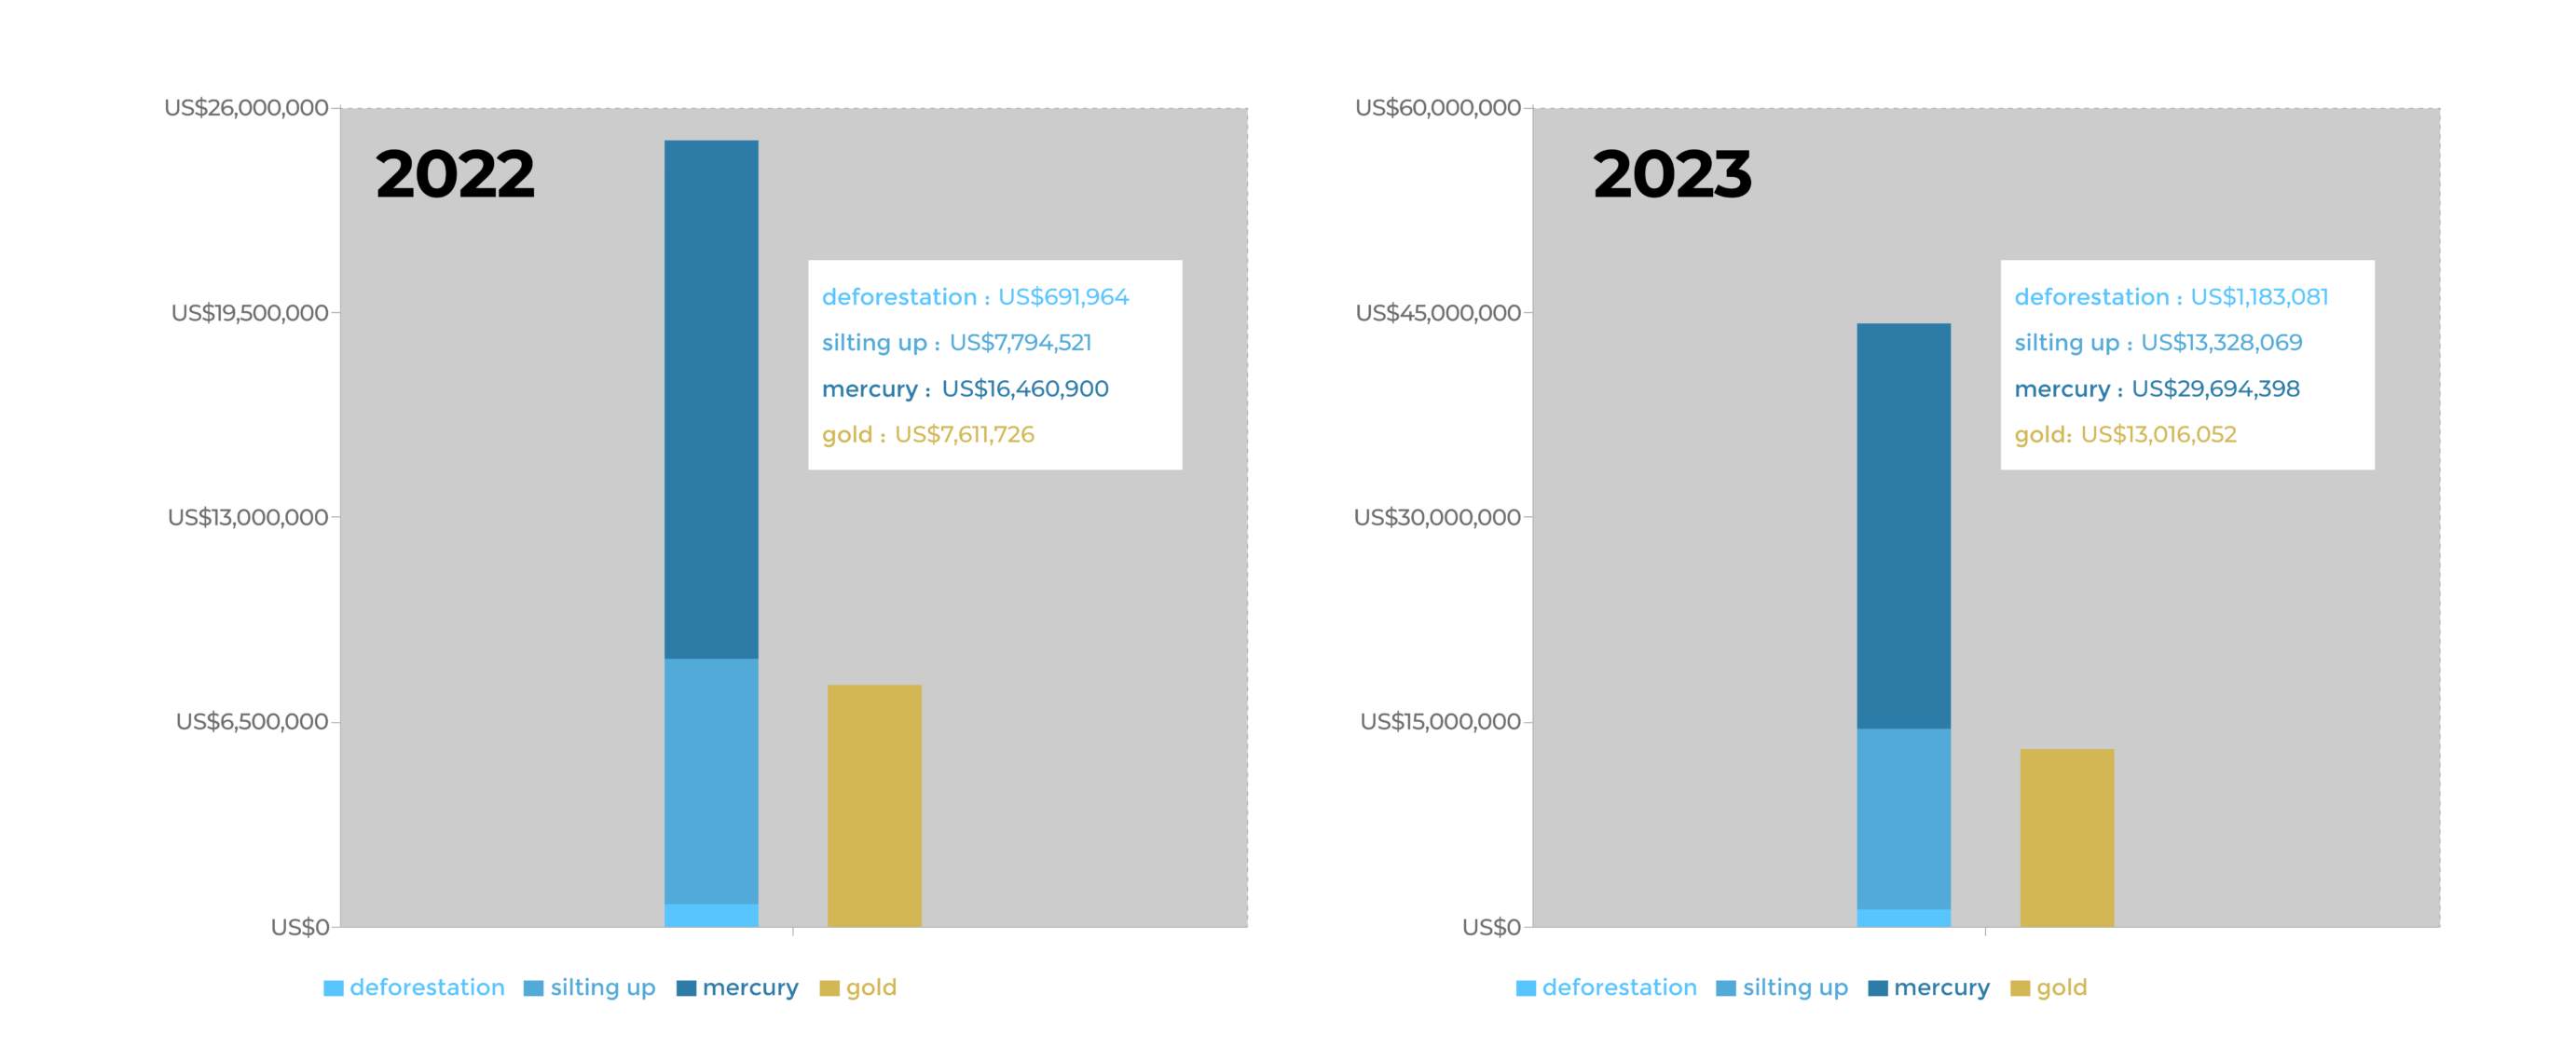
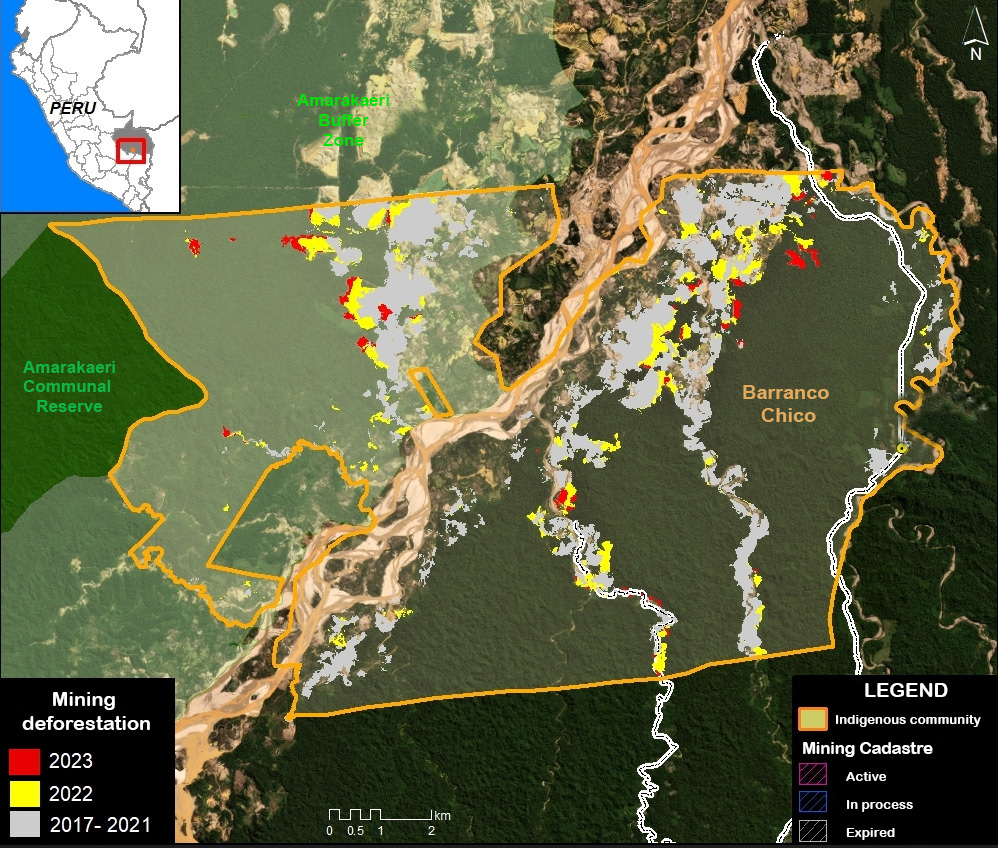
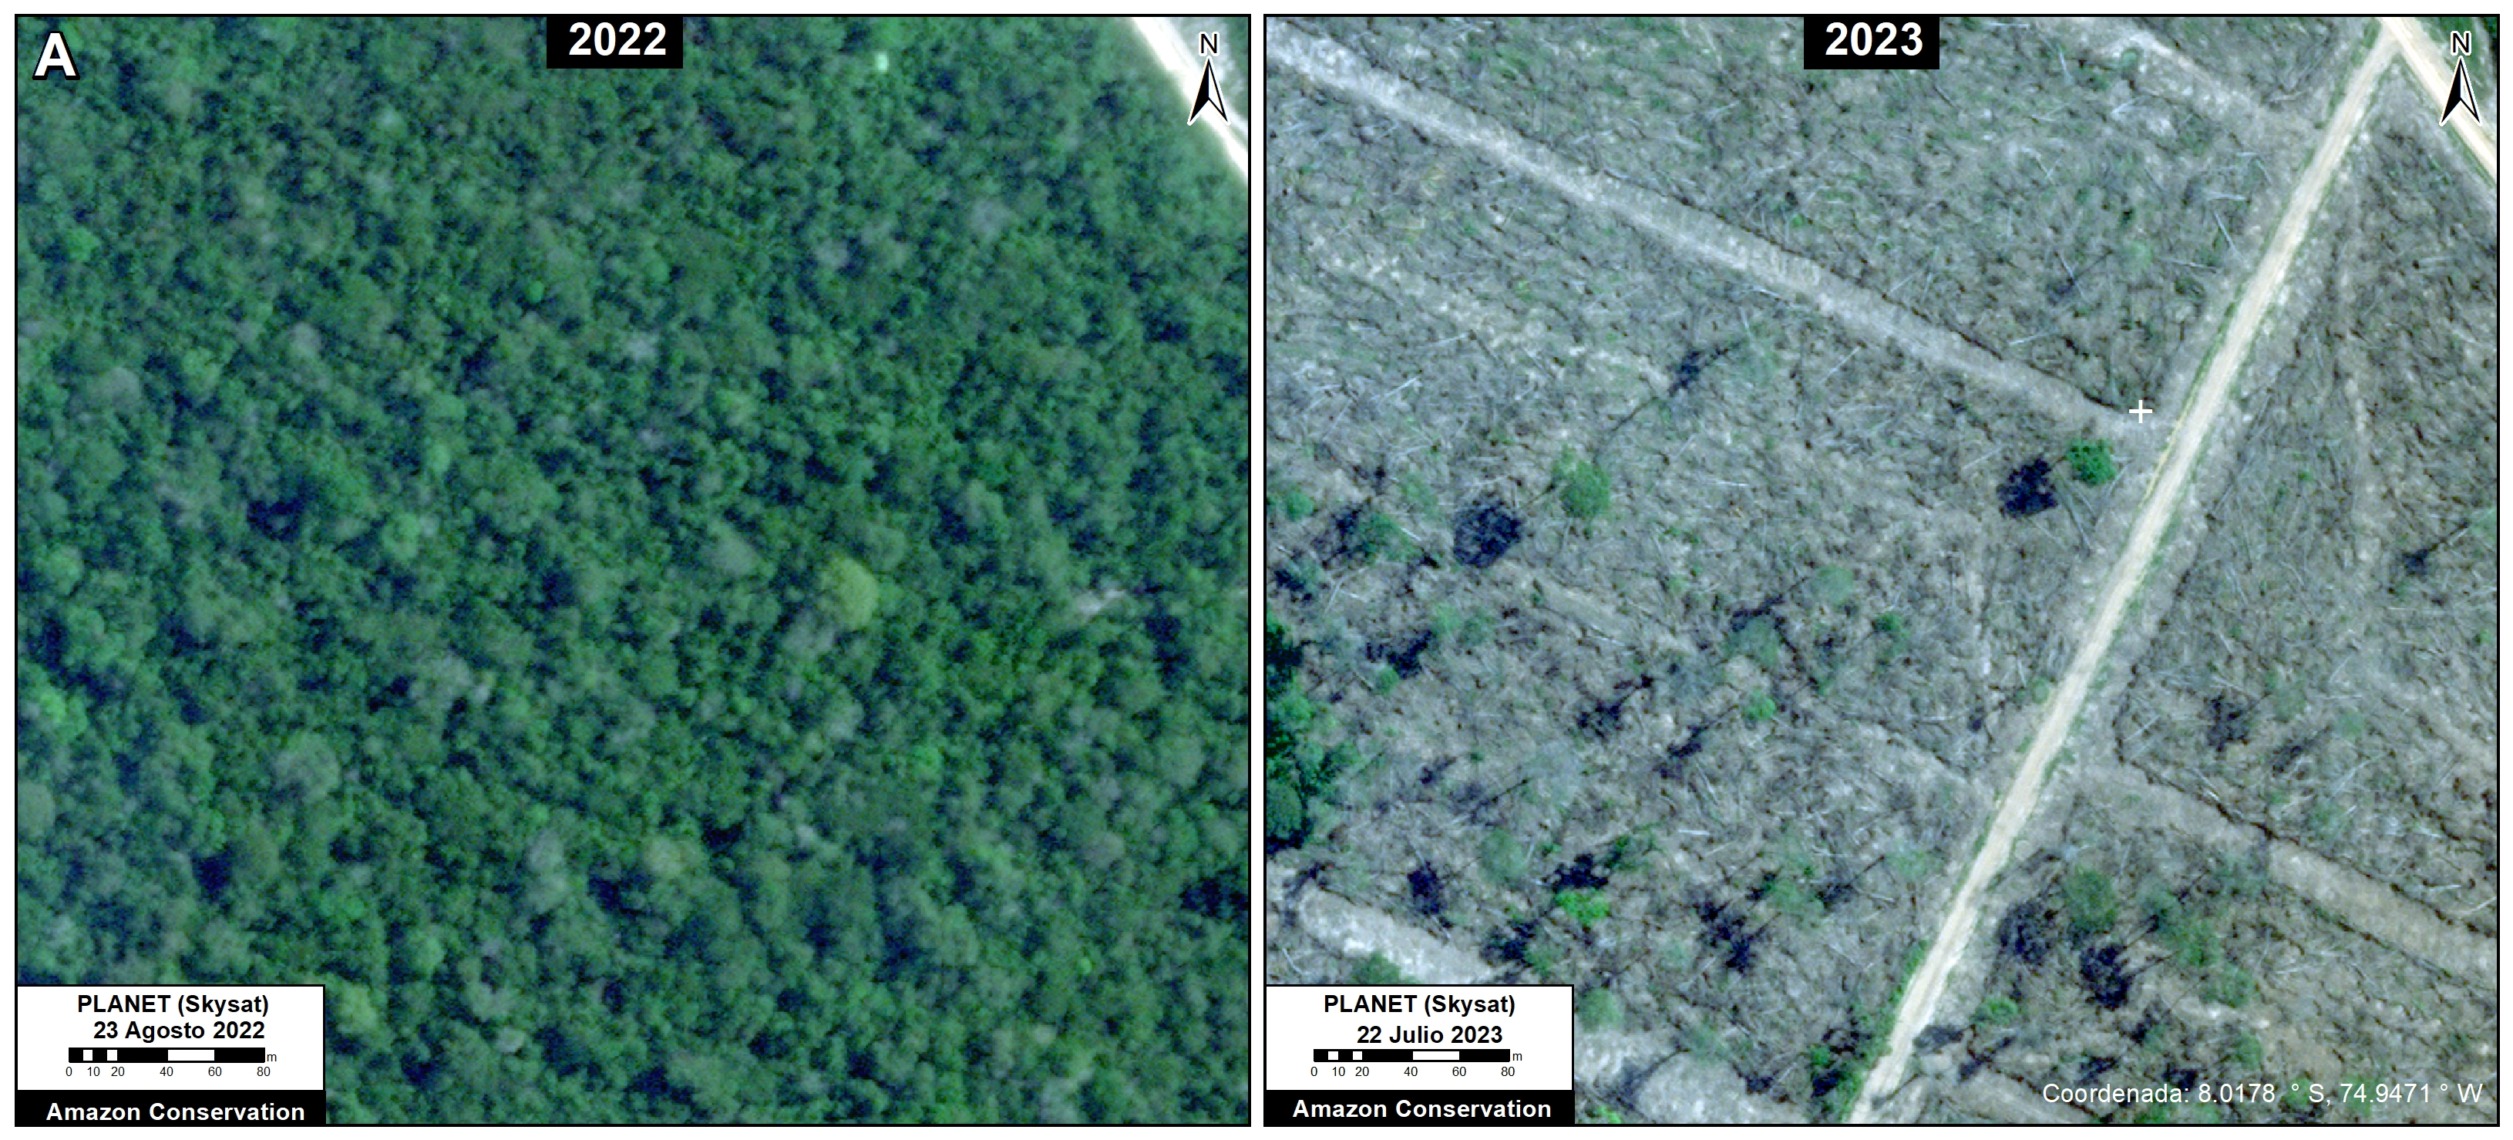
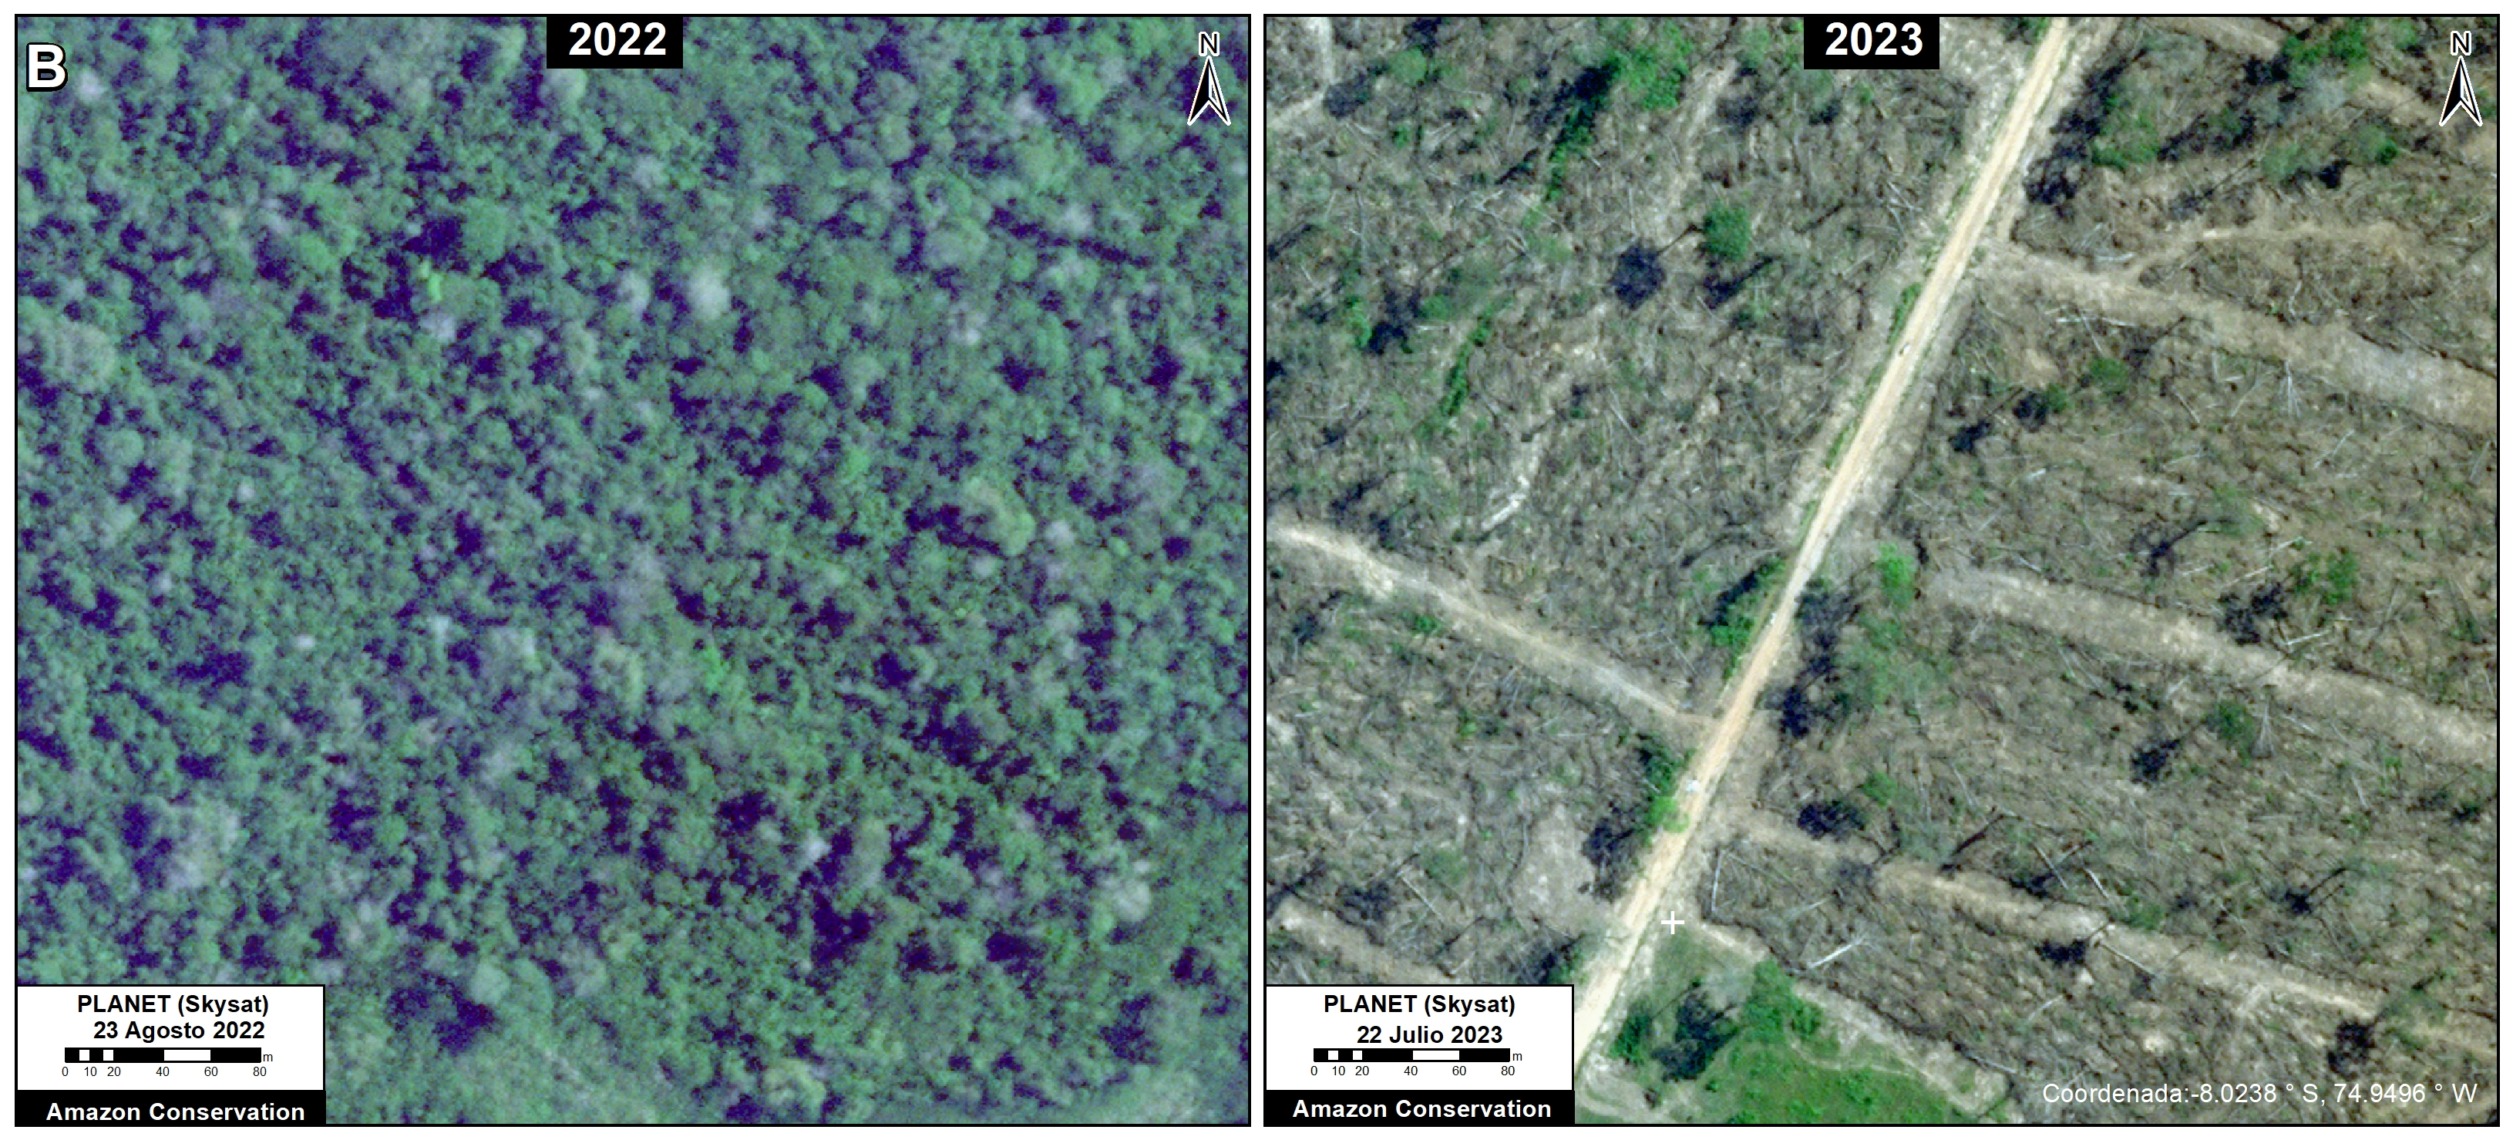
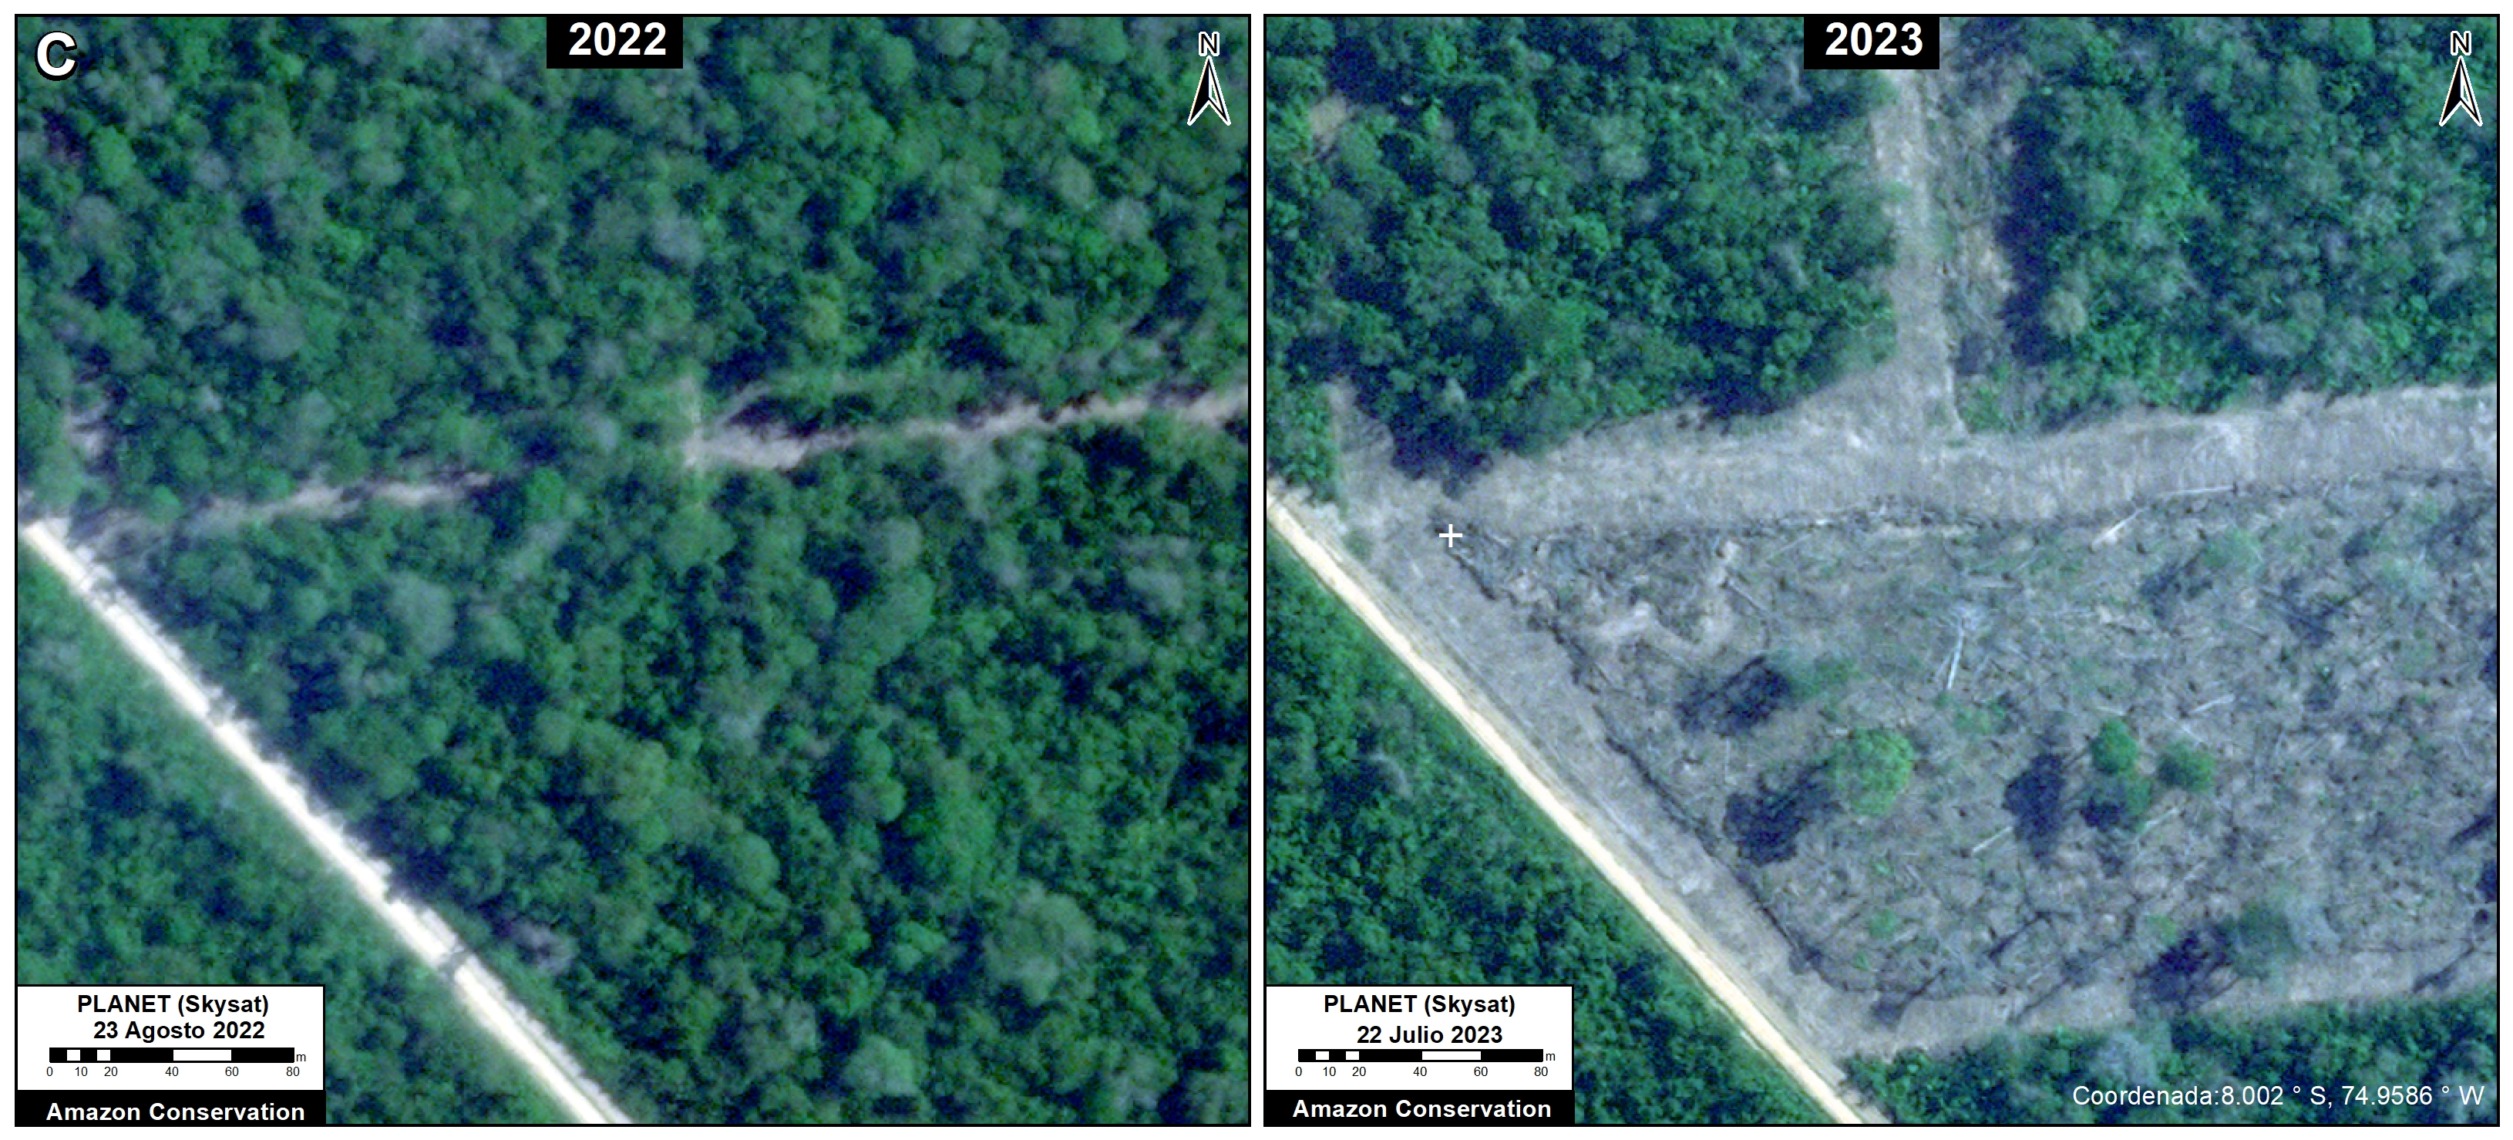
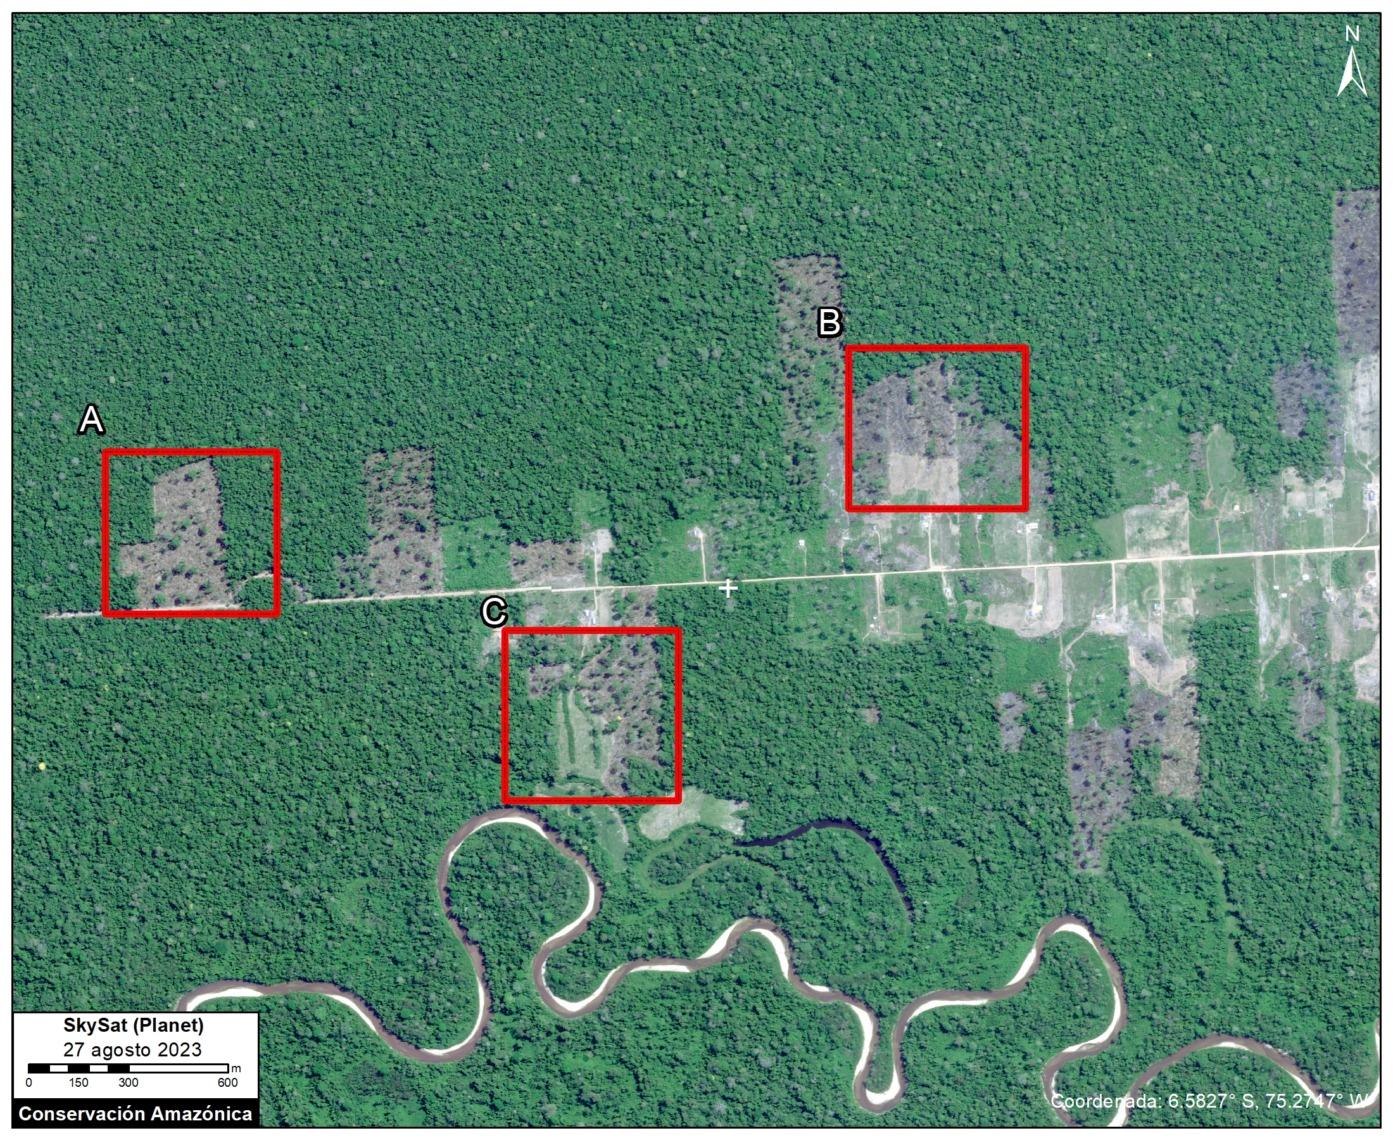
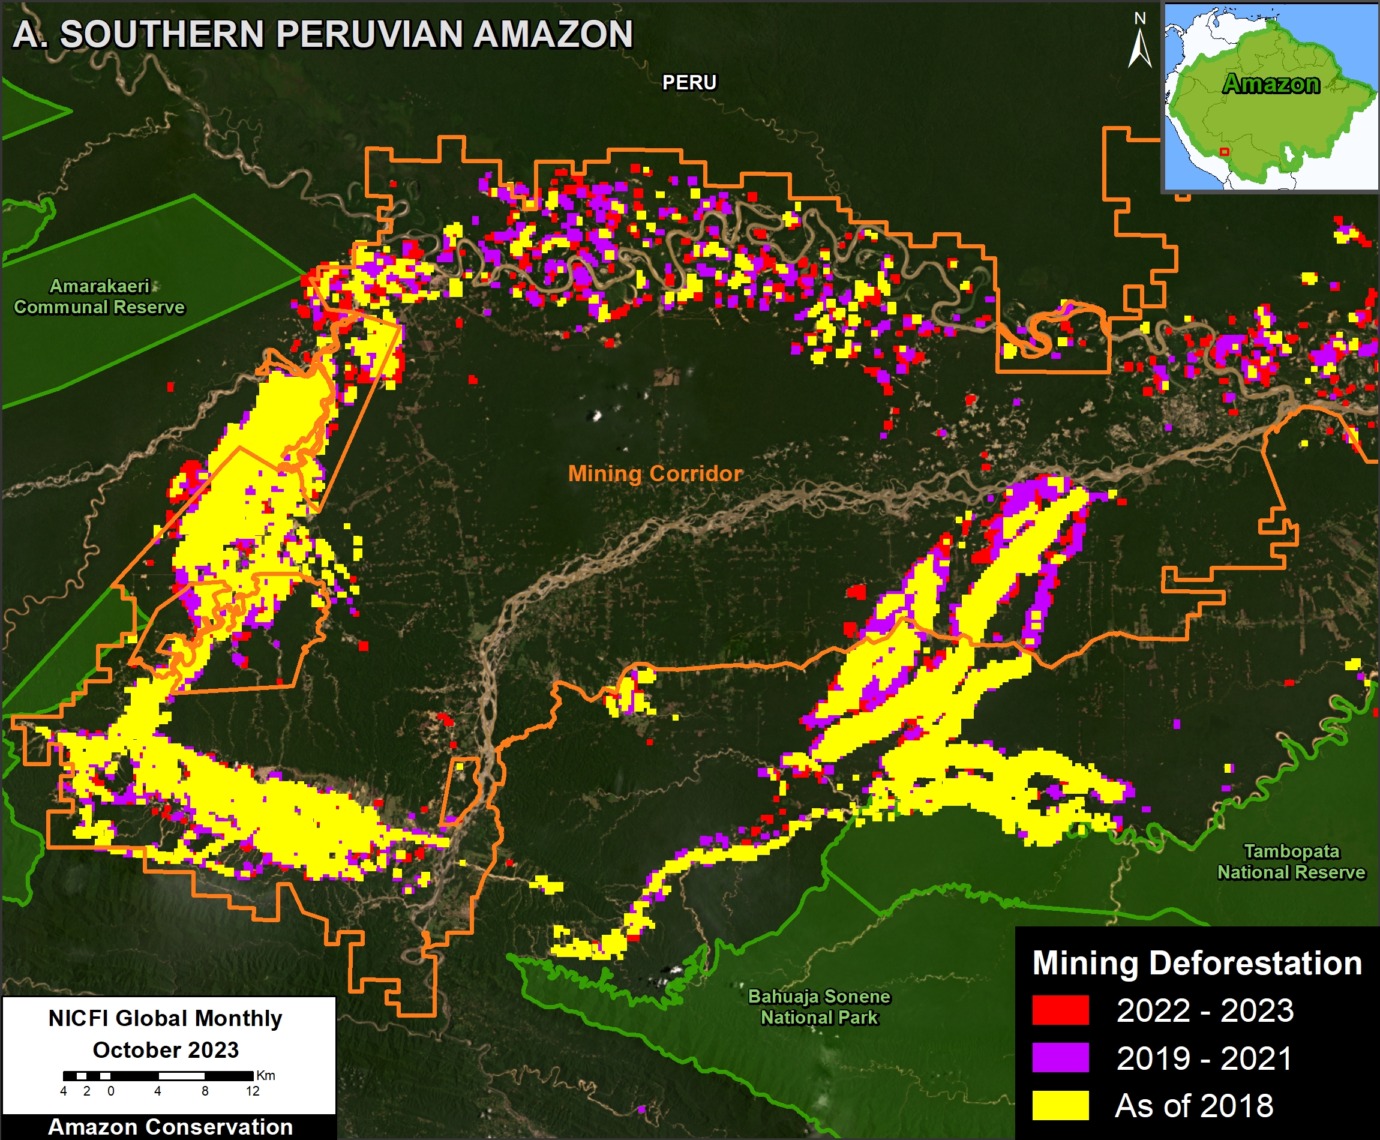
A. Southern Peruvian Amazon
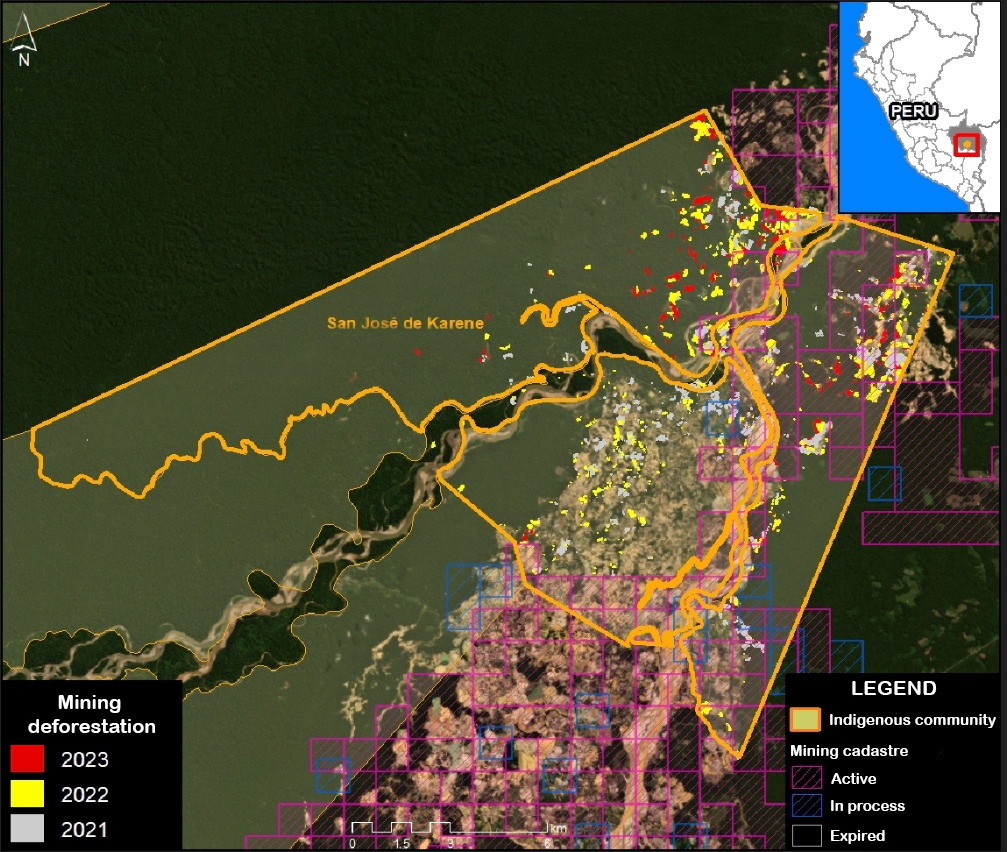
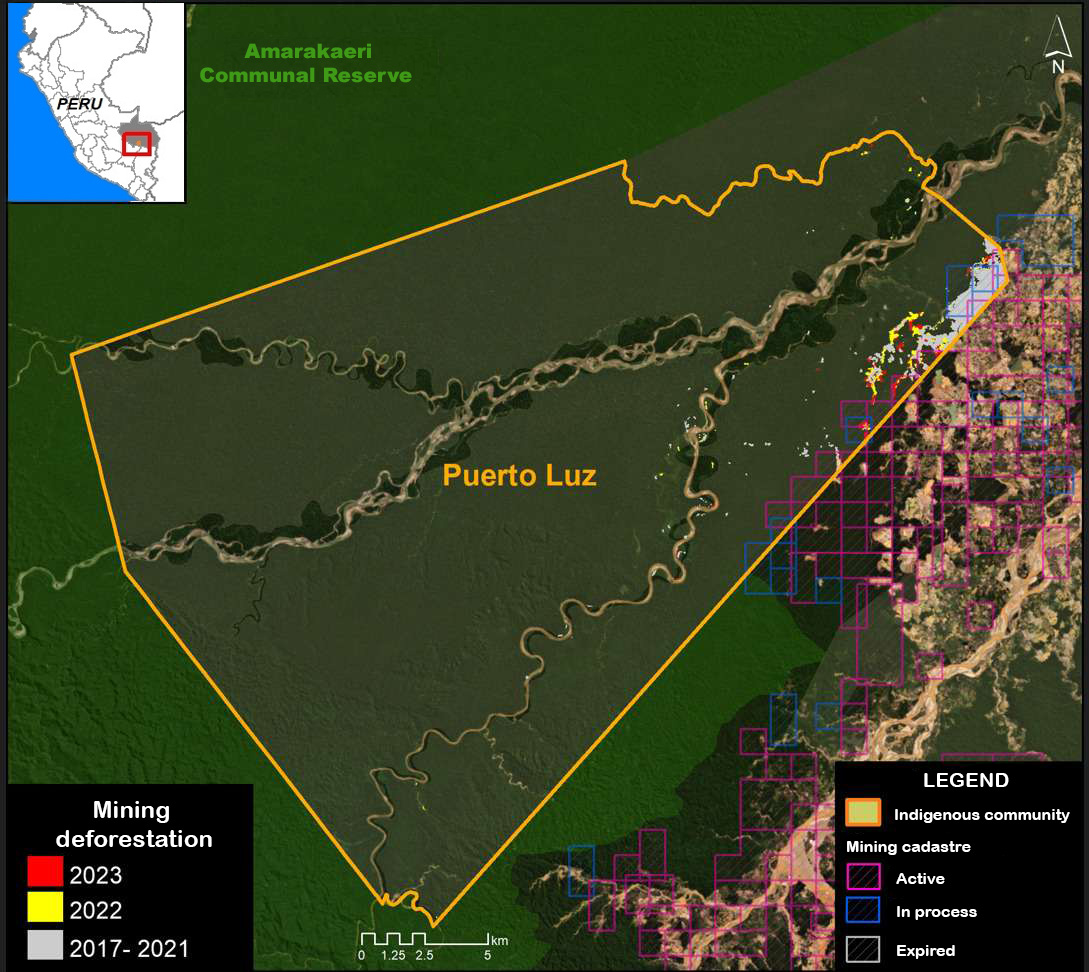
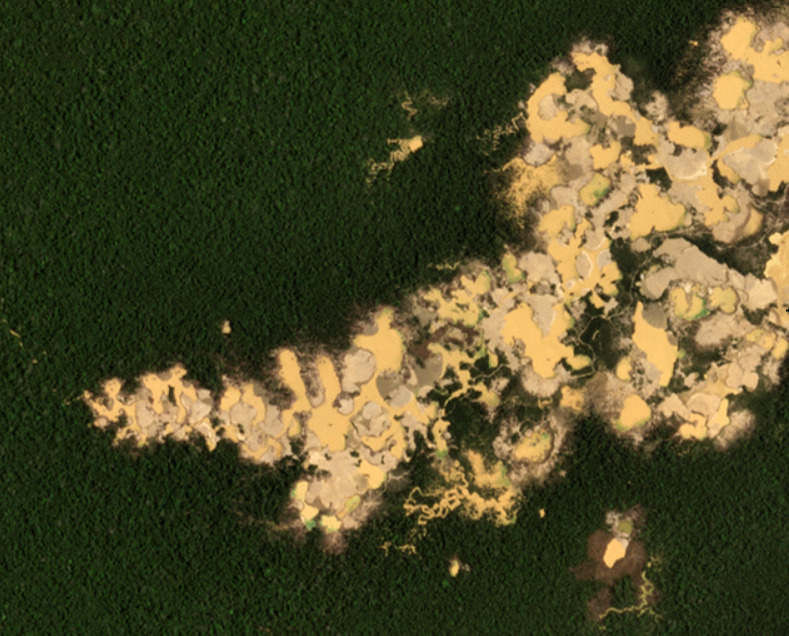
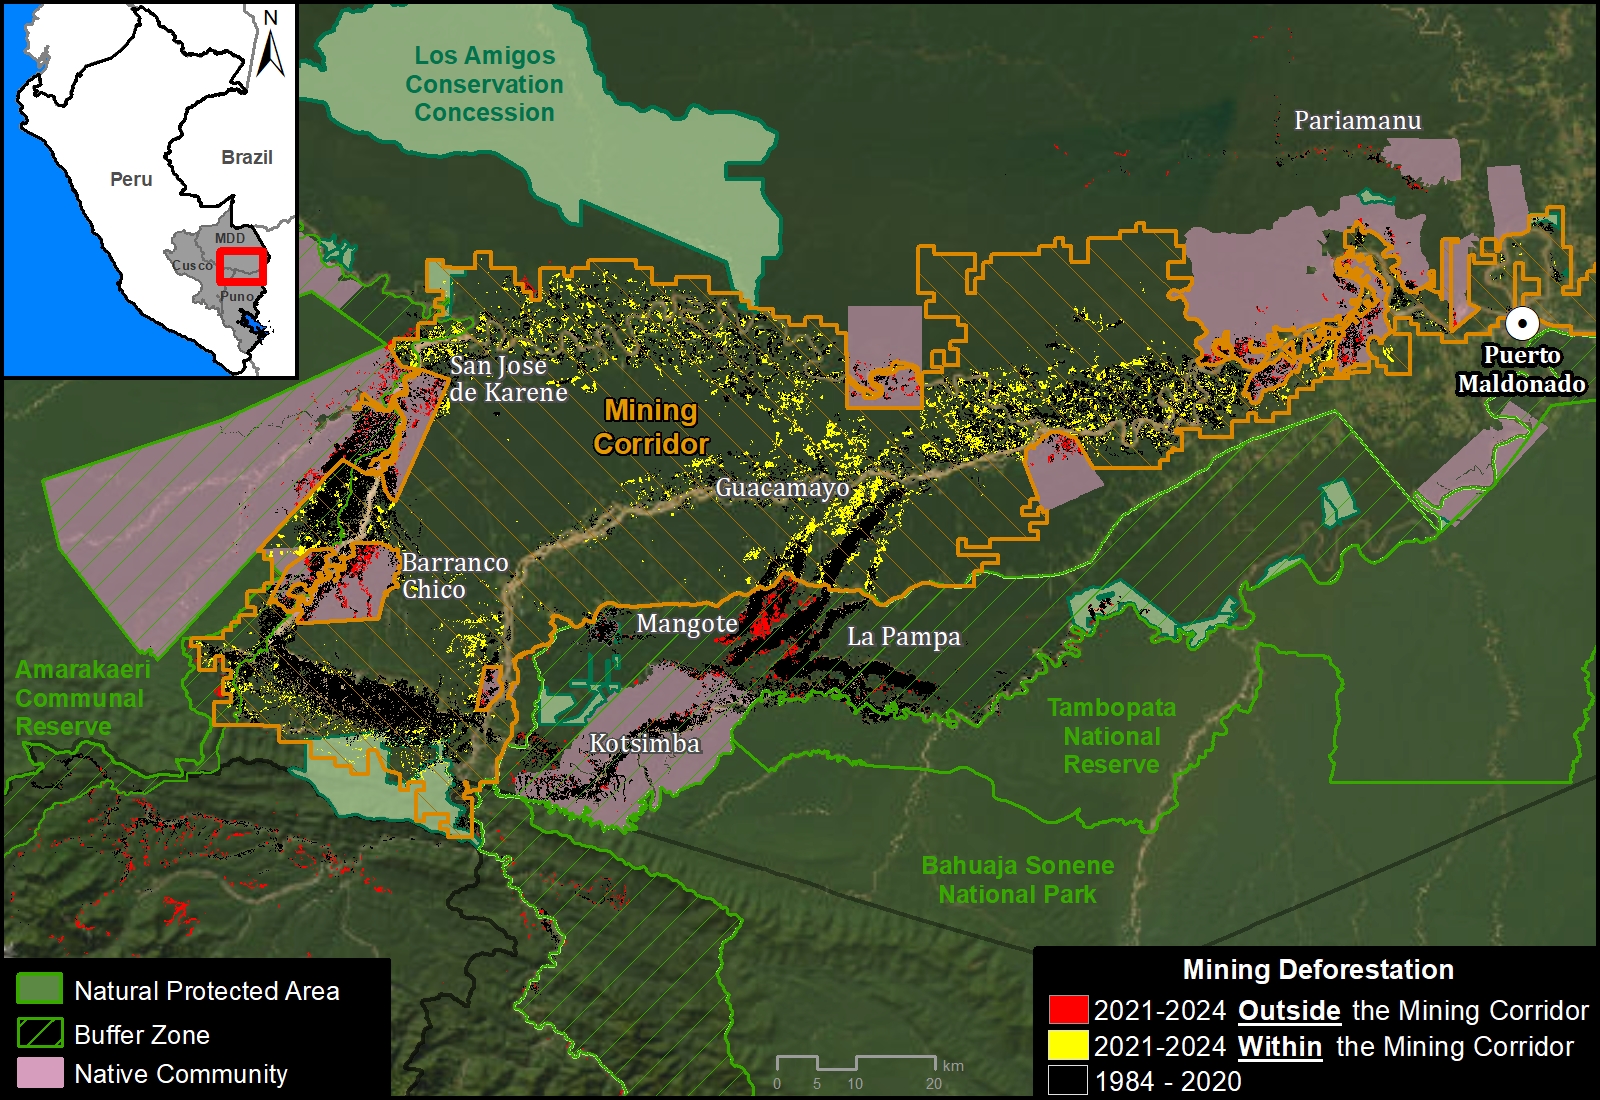
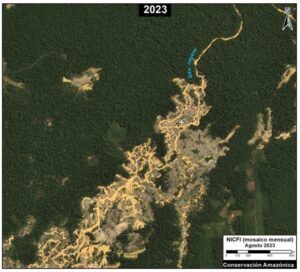
In southern Peru is one of the largest, and likely most emblematic, mining sites in the Amazon (see Inset A in Base Map). Figure 1 shows the dynamic evolution in this area, from several large core mining zones as of 2018, with more recent concentration in the designated Mining Corridor (large area where small-scale mining is permitted by the government as part of a formalization process).
Overall, we recorded over 135,000 hectares (333,590 acres) of mining deforestation in this area. Of this total, 62% (84,000 ha) was present as of 2018, while 38% (51,000 ha) has occurred in just the past five years (2019-2023).
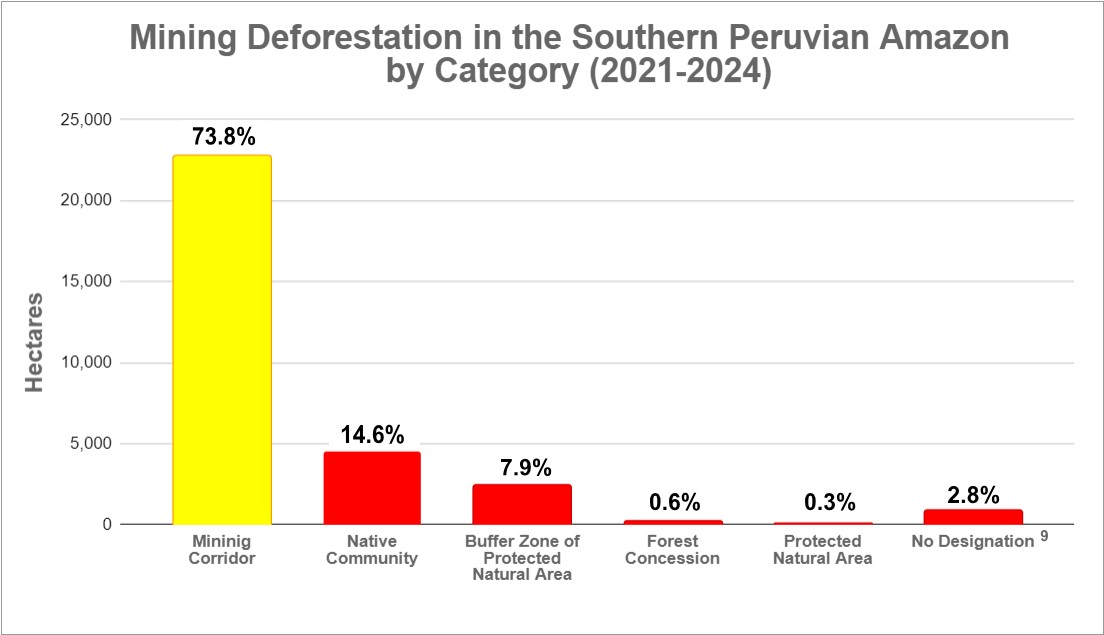
We also highlight that of the total mining deforestation (135,000 ha), 59% has occurred within the Mining Corridor, while 41% (55,000 hectares) is outside the corridor and likely illegal. Note how mining deforestation threatens several protected areas, especially Tambopata National Reserve and Amarakaeri Communal Reserve.
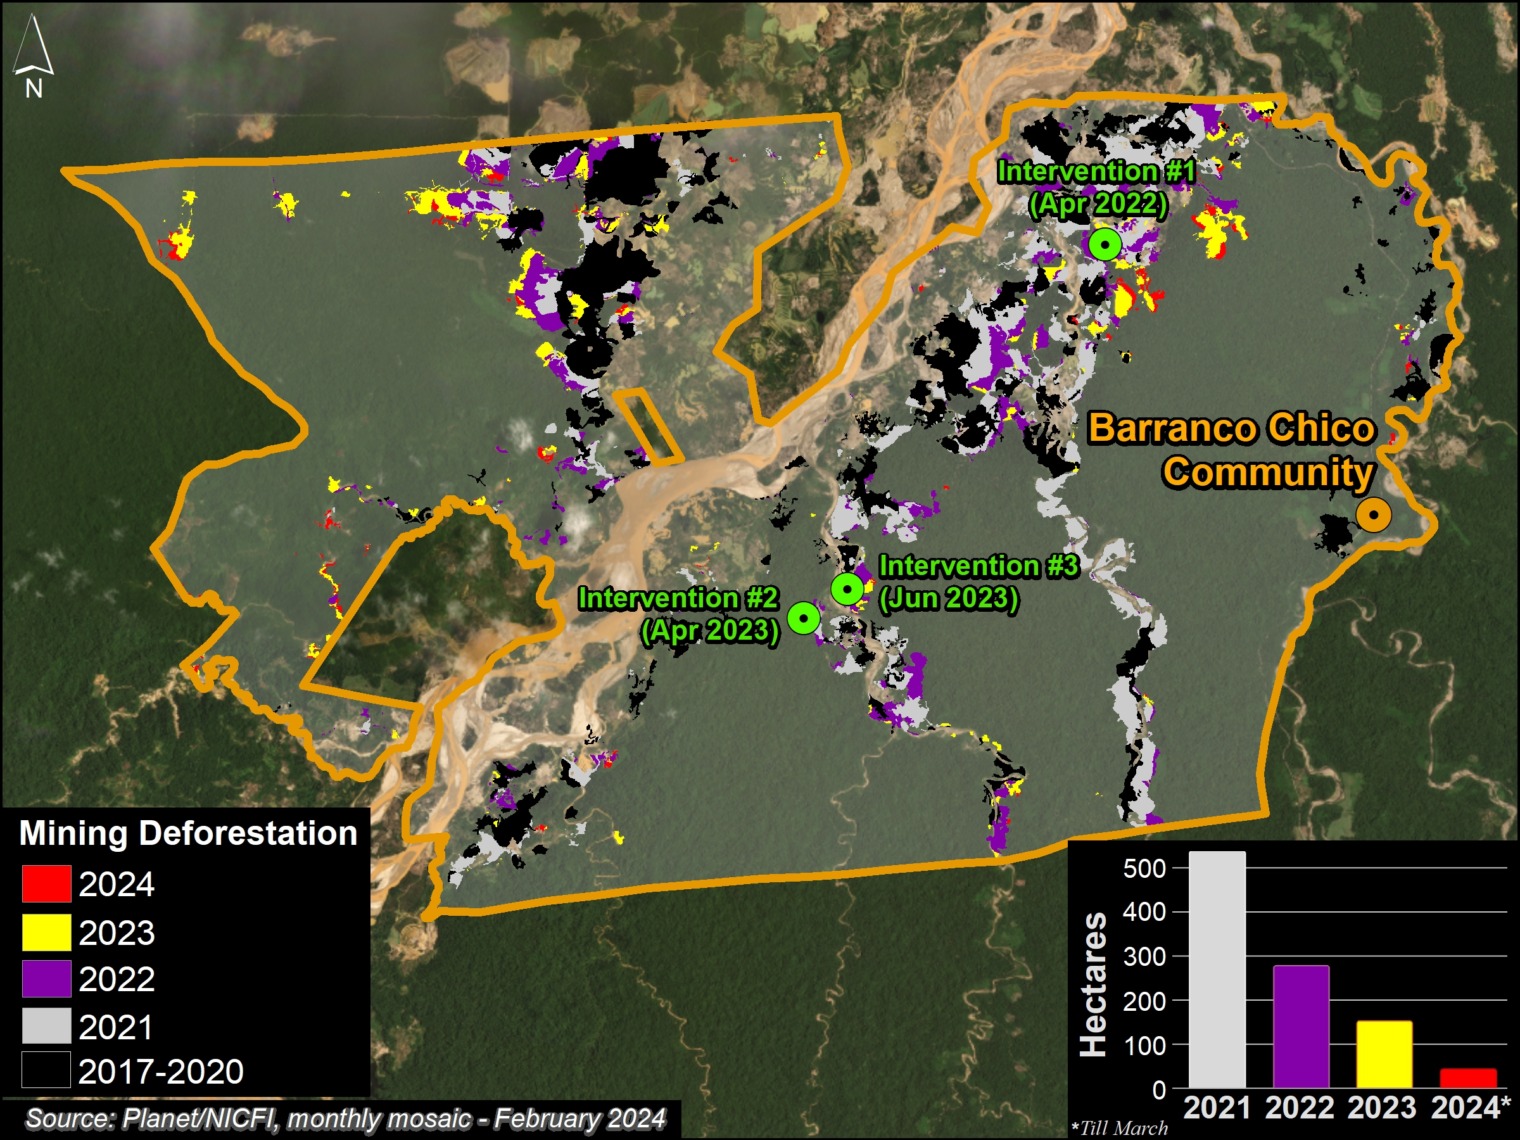
See MAAP #208 for more information about mining deforestation at this site, and how illegal mining also threatens Native Communities.
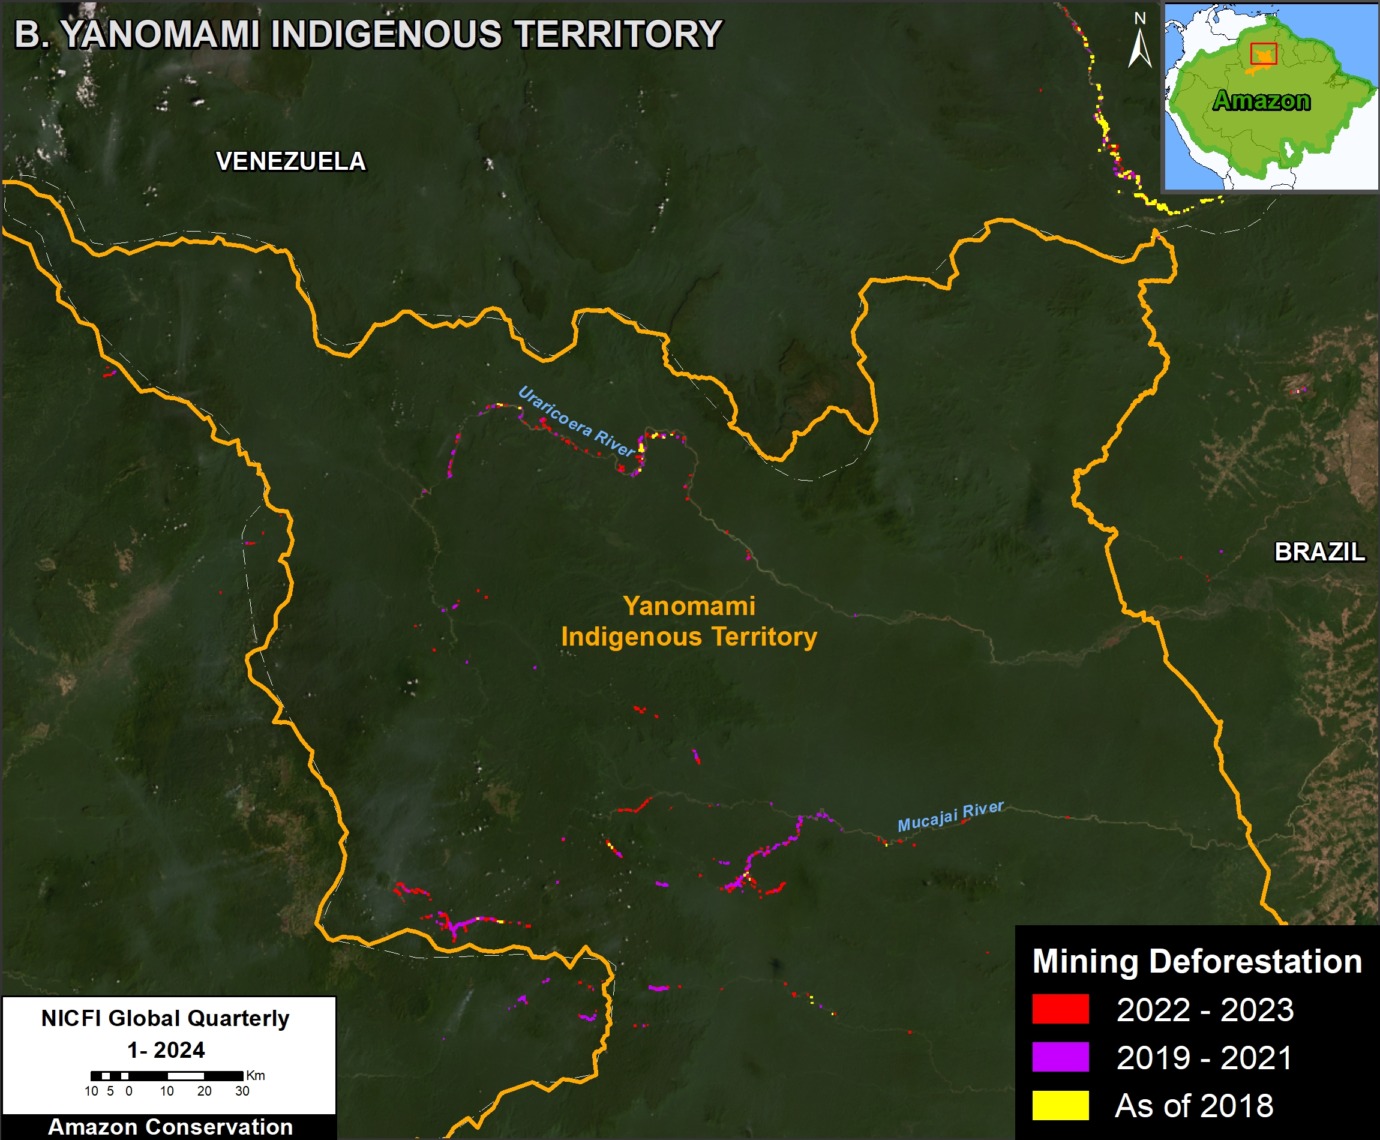
B. Brazilian Amazon – Yanomami Indigenous Territory
In the northern Brazilian Amazon, the national government recently launched a series of raids against illegal gold mining in Yanomami Indigenous Territory (see Inset B in Base Map). Figure 2 shows a major escalation and expansion of gold mining deforestation since 2018, especially along the Uraricoera and Mucajai Rivers.
Specifically, we documented the total mining deforestation of over 19,000 hectares (47,000 acres) in Yanomami Indigenous Territory. It is critical to emphasize that the vast majority (93%) has occurred in just the past five years (2019-2023).
See MAAP #181 for more information about mining deforestation at this site.
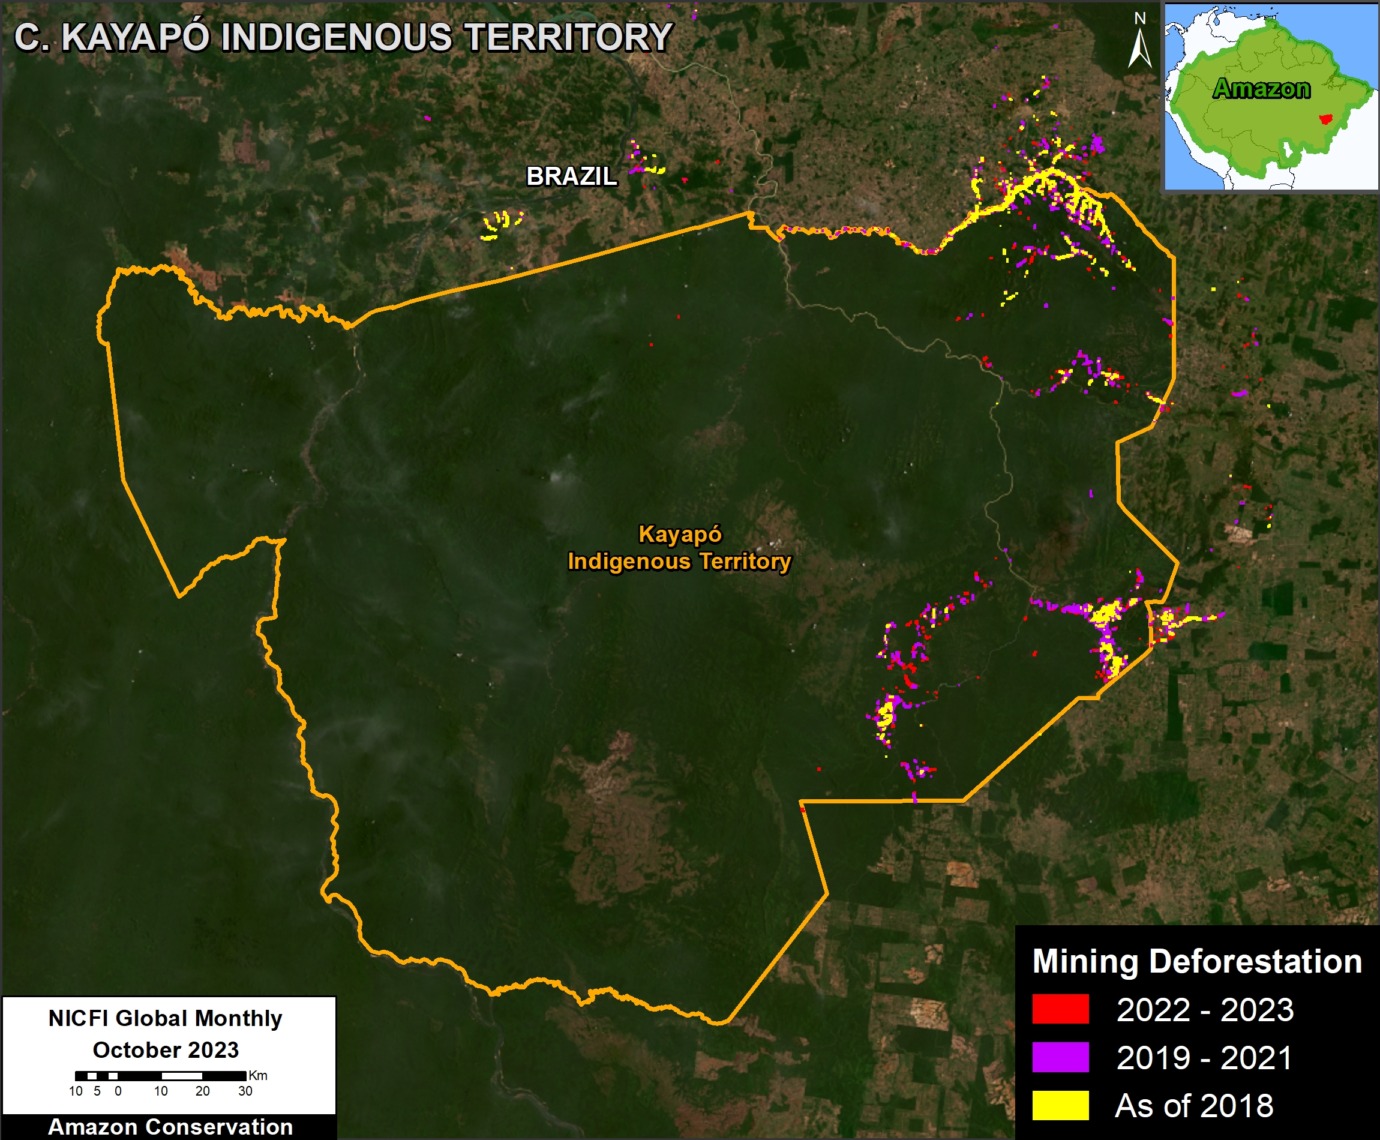
C. Brazilian Amazon – Kayapó Indigenous Territory
In the eastern Brazilian Amazon, the Kayapó Indigenous Territory is also facing ongoing illegal mining (see Inset C in Base Map). Figure 3 shows the continuing expansion of mining deforestation, mostly in the eastern section of the territory.
We documented the total mining deforestation of nearly 50,000 hectares (123,550 acres) in Kayapó Indigenous Territory. Of this total, 60% (30,000 has) has occurred in just the past five years (2019-2023).
See MAAP #116 for more information about mining deforestation at this site, along with nearby Munduruku Indigenous Territory.
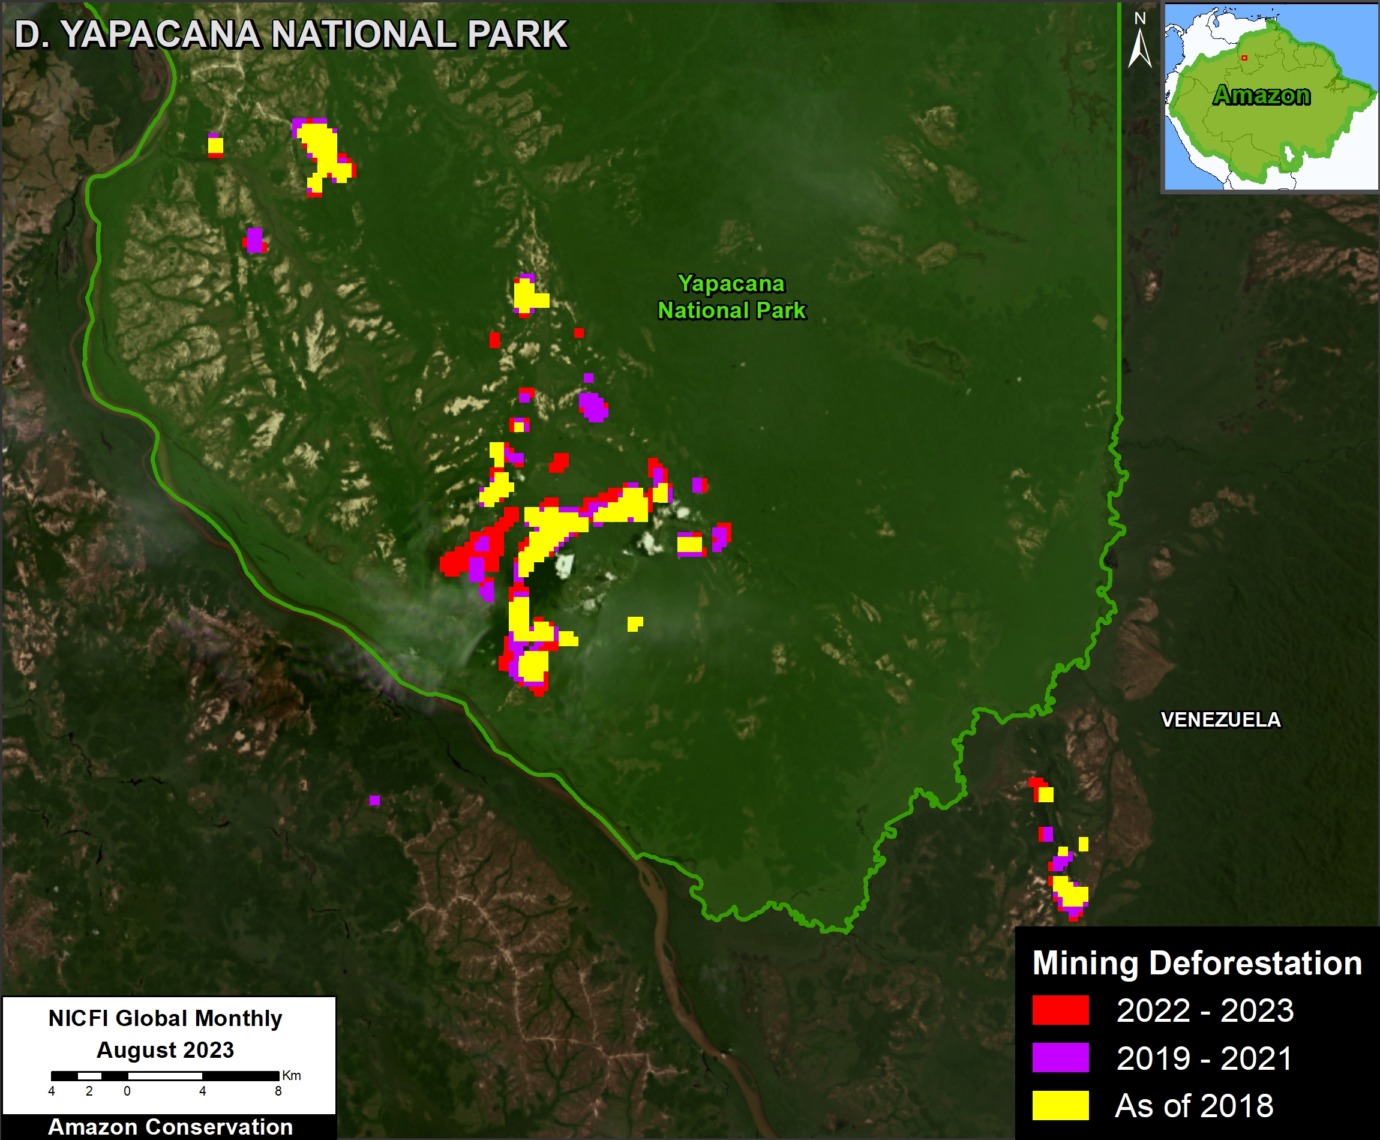
D. Venezuelan Amazon – Yapacana National Park
In Venezuela, we see the continued expansion of mining deforestation in Yapacana National Park (see Inset D in Base Map). Indeed, Figure 4 shows the steady expansion of gold mining deforestation at several sites in the southern section of the protected area.
We documented the total mining deforestation of over 6,000 hectares (14,800 acres) in Yapacana National Park. Of this total, just over half (52%; 3,000 has) has occurred in just the past five years (2019-2023).
See MAAP #173 and MAAP #207 for more information about mining deforestation at this site.
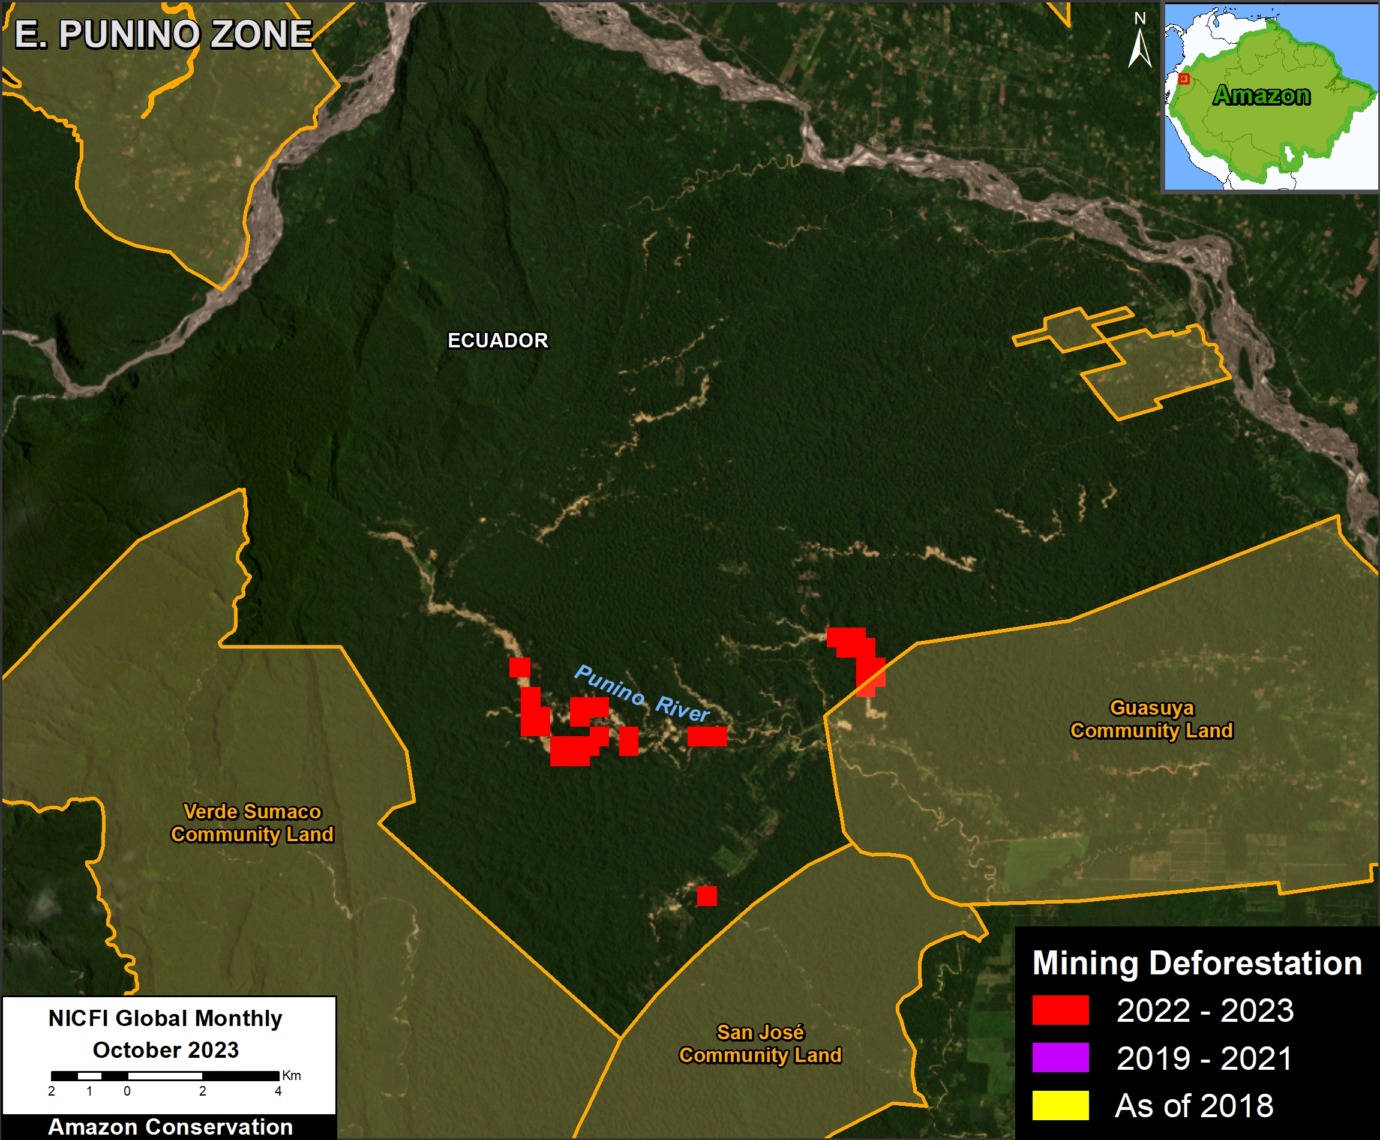
E. Ecuadorian Amazon – Punino River
In a series of reports, we have been showing the rapid increase in mining deforestation in the Ecuadorian Amazon (see MAAP #182). One of the main sites is around the Punino River in northern Ecuador (see Inset E in Base Map). Figure 5 shows the sudden emergence of gold mining deforestation near the river.
We documented the total mining deforestation of over 500 hectares (1,235 acres) in the Punino River area. Of this total, 100% is new, all starting in 2023.
See MAAP #206 for more information about mining deforestation at this site.
Annex
As noted above, of the total accumulated mining deforestation footprint of over 1.9 million hectares (4.7 million acres), about half has occurred in just the past five years.
Methods
All data for this report were obtained from Amazon Mining Watch. We only utilized patches with greater than 0.6 mean score. We used the 2018 data as our baseline. For 2019, we masked the previously reported 2018 data to only highlight the new mining that year. We then repeated this process for each subsequent year. For example, the 2023 data masked the 2018-2022 data, indicating only new mining deforestation that year.
Citation
Finer M, Ariñez A (2024) Machine learning to detect mining deforestation across the Amazon. MAAP: #212.